 Jian Xiao
- Baoding Technical College of Electric Power, Baoding, Hebei, China
The thermal system of waste incineration power generation unit is simple and small in capacity, but the original parameters are few. It needs to calculate the thermal system and derive the parameters by using the conventional heat balance method to obtain the complete thermal system parameters. In this paper, an accurate and perfect thermodynamic model of waste incineration power generation is established to solve the problems of low thermal efficiency and high unit investment cost of the waste incineration power generation. To investigate the internal relationship between the incinerator unit structure, operating parameters, waste calorific value and waste combustion process, optimize the combustion status of different incinerators burning different waste, and realize its stable and efficient operation, it is necessary to study the impact of changing operating parameters and different incinerator structures on the waste incineration process, as well as the incineration law of a single incinerator unit structure burning waste with different calorific value. Based on the two-fluid model of primary oxygen supply and secondary oxygen supply, a newly developed thermodynamic model for waste incineration engineering was developed, and the direct coupling between the reciprocating grate and the incinerator was realized in the software. Using the conventional heat balance method and constant flow calculation, the flow parameters of the thermal system under the design condition are calculated through the design pressure parameters to calculate the power generation and thermal economy index of the condition; and the relevant steam extraction flow is checked and verified. The experimental results show that the net thermal efficiency of waste incineration increases from 19. 73% to 26. 40%, and the energy utilization efficiency also increases by 0. 18%. The net thermal efficiency of the optimized integrated power generation system is always higher than that of the independent power generation system more than 0.16%. The model method used in this paper can reduce the influence of incinerator arch structure on bed combustion to a greater extent, which makes the simulation results close to reality, greatly reduces the calculation cost, and is conducive to the industrial application of simulation in the field of waste incineration.
1 Introduction
Waste incineration power generation, which couples the waste incineration power generation system with other thermal systems with higher thermal parameters, has also become the research focus of improving the energy efficiency of waste incineration power generation. At present, the coupling power generation technology of waste incineration and large coal-fired units will bring significant energy-saving benefits through the joint operation mode. This technology fully combines the technical characteristics of the two power generation modes (Song et al., 2021). On the steam side, the main steam at the outlet of the garbage incinerator is introduced to the thermal system of the coal-fired unit, and the heat of the low-grade garbage incinerator is partially transferred to the high-grade coal-fired unit for power generation, so as to improve the utilization efficiency of the garbage heat; and on the flue gas side, the tail flue gas generated by the garbage incinerator is introduced to the flue gas treatment system of the coal-fired boiler. It will reduce the equipment investment of the flue gas purification system at the outlet of the waste incineration waste heat boiler. In the conventional waste incineration power generation system, the waste generates heat through incineration, and then the flue gas absorbs heat through the heating surfaces of the waste incineration boiler, which drives the steam turbine to do work and drives the generator to generate electricity. At present, the mechanical grate incinerator and liquidized bed boiler are widely used in waste incineration technology. Kozioi (2020) compares the performance, advantages and disadvantages of these two technologies. Due to the more perfect development of mechanical incinerators and more experimental experience, mechanical grate incinerators are widely used in the market. However, the power generation efficiency of the conventional waste incineration generating units is between 20% and 32%, which is far lower than that of large coal-fired generating units. The main reasons for low efficiency are small unit capacity, low steam parameters, imperfect regenerative cycle, etc. Compared with the traditional technology, the coupling technology can increase the thermal efficiency of waste incineration power generation to about 32%, and the efficiency can be increased by 10%, further realizing the existing waste reduction, harmless and low-cost disposal (Bandarra and Quina, 2021).
The quality of the waste entering the incinerator seriously affects the combustion characteristics of the incinerator. If the storage time of the waste is not enough, the moisture content of the waste will be relatively high, especially in the lower part of the waste storage pit. The moisture of the waste in the middle and lower part of the storage pit will be evaporated and gathered in the upper part of the waste. As a result, the garbage in the upper part is more difficult to burn than the garbage at the lower part. Waste slag, waste plastics, sawdust, etc. are sorted out from the garbage by the fuel manufacturing plant. After crushing, drying, pressing and solidification, they are made into harmless solid fuel, namely, RDF fuel (refuse-derived fuel) (Dadario et al., 2021a). Then the RDF fuel is transported to the power plant for RDF power generation. The RDF fuel formed after treatment has a high calorific value. Stable combustion, boiler efficiency, and power generation efficiency can be improved (Khandelwal et al., 2019).
In 2021, Dadario et al. (2021b) discussed the power generation process of a very small power plant (VSPP)-municipal solid waste (MSW) from organic Rankine cycle (ORC) to incinerator. It was found that the temperature and heating rate of hot water were 105.38°C and 240.32 kW, respectively, in a 1,500 L high-pressure cylinder at a processing rate of about 92 kg/h for hot water production and heat storage. The energy efficiency of the incinerator is 31.66% and the energy efficiency is 4.05%. Zhang et al. (2021) tested the flue gas composition and flue gas temperature at the economizer outlet of a 500t/D waste incineration power plant and studied the impact of flue gas re-circulation on the efficiency and NOx emission of the waste heat boiler. The results show that within the test range, the efficiency of the waste heat boiler of the incinerator increases from 80.26% to 80.42% as the flue gas re-circulation rate increases from 0% to 16.43%; Zhou et al. (2019) developed a liquidized bed reactor as an incinerator. But as the number of input variables that need to be considered increases, it becomes quite difficult to optimize the design only by computational fluid dynamics (CFD) simulation because it requires a lot of computing time. Therefore, an artificial neural network (ANN) was used to build a surrogate model of the CFD output to determine the optimal operating conditions.
Waste incineration power generation can not only realize the recovery of waste energy but also reduce the annual waste storage in China. However, the parameters of waste incineration power generation are low, and the thermal efficiency of the corresponding power generation system is low. Therefore, this paper will integrate the waste incineration power generation system into the case coal-fired power generation system with the help of large and efficient coal-fired units. The coupling system is modeled and the parameters of the coupling system are obtained. Through energy analysis, the reason why the power generation efficiency of the new waste incineration system is greatly improved is revealed. To reduce the irreversible loss in the process of primary and secondary air preheating in waste incineration boiler, the furnace temperature is taken as the input of the controller, and the feed grate speed, primary air and secondary air are taken as the output. The research indicates that the control effect of the advanced control algorithm is better. It realizes the efficient utilization of the heat generated by waste incineration, which solves the problem of low efficiency of waste incineration power generation. Then, it considers the variable load operation requirements of coal-fired units, and optimizes an integrated power generation system that adapts to the variable load operation of coal-fired units and has the high thermal economy. At the same time, for coal-fired power plants, the active introduction of a waste incineration systems can also increase their competitiveness and assume certain social responsibilities.
2 Related work
2.1 Thermodynamic model of the existing MSW incinerator
The ESSEN-HIGH model is shown in Figure 1.
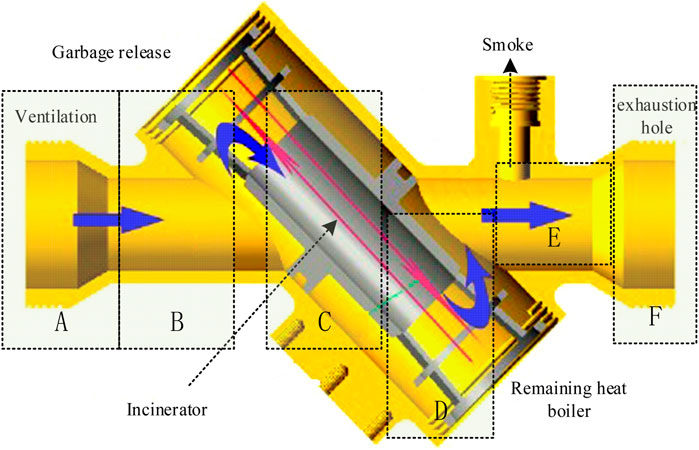
FIGURE 1. The simplified model of Essen-high. The data is from literature (Meena et al., 2019). Functional area model of incinerator.
(1) The physical and chemical characteristics of the three processes of heating, drying, pyrolysis, and charcoal burning on the grate are different, so the graded air distribution should be adopted, and it should be divided into different areas. (2) The burning time of volatile matter is very short, so the uniform combustion and final burnout zone of the bed surface is only in the lower part of the incinerator and waste heat boiler. (3) Since the Martin reciprocating grate is used, the garbage rolls up and down, so it is assumed that the garbage in each area of the grate is heated evenly. (4) In the volatile combustion zone, due to the strong movement of hot flue gas and the interference of secondary air, the zone is considered to be a fully mixed dynamic control reaction zone. The different thermal characteristic zones are described as follows: Zone A: Heated drying zone, where the waste is heated by flue gas radiation, flue gas convection and furnace arch radiation. Area B: garbage pyrolysis area. Garbage in Area A is heated continuously in the above three ways, and volatile components are separated. Zone C: residual carbon combustion zone, and residual carbon in Zone B is gradually burned out at high temperatures. Zone D: volatile combustion zone, where volatile and oxygen are fully mixed, burned evenly, and burned out quickly. Zone E: radiant heat transfer zone, where the flue gas generated by the combustion of volatile matter and carbon residue radiates the water wall tubes of the waste heat boiler.
2.2 Thermodynamic combustion
All fuels are composed of carbon, hydrogen, oxygen, nitrogen, sulfur, ash, and moisture. However, different fuels have different proportions of elements, ash, and moisture. Of these five elements, only carbon and hydrogen can be burned (Themelis and Ma, 2021).
According to the content of carbon and hydrogen in the fuel and the chemical equation of combustion, the amount of dry oxygen supply required for complete combustion of 1 kg of fuel under standard conditions is calculated, that is, the theoretical amount of the dry oxygen supply. Generally, the oxygen supply often contains a certain amount of water vapor, and it is generally assumed that each kilogram of oxygen supply contains 10 g of water vapor to reduce the error (YAN et al., 2021).
Assuming that the oxygen supply humidity is 10 G/kg, the actual mass of humid oxygen supply is:
Where:
The theoretical amount of dry oxygen supply in the furnace is 2. 613 kg/kg, and the actual amount of wet oxygen supply is 4. 261 kg/kg.
The theoretical CO2 volume and the theoretical SO2 volume of the furnace are calculated as shown in Equations 3.18 and 3.19:
Where:
3 Optimization of coupling model for the waste incineration unit
In the traditional coupling system, the heat generated by waste incineration is injected into the coal-fired power generation system for utilization. Therefore, the energy flow process in the original system is quite different from that in the coupling system, as shown in Figure 2.
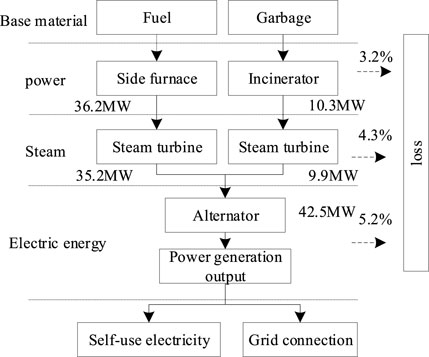
FIGURE 2. Structure of conventional coupling system. The data is from literature (Madejski and Zymelka, 2020).
In the new system and the coupling system, the heat input by the fuel remains unchanged, which is 100%. In the coupling system scheme, the waste incineration boiler transfers 10.5 MW to the coal side for heat utilization, while the coal-fired unit transfers 36.6 MW of heat to the waste incineration system through feed water and condensate water for heating the primary and secondary air. The system structure is shown in Figure 3.
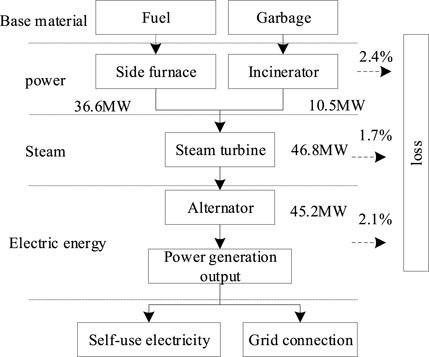
FIGURE 3. Optimized structure of the waste incineration coupling system.
Therefore, from the energy flow process of the original system and the coupling system scheme, it can be concluded that the improvement of the efficiency of waste incineration power generation after coupling is mainly due to the reduction of the system’s total condensation loss.
4 Thermodynamic structure adjustment of the waste incinerator
Optimize the operation of waste incinerator. Study the influence of changing the operation parameters and incinerator structure on the combustion process in the furnace. Simulate and analyze the temperature distribution, flow field distribution, flue gas component distribution, bed solid phase component distribution and pollutant generation and its influence law in the furnace. Figure 4 is a temperature distribution diagram of a central section of a boil with different front and rear arch angles.
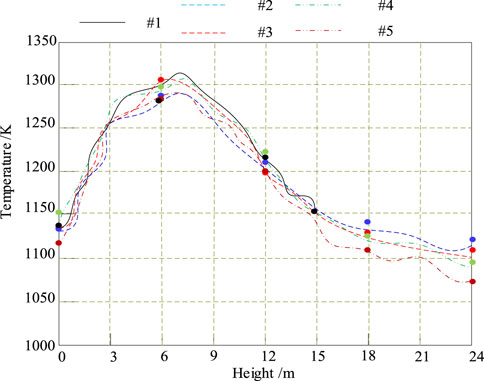
FIGURE 4. Temperature distribution of furnace with different front and rear arch angles. The data is from literature (Zhang et al., 2020).
Gas-phase combustion is mainly concentrated in the middle of the furnace, which is due to the volatilization of solid-phase garbage in the bed layer, which converges with the secondary air of the furnace and is fully mixed for intense combustion. With the heat exchange of the water wall, the flue gas temperature decreases with the increase of the furnace height. With the increase of the front arch angle of the furnace, the combustion condition of the furnace becomes worse, and the outlet temperature of the first flue decreases from 1154 K in # 1–1108 K in # 3. This is due to the increase of the furnace space, the increase of the airflow disturbance, the increase in the heat exchange coefficient between the flue gas and the water wall, and the increase in the heat exchange quantity. The gas back-flow in the front arch of # 1 and # 3 is serious, which is easy to cause the phenomenon of high temperature sticking to the wall. The combustion condition is better when the front and rear arches are 21°/35°.
The boiler velocity vector field is shown in Figure 5.
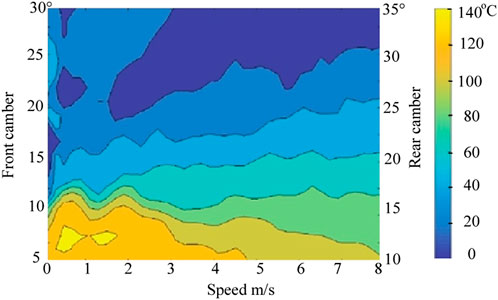
FIGURE 5. Schematic diagram of the boiler velocity vector field. The data is from literature (Chen et al., 2022).
With the decrease of the angle of the front arch, the cyclone expands and the back-flow intensity increases, which increases the convective heat transfer coefficient between the flue gas and the water wall, and has a positive effect on preventing slagging on the convective heating surface and improving the thermal efficiency of the boiler. The back-flow of # 1 is obvious, which also causes the front arch to stick to the wall at high temperatures. The high turbulence intensity of the airflow in the furnace also intensifies the generation of the vortex area in the first flue above. # 2 has a good tangential circle phenomenon of the overfire air, which is conducive to concentrating the combustion area in the center of the furnace and reducing the high-temperature corrosion on the water wall. With the increase of the rear arch angle, the scouring effect of the rear arch secondary air on the grate is reduced. The mixing capacity of the secondary air and the flue gas is improved. The residence time of the flue gas in the furnace is increased and the volatile combustion is more sufficient. Due to the influence of flue gas turbulence at the throat, the tangential effect of over-fire air of # 5 is poor, and it is easy to cause slagging on the convection heating surface (Chen et al., 2020).
The intense combustion zone with complete oxygen consumption appears in the center of the furnace, and the combustion zone is basically in the middle zone. With the increase of the front arch angle, the mass fraction of oxygen at the outlet increases from 7. 1% in # 1 to 7. 8% in # 3. With the supplement of secondary air, the unburned flue gas is completely burned in the first flue, and the oxygen content is increased. With the increase of the back arch angle, the combustion zone is gradually stabilized in the middle of the furnace, and the oxygen content in the furnace is increased. Corresponding to the temperature distribution map, the maximum oxygen mass fraction is 7. 4% when the back arch angle is 21°/35°.
5 Boiler incineration optimization model based on heat balance
According to the heat balance calculation of the incinerator, the calculation process of the flue gas heat output by the boiler is as follows:
Where,
The calculation process of the flue gas heat generated per kilogram of fuel is as follows:
Where:
Determining the temperature of the furnace is a crucial step, since the heat of the flue gas at the outlet is calculated (Ajay et al., 2021).
Through calculation, the theoretical volume of CO2 in the furnace is 0.384 Nm3/kg, and the theoretical volume of SO2 is 0.003 Nm3/kg. The O2 volume, HC1 volume, HC1 mass and SO2 mass of the furnace are calculated as shown in Formula 9-Formula 12:
Where:
Through calculation, the volume of CO2 and HCl in the furnace is 0.213 Nm3/kg and 0.003 Nm3/kg respectively, and the mass of HCl and SO2 is 7 kg/h and 25.231 kg/h respectively.
In this paper, the volume and mass of flue gas at the outlet of the furnace are calculated as shown in Formula 13-Formula 14:
Where:
Through calculation, the outlet flue gas volume and mass are respectively 4.13 m3/kg and 4.842 kg/h.
The summary is shown in Table 1.
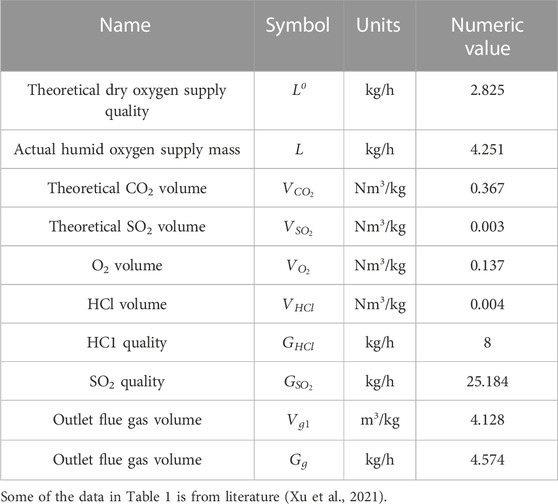
TABLE 1. Characteristics of the furnace flue gas.
The air of the oxygen supply system is extracted from the air-cooled wall and sent to the air chamber at the bottom of the incinerator by the oxygen supply machine to enter the incinerator to meet the needs of waste incineration and cool the grate. Each boiler is supplied with oxygen by one fan, and the air is supplied by three stages of the grates (Tai et al., 2022). The fan is efficiently controlled by the frequency converter. Each section of grate can achieve reasonable air distribution by adjusting the air door according to the actual situation of waste combustion (Su et al., 2020).
The calculation of the volumetric and flow rates of the oxygen supply is shown in Eqs 15–16:
Where:
According to the calculation, the oxygen volume flow is 4,238 Nm3/H, and the primary air flow is 5,378.58 kg/h. The actual flow rate of the oxygen supply is calculated as shown in Eq. 17:
Where:
The actual flow rate of the oxygen supply is 5,278 m3/h. The calculation process of heat brought by the oxygen supply is shown in Formula 18.
Where:
Since the design temperature of the oxygen supply is 60°C, the enthalpy value of the oxygen supply is 78.38 kJ/Nm3 according to the enthalpy temperature table, and the heat brought by the oxygen supply is 31273 kJ/h through calculation.
6 Simulation analysis
6.1 Wind disturbance simulation experiment
In order to verify the correctness of the model, the airflow was used as the disturbance to simulate the influence of the disturbance on the main parameters in the furnace during the waste incineration process.
In the beginning, the air volume entering each section of the grate is 3000 Nm3/h, 5000 Nm3/h, 10000 Nm3/h, 15000 Nm3/h, 20000 Nm3/h respectively, and the total air volume is 63000 Nm3/h. During the experiment, the air volume of each section is increased by 20%. After the increase, the air volume on the grate of each section is 3600NnP/h, 6000NnP/h, 12000 Nm3/h, 15000 Nm3/h, and 24000N m3/h respectively, and the total air volume is 60600 Nm3/h (Li et al., 2020).
(1) Influence of wind variation on oxygen content in flue gas
Figure 6 shows the change in the oxygen content in the flue gas when the air volume is increased.
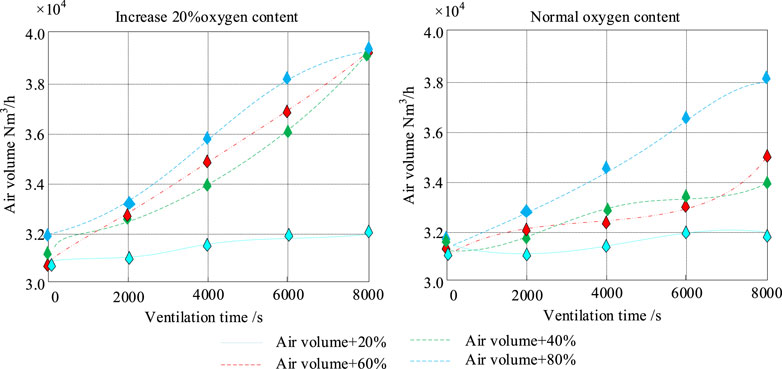
FIGURE 6. Content change of O2 in furnace flue gas when the airflow is increased. Data comes from the MATLAB simulation platform test.
The speed of the grate remains unchanged, and the amount of garbage entering the furnace remains unchanged, so the amount of oxygen consumed by combustion does not change much in theory. However, the increase of air volume will lead to the acceleration of combustion. Thus, in general, the increase in air volume will lead to a small increase in the total consumption of oxygen, but because the air volume increases a lot and its oxygen content is 20%, in general, the proportion of oxygen content in flue gas increases after the combustion is stable (Ramos et al., 2020). At 2400 s, the oxygen content in the flue gas will temporarily decrease. The reason for this phenomenon is that after the air volume in the drying section increases, the evaporation speed of the moisture in the garbage on the grate in this section accelerates, causing the garbage ignition interface to move forward. The amount of burning garbage on the grate increases for a period of time, so the oxygen content in the flue gas decreases. However, because the grate speed remains unchanged, after a period of time, the amount of waste being burned in the furnace is restored to the amount at the beginning. Thus, the oxygen content of the flue gas increases again. There is a delay in the movement of the ignition interface caused by the accelerated evaporation of water in the garbage, so there is a certain delay in the reduction of the oxygen content in the flue gas (Singh, 2019).
(2) Influence of the wind change on CO 2 content in the flue gas
Figure 7 shows the change in the proportion of CO2 in the furnace flue gas when the air volume increases.
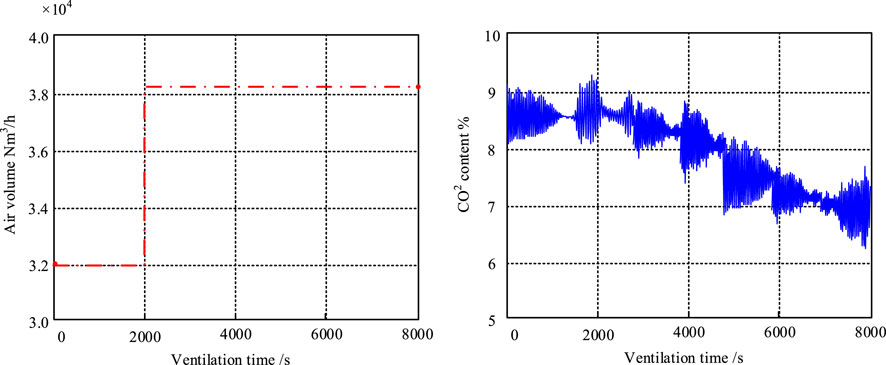
FIGURE 7. Proportion of CO2 in the furnace flue gas when airflow increases. Data comes from the MATLAB simulation platform test.
The amount of fuel on the grate is basically unchanged over a period of time, and the amount of CO2 produced by combustion does not change much in theory. However, the increase of air volume will lead to the acceleration of combustion, so in general, the increase of air volume will increase the amount of CO2 produced by combustion, but because the total air volume increases more, in general, the proportion of CO2 still decreases. It can be seen from Figure 5 that the CO2 content in the flue gas will increase slowly at 2400 s. This is because, after the air volume of the drying section increases, the evaporation rate of water in the waste on the grate accelerates. The waste ignition interface moves forward, and the amount of burning waste increases at the beginning of a period of time, so the CO2 produced by combustion increases accordingly. The accelerated evaporation rate of water in the waste causes a delay in the movement of the ignition interface, so the increase of CO2 content in the flue gas has a certain delay (Zhang et al., 2019).
(3) Influence of air change on the furnace temperature
Figure 8 shows the change in furnace temperature when the air volume increases.
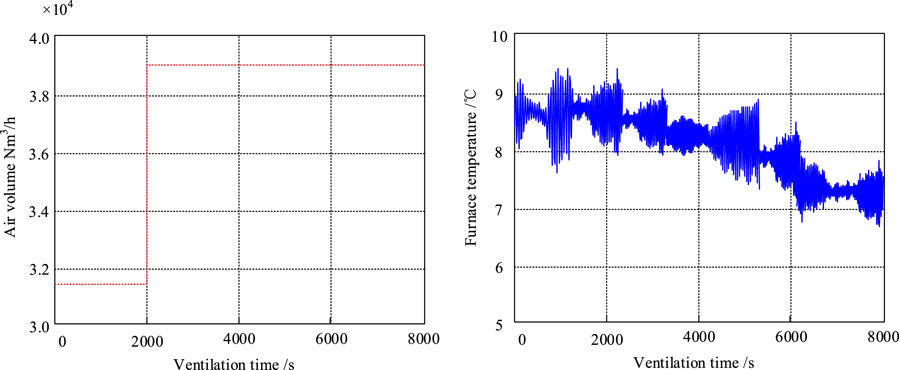
FIGURE 8. Furnace temperature change with the air volume increase. Data comes from the MATLAB simulation platform test.
When the air volume increases, the contact area between oxygen and garbage increases, which will accelerate the combustion speed of garbage and increase the heat released. However, as the wind entering the furnace increases, the flow rate of flue gas in the furnace increases, and the heat taken away from the furnace increases. In general, the increase of airflow leads to a decrease in the total heat in the furnace and the decrease in furnace temperature (Xu et al., 2019). In Figure 8, the furnace temperature decreases after the air volume increases, which is consistent with the theoretical analysis. The furnace temperature will rise to 2400 s, which is due to the increase of air volume in the drying section, the acceleration of garbage drying speed, the forward movement of the ignition interface, and the increase of garbage burning at the same time in the furnace, and the increase of heat generated.
6.2 Simulation experiment of the grate speed disturbance
In order to verify the correctness of the model, the grate speed was used as the disturbance to simulate the influence of disturbance on the main parameters in the furnace during the waste incineration process.
At the beginning, the grate speeds from drying I to burn-out are 2.2 mm/s, 2 mm/s, 1.6 mm/s, and 1.4 mm/s. The great speed is increased by 0.3 mm/s, and then it is increased to 2.5 mm/s, 2.3 mm/s, 1.9 mm/s and 1.7 mm/s (Eboh et al., 2019).
(1) Effect of the grate speed change on the oxygen content in flue gas
Figure 9 shows the change of O2 content in the furnace flue gas when the grate speed is increased.
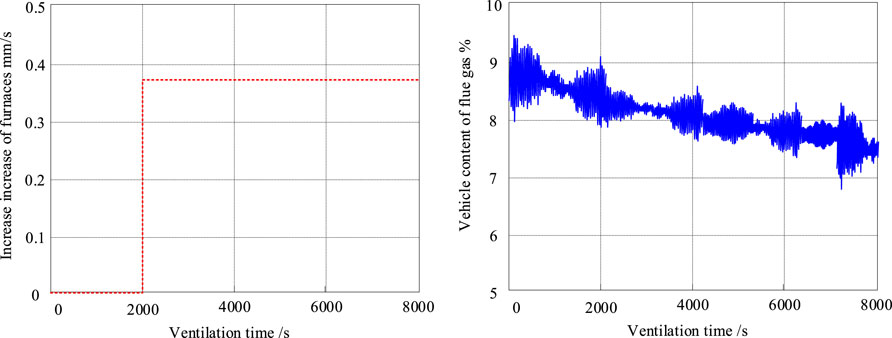
FIGURE 9. Content change of O2 in furnace flue gas when the grate speed is increased. Data is from the MATLAB simulation platform test.
When the grate speed increases, more fuel enters the furnace with the grate, the oxygen consumed by combustion increases, and the oxygen content in the furnace gradually decreases. With the continuous movement of the grate, the amount of garbage entering the furnace is gradually stable, and the oxygen content gradually tends to be balanced.
(2) Effect of the grate speed on CO 2 content in flue gas
Figure 10 shows the change of CO2 content in the furnace flue gas when the grate speed is increased.
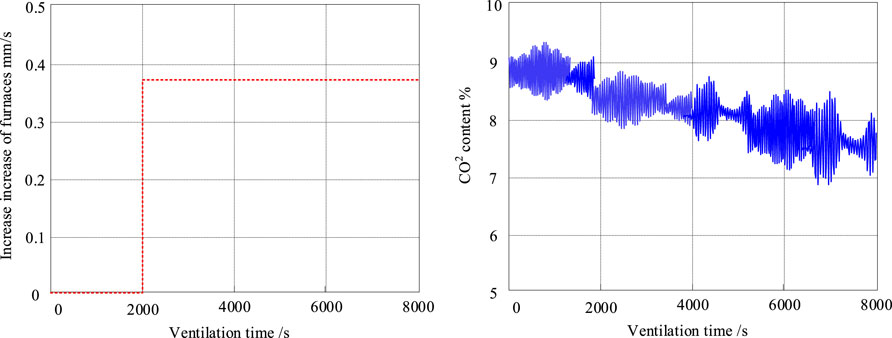
FIGURE 10. CO2 content in furnace flue gas when the grate speed is increased. Data is from the MATLAB simulation platform test.
When the grate speed increases, more fuel enters the furnace with the grate, and the amount of CO2 produced by combustion increases, so the CO2 content in the flue gas increases. With the continuous movement of the grate, the amount of waste entering the furnace is gradually stable, and the content of CO2 generated by the waste combustion gradually reaches a new balance.
(3) Influence of the grate speed change on the furnace temperature
Figure 11 is the change in furnace temperature when the grate speed is increased.
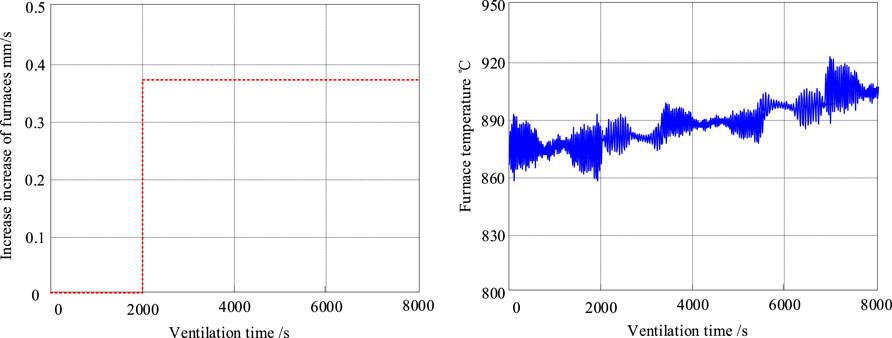
FIGURE 11. Furnace temperature when the grate speed increases. Data comes from the MATLAB simulation platform test.
Figure 11 shows the change in furnace temperature as the grate speed is increased. When the grate speed increases, the amount of waste entering the furnace will gradually increase, the heat released by combustion will increase accordingly, and the furnace temperature will rise.
7 Discussion
When the amount of waste entering the furnace is gradually stabilized, the temperature will gradually stabilize. With the increase of sludge blending amount, the nitrogen content, NO, HCN, and NH3 in the volatile matter of solid phase combustion on the grate increase significantly, in which the flow of HCN and N in the fuel increases significantly, while NO and NH3 increase slowly. The C and H elements in the volatile matter decrease, the N and O elements increase, and the combustible components decrease. The lower calorific value of the overall waste is reduced, the amount of oxygen required for combustion is reduced, the air distribution is reduced, and the flow of flue gas is reduced. The combustion process is delayed, the combustion interval moves along the direction of the grate, the combustion interval corresponding to the highest temperature is shortened, and the overall combustion temperature is reduced.
According to the waste treatment strategy and the basic operation strategy of multi-generation, the waste incineration operation strategy is formulated and connected with MATLAB to realize the hourly simulation operation of waste incineration. The operation performance of waste power generation under different strategies is compared.
By analyzing the operation results of garbage power generation, it can be seen from the operation economy and thermal economy that the garbage incineration operation strategy in this paper is the best. When the unit price of energy consumed is less than 3,650 yuan/kg, the economy of garbage power generation operation is better, and when it is more than 4,000 yuan/kg, the economy of operation is better. In terms of emission reduction, the overall load of operation under the basic strategy is too large. The capability of emission reduction is weak. Compared with other multi-generation garbage power generation, the data shows that the proposed multi-generation garbage power generation has greater thermal efficiency and energy-saving potential than other multi-generation ones.
Comparing the traditional co-generation, the cooling, heating, and power loads generated by the multi-cogeneration integrated energy garbage power generation are converted into standard coal in proportion. This paper studies the advantages of thermal efficiency and energy saving rate compared with traditional co-generation. The results indicate that the energy-saving rate of garbage power generation under the strategy is 18.96%. The power generation scheme of the waste incineration model based on the heat balance method designed in this paper has greater energy-saving potential and emission reduction capacity than the traditional energy supply mode.
8 Conclusion
In this paper, the waste incineration power generation unit is modeled by using the heat balance method. The main parameters of the waste incineration system and the parameters of the thermal system are calculated, and the integrated power generation system adapted to the variable operation condition of the waste incineration unit is optimized and calculated. The main research contents are as follows:
(1) It establishes a physical model, a mathematical model and a reaction rate model of the waste incinerator and couples the models into a control equation.
(2) A two-dimensional simulation method for the combustion process of the incinerator at the lower part of the waste incinerator is developed. The calculation of the incinerator’s combustion process is split into a two-dimensional structure.
(3) Transient calculation of the incinerator area and three-dimensional steady-state calculation of the area above the garbage bed are done.
According to the experimental analysis, with the decrease of the grate speed, the position of the beginning and completion of the volatile separation and coke combustion will move forward, and the rate will increase. When the grate speed is 15 m/h, the MSW burns stably on the grate and the gas-phase combustion is more complete. With the increase of the air distribution of the grate, the moisture drying rate is accelerated, and the volatile matter release rate and the fixed carbon burning rate are increased. The garbage burns stably with a low burn-off rate. With the increase in wind ratio, the combustion area moves forward, the oxygen consumption area moves forward, the flue gas flows well, the combustion is sufficient, and the pollutant emission is low. It is proved that the energy coupling optimization of the integrated power generation system of the waste incineration boiler and the coal-fired unit proposed in this paper is suitable for the variable load operation requirements of the waste incineration power plant and has the high thermal economy.
Energy loss such as pipeline loss is not considered in the simulation of the waste incineration power plant system. If the energy loss can be further considered in the follow-up study of the system, the accuracy of the system model can be improved.
Data availability statement
The original contributions presented in the study are included in the article/Supplementary Material, further inquiries can be directed to the corresponding author.
Author contributions
The author-JX contributes to the drafting, writing, data, revision of the manuscript. The author confirms being the sole contributor of this work and has approved it for publication.
Conflict of interest
The authors declare that the research was conducted in the absence of any commercial or financial relationships that could be construed as a potential conflict of interest.
Publisher’s note
All claims expressed in this article are solely those of the authors and do not necessarily represent those of their affiliated organizations, or those of the publisher, the editors and the reviewers. Any product that may be evaluated in this article, or claim that may be made by its manufacturer, is not guaranteed or endorsed by the publisher.
References
Ajay, C. M., Mohan, S., and Dinesha, P. (2021). Decentralized energy from portable biogas digesters using domestic kitchen waste: A review. Waste Manag. 125, 10–26. doi:10.1016/j.wasman.2021.02.031
Bandarra, B. S., and Quina, M. J. (2021). “Municipal solid waste incineration and sustainable development[M],” in Advances in sustainable energy (Cham: Springer), 653–680.
Chen, S., Huang, J., Xiao, T., Gao, J., Bai, J., Luo, W., et al. (2020). Carbon emissions under different domestic waste treatment modes induced by garbage classification: Case study in pilot communities in Shanghai, China. Sci. Total Environ. 717, 137193. doi:10.1016/j.scitotenv.2020.137193
Chen, Z., Yang, J., Chen, L., and Jiao, H. (2022). Garbage classification system based on improved ShuffleNet V2. [J]. Resour. Conservation Recycl. 178, 106090. doi:10.1016/j.resconrec.2021.106090
Dadario, N., Neto, M. M., Bernardo, C. H. C5, Bernardo, R., Almeida Gabriel Filho, L. R., Cremasco, C. P., et al. (2021). Waste-to-energy technology for the brazilian context: A review article [J]. Int. J. Innovation Educ. Res. 9 (9), 427–448. doi:10.31686/ijier.vol9.iss9.3367
Dadario, N., Neto, M. M., Bernardo, C. H., Bernardo, R., Almeida Gabriel Filho, L. R., Cremasco, C. P., et al. (2021). C3 et al. Waste-To energy technology for the Brazilian context: A review article. Intemational Joimmal Innovation Educ. Res. 9 (9), 427–448. doi:10.31686/ijier.vol9.iss9.3367
Eboh, F. C., Andersson, B., and Richards, T. (2019). Economic evaluation of improvements in a waste-to-energy combined heat and power plant. Waste Manag. 100, 75–83. doi:10.1016/j.wasman.2019.09.008
Khandelwal, H., Dhar, H., ThaliaK, A., and Kumar, S. (2019). Application of life cycle assessment in municipal solid waste management: A worldwide critical review. J. Clean. Prod. 209, 630–654. doi:10.1016/j.jclepro.2018.10.233
Kozioi, M. (2020). The effect of the ratio of excess air and the process time on CO and NOx emissions from the combustion of alternative fUel in a grate fUmace[C]. E3S Web Conf. 154, 03003. EDP Sciences. doi:10.1051/e3sconf/202015403003
Li, Y., Liu, Y., Zhang, G., and Yang, Y. (2020). Thermodynamic analysis of a novel combined cooling and power system utilizing liquefied natural gas (LNG) cryogenic energy and low-temperature waste heat. Energy 199, 117479. doi:10.1016/j.energy.2020.117479
Madejski, P., and Zymelka, P. (2020). Calculation methods of steam boiler operation factors under varying operating conditions with the use of computational thermodynamic modeling[J]. Energy 197, 1–12.
Meena, M. D., Yadav, R. K., Naijary, B., Yadav, G., Jat, H., Sheoran, P., et al. (2019). Municipal solid waste (MSW): Strategies to improve salt affected soil sustainability: A review. Waste Manag. 84, 38–53. doi:10.1016/j.wasman.2018.11.020
Ramos, A., Berzosa, J., Espf, J., Clarens, F., and Rouboa, A. (2020). Life cycle costing for plasma gasification of municipal solid waste: A socio-economic approach. Energy Convers. Manag. 209, 112508. doi:10.1016/j.enconman.2020.112508
Singh, K. (2019). Influence of mixed-use neighborhood developments on the performance of waste-to-energy CHP plant Influence of mixed-use neighborhood developments on the performance of waste-to-energy CHP plant[J]. Energy 189, 116172. doi:10.1016/j.energy.2019.116172
Song, W., Gao, Y., Bashir, S., and Liu, L. J. (2021). “Postface: Conclusion on renewable energy strategies for a sustainable future: Part A: Role of energy storage[M],” in Advances in sustainable energy (Cham: Springer), 839–846.
Su, H., Zhou, X., Zheng, R., Zhou, Z., Zhang, Y., Zhu, G., et al. (2020). Hydrothermal carbonization of food waste after oil extraction pre-treatment: Study on hydrochar fuel characteristics, combustion behavior, and removal behavior of sodium and potassium. Sci. Total Environ. 754, 142192. doi:10.1016/j.scitotenv.2020.142192
Tai, C., Tian, G., and Lei, W. (2022). A water-heat combined supply system based on waste heat from a coastal nuclear power plant in northern China. Appl. Therm. Eng. 200, 117684. doi:10.1016/j.applthermaleng.2021.117684
Themelis, N. J., and Ma, W. (2021). Waste to energy (WTE) in China: From latecomer to front runner. Waste Dispos. Sustain. Energy 3, 267–274. doi:10.1007/s42768-021-00086-9
Xia, Z. H., ShanChen, P. C. X., Du, H., Huang, J., and Bai, L. (2020). A two-fluid model simulation of an industrial moving grate waste incinerator. Waste Manag. 104, 183–191. doi:10.1016/j.wasman.2020.01.016
Xu, H., Lin, W. Y., Dal Magro, F., Li, T., Py, X., and Romagnoli, A. (2019). Towards higher energy efficiency in future waste-to-energy plants with novel latent heat storage-based thermal buffer system. Renew. Sustain. Energy Rev. 112, 324–337. doi:10.1016/j.rser.2019.05.009
Xu, J., Luo, E., and Hochgreb, S. (2021). A thermoacoustic combined cooling, heating, and power (CCHP) system for waste heat and LNG cold energy recovery. Energy 227, 120341. doi:10.1016/j.energy.2021.120341
Yan, M., Antoni, , Wang, J. Y., Hantoko, D., and Kanchanatip, E. (2021). Numerical investigation of MSW combustion influenced by air preheating in a full-scale moving grate incinerator. Fuel 285, 119193. doi:10.1016/j.fuel.2020.119193
Zhang, H., Yu, S., He, P., and Shao, L. (2019). Estimating source strengths of HC1 and SO2 emissions in the flue gas from waste incineration[J]. J. Environ. Sci. 75, 370–377. doi:10.1016/j.jes.2018.05.019
Zhang, L., Hu, Y., Cai, L., and Kung, C. C. (2021). A review of economic and environmental consequences from waste-based power generation: Evidence from Taiwan. Energy Explor. Exploitation 39 (2), 571–589. doi:10.1177/0144598719900283
Zhang, Y., Du, X., Yue, M., Yan, M., and Shi, Y. (2020). Heat transfer and ash deposition performance of heat exchange surface in waste incineration flue gas[J]. Int. J. Heat Mass Transf. 155, 1–13.
Keywords: waste incineration, generating unit, thermal system, heat balance method, incineration optimization model
Citation: Xiao J (2023) Analysis and research on the thermal system of waste incineration power generation unit based on heat balance method. Front. Energy Res. 11:1129620. doi: 10.3389/fenrg.2023.1129620
Received: 22 December 2022; Accepted: 27 April 2023;
Published: 10 May 2023.
Edited by:
Maissa Farhat, American University of Ras Al Khaimah, United Arab EmiratesReviewed by:
Ehsan Houshfar, University of Tehran, IranTanakorn Wongwuttanasatian, Khon Kaen University, Thailand
Copyright © 2023 Xiao. This is an open-access article distributed under the terms of the Creative Commons Attribution License (CC BY). The use, distribution or reproduction in other forums is permitted, provided the original author(s) and the copyright owner(s) are credited and that the original publication in this journal is cited, in accordance with accepted academic practice. No use, distribution or reproduction is permitted which does not comply with these terms.
*Correspondence: Jian Xiao, eGlhb2ppYW5sdWNreTIwMjJAMTI2LmNvbQ==