 Tanja Goričanec
 Bor Kos1†
 Klemen Ambrožič
 Luka Snoj
 Marjan Kromar
- 1Reactor Physics Department, Jožef Stefan Institute, Ljubljana, Slovenia
- 2Faculty of Mathematics and Physics, University of Ljubljana, Ljubljana, Slovenia
- 3Faculty of Energy Technology, University of Maribor, Maribor, Slovenia
In a typical pressurized water reactor, neutron detectors located outside the reactor core monitor reactor power. In addition, they are also used to measure the reactivity of the control rods. A novel approach to calculate the ex-core neutron detector response in a typical pressurized water reactor using the Monte Carlo technique is presented. A detailed ex-core model of the Krško nuclear power plant was developed using the Monte Carlo neutron transport code MCNP. Due to the location of the ex-core neutron detectors, the hybrid code ADVANTG is used to generate variance reduction parameters to accelerte the convergence of the results outside the reactor core. To use ADVANTG, the fixed neutron source had to be reconstructed from the criticality core calculation. This paper presents the sensitivity analysis of the response of the ex-core detectors to the neutron data libraries used, the description of the fixed neutron source and the ADVANTG parameters. It was found that a pin-wise description of the neutron source for at least two rows of fuel assemblies at the core periphery is necessary for accurate results. Our results show the importance of a correct description of the prompt neutron spectra in the high energy region and the impact this has on the response of the ex-core detectors. The method in which the prompt neutron fission spectra for important fission nuclides are weighted by the calculated reaction rates has been shown to be the best approximation, with deviations from the reference calculation within statistical uncertainty. The effect of nuclear data libraries on the response of the ex-core detector was investigated, and the difference between the ENDF/B-VII.0 and the ENDF/B-VIII.0 nuclear data libraries was ∼11%. When the deficient evaluation of the 56Fe isotope included in the ENDF/B-VIII.0 nuclear data library was replaced by the improved evaluation from the IAEA INDEN project, the differences decreased to ∼3.7%. In addition, neutron flux redistributions due to control rod movement were investigated and flux redistribution factors were updated using Monte Carlo particle transport methods. The reaction rate redistribution factors obtained with methods presented in this paper are within 1% agreement with the currently used factors.
1 Introduction
To enable safe and continuous operation of a nuclear power plant (NPP), it is important to accurately control reactor power and reactivity. In a typical pressurized water reactor (PWR), reactor power is monitored with neutron detectors located outside the reactor core, while reactivity is controlled by boric acid dissolved in the moderator, control rods, and burnable absorbers. The control rod reactivity worth is a safety related physical parameter and can be determined by calculations and measurements. It can be measured by different methods: boron dilution method, rod insertion method, rod swap method, etc. The rod insertion method (Trkov et al., 1995; Merljak et al., 2018) was developed at the Reactor Physics Department of the Jožef Stefan Institute. It is based on the analysis of the power signal recorded with the ex-core neutron detectors during the continuous insertion of a control rod bank. The main advantage is the high execution speed (about 15 min per control rod bank) in contrast to the boron dilution method in a commercial PWR, which takes about 4 h. During the insertion of a control rod bank, the spatial distribution of the neutron population is changed (Kaiba et al., 2015; Goričanec et al., 2018). Since the detector measures the local neutron flux at the ex-core location, a correction should be applied to obtain a corrected response and a correct determination of the control rod reactivity worth. To account for radial and axial redistributions, neutron flux redistribution factors are introduced as a function of the axial position of the control rod bank. References (Zheng et al., 2017; Zheng et al., 2016) present an improvement of control rod reactivity measurement using the calculated Monte Carlo detector response function. They demonstrate the advantages of using Monte Carlo codes for the ex-core detector response compared to deterministic particle transport methods, mainly due to the elimination of ray effect and the ability to accurately model 3D geometry. The results seem to be promising and further encourage us to update the neutron flux redistribution factors for the rod insertion method at the Slovenian PWR. The neutron flux redistribution factors currently used at the Krško NPP were obtained using a single adjoint flux distribution calculation for the first operational cycle (Kromar et al., 2015). The calculation was performed using the deterministic 2D code DOT (Rhoades et al., 1979) and therefore could not accurately describe the geometry. The first operational cycle, unlike subsequent cycles, had fresh fuel at the periphery of the core, resulting in about 30% higher neutron leakage out of the core. It should be noted that these factors are about 30 years old and were determined with old nuclear data libraries and used rough energy discretization. In this paper, we present a significant improvement in the calculation of neutron flux redistribution factors by using a Monte Carlo particle transport method instead of a deterministic 2D code. The state-of-the-art Monte Carlo N-Particle transport code (MCNP 6.1.1) (Goorley et al., 2013) enabled continuous energy treatment and the use of new nuclear data libraries. A detailed MCNP model of a typical pressurized water reactor, which includes a detailed model of the reactor core, pressure vessel, and surrounding structures, was developed with the objective of calculating the response of the detectors outside the core and the neutron flux redistribution factors. Since the neutron detectors are located outside the reactor core, far from the neutron source, their response is difficult to calculate using analog stochastic methods. The neutron flux decreases by several orders of magnitude before it reaches the detector. With the analog Monte Carlo method, it is practically impossible to achieve suitable statistics within a reasonable computer time. Different approaches for accelerating the convergence of ex-core results in Monte Carlo calculations can be used (Pecchia et al., 2017; Zheng et al., 2017; Zheng et al., 2016; Pan and Wang, 2021; Qing-Quan Pan et al., 2021). In this work, the hybrid code ADVANTG (Mosher et al., 2015) was used to accelerate the convergence of the response of the ex-core detector, instead of the MCNP variance reduction technique (Liu and Gardner, 1997; Hendricks and Culbertson, 2000; Pantelias Garcés, 2013). The ADVANTG code can only generate weight windows for fixed source problems and cannot be used for eigenvalue calculation. Therefore, a conversion from criticality to fixed source calculation had to be performed (Ambrožič et al., 2017).
This paper is structured as follows. In Section 2 the Krško NPP is presented with the description of ex-core detectors and control rods. In Section 3, the calculation procedure is presented with a detailed description of the individual steps used to determine the response of the ex-core detectors. In Section 4 the sensitivity analysis of ex-core detector response is presented. Section 5 summarizes the results of control rod worth and the neutron flux redistribution factors. Section 6 presents the verification and simplification of developed method to the results obtained by using the adjoint neutron flux distribution.
2 Krško nuclear power plant
The Krško NPP1 was studied as a typical representative of a two loop pressurized water reactor. It is a Westinghouse design plant and currently, the thermal rating is 1994 MWt with 727 MWe gross electric production. The core consists of 121 fuel assemblies (see Figure 1A). Fuel assembly has a 16 × 16 lattice filled with 235 fuel rods, 20 guides for control rods and 1 guide for in-core instrumentation as presented in Figure 1B. Integral Fuel Burnable Absorber rods (IFBA) are added to some fuel assemblies to enable long-term reactivity control. Six different IFBA patterns are typically used, one of which with 32 IFBA rods is shown in Figure 1B.
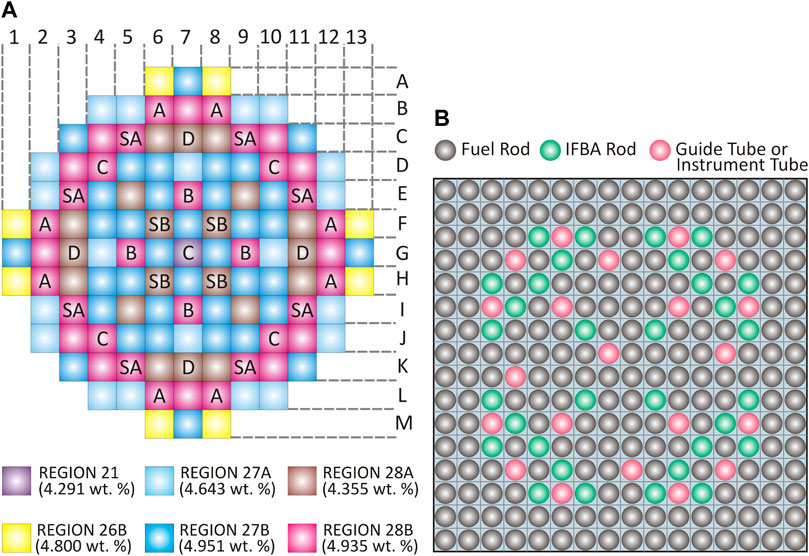
FIGURE 1. Schematic view of Krško nuclear power plant core and fuel assembly configuration. (A) Core configuration for cycle 28 with marked fuel regions in different color and control rod cluster postions. (B) Schematic drawing of fuel assembly with 32 IFBA rods.
In a typical PWR, such as the Krško NPP, the ex-core detector system monitors neutron flux from shutdown to 120% of full power. This corresponds to neutron flux variations from 10–1 to 1011 n/(cm2 s). To cover such a large flux range, three types of neutron detectors are used: BF3 counter (source range - SR), compensated ionization chamber (intermediate range - IR) and uncompensated ionization chamber (power range - PR). The ex-core detectors are located in wells, which are located in the cavity wall. A schematic diagram of the positioning of the ex-core detectors can be observed in Figure 2. The power range detectors, which are currently used during rod insertion method are positioned in four evenly spaced locations around the core (locations 45°, 135°, 225° and 315°). There are 4 power range channels with 2 vertical detectors per channel.
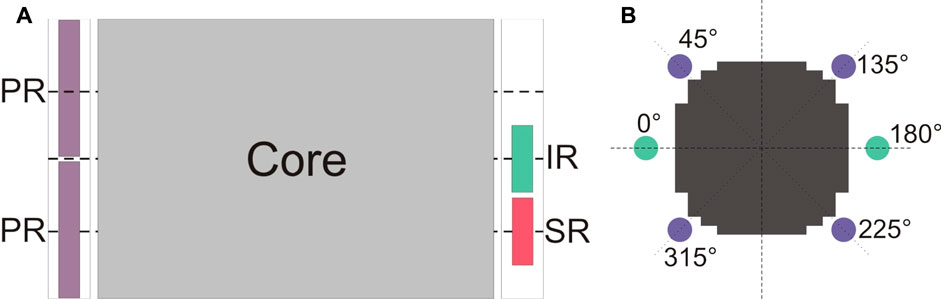
FIGURE 2. Schematic view of ex-core detector locations. Source range (SR) detectors are presented in green, intermediate range (IR) detectors in red and power range (PR) detectors in purple. (A) Axial positioning of ex-core detectors. (B) Azimuthal positioning of ex-core detectors.
Inside the reactor core are 33 rod cluster control assemblies (RCCAs), as shown in Figure 1. An RCCA consists of 20 individual Ag-In-Cd absorber rods attached to a common spider assembly at the top. To enable safe operation of the nuclear reactor, it is important to know the exact value of the reactivity of the control rods. A newer method, called the rod insertion method (Trkov et al., 1995; Merljak et al., 2018) was developed in the Jožef Stefan Institute (JSI) Reactor Physics Department. It is based on the analysis of the reactor signal, measured by the ex-core power range neutron detectors, which is recorded during the continuous insertion of the control rod bank. During the insertion of the RCCA, the spatial distribution of the neutron population is changed (Kaiba et al., 2015; Goričanec et al., 2018). Since the detector measures the local neutron flux at the detector site, this can lead to a non-linear indication of the reactor power. To account for these redistributions, neutron flux redistribution factors are introduced as a function of RCCA axial position.
3 Computational procedure
The computational procedure developed to obtain the response of the ex-core detector in a typical PWR NPP is shown schematically in Figure 3. First, the initial (or beginning of cycle) values for fuel isotopic composition, temperature distributions and boron concentration are used as the input parameters for the deterministic nuclear core design code package CORD-2 (Kromar and Trkov, 2009). The CORD-2 program package is used to obtain the fuel temperature, water temperature, water density, fuel isotopic composition due to the burn-up, burnable absorber layer (IFBA) and boron concentration for each fuel assembly in 10 axial layers for multiple burn-up steps. In the next step, a subroutine McCord (Štancar et al., 2016) is used to generate the full core input for the state-of-the-art Monte Carlo N-Particle transport code (MCNP) (Goorley et al., 2013) from the CORD-2 output data. A detailed description of the computational procedure to obtain the MCNP core model was described in previous research (Goričanec et al., 2018). The MCNP core input can be used to analyse the power and neutron flux distribution within the reactor core and study the redistribution due to the control rod movement. The developed core model was previously verified and validated by comparison to the thoroughly validated code package CORD-2 and with measurements from the in-core detectors (Goričanec et al., 2021). The MCNP core input is used to calculate the neutron source for the MCNP ex-core model. The MCNP ex-core model includes the ex-core structures, such as: the reactor vessel, the ex-core neutron detectors, and all surrounding concrete structures. Variance reduction parameters for neutron transport are generated with the hybrid code ADVANTG (Mosher et al., 2015) and used in the MCNP simulation to study the response of the ex-core neutron detectors.
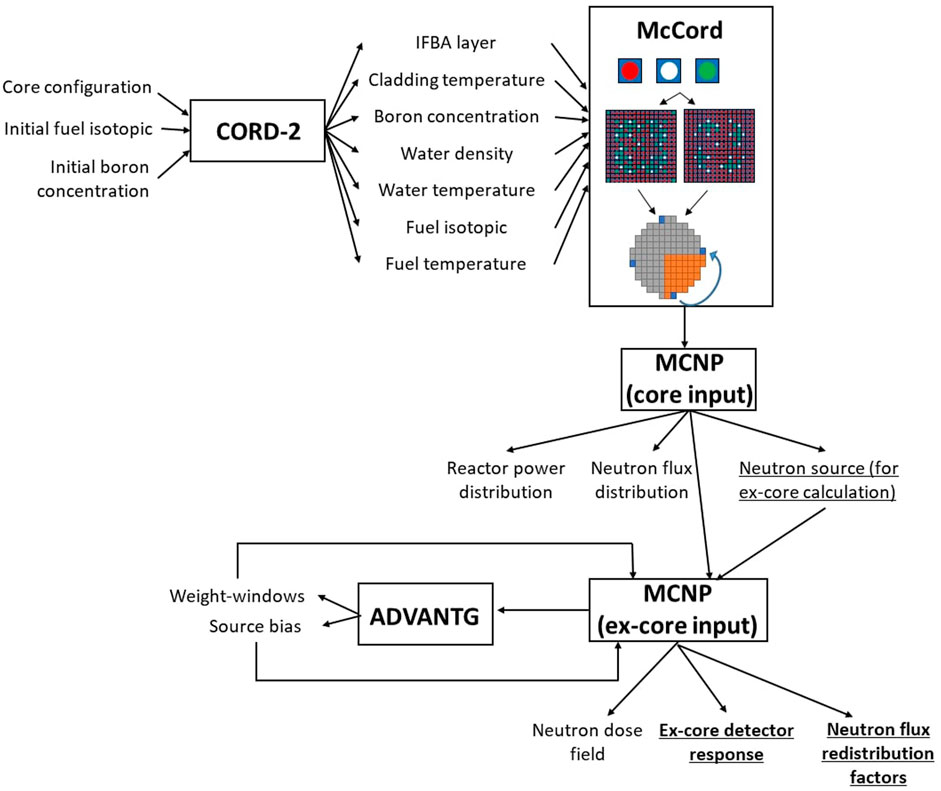
FIGURE 3. Calculation procedure scheme to obtain ex-core detector response.
3.1 Neutron source generation
The hybrid code ADVANTG, used to generate variance reduction parameters to accelerate convergence of the responses of interest outside the reactor core, cannot be used for eigenvalue problems. To be able to use ADVANTG code, the core criticality calculation had to be translated into the fixed source model (Ambrožič et al., 2017).
The first part of this study focuses on the description of the geometry of the fixed source, which was stimulated by the results presented in (Pecchia et al., 2017), where it was found that the last two fuel assembly rows at the core periphery contribute up to ∼99.7% to the ex-core detector response. However, the need for a detailed geometry description of the fixed source depends strongly on the evaluated quantity, so, for example, in (Pantelias Garcés, 2013) the fixed neutron source was described with a homogeneous cylinder inside the active core region. To investigate the effects of the neutron source geometry on the response of the ex-core neutron detectors, different fission neutron sources were studied and are presented in Figure 4. The fission neutron generation rate used to describe the fixed source was calculated with an eigenvalue calculation per fuel pin in 24 uniformly distributed axial layers. In a first step, a simplified model of a fixed source was investigated (Source A). Source A consisted of homogenized cuboids at the scale of a fuel assembly. The second source investigated was a mixed source consisting of homogenized cylinders at the scale of a fuel assembly for inner fuel assemblies and pin-wise cylinders for 2 FA rows at the core periphery (Source B). The third source examined was a detailed source in which the entire core was described with fuel pin scale cylinders (Source C). The prompt fission neutron spectrum used to describe Sources A–C was modeled using the Watt spectrum approximation:
where the following constants were used for fission on 235U: a = 0.965 MeV and b = 2.29 MeV−1 (Cranberg et al., 1956). The sensitivity analysis for the geometry of the fixed neutron source is presented in Section 4.2.1.
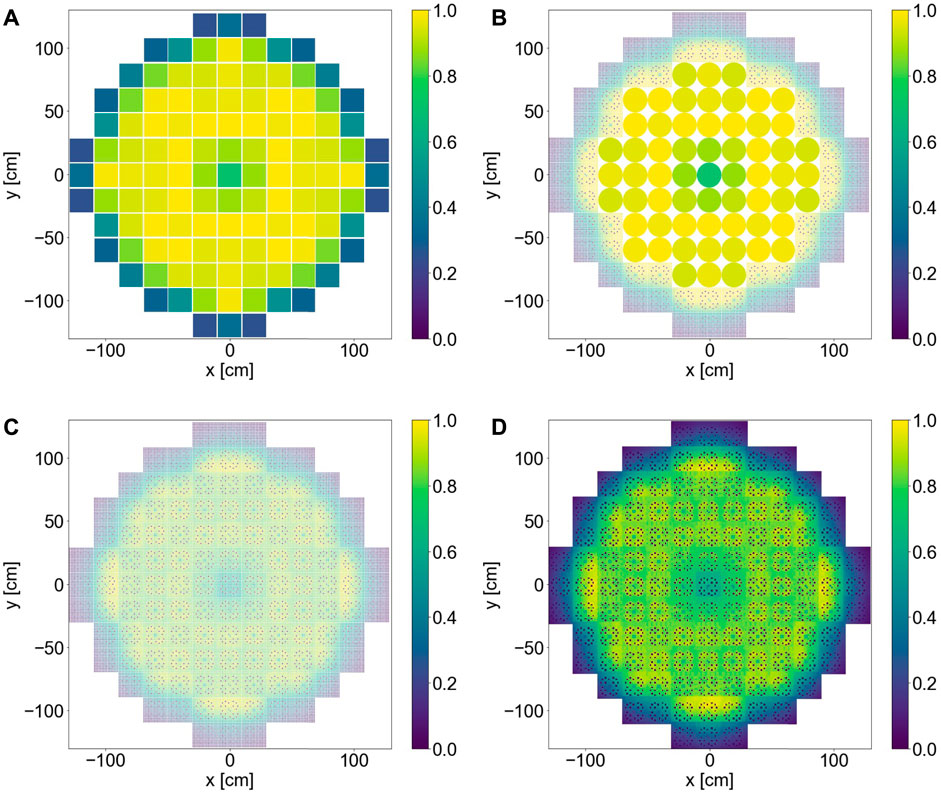
FIGURE 4. Different neutron sources normalized to the maximum value. Fission neutron source strength is presented in colors, ranging from high values in yellow to low values in blue. (A) Homogenized cuboids on FA scale (Source A). (B) Homogenized cylinders on FA scale for inner FAs and pin-wise cylinders for 2 FA rows at core periphery (Source B). (C) Cylinders on pin-wise scale (Source C). (D) Neutron source from criticality calculation.
The second part of this study examined the prompt fission neutron spectra used in the fixed source description. The first method involved the calculation of the prompt fission neutron spectrum by sampling the fission neutron generation rate within the core, the fission neutron energies and the positions. In this method, the fission neutrons were divided into energy bins used to describe bin-wise neutron spectra (ENDF/B-VIII.0: Source D, ENDF/B-VII.0: Source E). In the second method, the Watt fission spectrum was fitted to the energy distribution of the first method (ENDF/B-VIII.0: Source F, ENDF/B-VII.0: Source G). The third method for describing the prompt fission spectrum involved combining the point-wise prompt fission spectra of 235U (Trkov et al., 2020), 239Pu (Trkov et al., 2020), 238U (Brown et al., 2018), and 241Pu (Brown et al., 2018), weighted by the calculated fission reaction rates multiplied by the fission neutron yields
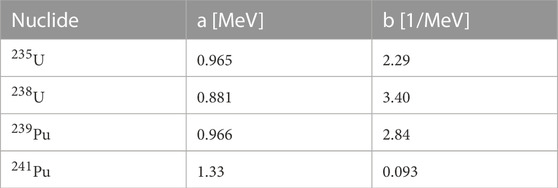
TABLE 1. Nuclide Watt energy spectra constants (Davidson et al., 2021) used for prompt fission neutron spectrum description for Source J and K.
3.2 Ex-core calculation
The detailed geometric and material MCNP model of the reactor core was integrated into the previously developed MCNP containment building model (Kos et al., 2016) shown in Figure 5A. Explicitly modeled ex-core neutron detectors were included in the model as cylinders (see Figures 5B, C). Within the active detector region, reaction rates and neutron flux were calculated to estimate the detector signal. The ex-core calculation was used to study the response of the ex-core neutron detectors, their sensitivity to various parameters (e.g., the nuclear data library), and the neutron flux redistribution factors due to the control rod movement. The ex-core calculations were performed using MCNP version 6.1.1 (Goorley et al., 2013). The neutron flux drops by several orders of magnitude before reaching the ex-core detectors. To obtain suitable statistics in reasonable computer time, a variance reduction technique must be used. In (Pantelias Garcés, 2013) different variance reduction techniques were analysed in the ex-core calculations of the Swiss PWR. It was found that the hybrid codes [e.g., ADVANTG (Mosher et al., 2015)] are a better choice compared to the direct Monte Carlo variance reduction techniques (geometry splitting and the Weight-Window Generator) (Liu and Gardner, 1997; Hendricks and Culbertson, 2000). It was also found that for the calculation of the response of multiple detectors in different positions FW-CADIS method (Wagner et al., 2007) is optimal. Therefore, for the work presented in this paper, the ADVANTG code version 3.2.1 (Mosher et al., 2015) was used, to speed up the convergence of the response of the ex-core neutron detectors using weight windows and source bias. The weight windows technique is used to optimise all power range channels (with 2 detectors per channel - top and bottom). Weight windows were generated using multigroup nuclear data library bplus with included upscattering and FW-CADIS methodology (Mosher et al., 2015) and were covering the reactor core and the ex-core neutron detectors. Default values were used for other solver options. To ensure that the final results were valid and converged, the statistical tests were checked in the MCNP output file. Sensitivity analysis for various ADVANTG parameters is presented in Section 4.3.
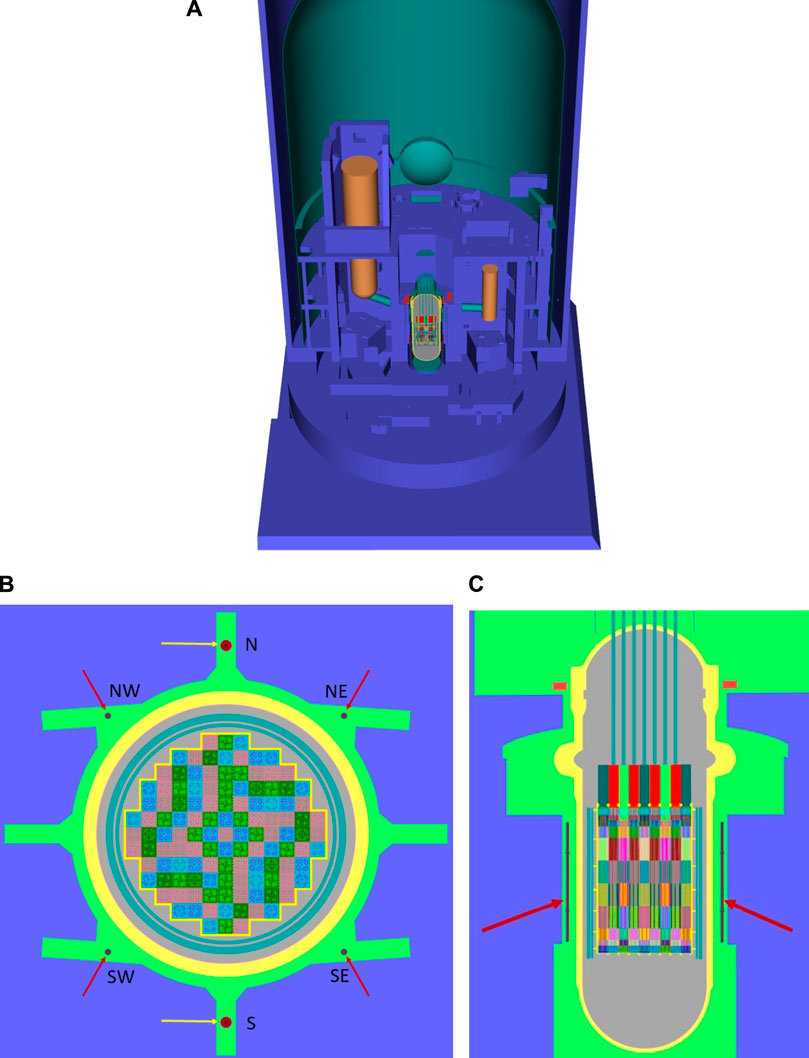
FIGURE 5. Schematic view of computational MCNP containment building model with ex-core power range detector locations. Detector locations are marked with red arrows. Figures were generated with Radiant utility within the ADVANTG used for rendering images of MCNP geometry models in a 3-D perspective (Mosher et al., 2015). (A) Containment building view. (B) xy close view. (C) Side close view.
4 Sensitivity analysis
A detailed sensitivity analysis was performed to determine the optimal computational parameters (e.g., nuclear data library, fixed source geometry, and ADVANTG parameters). The power range ex-core detector response was calculated by taking the average over all PR detectors (4 channels with 2 vertical detector per channel). The detector response was calculated by sampling 10B (n,α) reaction rate within the active detector volume. The results were normalized to the nominal reactor power (P) of 2 GW, taking into account the scaling factor (C) as (Žerovnik et al., 2014):
where
For the ex-core calculation a speed up factor, which is determined as a ratio of the Figure-of-merit values (FOM) as:
For the variance reduction-assisted and analog calculation, was determined to be ∼30,000, excluding the time required for the ADVANTG calculation, which was approximately 1 h. ΔR represents the relative statistical error and T is the simulation time.
Computations were performed on a computer cluster with 2 processors (Intel® Xeon® Gold 6240R Processor), each processor with 24 physical cores/48 hyper-threading. The analog eigenvalue calculation ran for 1,296 h to achieve 1 σ a statistical uncertainty of 1.25% in the detector response, while the fixed source calculation using weight windows ran for 4 h and achieved a 1 σ statistical uncertainty of 0.13% in the detector response.
In Figure 6 adjoint neutron flux and contributon field (Williams, 1991) are presented. Contributon field is multiplied forward and adjoint angular flux distributions and represents the importance of a particle in the phase space to contribute to the detector response. Taking into account results from both sub-figures in Figure 6 it can be concluded that accurate modelling of neutron source at the core periphery is very important for accurate absolute ex-core results.
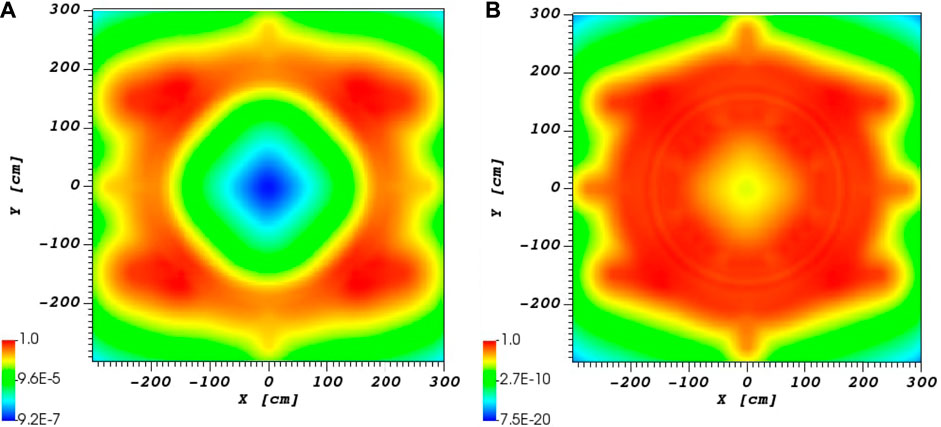
FIGURE 6. Results of the adjoint calculation using the ADVANTG code. Values are presented in colors in logarithmic scale, ranging from low values in blue to high values in red. Presented is axial slice approximately in the middle of active fuel height, normalized to the maximum value. (A) Adjoint neutron flux. (B) Contributon field distribution.
4.1 Sensitivity to nuclear data libraries
4.1.1 Effect of nuclear data libraries on core calculation
The first step in the calculation process was the criticality core calculation. To observe the deviations in criticality core calculations between different nuclear data libraries, the deviation in multiplication factor and reactor power distributions per fuel assembly were compared. Calculations were performed using the ENDF/B-VII.0 (Chadwick et al., 2006) and the ENDF/B-VIII.0 (Brown et al., 2018) nuclear data libraries. The calculated multiplication factors were: keff (ENDF/B-VII.0) = 0.99598 and keff (ENDF/B-VIII.0) = 0.99777, with a 1 σ statistical uncertainty
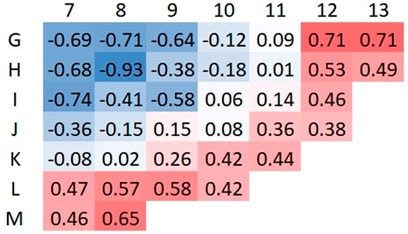
FIGURE 7. Relative difference in power distribution per fuel assembly between ENDF/B-VII.0 and ENDF/B-VIII.0 in %.
The criticality core calculation was also used to obtain the fixed neutron source to be used in the ex-core calculations. Different fixed neutron source geometries and prompt fission neutron spectrum description were studied Section 4.2.
4.1.2 Effect of nuclear data libraries on ex-core calculation
With the release of a new version of the ENDF nuclear data library (ENDF/B-VIII.0), we also wanted to review the impact on ex-core calculations in a typical PWR. In the first part of the study, we evaluated the effects on neutron transport, and in the Section 4.2.2, we examined the effects on the neutron source. Table 2 lists the discrepancies between different nuclear data libraries used for neutron transport calculated using the analog criticality calculation. For the comparison, the nuclide cross section evaluations were changed from the ENDF/B-VII.0 to the ENDF/B-VIII.0 evaluation. A high deviation of ∼12% and ∼11% was observed in the calculated total neutron flux and 10B (n,α) reaction rate, respectively. The deviation decreased to ∼6% and ∼3.7% for the total neutron flux and 10B (n,α) reaction rate, respectively, when the evaluation for the 56Fe isotope was replaced with the improved one from the IAEA INDEN project (Network, 2017). The effect of replacing the mentioned isotope evaluation had negligible impact on the core calculation.
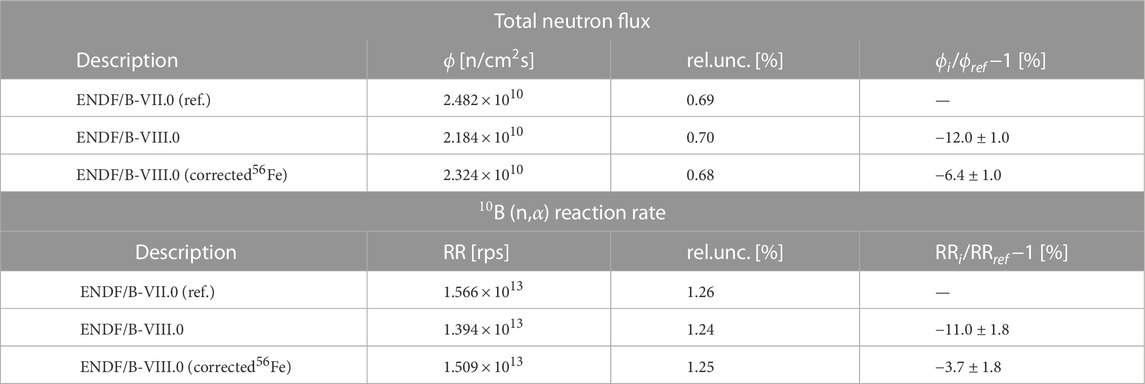
TABLE 2. Calculated absolute neutron flux at ex-core power range detector location, normalized to the full reactor power of 2 GW, for different nuclear data libraries used for neutron transport.
4.2 Sensitivity to fixed source description
Two main effects of the descripton of the fixed neutron source on the response of the ex-core neutron detectors have been studied: the geometry of the source and the description of the prompt fission neutron spectrum.
4.2.1 Sensitivity to fixed source geometry
The accuracy of various fixed sources has been tested. These discrepancies are a measure of the error due to the fixed source approximation that replaces long running criticality calculations, referred as the reference calculation. The 1 σ statistical uncertainty of the criticality calculation was 1.25%, while the 1 σ statistical uncertainty of the fixed source calculations with weight windows was
4.2.2 Sensitivity to fixed source prompt fission neutron spectra
The first method used to generate prompt fission neutron spectrum to describe fixed source is based on tracking the neutrons generated from fission and dividing them into 394 energy bins up to 30 MeV. Figure 8 shows the comparison of the point-wise (Source D and E) and the fitted Watt function to the point-wise prompt fission neutron spectrum (Source F and G) using different nuclear data libraries. Our goal is to predict the response of the ex-core neutron detectors and the majority of neutrons escaping from the reactor core are fast (with energies above 100 keV). Therefore, a good description of the prompt fission spectrum above 100 keV is of great importance. The threshold of 100 keV for defining fast neutrons is chosen arbitrarily since below this energy the slowing-down effects are judged to be more important than the virgin neutrons from fission. Fuel assembly K11 (see Figure 1) was chosen for comparison because it is closest to the ex-core neutron detectors and therefore contributes most to their response. It can be seen from Figures 8A, B that the fitted Watt distribution cannot adequately describe the spectrum for high energies in all cases. Increasing the importance of the high energies when performing the Watt fit could lead to a biased solution and was therefore not performed. Another disadvantage of such a calculation is the time-consuming processing of large data files.
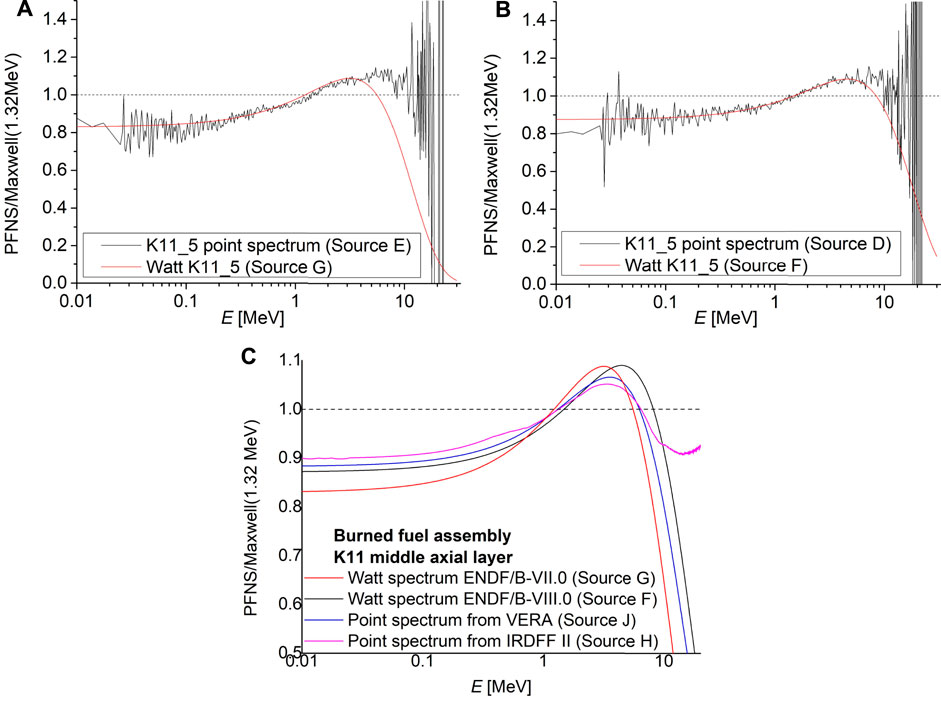
FIGURE 8. Prompt fission neutron spectra relative to the 1.32 MeV Maxwell spectra for burned fuel assembly K11 (middle axial layer) at the core periphery. (A) ENDF/B-VII.0—point-wise values (black) and with fitted Watt spectrum (red). (B) ENDF/B-VIII.0—point-wise values (black) and with fitted Watt spectrum (red). (C) Comparison of different spectrum representations.
The next method for describing the prompt fission spectrum (PFNS) involved combining point-wise prompt fission spectra of important isotopes (PFNSi) normalized to the integral of 1, weighted by the calculated fission reaction rates (FRi) multiplied by the fission neutron yields
where I refers to the normalization to the integral of 1. In the calculation of prompt fission neutron spectra (PFNSi) and fission reaction rates (FRi) 2 energy groups (below and above 100 keV) for fission neutrons were considered. Fission reaction rate calculations were performed for individual fuel assemblies in 10 axial layers (Source H and Source I). Prompt fission neutron spectra of important isotopes (PFNSi) were taken from ENDF/B-VIII.0 (Brown et al., 2018) and IRDFF-II (Trkov et al., 2020) nuclear data libraries.
In the last method, the calculated fission reaction rates from the previous method were used to weight the Watt fission spectra for each isotope, with the constants used for the Watt spectrum taken from the Reference (Davidson et al., 2021) (Source J and Source K).
In the next step, the prompt fission neutron spectra obtained by different methods were compared for a typical fuel assembly K11 representing burned fuel at the core periphery for the middle axial layer. The obtained prompt fission spectra are shown in Figure 8C, where the discrepancies between the different methods can be seen. It can be concluded that the deviations between the different methods are not negligible, but no conclusion about a superior method can be drawn at this stage. To find the best method for describing the prompt fission neutron spectrum, the total neutron flux and the 10B(n,α) reaction rate at ex-core power range detector location were investigated. For reference, an analog eigenvalue calculation of the response of the ex-core neutron detector was performed. The results are summarized in Table 3, where the differences between the analog calculations using different versions of the ENDF/B nuclear data library are more than 6% and 3% for the total neutron flux and the 10B(n,α) reaction rate, respectively. It can be observed, that in case of ENDF/B-VIII.0 nuclear data library results favour method of mixing PFNS of important isotopes (Source H), while ENDF/B-VII.0 results show better agreement for point-wise description by tracking the origin and energies of the fission neutrons (Source D). Therefore, it is difficult to say which method is better. Due to the use of the newer ENDF/B-VIII.0 nuclear data library in ex-core calculations as the default nuclear data library and taking into account the disadvantage of the large data files and the difficulty of automating the first method, it was decided to use the method of mixing prompt fission neutron spectra of important isotopes (Source H) in further calculations.
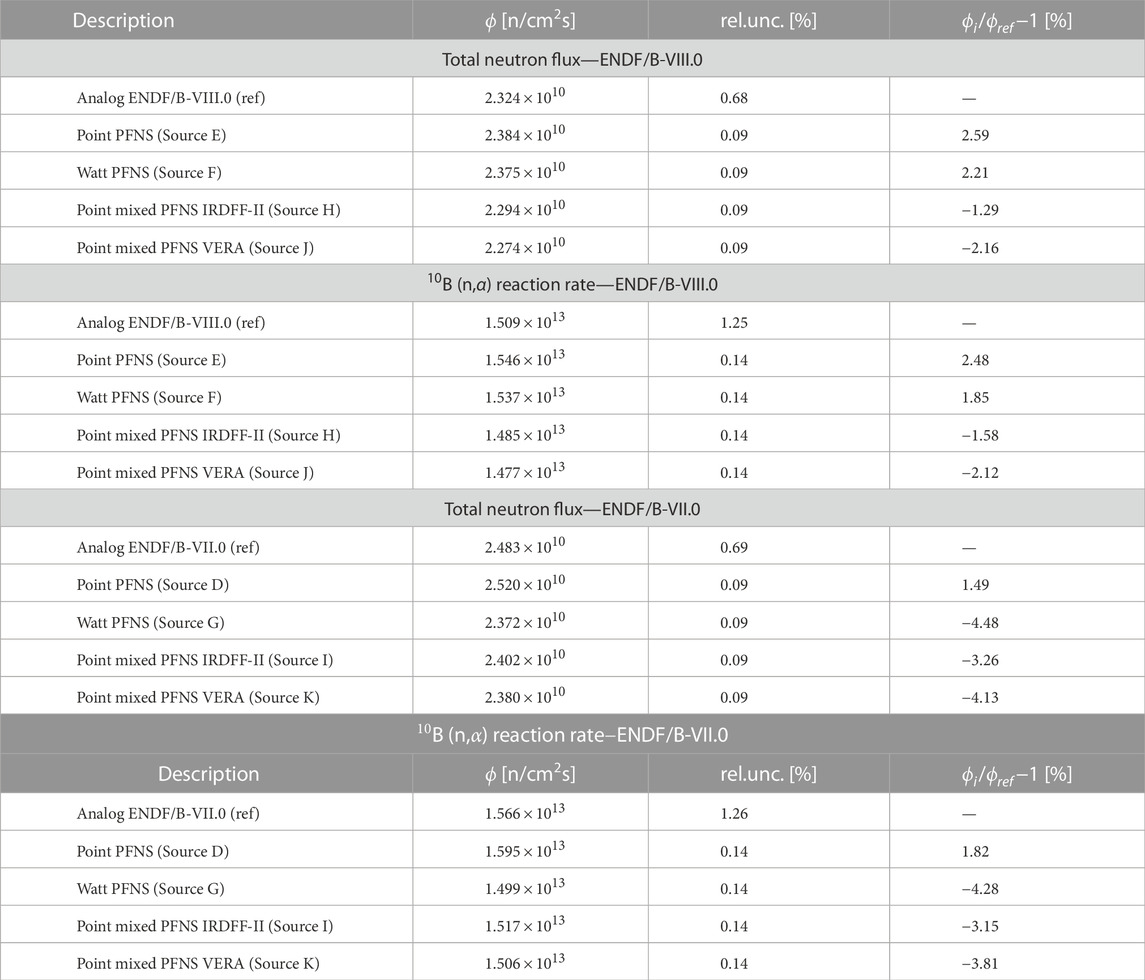
TABLE 3. Calculated total neutron flux and 10B (n,α) reaction rate at ex-core power range detector location for different prompt fission neutron source (PFNS) descriptions using ENDF/B-VIII.0 and ENDF/B-VII.0 nuclear data library. Results are normalized to nominar reactor power of 2 GW.
4.3 Sensitivity to ADVANTG parameters
The sensitivity of the FOM (see Eq. 3) for calculating the response of the ex-core neutron detectors using various ADVANTG code parameters was investigated. The speed up factor, determined as the ratio of the Figure-of-merit values (FOM, ee Eq. 3) for analog and variance reduction assisted calculation, was observed. The analog criticality calculation with 1.4% 1 σ statistical uncertainty was taken as the reference calculation. The 1 σ statistical uncertainty of the calculations with variance reduction parameters was
In a first analysis, different nuclear data libraries in ADVANTG were tested (27n19g and bplus). The difference in ex-core detector response between the different libraries was
In the second analysis, the effect of different geometric weight windows mesh was studied. The 1 ×1, 4 ×4 and 16 ×16 mesh per FA in 24 axial layers were compared, and the difference in response of the ex-core detectors was
In the third study, the effect of upscattering was examined, and the difference between the ADVANTG calculation with and without upscattering taken into account was
From Figure 6 showing the adjoint neutron flux and contribution field no ray effect can be visible and was therefore concluded that further analysis of the quadrature order is not required. As expected, it was found that no bias was observed in the response of the ex-core neutron detectors to the ADVANTG code parameters. Nevertheless, some variations in the FOM were observed for various ADVANTG parameters.
5 Results
5.1 Static control rod worth
Static control rod reactivity worth of different RCCA banks (see Figure 1) was determined by comparing the multiplication factor of the calculation with all banks completely withdrawn and the calculation with the bank of interest completely inserted. The results are shown in Table 4, where WRI represents the measured RCCA worth by the rod insertion method and WM and WC represent the calculated MCNP and CORD-2 RCCA worth respectively. It can be observed that the calculated values between MCNP and CORD-2 for individual RCCA differ less than 23 pcm. Therefore, it can be concluded that the calculations agree well with each other, which additionally confirms the MCNP core model for the HZP configuration. It should be taken into account that the calculated values presented in this section consider only neutron transport within the core and represent static control rod reactivity worth. In order to compare them with the measured values using the rod insertion method, two main correction must be applied: spatial and dynamic. The redistribution factors due to the spatial redistribution of the neutron flux during the insertion of the control rod are studied in this work. The dynamic correction due to a temporal delay of the measured signal (the delayed neutron distribution is trailing behind the distribution of the prompt neutrons) (Merljak et al., 2018) is beyond the scope of this paper.
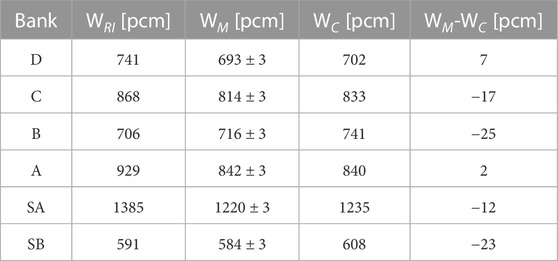
TABLE 4. Control Rod Worth for Cycle 28, measured with rod insertion method (RI), calculated with MCNP (M) and CORD-2 (C).
5.2 Neutron flux redistribution due to the control rod movement
The neutron flux redistribution due to the RCCA movement was studied and is shown in Figure 9, where the neutron flux distribution inside the reactor core is shown for individual RCCA inserted. In Figure 10 the relative deviation in neutron flux distribution between individual inserted RCCA and ARO (all rods out) is shown. The neutron flux was calculated through the entire reactor core using a fine geometric mesh of 250 × 250 × 50 voxels, where one volume corresponds approximately to one fuel pin. The flux was normalized to the maximum reactor power of 2 GW. It can be observed that the movement of the RCCA can significantly affect the distribution of the neutron flux and therefore alters the reading of the ex-core neutron detector, which is also used to determine the RCCA worth. To account for this effect, the neutron flux redistribution factors are introduced when evaluating the RCCA worth using the rod insertion method.
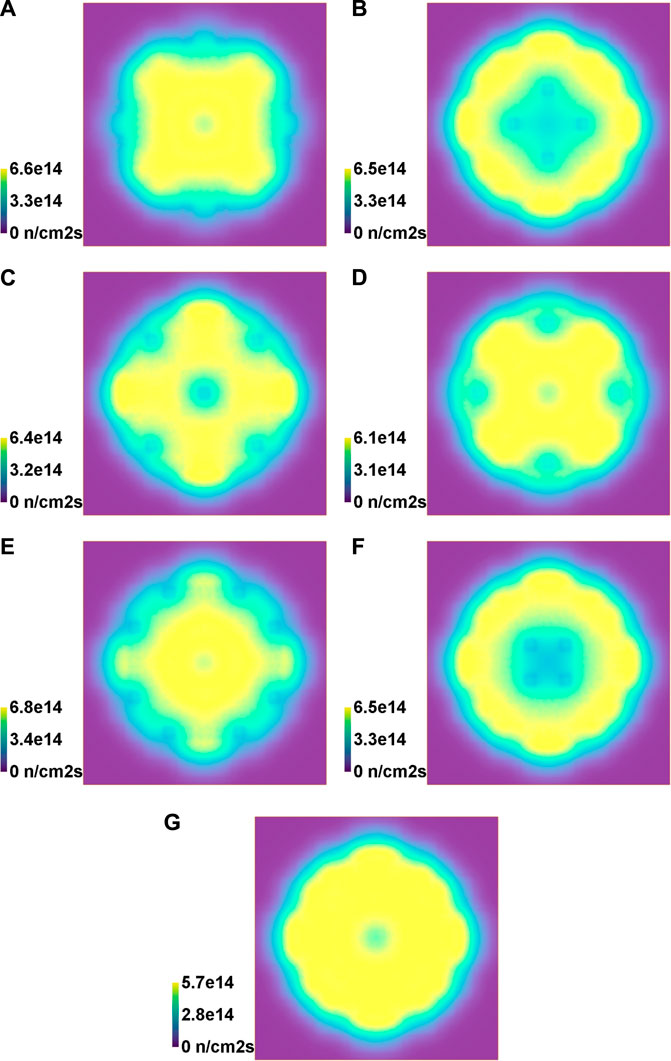
FIGURE 9. Neutron flux distribution in xy plane approximately in the middle of active core height, normalized to the maximum reactor power of 2 GW for cycle 28 HZP configuration calculated using MCNP core model for individual control rod completely inserted. Normalized neutron flux values are represented with colors, ranging from low values in blue to high values in yellow. (A) A bank. (B) B bank. (C) C bank. (D) D bank. (E) SA bank. (F) SB bank. (G) All rods out (ARO).
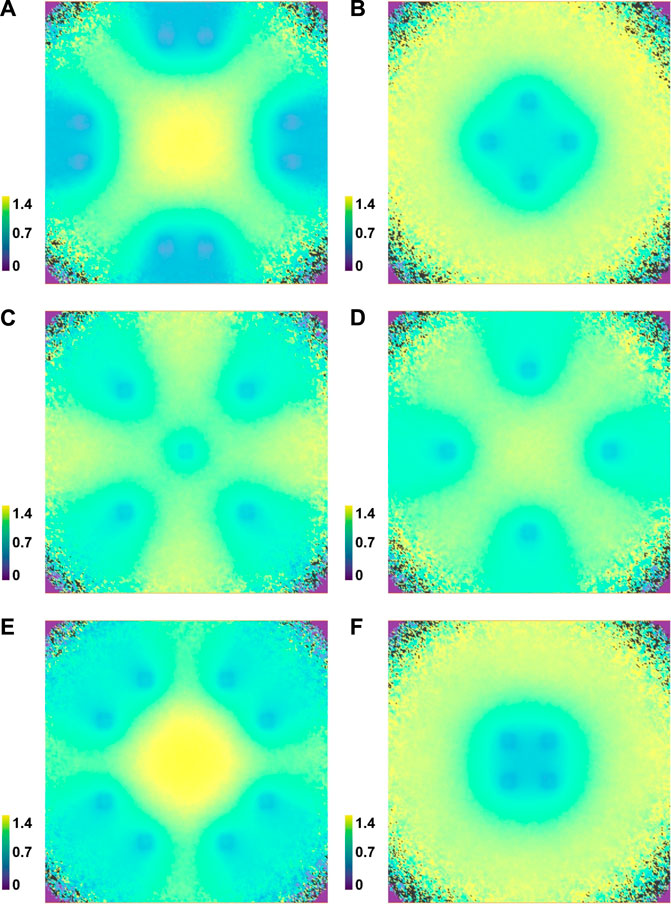
FIGURE 10. Neutron flux distribution in xy plane approximately in the middle of active core height, relative to the ARO (All Rods Out) core configuration, calculated using MCNP core model for individual control rod completely inserted. Normalized neutron flux values are represented with colors, ranging from low values in blue to high values in yellow. (A) A bank. (B) B bank. (C) C bank. (D) D bank. (E) SA bank. (F) SB bank.
5.3 Neutron flux redistribution factors
The neutron flux redistribution factors (f(ϕ)) were determined by comparing the total neutron flux at the ex-core detector location for the core configuration with the ith bank of interest completely inserted and all control rods completely withdrawn (ARO) as:
The calculated neutron flux redistribution factors are summarised in Table 5 and compared with the reference values (Kromar et al., 2015) (denoted by C). The reference values are calculated from the single adjoint neutron flux calculation for the first operational cycle. They were determined using old Sailor (Simmons and Roussin, 1983) nuclear data library and 2D deterministic calculation with the DOT-4.2 code (Rhoades et al., 1979). However, the power range detectors used for the measurements of the control rod worth actually measure the 10B(n,α) reaction rate and not the total neutron flux at their position. Therefore, the comparison of reaction rate redistribution factors was also performed as follows:
and is gathered in Table 5. The reference values were not calculated taking into account reaction cross section. Therefore, the reference value for comparison of reaction rate redistribution factors is the same as for neutron flux redistribution factors. From the results gathered in Table 5, it can be concluded that the highest deviation of the neutron flux redistribution factor from the reference value is for the control rod bank A, where the deviation is
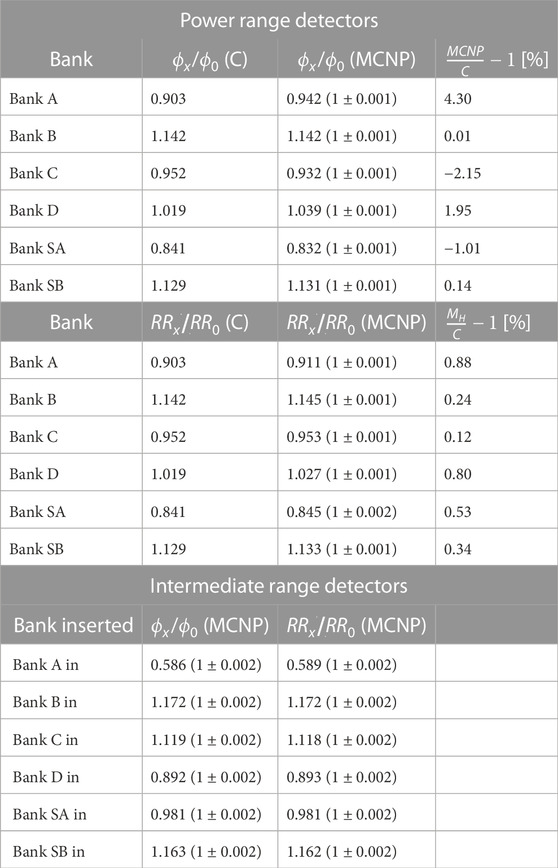
TABLE 5. Calculated neutron flux redistribution factors (ϕx/ϕ0) and reaction rate redistribution factors (RRx/RR0) for power and intermediate range detectors, where C denotes currently used values and MCNP represents values calculated within this paper.
For the rod insertion method power range detectors are used in the Krško NPP because they enable axial averaging of the signal (two detectors at different axial positions per channel). However, their disadvantage is their low signal compared to the background at low reactor powers. In contrast to the power range detectors, the intermediate range detectors are compensated ionization chambers, where the signal due to the gamma rays can be compensated. Because of smaller sensitive height, they are more sensitive to the neutron flux redistribution factors due to the control rod movement. With accurate determination of the neutron flux redistribution factors, the possibility to use the intermediate range detectors instead of the power range appear. In Table 5 neutron flux and reaction rate redistribution factors for intermediate range detectors are gathered. It is noted that the intermediate range detectors are very sensitive to the control rod bank A movement, since the bank is close to the location of the intermediate range detectors (see Figure 1).
As the additional step to improve the calibration of the control rod by the rod insertion method, the reaction rate and neutron flux redistribution factors were also calculated for multiple CR bank steps and are shown in Figure 11 for all banks. The step number 0 denotes fully inserted control rod and step 225 denotes the fully withdrawn control rod. The value of the neutron flux redistribution factor (and the reaction rate redistribution factor) is 1.0 at the rod step 225, which corresponds to the completely withdrawn control rod or ARO core configuration. It can be observed that the axial dependence of the reaction rate redistribution factors is quite different among different control rod banks. This further supports the idea of updating the rod insertion method with axial dependant reaction rate redistribution factors obtained with method presented in this work. It can be deduced that the axial dependence of the reaction rate redistribution factors has approximately the same shape for control rod banks B and SB. Both control rod banks (B and SB) are positioned closer to the center of the reactor core (see Figure 1A), which means that their insertion (control rod movement from step 225 to step 0) lowers the neutron flux distribution relatively more in the center on the core compared to the core periphery (see Figures 9, 10). This leads to a reaction rate redistribution factor
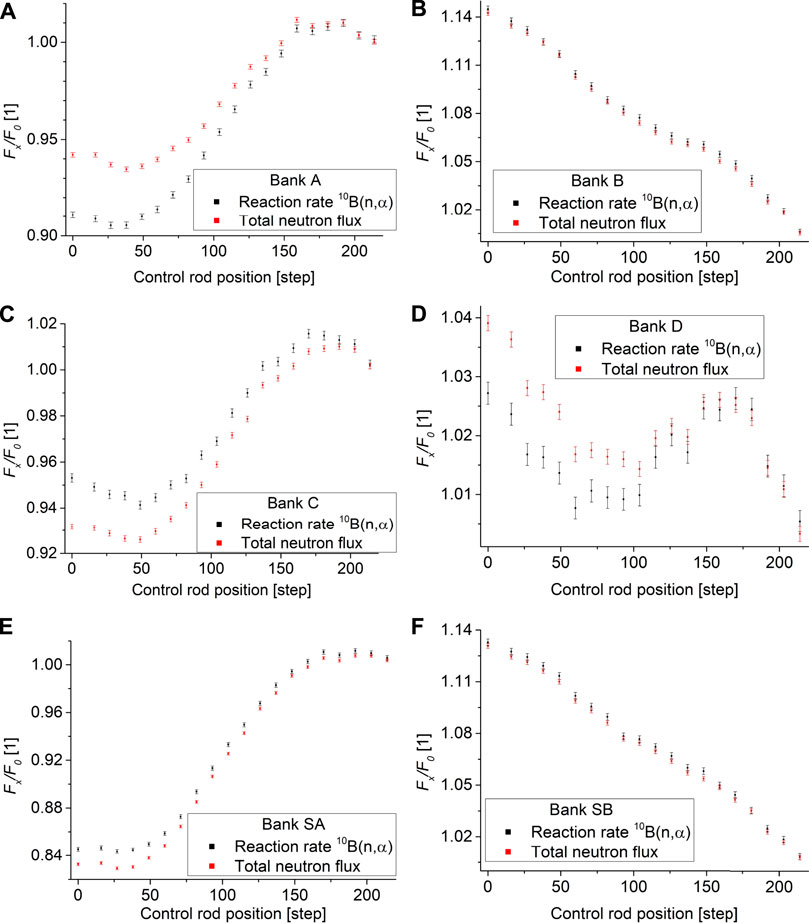
FIGURE 11. Reaction rate redistribution factors (black) and neutron flux redistribution factors (red) for individual control rod bank in multiple steps. (A) A bank. (B) B bank. (C) C bank. (D) D bank. (E) SA bank. (F) SB bank.
6 Adjoint neutron flux
To further verify and simplify the calculation procedure for the neutron flux (or reaction rate) redistribution factors presented in this paper, the approach to calculate them from the adjoint neutron flux distribution was used for comparison. As mentioned above, the neutron flux redistribution factors currently used at the Krško NPP were calculated from the single adjoint neutron flux distribution for the first operational cycle. The procedure for calculating the detector response using the adjoint neutron flux distribution is described below. The response of the detector (R) using the response function (σd) can be expressed as follows:
where p refers to independent variables of the particle phase space (
where ψ is the angular flux, H is the transport operator and ψ† and H† are their adjoint counterparts. The forward and adjoint transport equations can also be written as follows:
Now, if we set:
then we obtain a formulation for the detector response (R) as (Haghighat, 2020):
It can be concluded, that the detector response is equal to the integral of the adjoint weighted source distribution. The neutron source distribution can be approximated by the power distribution and the detector response by multiplying the forward and adjoint angluar flux distributions as:
Where χ is the fission neutron spectrum, ν is the average number of neutrons produced per fission event and Σf is the macroscopic fission cross section. The benefit of using the adjoint neutron flux distribution is that the detector response can be calculated only from the power distribution calculation within the core. Therefore, there is no need for Monte Carlo neutron transport calculations outside the reactor core, only for the determination of the adjoint neutron flux distribution with deterministic methods.
The adjoint neutron flux presented in this section was calculated using the Denovo/ADVANTG code by performing deterministic calculations without generating variance reduction parameters. Calculations were performed using the bplus multigroup library with 47 neutron energy groups. Adjoint neutron flux distributions were calculated for the response (10B(n,α) reaction rate) of all power range detectors. The FW-CADIS option was not used for the calculations presented in this section. The adjoint neutron flux was calculated for different geometry discretizations. The results obtained per fuel assembly, averaged to the one core quadrant for 2 control rod configurations: all rods out (ARO) and A bank fully inserted, are shown in Figure 12. It can be confirmed that fuel assemblies close to the periphery of the core contribute more to the detector response. The most important fuel assemblies are: K-11, L-10, and J-12, which lie on the core diagonal in line with the power range ex-core detectors. It can be confirmed, that there is only small difference in adjoint neutron flux distribution with different control rod configuration. The calculated adjoint neutron flux distribution for all rods out (ARO) was compared with the reference calculation currently used for the calculation of the neutron flux redistribution factors of the Krško nuclear power plant. The reference calculation and the relative difference between ADVANTG and the reference are shown in Figure 12D. By observing the difference for the 3 main fuel assemblies (K-11, L-10 and J-12), it can be concluded that the differences are not negligible. By observing the adjoint neutron flux distribution in these three most important fuel assemblies between ADVANTG and the reference, it can be concluded that the adjoint distribution is different. In the case of the ADVANTG calculation, the adjoint distribution in fuel assembly K-11 is the highest compared to L-10 and J-12, while in the reference calculation it is the lowest among the three. For the correct interpretation of the results, it is also important to know the burnup of the each fuel assembly at the beginning of the cycle: K-11 (26,728 MWd/MtU), L-10 (26,707 MWd/MtU) and J-12 (26,187 MWd/MtU) (Kromar et al., 2015). It can be concluded, that the burnup of the three fuel assemblies is approximately the same. Considering the fact that the fuel assembly K-11 is closest to the power range ex-core neutron detector, it can be concluded that the adjoint neutron flux should be highest at K-11 location. The reason for the different adjoint neutron flux distribution in the reference calculation could be the result of more than 30 years old calculation, which does not represent the newer core loading pattern accurately enough. It can also be concluded that for the accurate results it is important to calculate the adjoint neutron flux distribution for the individual evaluated cycle.
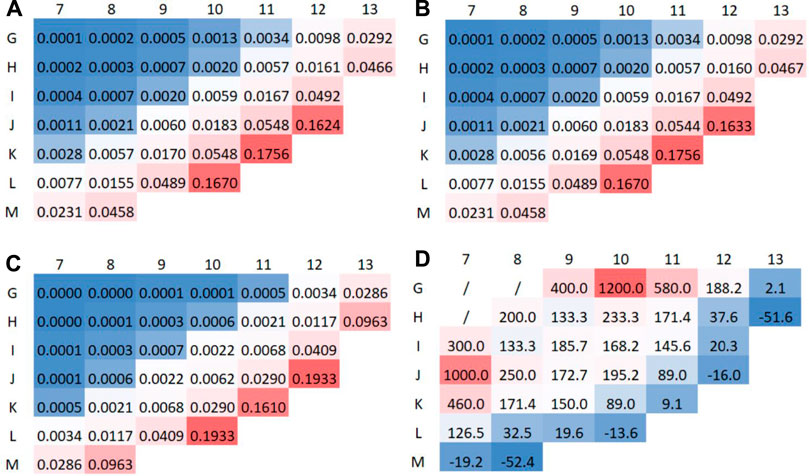
FIGURE 12. Adjoint neutron flux distribution for power range detector response averaged to one core quadrant, calculated with ADVANTG/Denovo per fuel assembly. Values are presented in colours, ranging from high values in red to low values in blue. C denotes ADVANTG calculation and R reference calculation. (A) ARO. (B) A in. (C) Reference. (D) Relative deviation C/R—1 in %.
To further investigate the adjoint neutron flux, its axial and energy distribution, the inside corner fuel pin (16,16) of the fuel assembly K-11 was analysed and is presented in Figure 13A. The axial profile and energy distribution were studied for different scattering moments (Pn) and quadrature order (Sn). Since the adjoint calculation is based on the discrete ordinate method, it is susceptible to the so-called ray effect (Henderson, 2019). To test the accuracy of the results, the quadrature order (Sn) was increased to 32 and the scattering moment (Pn) to 5. However, observation of the axial profile and energy distribution results suggests that the ray effect or other anomalies are not present and using the default values of quadrature order of 8 and scattering moment of 3 is sufficient.
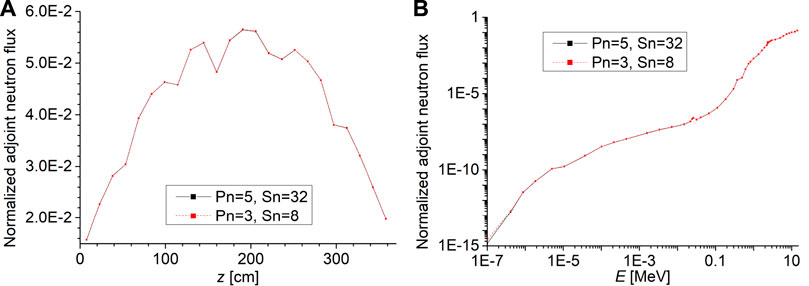
FIGURE 13. Adjoint neutron flux distribution in fuel assembly K-11, inside fuel pin at location (16,16). (A) Axial adjoint neutron flux profile. (B) Energy dependance of adjoint neutron flux.
6.1 Reaction rate redistribution factors verification
The calculated adjoint neutron flux distributions presented in the previous section were used to calculate the reaction rate redistribution factors in order to verify the calculation procedure used to determine the reaction rate redistribution factors, calculated using the direct method for calculating the response of the ex-core detectors and its deviation with control rod movement using the MCNP ex-core model presented in Section 5.3 and referred to as reference for the purpuses of this analysis. The reaction rate redistribution factors obtained from the adjoint distribution calculation were calculated as follows:
The fission rate distributions were calculated using the MCNP core calculation. The calculated reaction rate redistribution factors, shown in Table 6 are:
• E: per FA in 1 axial layer, ARO adjoint neutron flux,
• F: per FA in 24 axial layers, ARO adjoint neutron flux,
• G: per fuel pin in 24 axial layers, ARO adjoint neutron flux,
• H: per fuel pin in 24 axial layers, individual CR adjoint neutron flux.
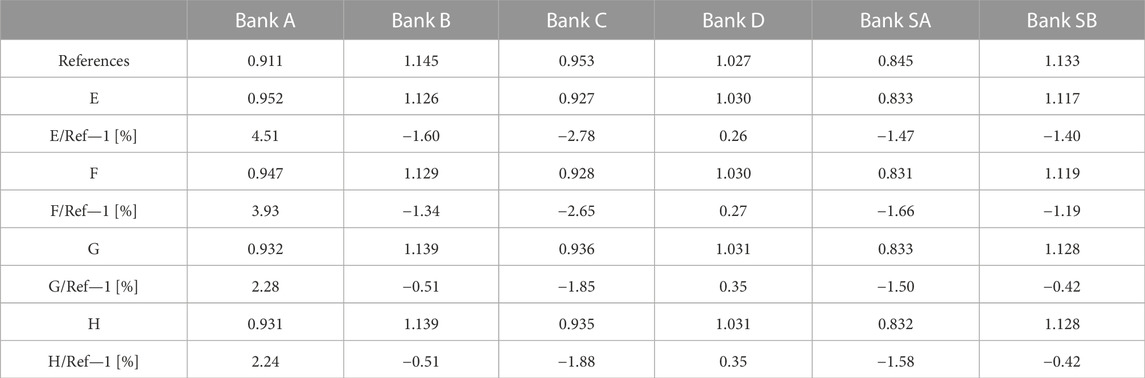
TABLE 6. Reaction rate redistribution factors using adjoint neutron flux distribution from ADVANTG/Denovo calculation, compared to the reference direct MCNP calculation.
When analysing the ADVANTG results, a high deviation is observed in the case of bank A. With the refinement of the geometry voxels to the fuel pin scale, the differences decreased to approximately 2%. The deviations from the reference are also summarised in Figure 14. It can also be observed that the calculation of the adjoint neutron flux distribution for individual control rod movement has negligible effect on the reaction rate redistribution factor calculation. This indicates the advantage of using the adjoint neutron flux distribution for the determination of reaction rate redistribution factors, since a single adjoint calculation is sufficient and only core calculations of the control rod movement are required. The good agreement between the reference calculations (direct MCNP calculation) and the calculation from the adjoint distribution further verifies the developed calculation procedures and the reaction rate redistribution factors presented in this work.
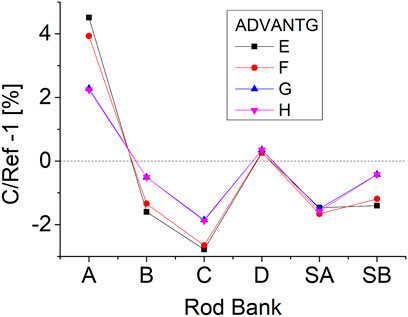
FIGURE 14. Difference in the reaction rate redistribution factors from ADVANTG/Denovo calculation of adjoint neutron flux from the reference direct MCNP calculation.
7 Conclusion
In this paper, the approach for calculating the response of the ex-core neutron detectors using Monte Carlo techniques is presented. A detailed sensitivity study is performed on the neutron data libraries, the fixed neutron source geometry, and the description of the prompt fission neutron spectrum. It was determined that at least the last two fuel assembly rows need to be described in pin-wise scale when reconstructing fixed neutron source for the ex-core calculation. By comparing different approaches for describing the prompt fission neutron spectrum it was determined that the use of the prompt fission neutron spectrum calculated by weighting the prompt fission neutron spectra of important isotopes was optimal. We continued with the calculation of the control rod worth and the neutron flux redistribution within the core with control rod movement. Using the developed calculation procedure and the models presented in this paper, the neutron flux and reaction rate redistribution factors due to control rod movement were determined using the direct MCNP calculation. It was pointed out, that it is correct to use reaction rate redistribution factors in the process. When compared to the currently used values, good agreement was found with deviations
Data availability statement
The raw data supporting the conclusion of this article will be made available by the authors, without undue reservation.
Author contributions
TG contributed as the main author to the work by performing calculations, analysing the results and writing the manuscript. BK contributed to the work by preparing original MCNP containment building model. KA contributed to the work by setting concept of fixed source calculation by sampling fission neutron generation rate within the core, fission neutron energies and positions. AT contributed to the work by setting concept of fixed neutron source calculation by weighted prompt fission neutron spectra of important isotopes. MK provided CORD-2 results. LS and MK contributed to the conception of the study. All authors contributed to manuscript revision, read, and approved the submitted version.
Funding
The research is funded by the projects “Development of Computational Tools for the Determination of the Neutron Field in the Containment of a Pressurized Water Reactor” (L2-8163), “Stability of nuclear reactors in load follow mode of operation” (L2-2612) and the research core funding No. P2-0073 from the Slovenian Research Agency.
Conflict of interest
The authors declare that the research was conducted in the absence of any commercial or financial relationships that could be construed as a potential conflict of interest.
Publisher’s note
All claims expressed in this article are solely those of the authors and do not necessarily represent those of their affiliated organizations, or those of the publisher, the editors and the reviewers. Any product that may be evaluated in this article, or claim that may be made by its manufacturer, is not guaranteed or endorsed by the publisher.
Footnotes
1https://www.nek.si/en, last visited on 9.12.2022.
References
Ambrožič, K., Kos, B., Jazbec, A., Radulović, V., and Snoj, L. (2017). “Characterization of neutron fields in the TRIGA irradiation facilities inside and outside the biological shield,” in Proceedings of the International Conference Nuclear Energy for New Europe, 468–475.
Brown, D. A., Chadwick, M., Capote, R., Kahler, A., Trkov, A., Herman, M., et al. (2018). ENDF/B-VIII.0: The 8th major release of the nuclear reaction data library with CIELO-project cross sections, new standards and thermal scattering data. Nucl. Data Sheets 148, 1–142. doi:10.1016/j.nds.2018.02.001
Chadwick, M., Obložinskỳ, P., Herman, M., Greene, N., McKnight, R., Smith, D., et al. (2006). ENDF/B-VII.0: Next generation evaluated nuclear data library for nuclear science and technology. Nucl. data sheets 107, 2931–3060. doi:10.1016/j.nds.2006.11.001
Cranberg, L., Frye, G., Nereson, N., and Rosen, L. (1956). Fission neutron spectrum of u235. Phys. Rev. 103, 662–670. doi:10.1103/PhysRev.103.662
Davidson, E. E., Pandya, T. M., Royston, K. E., Evans, T. M., Godfrey, A. T., Henderson, S. C., et al. (2021). Effect of fission source spectrum on Monte Carlo calculation of ex-core quantities. EPJ Web Conf. 247, 02027. doi:10.1051/epjconf/202124702027
Goorley, J. T., James, M. R., Booth, T. E., Brown, F. B., Bull, J. S., Cox, L. J., et al. (2013). Initial MCNP6 release overview-MCNP6 version 1.0. Tech. rep. Los Alamos, NM, USA: Los Alamos National Lab.(LANL).
Goričanec, T., Štancar, Ž., Kotnik, D., Snoj, L., and Kromar, M. (2021). Applicability of the Krško nuclear power plant core Monte Carlo model for the determination of the neutron source term. Nucl. Eng. Technol. 53, 3528–3542. doi:10.1016/j.net.2021.05.022
Goričanec, T., Žerovnik, G., Barbot, L., Fourmentel, D., Destouches, C., Jazbec, A., et al. (2018). Evaluation of neutron flux and fission rate distributions inside the JSI TRIGA Mark II reactor using multiple in-core fission chambers. Ann. Nucl. Energy 111, 407–440. doi:10.1016/j.anucene.2017.08.017
Henderson, S. (2019). Analysis of adjoint flux calculation for detector response estimation in typical PWR conditions.
Hendricks, J. S., and Culbertson, C. N. (2000). An assessment of MCNP weight windows. Tech. rep. Los Alamos, NM, USA: Los Alamos National Lab.(LANL).
Kaiba, T., Žerovnik, G., Jazbec, A., Štancar, Ž., Barbot, L., Fourmentel, D., et al. (2015). Validation of neutron flux redistribution factors in JSI TRIGA reactor due to control rod movements. Appl. Radiat. Isotopes 104, 34–42. doi:10.1016/j.apradiso.2015.06.026
Kos, B., Kromar, M., Štancar, v., Snoj, L., and Klenovšek, P. (2016). “Neutron streaming analysis and shielding determination for the Krško nuclear power plant,” in Proceedings: 25th international conference nuclear energy for new europe (Ljubljana, Slovenia: Nuclear Society of Slovenia).
Kromar, M., Slavič, S., and Žefran, B. (2015). The nuclear design and core management of the Krško NPP-cycle 28. Ljubljana, Slovenia: Inštitut Jožef Stefan.
Kromar, M., and Trkov, A. (2009). Nuclear design calculations of the NPP Krško core. J. Energy Technol. 2 (4), 41–50.
Liu, L., and Gardner, R. P. (1997). A geometry-independent fine-mesh-based Monte Carlo importance generator. Nucl. Sci. Eng. 125, 188–195. doi:10.13182/nse97-a24265
Merljak, V., Kromar, M., and Trkov, A. (2018). Rod insertion method analysis–A methodology update and comparison to boron dilution method. Ann. Nucl. Energy 113, 96–104. doi:10.1016/j.anucene.2017.11.020
Mosher, S. W., Johnson, S. R., Bevill, A. M., Ibrahim, A. M., Daily, C. R., Evans, T. M., et al. (2015). ADVANTG an automated variance reduction parameter Generator, Rev. 1. Tech. rep. Oak Ridge, TN, United States: Oak Ridge National Lab.(ORNL).
Network, I. I. N. D. E. (2017). CIELO follow-up: Technical meeting on long-term international collaboration to improve nuclear data evaluation and evaluated data files. Vienna, Austria: IAEA headquarters. Accessed: 2010-08-18.
Pan, Q., and Wang, K. (2021). Uniform variance method for accelerated Monte Carlo criticality calculation. Prog. Nucl. Energy 139, 103858. doi:10.1016/j.pnucene.2021.103858
Pantelias Garcés, M. (2013). Activation neutronics for the Swiss nuclear power plants. Ph.D. thesis (Zürich, Switzerland: ETH Zurich).
Pecchia, M., Vasiliev, A., Ferroukhi, H., and Pautz, A. (2017). A methodology for evaluating weighting functions using MCNP and its application to PWR ex-core analyses. Ann. Nucl. Energy 105, 121–132. doi:10.1016/j.anucene.2017.03.008
Qing-Quan Pan, X. J. L., Zhang, T. F., Wang, K., and He, H. (2021). Sp3-coupled global variance reduction method based on rmc code. Nucl. Sci. Tech. 32, 122. doi:10.1007/s41365-021-00973-0
Rhoades, W., Simpson, D., Childs, R., and Engle, W. (1979). DOT-IV two-dimensional discrete ordinates transport code with space-dependent mesh and quadrature. Tech. rep. Oak Ridge, TN, United States: Oak Ridge National Lab.
Simmons, G. L., and Roussin, R. (1983). Sailor: Coupled, self-shielded, 47-neutron, 20-gamma ray, p3, cross section library for light water reactors. RSIC-DCL-76, ORNL, RSIC.
Štancar, v., Kromar, M., Kos, B., and Snoj, L. (2016). “Construction of a Monte Carlo benchmark pressurized water reactor core model,” in Proceedings of 25th International Conference Nuclear Energy for New Europe.
Trkov, A., Griffin, P. J., Simakov, S., Greenwood, L. R., Zolotarev, K. I., Capote, R., et al. (2020). IRDFF-II: A new neutron metrology library. Nucl. Data Sheets 163, 1–108. doi:10.1016/j.nds.2019.12.001
Trkov, A., Ravnik, M., Wimmer, H., Glumac, B., and Böck, H. (1995). Application of the rod-insertion method for control rod worth measurements in research reactors/Bestimmung des Reaktivitätswertes von Absorberstäben in Forschungsreaktoren mittels der Stabeinfahr-Methode. Kerntechnik 60, 255–261. doi:10.1515/kern-1995-605-620
Wagner, J. C., Blakeman, E. D., and Peplow, D. E. (2007). Forward-weighted CADIS method for global variance reduction. Transactions-American Nucl. Soc. 97, 630.
Williams, M. L. (1991). Generalized contributon response theory. Nucl. Sci. Eng. 108, 355–383. doi:10.13182/NSE90-33
Žerovnik, G., Podvratnik, M., and Snoj, L. (2014). On normalization of fluxes and reaction rates in mcnp criticality calculations. Ann. Nucl. Energy 63, 126–128. doi:10.1016/j.anucene.2013.07.045
Zheng, Y., Lee, D., Zhang, P., Lee, E., and Shin, H.-c. (2017). Comparisons of SN and Monte-Carlo methods in PWR ex-core detector response simulation. Ann. Nucl. Energy 101, 139–150. doi:10.1016/j.anucene.2016.11.002
Keywords: MCNP, ADVANTG, pressurized water reactor, Monte Carlo neutron transport, control rod, neutron flux redistribution factor, rod insertion, krško nuclear power plant
Citation: Goričanec T, Kos B, Ambrožič K, Trkov A, Snoj L and Kromar M (2023) Determination of neutron flux redistribution factors for a typical pressurized water reactor ex-core measurements using Monte Carlo technique. Front. Energy Res. 11:1137867. doi: 10.3389/fenrg.2023.1137867
Received: 04 January 2023; Accepted: 10 February 2023;
Published: 23 February 2023.
Edited by:
Valerio Giusti, University of Pisa, ItalyReviewed by:
Qingquan Pan, Shanghai Jiao Tong University, ChinaAlexande Vasiliev, Paul Scherrer Institut (PSI), Switzerland
Copyright © 2023 Goričanec, Kos, Ambrožič, Trkov, Snoj and Kromar. This is an open-access article distributed under the terms of the Creative Commons Attribution License (CC BY). The use, distribution or reproduction in other forums is permitted, provided the original author(s) and the copyright owner(s) are credited and that the original publication in this journal is cited, in accordance with accepted academic practice. No use, distribution or reproduction is permitted which does not comply with these terms.
*Correspondence: Tanja Goričanec, dGFuamEuZ29yaWNhbmVjQGlqcy5zaQ==
†Present Address: Bor Kos, Currently at Oak Ridge National Laboratory, Oak Ridge, TN, United States