 Marcus Seidl
 Peter Schillebeeckx
 Dimitri Rochman
- 1PreussenElektra GmbH, Hannover, Germany
- 2Joint Research Centre (JRC), European Commission, Geel, Belgium
- 3Reactor Physics and Thermal Hydraulic Laboratory, Paul Scherrer Institut, Villingen, Switzerland
The accuracy of source term predictions is an important factor which determines the efficiency of interim and final storage of spent nuclear fuel. To minimize the required number of storage containers and to minimize the volume and mass of facilities while maintaining safety margins requires accurate codes to predict the decay heat and the gamma and neutron sources with minimum bias for time points ranging from months to thousands of years. While the relevant nuclear data for the purpose of criticality safety received high attention in the last decades and have been extensively verified with dedicated tests, nuclear data relevant for spent nuclear fuel had smaller priority. Mostly results from a radiochemical analysis of samples taken from commercially irradiated fuel have been used for validation purposes. The comparatively sparse data available from tests which exclusively focus on nuclide vector validation under research conditions means that many factors enter the uncertainty estimate of the measurement-theory comparisons and limits the ability to validate codes to a high accuracy. Firstly, the current status of validation efforts is reviewed. Secondly, fields of improvement are explored. Thirdly, the character of uncertainty distributions in measurement-theory comparisons (C/E) of nuclide vectors is analyzed. Currently there are indications that the C/E data is thick tailed which limits improvement of code validation efforts.
1 Introduction
One important success factor for nuclear projects and in particular for interim storage and final repository facilities is the robustness of their engineering design. If projects proceed on timescales measured in decades and longer, it is very likely that the state of science and technology will evolve, too. Also, new knowledge and insights will challenge original design specifications and assumptions. Under these circumstances, safety assessments have an element of prediction under uncertainty. On the other hand, there are economical demands on projects to be cost-effective and the higher the assumed accuracy of simulation tools and codes is, the smaller the engineered margins between design and safety criteria will be. In consequence resource utilization increases and efficiency improves.
For example, the decay heat of spent fuel is one important factor to decide when to transport or finally package spent nuclear fuel for deep storage. The operation costs of wet storage facilities are typically of the order of 10 k€ per day and reducing their active life by several years can be an important cost saving factor during power plant decommissioning. Another important design criterion is the spacing between final storage containers in a deep underground repository. For example, the planned deep underground repository in Forsmark, Sweden, is designed to have a capacity of 6000 canisters and requires an excavation mass of about 1.6 M tonnes of rock (SKB, 2011). If the required volume can be reduced by 10% due to more accurate design calculations important costs savings for the ∼500 M€ (SKB, 2017) worth of tunnel construction would follow. In another study (Solans et al., 2020) the potential for cost savings through optimization of cask loading was analyzed and it was concluded that with current assumptions on decay heat uncertainty the number of canisters can be reduced by about 2%. This represents relevant saving potential because canisters are big cost items which cost more than 10 M€ each.
The need for cost-optimization on the one hand and the potential of incomplete knowledge on the other hand can retrospectively lead to an overoptimization of a facility’s engineering design. Then, at some point in the future, it may turn out to be not sufficiently robust to absorb a revision of established methods and assumptions and may face costly upgrades. Qualitatively the evolution of the state of science and technology has been characterized, for example, by Thomas Kuhn as periods of puzzle-solving interrupted by short periods of paradigm change (Kuhn, 1962). Extended phases of slow progress and little change foster overoptimism in established methods. Occasionally rapid change leads to a revision of taken-for-granted believes. In this sense the state of determining the nuclide inventory of spent nuclear fuel has been in a state of puzzle solving for several decades yielding incremental changes and improvement of nuclear data and depletion codes.
The ORNL isotope generation and depletion code (ORIGEN) was released in 1973 (Bell, 1973), followed by ORIGEN2 in 1983 (Croff, 1980) and by a version integrated into the SCALE code system known as ORIGEN-S (Hermann and Westfall, 1990). The first evaluated nuclear data library ENDF/B-1 was released in 1968 (Honeck, 1966). In 1975 already the fourth update ENDF/B-IV followed (Garber et al., 1975), and by 1990 two more updates lead to ENDF/B-VI (Rose and Dunford, 1990). Then 27 years later the current version ENDF/B-VIII.0 was released (Brown et al., 2018). Measured by its release history, data evaluation progress has become slower. This may in part be due to a saturation effect of research focusing primarily on criticality safety and burnup credit for dedicated civil and defense applications. Even though libraries like ENDF/B or JEFF are released as general-purpose libraries their history of evaluation is based on benchmarks addressing specific research questions. Hence there is a potential that their performance for back-end applications has so far not equally well be evaluated.
Currently some final repository projects (Posiva, 2021; Ministry of the Environment, 2022) near approval status and questions about reliable prediction of source terms of spent fuel for these projects become more relevant. While observables regarding criticality and source term strength during operation can be validated empirically through measurements, they cannot directly be validated for the time scales relevant for long term interim and final storage. In the latter case confidence in projections solely depends on the assumed uncertainty of the nuclide composition at the end of irradiation and on the uncertainty of the nuclear data.
Reactor and fuel assembly average power can be reasonably well determined on the order of a few percent with modern reactor simulators. Figure 1 shows the difference between the theoretically determined fuel assembly burnup from core design calculations and the burnup determined from online core power tracking of several hundred fuel assemblies of a German Konvoi plant. With the burnup defined as the time integrated power in MWd divided by the initial mass of Uranium in kgU the 1-sigma width is 0.4 MWd/kg at an average burnup of 37 MWd/kg, a deviation of 1%. These results are roughly similar to another study conducted for quantifying fuel reactivity depletion uncertainty in (Machiels, 2011). A reactivity bias of 250 pcm up to a burnup of 55 MWd/kg with CASMO/SIMULATE was found. Assuming a reactivity loss of about 0.8% per MWd/kg this corresponds to a burnup uncertainty of about 0.3 MWd/kg.
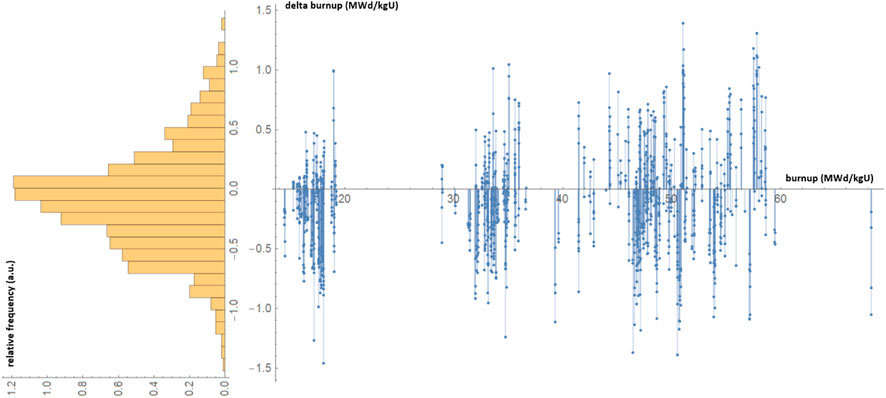
FIGURE 1. Differences between fuel burnup calculated with CASMO/SIMULATE and from online core monitoring reconstruction for several hundred fuel assemblies.
The buildup of higher actinides and the creation and removal of fission products during irradiation is a highly non-linear process. While the fuel assembly irradiation history is usually very well known, the measurement—theory differences between observed (e.g., by radiochemical analysis) and calculated nuclide concentrations often vary in orders between 1% and 100% (Ilas et al., 2010a; Ilas et al., 2010b; Gauld, 2011). Multiple reasons contribute: the power histories for the relatively tiny samples analyzed in radiochemical analyses are less well known compared to fuel assembly averages, nuclear data uncertainty in some cases has potential for improvement (especially for those nuclides relevant for back-end purposes, see below), or size of measurement uncertainties for some nuclides requires reduction. Contributions for improvement comes, for example, from the European Joint Programme on Radioactive Waste Management (EURAD) which is a European Commission sponsored research collaboration towards safe radioactive waste management and disposal (EURAD, 2019). The project consists of 13 work packages and Spent fuel Characterization (SFC) is one of them. SFC in turn is made up of 4 tasks. They focus on fuel property characterization and related uncertainty analysis, behavior of spent-nuclear fuel (SNF) pellets under interim storage conditions and finally accident scenario and consequence analysis.
In Section 2 a short review of the state-of-the-art of source term determination (nuclide vector determination, gamma- and neutron source and decay heat of spent fuel) is given. In Section 3 potential further improvements to make source term predictions more robust are discussed. Section 4 concludes the considerations.
2 General considerations regarding source terms for spent nuclear fuel
A validation of source terms has two legs: first, simulation tools and codes like SCALE (Rearden and Jessee, 2017) or CASMO/SIMULATE/SNF (Rhodes et al., 2006; Bahadir and Lindahl, 2009; Simeonov and Wemple, 2017) determine the source terms computationally and use as input evaluated nuclear data from ENDF/B (Brown et al., 2018), JEFF (Plompen, 2020) or JENDL (Shibata et al., 2011) nuclear cross sections, fission product yields and radioactive decay data. From this perspective the “theoretical” calculation of source terms is a transformation of an initial nuclide vector to a new nuclide vector by means of particle transport and radioactive decay using evaluated nuclear data (based on combining experimental data with nuclear physics theory), see Figure 2. Usually, covariance information is provided, too (Salvatores et al., 2008). By propagating this information through reactor irradiation simulations and through decay periods, the source terms and their uncertainty can be determined (Rochman and Sciolla, 2014; Rochman et al., 2016; Rochman et al., 2017). Code validation in this context means comparing calculated and measured nuclide vectors.
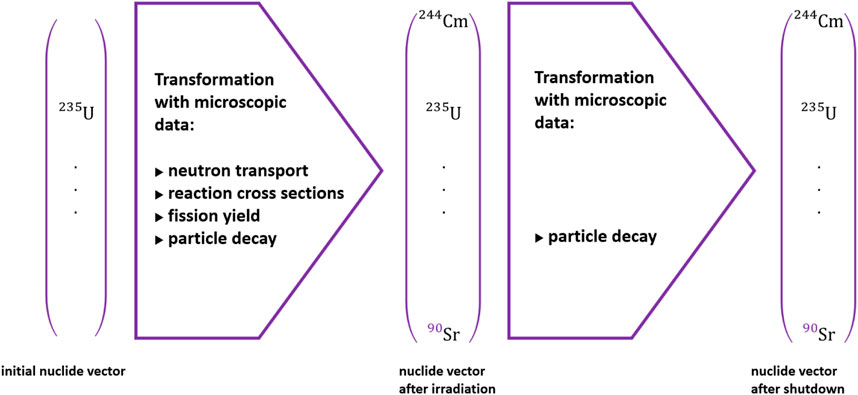
FIGURE 2. Using the principles of particle transport and decay to transform an initial nuclide vector with evaluated, measured microscopic data into a nuclide vector at a future state.
Second, there is the possibility that codes parametrize or approximate source term strengths as a function of irradiation history and other relevant variables. For example, the classical formulas for decay heat in (ANSI/ANS -5.1-2005, 2005) or (DIN-25463-1:1990-05, 1990) are of this kind. In this case integral tests like measurements of neutron and gamma source strengths of spent fuel (Tanskanen, 2000; Rimpler, 2002; Bevard, 2009) and decay heat (Ilas and Gauld, 2008; Yamamoto and Iwahashi, 2016) are possible validation routes. The application of the codes which follow a parametrization strategy therefore must stay within the parameter range defined by validation or benchmarking with higher quality codes. The determination of source terms using evaluated nuclear data can be divided into four domains. First: initial material composition and geometry. Second: parameter change during irradiation. Third: nuclear data including neutron interaction cross sections, fission product yields, neutron and gamma-ray emission data and radioactive decay data. Fourth: nuclide vector generation during irradiation and decay chain simulation. These domains are shown in Figure 3.
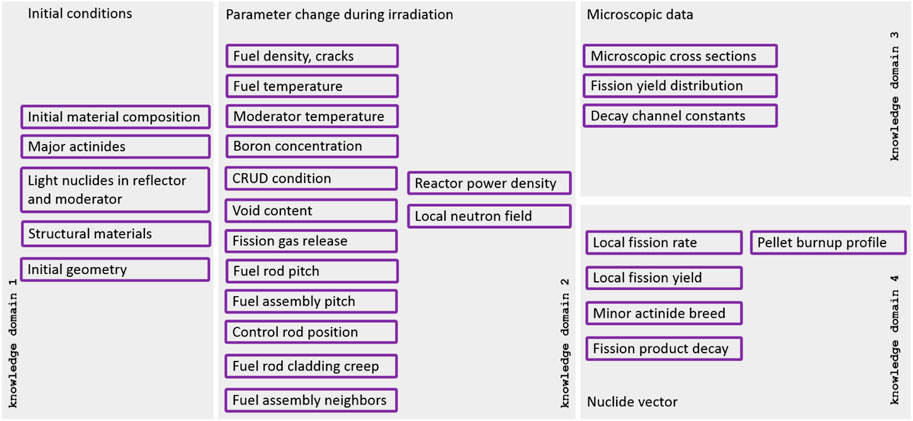
FIGURE 3. Factors influencing accuracy of source term determination for commercial nuclear fuel.
From a life cycle point of view, reactor operation comes first and criticality safety considerations and the determination of the effective multiplication factor
An important set of reference criticality experiments is given in the International Handbook of Evaluated Criticality Safety Benchmark Experiments [ICSBEP Handbook (International Handbook, 2016)]. In this case system configurations are kept as simple as possible: uranium or plutonium systems with very accurately defined nuclide vectors and geometries. Additionally, typical moderator and reflector materials like light water as well as graphite, beryllium or molybdenum are considered. The fuel matrix configurations are often much simpler than in commercial reactors (i.e., unirradiated fuel with single enrichment) and only seldom nuclides relevant for burnup credit are included. One of the few exceptions has been the LIFE@PROTEUS research program proposal at PSI (Murphy et al., 2010) which did plan critically experiments with commercially irradiated fuel rods but ended prematurely due to final shutdown of the research reactor. In the framework of the IRPhE project (International Reactor Physics Evaluation Project Handbook, 2021) mostly quantities for reactor operation like control rod worth, reactivity coefficients or power densities are considered and little emphasis for backend considerations is made. There have been a couple of initiatives to study the feasibility and reliability of burnup credit for the purpose of criticality safety in the transportation, storage and treatment of spent fuel (Brady, 1998; IAEA - TECDOC -1241, 2001). While code-to-code benchmarks are straightforward (NEA, 2012), a comparison with measured nuclide vectors requires much more effort and resources (Ilas et al., 2010a; Ilas et al., 2010b). First, to determine the power history of irradiated fuel samples which come from commercial reactors with high accuracy requires very reliable online core power monitoring and access to 3D pin-wise power reconstruction simulators. This effort is necessary to take into account local factors like spectral changes through heterogenous fuel assembly loading, local neutron field gradients, control rod power shielding or influences of burnable neutron absorbers. Second, post-irradiation determination of the nuclide composition is resource intensive and usually only done for pellet-sized samples of a fuel assembly. While the average energy generation of a fuel assembly is known with relatively high accuracy, local factors such as fuel rod or assembly bowing, moderator conditions, neutron field suppression by spacer grids or intra-pellet burnup profile variations are more difficult to quantify. From a licensing perspective, safety criteria apply to source terms of fuel assemblies in their entirety, and measurement—theory differences for small samples may not be fully representative.
Part of EURAD’s SFC accomplishments so far, for example, have been the development of a non-destructive method to determine the 244Cm source term of small samples in a standard-controlled radiation zone (Schillebeeckx et al., 2020) and with an accuracy like for radio-chemical analysis. Improved nuclear data for the multiplicity distribution is the main factor which could enhance accuracy even more. Because of reduced costs, this will enable the determination of 244Cm concentrations of more representative sample sets taken from single fuel assemblies.
Finally, the nuclide vector determination at a fixed burnup point yields only a single snapshot of the behavior of a non-linear system and therefore limits the ability to extrapolate an existing validation to different burnup conditions. Also, validation at different burnups typically relies on samples from different reactors or from fuel with different irradiation histories. In this case uncertainty from the underlying microscopic data is mixed with uncertainty from different irradiation boundary conditions.
Validation of codes for source term determination would ideally avoid power history and associated operation uncertainties seen in commercial reactors and use only samples from very well-known irradiation conditions like in a research reactor. This would allow improved separation of uncertainties coming from nuclear data and from power reactor conditions. To some extend current nuclide vector uncertainties determined with the help of commercial samples indistinguishably mix uncertainties from nuclear data and irradiation histories. To improve the quality of code validation with power reactor samples either knowledge about irradiation conditions needs improvement, or larger number of samples must be analyzed to reduce noise from randomness of irradiation histories.
Integral tests are non-destructive and cheaper compared to nuclide vector determination and hence their number is larger—but usefulness is limited to effects of the nuclide integral. For commercially irradiated fuel validation of criticality safety criteria with integral quantities, for example, critical boron concentration or control rod worth verification, is part of standard operating protocols. Other integral tests include measurement of decay heat or gamma and neutron source strengths of individual or groups of fuel assemblies. However, in integral tests self-cancelling of error contributions are possible and may lead to overoptimism in calculation capabilities. One possible countermeasure is to use data from many different experiments and configurations. The ICSBEP initiative, for example, spans over 2000 critical or near critical configurations. In comparison the SFCOMPO-2 (Michel-Sendis et al., 2017) database of spent fuel assays is mainly based on radiochemical analysis and contains data from 750 irradiated fuel samples. Given the much larger space of possible fuel states after irradiation, this is a comparatively small number. Part of the SFC task of the EURAD project has been the re-evaluation of some of these samples and of proprietary samples for which high-quality irradiation histories are available.
Ranking tables for important nuclides have long been established (Broadhead et al., 1995; Zerovnik, 2018) and Figure 4 highlights some prominent nuclides for criticality, for burnup-credit and for radiation of spent fuel. Which nuclides are more relevant than others depends on time scales considered and on chosen safety parameters. Important nuclides contributing to neutron emission are different from nuclides contributing to decay heat. Nuclides contributing to decay heat at reactor shutdown are different from nuclides contributing to decay heat in a final repository. Also, final repositories often have limits on the concentration of specific nuclides mentioned in other environmental regulations which fall outside of the attention of classical source term determination.
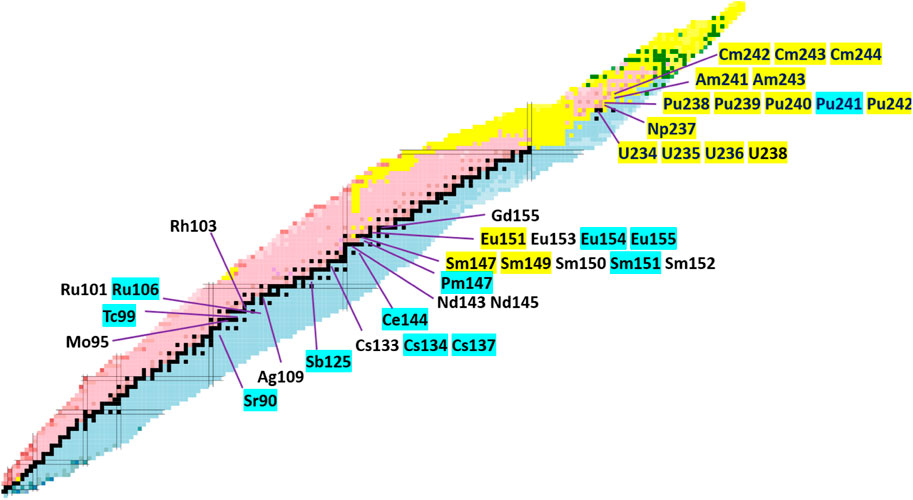
FIGURE 4. Nuclides of interest identified in (IAEA - TECDOC -1241, 2001), (Sirakov et al., 2017) relevant for criticality, burnup credit and dose rate (primary decay modes in yellow: α; black: stable; blue: β-).
Systematic analyses of microscopic data and irradiation history uncertainties and their impact on decay heat so far have mostly been compatible with measurement-theory comparisons. For example, in (Shama et al., 2021; Shama et al., 2022) it was found that the 2-sigma band for decay heat uncertainty due to nuclear data is about 5% and for the influence from irradiation histories typically lies between 2% and 6%. Surprisingly, some validation studies like (SKB, 2006) found even better agreement between measurement and calculation, and in (Ilas and Burns, 2021) it was concluded that at the cooling times currently accessible decay heat generally can be determined with about 1.5% uncertainty. An important precondition is the correct determination of the sample burnup. However, for large-scale fuel assembly loading and preparation for final storage use of burnup monitors like 148Nd is not feasible or practical and burnup determination relies on the availability of high-quality data from core power monitoring.
In complementary studies (Rochman et al., 2021a; Rochman et al., 2021b) individual nuclide concentrations determined with radiochemical analysis were compared with results from fuel assembly irradiation simulations with CASMO. In these cases, measurement-theory deviations are often noticeably larger than in the above-mentioned validation with integral observables and range between a few percent and more than 100%—as already observed in earlier studies in (Ilas et al., 2010a; Ilas et al., 2010b; Gauld, 2011). For some nuclides plausible nuclear data and irradiation history uncertainties are too small to explain the larger measurement-theory deviations and estimated experimental uncertainties cannot explain the differences, too. Additionally, comparison of results from different code systems and/or libraries show for some nuclides also noticeable differences which are outside of calculated uncertainty bands. For example, in (Rochman et al., 2021a; Rochman et al., 2021b) effects of nuclear data uncertainties resulted in a change between 4% and 28% for 134Cs depending on use of ENDF/B-VIII.0, JENDL-4.0 or JEFF-3.3. Additionally, results for 244Cm with TRITON/SCALE differed by more than 20% from results with CASMO. Hence, from the perspective of individual nuclide concentrations, source term predictions appear less reliable than from tests which measure integral observables. There are a variety of reasons, as follows.
Uncertainties from microscopic factors in measurement-theory comparisons in first order do not appear as random contributions but as a constant bias over all experiments because they do not change from measurement to measurement. Therefore, if at a given burnup there is a noticeable variation of measurement-theory differences, then uncertainty in irradiation conditions is presumably the main source of randomness. Because of random changes of conditions from experiment to experiment, the average over many samples should reveal the bias of nuclear data.
Part of the challenge to reliably separate bias and random contributions lies in the already mentioned non-linear dependencies of the nuclide chains. For example, the described bias can be path dependent. A given endpoint like burnup can be reached via many different routes which also have different exposures to relevant nuclear data segments. This means that even with perfect knowledge of each irradiation history different histories can lead to different differences between measurement and theory.
Figures 5, 6 show examples of the above-described non-linear influences. At constant burnup differences in irradiation histories result in nuclide specific deviations from a reference solution. Hence burnup is not uniquely determining the nuclide vector. Also, even with similar irradiation histories small changes in burnup lead to overproportional deviations from the reference. In Figure 5 the irradiation history (power, duration, and shutdown periods) for a typical 4-cycle, 4wt% U-235 PWR fuel assembly was randomly changed (representing usual PWR fuel conditions) under the constraint of constant final discharge burnup of 50 MWd/kg (TRITON/SCALE calculation). Results are normalized to a flat reference power history and Figure 5 shows that, for example, distributions of 244Cm relative to 235U and 147Pm relative to 148Nd are noticeably affected. In Figure 6 the spread for some nuclide concentrations of interest within a single fuel assembly at about 50 MWd/kgU from a CASMO/SIMULATE core simulation with 32 equidistant axial nodes of the active zone is shown. History effects enter in this case by the axial and radial burnup dependency. A value of 1.0 corresponds to the average concentration of all 32 nodes per nuclide. The concentrations per node were then normalized to the average burnup of all nodes (i.e., rescaled according to the difference between node burnup and average burnup of all nodes). If there would be a linear relationship between nuclide concentrations and burnup all normalized values would be at 1.0. Again, for many nuclides a noticeable non-linear dependency is seen.
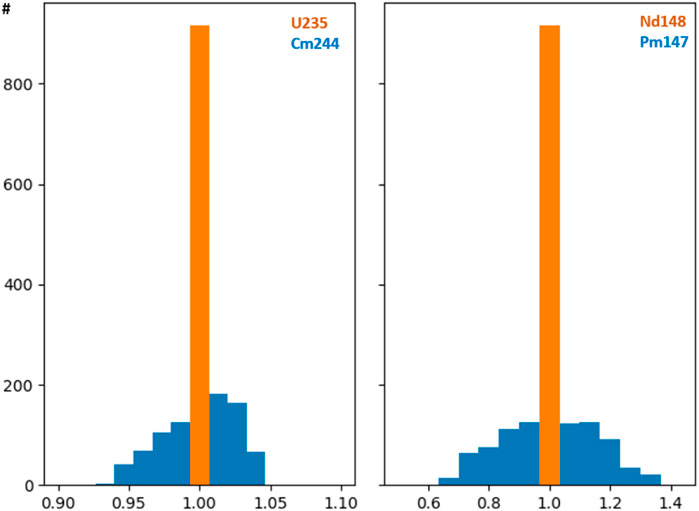
FIGURE 5. Concentration of 235U, 244Cm, 148Nd, 147Pm for a reference PWR UO2 assembly at 50MWd/kg; while the EOL burnup remained fixed the power history and the cycle durations were randomly changed for the assembly’s 4-cycle lifetime.
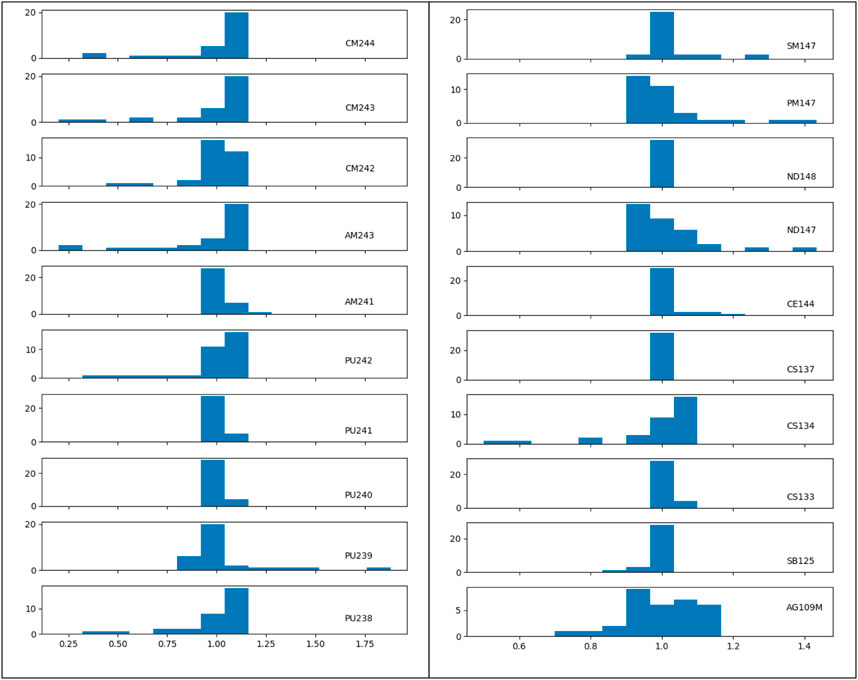
FIGURE 6. Nuclide vector spread for a representative PWR UO2 fuel assembly at 50MWd/kg; isotopic concentrations are normalized to burnup of each axial node of the active zone (i.e., if nuclide concentration would scale linearly with burnup all values would be at 1.0).
These considerations again underline that good measurement-theory agreements for integral tests are not necessarily an indication of the quality of knowledge about the nuclide vector: because at the time of measurement relevant nuclides may fortuitously be well predicted, their positive and negative prediction bias may partly cancel or non-linear contributions may accidentally reduce biases. It has also to be kept in mind that power histories of reactors operating near an equilibrium cycle are usually strongly correlated and may not represent the full spectrum of irradiation histories which lead to a given burnup.
3 Potential to improve robustness of source term predictions
From the perspective of the precautionary principle, uncertainties of source terms determined for current, observable timescales cannot unquestionably be extrapolated into the future without reevaluation. The time dependence of the nuclide vector ranking list and uncertainties of concentrations of nuclides which momentarily have minor contributions must be considered.
Already in 1976, the impact of uncertainties in fission-product yields, half-lives and decay energies on decay heat was studied in (Schmittroth, 1976; Schmittroth and Schenter, 1977). This assessment indicated that decay heat can be calculated within an uncertainty of 7% for cooling times >10 s. It decreased to 3% for cooling times larger than 103 s.
Decay heat at short cooling times was validated with pulse fission experiments [for example, (Akiyama and An, 1982; Dickens et al., 1981)] with estimated uncertainties for UOX and MOX fuels of about 7.5%. The WPEC Subgroup 25 was formed in 2005 to assess and recommend improvements to the fission product decay data for decay heat calculations (NEA/WPEC -25, 2007). It already considered the question if a reduction in the uncertainty in decay heat calculations to about 5% or better is achievable. One conclusion was that more accurate measurements were required to determine the decay constants of key radionuclides. However, in the recommended list for obtaining better data on 37 nuclides the emphasis was mostly put on nuclides with short decay times and not for the very long-range forecasts necessary for final disposal.
In (SKB, 2006) decay heat measurements on spent nuclear fuel were performed. 50 BWR and 34 PWR assemblies were selected for measurement from the Clab inventory. Shutdown cooling period was 11–27 years in these cases. The measurement-theory agreement in this non-blinded study was reported excellent and not larger than the decay heat measurement uncertainty of about 2%. In a follow-up study (Ilas and Liljenfeldt, 2017) the overall decay heat uncertainty from both modeling and nuclear data was estimated at 1.3%. Research in (Gauld, 2010) also concluded that measurement-theory comparisons for decay heat were mainly limited by the accuracy of the calorimeters used in these experiments. For the fuel assembly cooling period considered in the above research 137Cs and 90Sr were among the main decay heat contributors. A simple estimate for uncertainties documented for fission yield, decay energies and removal cross section by comparing values in different evaluated data libraries shows in Table 1 that from the perspective of nuclear data an agreement of measured and calculated decay heat between 1% and 2% is unlikely (the table shows values from different libraries and a “1-sigma” value is derived from the sample variance of these values; in most categories the spread between evaluations is already of the order of 1%). The very good agreements seen above may therefore be a result of mutual error cancellations or simulation code calibration. Furthermore, research in (Trellue et al., 2012) with coupled Monte Carlo burnup calculations and comparisons with data from post irradiation examinations concluded that the inventory of plutonium isotopes can be predicted within 2%–4% of measured values. This means, for example, that around the 100-year time mark, when Pu and other higher actinides dominate (Gauld and Ryman, 2000), decay heat uncertainty would have to be assumed to be of the same order given current knowledge.
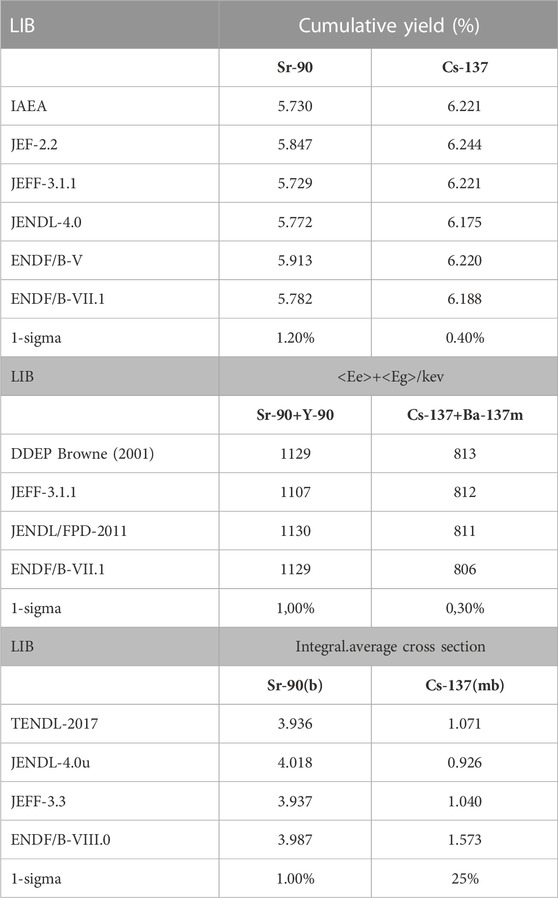
TABLE 1. Simple estimate of uncertainty regarding yield, decay energy (beta plus gamma emission) and neutron capture cross section of 137Cs and 90Sr of different microscopic data libraries. The “1-sigma” value is derived from the sample variance of each preceding column.
In (Radulescu et al., 2010) predictions by the SCALE code system for PWR spent fuel nuclide inventory were compared with results from radio-nuclide measurements. In this research a total of 118 fuel samples were analyzed and predictions for 61 nuclides were included. In Figure 7 the C/E ratios (calculated value E over experimentally measured C) are shown, for example, for 244Cm and 137Cs as a function of sample burnup. Variations between samples of similar burnup can be as large as variations between samples of large and small burnup and the range mainly lies within ±20%. Stated uncertainties from radio-chemical analysis are an order of magnitude smaller. The average of C/E values very well lies near 1.0 and this is the result of calibrating the total number of fission events with the 148Nd method in (Radulescu et al., 2010). For the therein considered cooling times and burnups the nuclides 137Cs and 137mBa contribute about 20% to the total decay heat. Given the size of the spread of C/E in Figure 7, it is surprising that the overall uncertainty of decay heat determination with SCALE was stated around 1%–2% in (Gauld, 2010; Ilas and Burns, 2021).
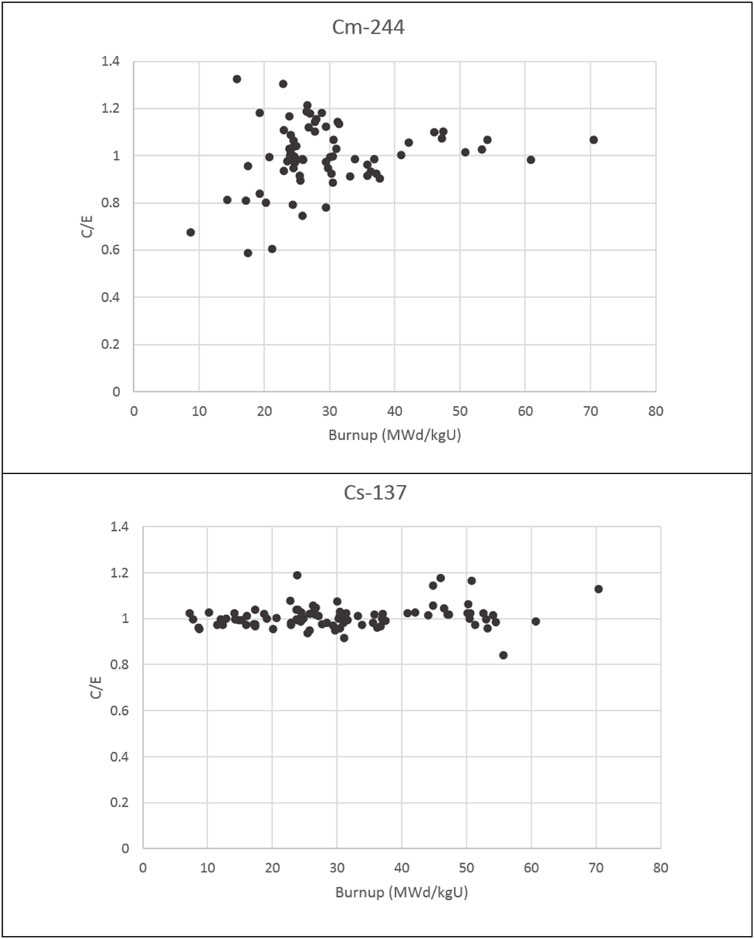
FIGURE 7. C/E values for 244Cm and 137Cs from (Radulescu et al., 2010).
Next, Figure 8 shows from our own calculations the impact of microscopic uncertainties for a series of simulations for 244Cm and 137Cs for a 50 MWd/kg PWR fuel obtained with the SAMPLER module from SCALE and the therein provided covariance information (Marshall, 2015). Variations are in the 1% range and hence corroborate the conclusions drawn in (Gauld, 2010; Ilas and Burns, 2021). The higher values obtained in (Shama et al., 2021; Shama et al., 2022) indicate that application of covariance information may require better standardization in code implementations and may still offer some unaccounted degrees of freedom.
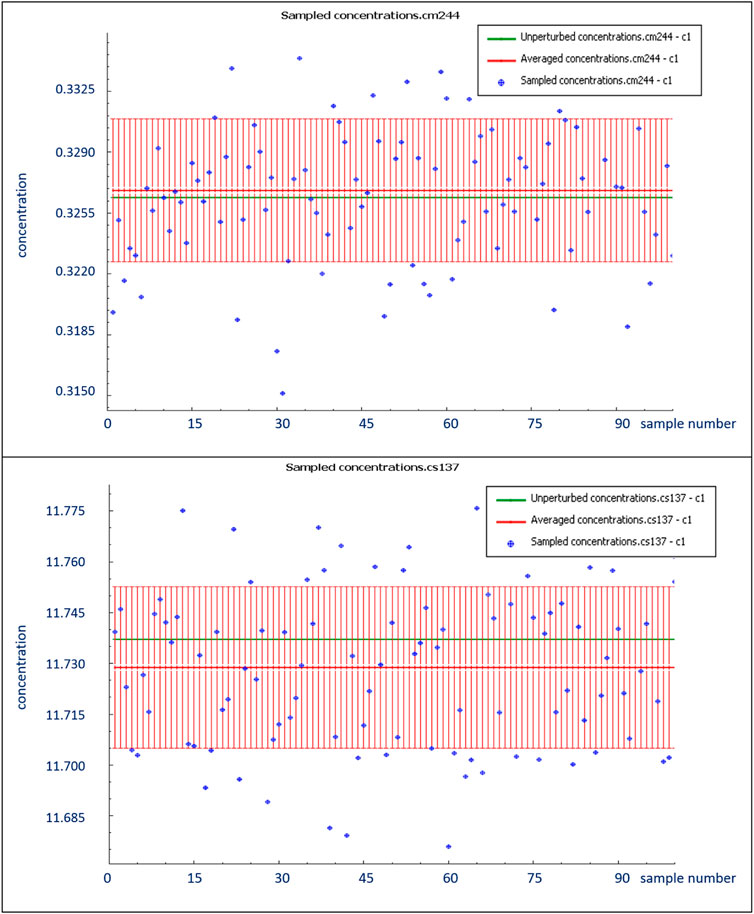
FIGURE 8. Estimating 244Cm and 137Cs concentration uncertainty (relative units) from microscopic data with SCALE’s SAMPLER module for a representative UO2 PWR fuel assembly at 50 MWd/kg.
Research in (NEA/NSC/WPNCS/DOC, 2011) made a detailed analysis of how the uncertainty of the boron concentration, of the fuel and moderator temperature, of the final burnup, of the initial 235U enrichment, of the fuel assembly pitch and of the type of fuel assembly neighbors affects C/E results for most relevant nuclides. Assuming expert guesses for plausible input parameter ranges the results showed that expected variations of C/E due to these factors for most nuclides are smaller than 5%. This means that the observed range of ±20% in C/E outcomes in Figure 7 is still difficult to explain with irradiation history uncertainty. The situation would be easier if observations would show a steady bias because numbers from some studies [e.g., (Rochman, 2018)] found that nuclear data uncertainties for 244Cm and 137Cs can contribute up to 9% and 7%. But this effect would not lead to fluctuations between samples and would show in first order as a constant offset.
Finally, some researchers have introduced the possibility of unrecognized sources of uncertainty (Capote et al., 2020) regarding evaluated nuclear data to address the issue that uncertainties based on existing covariance information sometimes appear to be inconsistent with experimentally observed variance of cross sections or results from
Taken all the above-mentioned results together, recommendations for further improvement of nuclide vector determination appear difficult. Ideally, calculation tools would be validated with dedicated experiments for nuclide vector determination which eliminate irradiation history uncertainties as much as possible. It is the responsibility of code developers to build an accurate microscopic model, while it is the responsibility of the code end-users to apply appropriate irradiation history uncertainties for their use case. However, dedicated irradiation experiments under known neutron field conditions and with different burnup points and fuel types are very expensive. This leaves the option to average results over many irradiated samples with similar burnup and thereby minimize random contributions from irradiation and experimental analysis. Alternatively, a subset of samples with high-quality core monitoring history may be pre-selected to reduce variance. It can also be useful to average results from multiple samples from a single fuel assembly to average out pellet-to-pellet variations. Integral tests like decay heat measurements are useful to enhance confidence in calculation codes but cannot validate them at future, unobservable time scales.
One near term improvement can be the better characterization of the properties of the C/E distribution for nuclide concentrations. Common approach is to assume a Gaussian distribution. This may be justified if C/E values would be repeatedly determined under similar boundary conditions. But in practice samples come from different reactors and are irradiated under different core loading schemes. Therefore, it is more prudent to a priori make no assumption about the type of C/E distribution.
A model-free approach does not make any more assumption than independence of individual C/E values and the existence of a probability distribution which does not change from measurement to measurement. Consider, for example, that there are
The sample mean is
An alternative perspective would be to consider the
From Eq. 2 it can be seen that the more samples are included, the better the true C/E is determined (which is interpreted as the persistent bias between microscopic model and measurement). In comparison, the number of samples has much less influence in Eq. 1. This means that under Eq. 1 the bounds are mainly determined by the worst sample or outlier. If the underlying distribution from which C/E values are drawn isn’t Gaussian, then the value
In the thin tailed domain, one usually assumes that variables are normally distributed (or some other function with finite mean and variance). Probability distribution parameters are assumed constant and universal for all samples. As an example, in Table 2 various statistical tests have been used to check if the null hypothesis (i.e., data is normal) should be rejected for the results in Figure 7. In this example p-values indicate for both 244Cm and 137Cs that the null hypothesis is not very likely.
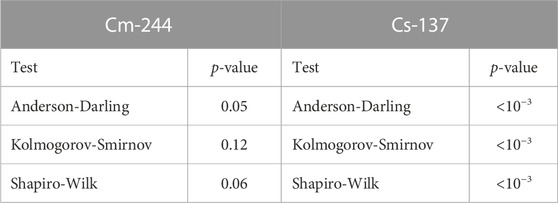
TABLE 2. Statistical tests to check if distribution of (C/E-1) for 244Cm and 137Cs in Figure 6 is consistent with a Gaussian distribution.
Mean excess plots (Embrechts et al., 1997) are an exploratory tool to analyze the tail behavior of random variables. Peak over threshold consideration is widespread in hydrology or actuarial practice to analyze events which are rare but nevertheless consequential. In the context of analyzing C/E values a mean excess plot can give indications about the type of outliers. If they are distributed thin tailed, a random combination of uncertainties is a likely reason. If outliers are thick tailed, it can be an indication of systematic model or experimental shortcomings. For example, if the “true” model
It is widely known that in the limit of large thresholds many distributions have a peak over threshold distribution which is described by a generalized Pareto distribution
In short, existing C/E data can be used for the preparation of a set of upper-order statistics and from it the characteristic of threshold exceedances can be deduced. For a given level
And it can be approximated by the following empirical formula:
Where
In Figure 9 the mean excess function plot of
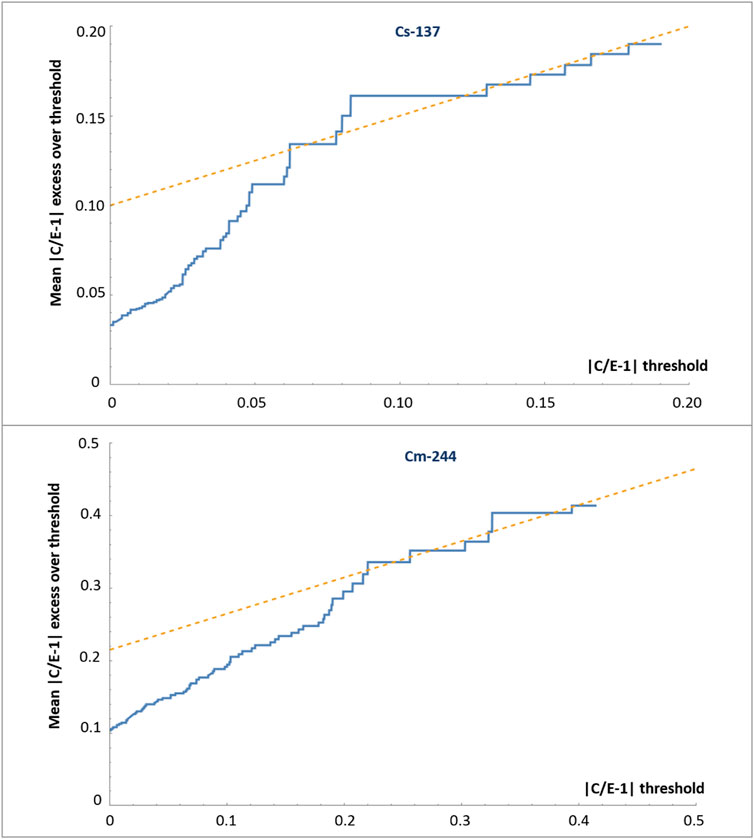
FIGURE 9. Distribution of excesses
In a thick tailed regime, any future experiment can significantly change the conclusions drawn from an existing measurement database to which a single, new result is added. This can trivially occur if the parameters of a distribution function are changing with time or place. Obviously, for code validation purposes the thin tailed regime is desirable: by accumulating results from experiment after experiment and using the central limit theorem, the systematic deviation of C/E from 1.0 is determined and will be used to modify codes or cross sections with empirical factors to improve agreement. For example, the path to 244Cm in UOX fuel is through neutron capture of 242Pu. In the thermal energy range most evaluations refer to capture cross sections from 1971 (Young et al., 1971) and 1966 (Auchampaugh et al., 1966) and in ENDF/B-VII.1 and JEFF-3.2 differ up to 20%. Due to its importance for backend activities this cross section would merit a reevaluation. Analysis in (Zu et al., 2016) also emphasized its important role for 244Cm generation. The review (Nobre, 2019) showed that for plutonium minor isotopes a range of new datasets exits which could be used to reevaluate current recommendations.
Besides a direct update of nuclear data through dedicated measurements there have been alternative proposals. For example, in (Koning, 2015) it has been suggested that a combination of information from measurements of nuclear data and from integral tests can be used in a process of Bayesian updating (Alhassan et al., 2020). This approach can give indications which segment update of nuclear data is most likely to yield better predictions for existing sets of integral tests. Segments of nuclear data which are not represented in these sets (like cooling times far beyond currently observable) do not profit from this approach.
5 Conclusion
The upcoming approval of some final repositories in northern Europe focusses attention on validation of source terms (decay heat, gamma and neutron emission, nuclide vectors) for time scales much larger than currently observable. To date major efforts have been put into validation of criticality safety, burnup credit and decay heat for operating nuclear facilities and for defense applications. Determination of confidence intervals for source terms not currently observable relies on the knowledge of uncertainties of the nuclide vector after irradiation. Consolidating existing efforts has been difficult because of inconsistent quality of irradiation histories, potential non-representativeness of small sample sizes from fuel assemblies, inconsistencies between different evaluated nuclear data files and sometimes outdated measurement status of microscopic data. This has led some regulators to adapt a thick tailed approach for code validation, i.e., using extremes of measurement-theory comparisons to determine conservative bounds. Further efforts are needed to create sets of high-quality irradiation data, more representative fuel assembly samples and improve nuclear data in some cases to exercise code validation in a thin tailed regime.
Data availability statement
The original contributions presented in the study are included in the article/supplementary material, further inquiries can be directed to the corresponding author.
Author contributions
All authors listed have made a substantial, direct, and intellectual contribution to the work and approved it for publication.
Funding
Co-funding from European Commission under Grant Agreement number 847593 of the EURAD research program is acknowledged.
Conflict of interest
Author MS was employed by PreussenElektra GmbH.
The remaining authors declare that the research was conducted in the absence of any commercial or financial relationships that could be construed as a potential conflict of interest.
The handling editor [OB] declared a shared research group [OECD NEA Working Party on Scientific Issues and Uncertainty Analysis of Reactor Systems (WPRS)] with the author [DR] at the time of review.
Publisher’s note
All claims expressed in this article are solely those of the authors and do not necessarily represent those of their affiliated organizations, or those of the publisher, the editors and the reviewers. Any product that may be evaluated in this article, or claim that may be made by its manufacturer, is not guaranteed or endorsed by the publisher.
References
Akiyama, M., and An, S. (1982). “Measurements of fission-product decay heat for fast reactors,” in Proc. Int. Conf. On nuclear data for science and technology (Belgium: Antwerp), 237–244.
Alhassan, E., Rochman, D., Sjostrand, H., Vasiliev, A., Koning, A., and Ferroukhi, H. (2020). Bayesian updating for data adjustments and multi-level uncertainty propagation within Total Monte Carlo. Ann. Nucl. Energy 139, 107239. doi:10.1016/j.anucene.2019.107239
ANSI/ANS-5.1-2005 (2005). ANSI/ANS-5.1-2005, decay heat power in light water reactors. Washington, DC: ANSI.
Shama, A., Rochman, D., Caruso, S., and Pautz, A. (2022). Validation of spent nuclear fuel decay heat calculations using Polaris, ORIGEN and CASMO5. Ann. Nucl. Energy 165, 108758. doi:10.1016/j.anucene.2021.108758
Auchampaugh, G. F., Bowman, C. D., Coops, M. S., and Fultz, S. C. (1966). Neutron total cross section of Pu242. Phys. Rev. 146, 840–843. doi:10.1103/physrev.146.840
Bahadir, T. (2020). “BEAVRS benchmark evaluation with CASMO5 and SIMULATE 5,” in Proceedings international conference on physics of reactors Cambridge, United Kingdom.
Bahadir, T., and Lindahl, S.-Ö. (2009). “Studsvik’s next generation nodal code Simulate-5,” in Proceedings of advances in nuclear fuel management IV, South Carolina, USA (South Carolina, USA.
Bell, M. J. (1973). Origen – the ORNL isotope generation and depletion code, ORNL-4628. Oak Ridge National Laboratory, Oak Ridge, TN, USA.
Bevard, B. B. (2009). Review of information for spent nuclear fuel burnup confirmation, NUREG/CR-6998. Oak Ridge, TN: Oak Ridge National Laboratory.
Brady, M. C. (1998). International studies on burn-up credit criticality safety by an OECD/NEA working group, intl. Conference on the physics of nuclear science and technology. NY: Long Island.
Broadhead, B. L., DeHart, M. D., and Ryman, J. C. (1995). Investigation of nuclide importance to functional requirements related to transport and long-term storage of LWR spent fuel. Oak Ridge National Laboratory. ORNL/TM-12742.
Brown, D. A., Chadwick, M. B., Capote, R., Kahler, A., Trkov, A., Herman, M., et al. (2018). ENDF/B-VIII.0: The 8th major release of the nuclear reaction data library with CIELO-project cross sections, new standards and thermal scattering data. Nucl. Data Sheets 148, 1–142. doi:10.1016/j.nds.2018.02.001
Browne, E. (2001). Report on the activities of the decay data evaluation project (DDEP), CEA-R-5990. Saclay. Available at: http://www.lnhb.fr/ddep_wg/.
Buckner, M. Q., Wu, C. Y., Henderson, R. A., Bucher, B., Chyzh, A., Bredeweg, T., et al. (2017). 242Pu absolute neutron-capture cross section measurement. EPJ Web Conf. 146, 11011. doi:10.1051/epjconf/201714611011
Buldyrev, S. V., Parshani, R., Paul, G., Stanley, H. E., and Havlin, S. (2010). Catastrophic cascade of failures in interdependent networks. Nature 464, 1025–1028. doi:10.1038/nature08932
Capote, R., Badikov, S., Carlson, A., Duran, I., Gunsing, F., and Neudecker, D. (2020). Unrecognized sources of uncertainties (USU) in experimental nuclear data. Nucl. Data Sheets 163, 191–227. doi:10.1016/j.nds.2019.12.004
Croff, A. G. (1980). ORIGEN2 – a revised and updated version of the Oak Ridge isotope generation and depletion code, ORNL-5621. Oak Ridge National Laboratory.
Dickens, J. K., Love, T. A., McConnell, J. W., and Peelle, R. W. (1981). Fission-product energy release for times following thermal-neutron fission of plutonium-239 and plutonium-241 between 2 and 14 000 s. Nucl. Sci. Eng. 78, 126–146. doi:10.13182/nse81-a20099
DIN-25463-1:1990-05 (1990). Decay heat power in nuclear fuels of light water reactors; non-recycled nuclear fuels. Berlin: DIN e.V.
Doran, H. R., Cresswell, A. J., Sanderson, D. C. W., and Falcone, G. (2022). Nuclear data evaluation for decay heat analysis of spent nuclear fuel over 1-100k year timescale. Eur. Phys. J. Plus 133, 665. doi:10.1140/epjp/s13360-022-02865-7
Embrechts, P., Klüppelberg, C., and Mikosch, T. (1997). Modelling extremal events for insurance and finance. Berlin: Springer-Verlag.
EURAD (2019). EURAD deployment plan 2019-2024. Available at: https://www.ejp-eurad.eu/sites/default/files/2020-01/4.%20EURAD%20Deployment%20Plan.pdf.
Eysemans, J., Verwerft, M., and Govers, K. (2022). REGAL international program: Analysis of experimental data for depletion code validation. Ann. Nucl. Energy 172, 109057.
Garber, D., Dunford, C., and Pearlstein, S. (1975). ENDF-102, data formats and procedures for the evaluated nuclear data file, ENDF, BNL-NCS-50496. Brookhaven National Laboratory.
Gauld, I. C., and Ryman, J. C. (2000). Nuclide importance to criticality safety, decay heating, and source terms related to transport and interim storage of high-burnup LWR fuel. NUREG/CR-6700.
Gauld, I. C. (2011). Uncertainties in predicted isotopic compositions for high burnup PWR spent nuclear fuel, NUREG/CR-7012. Oak Ridge, TN: Oak Ridge National Laboratory.
Gauld, I. C. (2010). Validation of SCALE 5 decay heat predictions for LWR spent nuclear fuel, NUREG/CR-6972. Oak Ridge, TN: Oak Ridge National Laboratory.
Geisser, S. (2019). “Predictive inference: An introduction,” in monographs on statistics and applied probability 55 (CRC Press).
Govers, K., Dobney, A., and Gysemans, M. (2015). “Technical scope of the REGAL base program revision 1.2,” in SCK CEN report SCK CEN-ER-110.
Hermann, O. W., and Westfall, R. M. (1990). ORIGEN-S: SCALE system module to calculate fuel depletion, actinide transmutation, fusion product buildup and decay, and associated radiation source terms. NUREG/CR-0200. Section F7.
Honeck, H. C. (1966). ENDF/B - specifications for an evaluated nuclear data file for reactor applications, BNL-50066. Brookhaven National Laboratory.
IAEA-TECDOC-1241 (2001). Implementation of burnup credit in spent fuel management systems. Vienna: International Atomic Energy Agency.
Ilas, G., and Burns, J. R. (2021). SCALE 6.2.4 validation for light water reactor decay heat analysis. Nucl. Tech. 208 (3), 403–413. doi:10.1080/00295450.2021.1935165
Ilas, G., and Gauld, I. C. (2008). SCALE analysis of CLAB decay heat measurements for LWR spent fuel assemblies. Ann. Nucl. Energy 35, 37–48. doi:10.1016/j.anucene.2007.05.017
Ilas, G., Gauld, I. C., Difilippo, F. C., and Emmett, M. B. (2010). Analysis of experimental data for high burnup PWR spent fuel isotopic validation - calvert cliffs, takahama, and three mile island reactors, NUREG/CR-6968. Oak Ridge, TN: Oak Ridge National Laboratory.
Ilas, G., Gauld, I. C., and Murphy, B. D. (2010). Analysis of experimental data for high burnup PWR spent fuel isotopic validation - ARIANE and REBUS programs UO2 fuel, NUREG/CR-6969. ORNL, Tenn.
Ilas, G., and Liljenfeldt, H. (2017). Decay heat uncertainty for BWR used fuel due to modeling and nuclear data uncertainties. Nucl. Eng. Des. 319, 176–184. doi:10.1016/j.nucengdes.2017.05.009
International Handbook (2016). International Handbook of evaluated criticality safety benchmark experiments. Paris, France: Nuclear Energy Agency/OECD. NEA/NSC/DOC(95)03.
International Reactor Physics Evaluation Project Handbook (2021). International reactor physics evaluation project Handbook. Paris: Nuclear Energy Agency.
J Koning, A., and Rochman, D. (2008). Towards sustainable nuclear energy: Putting nuclear physics to work. Ann. Nucl. Energy 35 (11), 2024–2030. doi:10.1016/j.anucene.2008.06.004
Koning, A. J. (2015). Bayesian Monte Carlo method for nuclear data evaluation. Eur. Phys. J. A 51, 184. doi:10.1140/epja/i2015-15184-x
Machiels, A. (2011). “Benchmarks for quantifying fuel reactivity depletion uncertainty,” in EPRI report, 1022909.
Majdandzic, A., Podobnik, B., Buldyrev, S. V., Kenett, D. Y., Havlin, S., and Eugene Stanley, H. (2013). Spontaneous recovery in dynamical networks. Nat. Phys. 10, 34–38. doi:10.1038/nphys2819
Marshall, W. J. (2015). “Development and testing of neutron cross section covariance data for SCALE 6.2,” in Proceedings of international conference on nuclear criticality safety Charlotte, NC.
Michel-Sendis, F., Gauld, I., Martinez, J., Alejano, C., Bossant, M., Boulanger, D., et al. (2017). SFCOMPO-2.0: An OECD/NEA database of spent nuclear fuel isotopic assays, reactor design specifications, and operating data. Ann. Nucl. Energy 110, 779–788. doi:10.1016/j.anucene.2017.07.022
Ministry of the Environment (2022). Press release from Ministry of the Environment, Government to permit final disposal of spent nuclear fuel at Forsmark. 27.01. Available at: https://www.government.se/press-releases/2022/01/government-to-permit-final-disposal-of-spent-nuclear-fuel-at-forsmark/.
Murphy, M. F., Perret, G., and Koberl, O. (2010). “Large-scale irradiated fuel experiments at proteus research program,” in Proceedings international conference on physics of reactors (USA: Pittsburg).
NEA (2012). “Burnup credit criticality safety benchmark – phase VII,” in UO2 Fuel: Study of spent fuel compositions for long-term disposal, NEA No. 6998 (Paris, France: Nuclear Energy Agency/OECD).
NEA/NSC/WPNCS/DOC (2011). Spent nuclear fuel assay data for isotopic validation, State-of-the-art report. Paris: Nuclear Energy Agency/OECD. DOC(2011)5.
NEA/WPEC-25 (2007). International evaluation cooperation volume 25, Assessment of fission product decay data for decay heat calculations. Paris: Nuclear Energy Agency/OECD. Report NEA no. 6284.
Nobre, G. (2019). Assessment of the current status of cross-section evaluations of plutonium minor isotopes, BNL-211652-2019-INRE. Brookhaven National Laboratory.
Plompen, A. J. M. (2020). The joint evaluated fission and fusion nuclear data library, JEFF-3.3. Eur. Phys. J. A 56 (181).
Posiva (2021). Press release from Posiva Oy, Excavation of world's first final deposition tunnels starts in Posiva's ONKALO facility. 07.05. Available at: https://www.posiva.fi/en/index/news/pressreleasesstockexchangereleases/2021/excavationofworldsfirstfinaldepositiontunnelsstartsinposivasonkalofacility.html.
Radulescu, G., Gauld, I. C., and Ilas, G. (2010). SCALE 5.1 predictions of PWR spent nuclear fuel isotopic compositions. Oak Ridge, TN: Oak Ridge National Laboratory. ORNL/TM-2010/44.
Rearden, B. T., and Jessee, M. A. (2017). SCALE code system, ORNL/TM-2005/39. Oak Ridge, TN: Oak Ridge National Laboratory. Version 6.2.
Rhodes, J., Smith, K., and Lee, D. (2006). “CASMO-5 development and applications,” in Proceedings of the PHYSOR-2006 conference Vancouver, BC Canada.
Rhodes, J., Xu, Z., and Lee, D. (2009). “Benchmarking of CASMO-5 ENDF/B-vii nuclear data against critical experiments,” in Advances in nuclear fuel management IV (USA: South Carolina).
Rimpler, A. (2002). Bonner sphere neutron spectrometry at spent fuel casks. Nucl. Instrum. Methods Phys. Res. Sect. A Accel. Spectrom. Detect. Assoc. Equip. 476, 468–473. doi:10.1016/s0168-9002(01)01492-9
Rochman, D., Leray, O., Hursin, M., Ferroukhi, H., Vasiliev, A., Aures, A., et al. (2017). Nuclear data uncertainties for typical LWR fuel assemblies and a simple reactor core. Nucl. Data Sheets 139, 1–76. doi:10.1016/j.nds.2017.01.001
Rochman, D., and Sciolla, C. (2014). Nuclear data uncertainty propagation for a typical PWR fuel assembly with burnup. Nuc. Eng. Tech. 46, 353–362. doi:10.5516/net.01.2014.712
Rochman, D. (2018). Uncertainties for Swiss LWR spent nuclear fuel due to nuclear data. EPJ Nucl. Sci. Technol. 4 (6), 170054.
Rochman, D., Vasiliev, A., Ferroukhi, H., and Hursin, M. (2021). Analysis for the ARIANE GU1 sample: Nuclide inventory and decay heat. Ann. Nucl. Energy 160, 108359. doi:10.1016/j.anucene.2021.108359
Rochman, D., Vasiliev, A., Ferroukhi, H., Hursin, M., Ichou, R., Taforeau, J., et al. (2021). Analysis for the ARIANE GU3 sample: Nuclide inventory and decay heat. EPJ Nucl. Sci. Technol. 7 (14), 14. doi:10.1051/epjn/2021013
Rochman, D., Vasiliev, A., Ferroukhi, H., Zhu, T., van der Marck, S., and Koning, A. (2016). Nuclear data uncertainty for criticality-safety: Monte Carlo vs. linear perturbation. Ann. Nucl. Energy 92, 150–160. doi:10.1016/j.anucene.2016.01.042
Rose, P. F., and Dunford, C. L. (1990). ENDF-102, data formats and procedures for the evaluated nuclear data file, ENDF-6, BNL-NCS-44945. Brookhaven National Laboratory.
Salvatores, M., Palmiotti, G., Aliberti, G., Hiruta, H., McKnight, R., Oblozinsky, P., et al. (2008). Needs and issues of covariance data application. Nucl. Data Sheets 109, 2725–2732. doi:10.1016/j.nds.2008.11.001
Sanchez, R., Cutler, T., Goda, J., Grove, T., Hayes, D., Hutchinson, J., et al. (2021). A new era of nuclear criticality experiments: The first 10 Years of planet operations at NCERC. Nucl. Sci. Eng. 195, S1–S16. doi:10.1080/00295639.2021.1951077
Saylor, E. M., Marshall, W. J., and Clarity, J. B. (2018). Criticality safety validation of SCALE 6.2.2. Oak Ridge National Laboratory. ORNL/TM-2018/884.
Schillebeeckx, P., Verwerft, M., and Zerovnik, G. (2020). A non-destructive method to determine the neutron production rate of a sample of spent nuclear fuel under standard controlled area conditions. JRC Technical Report JRC121586.
Schmittroth, F., and Schenter, R. E. (1977). Uncertainties in fission product decay-heat calculations. Nucl. Sci. Eng. 63, 276–291. doi:10.13182/nse77-a27040
Schmittroth, F. (1976). Uncertainty analysis of fission-product decay-heat summation methods. Nucl. Sci. Eng. 59, 117–139. doi:10.13182/nse76-a15684
Shama, A., Rochman, D., Pudollek, S., Caruso, S., and Pautz, A. (2021). Uncertainty analyses of spent nuclear fuel decay heat calculations using SCALE modules. Nucl. Eng. Technol. 53, 2816–2829. doi:10.1016/j.net.2021.03.013
Shibata, K., Iwamoto, O., Nakagawa, T., Iwamoto, N., Ichihara, A., Kunieda, S., et al. (2011). JENDL-4.0: A new library for nuclear science and engineering. J. Nucl. Sci. Technol. 48 (1), 1–30. doi:10.1080/18811248.2011.9711675
Simeonov, T., and Wemple, C. (2017). “Update and evaluation of decay data for spent nuclear fuel analyses,” in Proceedings of the international conference on nuclear data for science and technology (Belgium: Bruges), 09011.
Sirakov, I., Capote, R., Gritzay, O., Kim, H. I., Kopecky, S., Kos, B., et al. (2017). Evaluation of cross sections for neutron interactions with 238U in the energy region between 5keV and 150keV. Eur. Phys. J. A 53, 199. doi:10.1140/epja/i2017-12394-2
SKB (2006). SKB report R-05-62, Measurements of decay heat in spent nuclear fuel at the Swedish interim storage facility. Stockholm: Clab.
SKB (2011). SKB Technical Report TR-11-01, Long-term safety for the final repository for spent nuclear fuel at Forsmark, Main report of the SR-Site project. Stockholm.
SKB (2017). SKB Technical Report TR-17-02, Basis for fees and guarantees for the period 2018–2020. Stockholm.
Solans, V., Rochman, D., Ferroukhi, H., Vasiliev, A., and Pautz, A. (2020). Loading optimization for Swiss used nuclear fuel assemblies into final disposal canisters. Nucl. Eng. Des. 370 (15), 110897. doi:10.1016/j.nucengdes.2020.110897
Tanskanen, A. (2000). Assessment of the neutron and gamma sources of the spent BWR fuel. Helsinki: STUK report STUK-YTO-TR. 170.
Trellue, H. R., Fensin, M. L., and Galloway, J. D. (2012). Production and depletion calculations using MCNP, LA-UR-12-25804. Los Alamos, NM.
Yamamoto, T., and Iwahashi, D. (2016). Validation of decay heat calculation results of ORIGEN2.2 and CASMO5 for light water reactor fuel. J. Nucl. Sci. Technol. 53, 2108–2118. doi:10.1080/00223131.2016.1183528
Young, T. E., Simpson, F., and Tate, R. E. (1971). The low-energy total neutron cross section of plutonium-242. Nucl. Sci. Eng. 43, 341–342. doi:10.13182/nse71-a19980
Zerovnik, G. (2018). Observables of interest for the characterization of spent nuclear fuel. Luxembourg: JRC Technical Report JRC 112361.
Keywords: spent (nuclear) fuel, light water reactor (LWR), decay heat, source term, deep geological disposal
Citation: Seidl M, Schillebeeckx P and Rochman D (2023) Note on the potential to increase the accuracy of source term calculations for spent nuclear fuel. Front. Energy Res. 11:1143312. doi: 10.3389/fenrg.2023.1143312
Received: 12 January 2023; Accepted: 20 March 2023;
Published: 05 April 2023.
Edited by:
Oliver Buss, Organisation for Economic Co-Operation and Development, FranceReviewed by:
Axel Hoefer, Independent Researcher, Karlstein am Main, GermanyWilliam Wieselquist, Oak Ridge National Laboratory (DOE), United States
Copyright © 2023 Seidl, Schillebeeckx and Rochman. This is an open-access article distributed under the terms of the Creative Commons Attribution License (CC BY). The use, distribution or reproduction in other forums is permitted, provided the original author(s) and the copyright owner(s) are credited and that the original publication in this journal is cited, in accordance with accepted academic practice. No use, distribution or reproduction is permitted which does not comply with these terms.
*Correspondence: Marcus Seidl, bWFyY3VzLnNlaWRsQGVvbi5jb20=