 Li Wang
 Jian Zhao
 Xiangwu Xia1,2
- 1College of Electrical Engineering, Shanghai University of Electric Power, Shanghai, China
- 2China Coal Technology and Engineering Group Shanghai Company Limited, Shanghai, China
- 3Huzhou Power Supply Company of State Grid Zhejiang Electric Power Company Limited, Huzhou, China
The rapid development of renewable energy generation aggravates the imbalance between supply and demand in power grid, and exploring the potential of demand side resource can effectively improve such problems. Industrial users (IU) is an important demand response resource of power grid, and mining the load patterns of IU is the basis of studying the demand response ability of IU, which plays an important role in the safe operation and lean management of power grid. Lately, the popularity of advanced metering infrastructures provides data support for studying the load patterns of IU. However, the high dimensionality and the complex non-linear relationship of IU’s load data bring difficulties to the task of clustering. To solve the above problems, this paper proposes a load pattern extraction method based on multidimensional electrical consumption feature construction. Firstly, industrial load characteristic set of IU is created with five load characteristic indexes weighted by improved entropy weight method. In addition, convolutional autoencoder is established to extract the temporal feature of industrial load data which is combined with industrial load characteristic set to build a multidimensional feature set (MFS) for IU and finish multidimensional electrical consumption feature construction (MECFC). Then, MFS is used as the input of Self-Organization Map network to select the initial clustering centers of K-means algorithm, overcoming the problem of local optimal solution, and complete the IU daily load clustering. The experiment shows that the algorithm based on MECFC solves the local optimal problem and have better performance in stability and clustering effect than traditional methods.
1 Introduction
In recent years, in order to solve the energy crisis and environmental pollution caused by traditional energy, the proportion of all kinds of renewable energy generation on the power supply side has been increasing (Gupta and Singh, 2022). Due to the intermittency and randomness of renewable energy power generation, the imbalance between power supply and demand in peak season is further aggravated. Therefore, it has become an urgent problem to explore the potential of demand side response (Zhang and Gu, 2016). Compared with other types of users such as residents and businesses, industrial users have advantage in large power consumption, stable load and easy management, so it is seen as an important demand side response resource of power grid (Hou and Xing, 2020; Jiang, et al., 2021). Industrial users can sign contracts with power companies to participate in load response, peak cutting and valley filling, etc., to help rational distribution of power resources and promote stable operation of the power grid (Xu and Lai, 2015; Dai et al., 2022). However, as there are a large number of industrial users with different power consumption characteristics and demand side response capabilities, it is difficult to achieve individual modeling analysis for every user. In order to solve this problem, it is necessary to extract the typical power consumption mode of industrial users from the massive load data, classify users with similar power consumption patterns into the same cluster, and formulate appropriate load control schemes for different groups, so as to improve the operational quality and efficiency of the power grid and promote the lean management of demand side (Shi, et al., 2017; Dehghan-Dehnavi, et al., 2020).
With the advance of the digital construction of power grid and the advanced measuring system, the popularization of advanced metering infrastructure (AMI), the power grid has stored massive load data of industrial users (Wang, et al., 2016). The emergence of a large amount of industrial electricity information provides data support for the research of load patterns, which is of great importance for load forecasting (Huang, et al., 2020), abnormal electricity detection (Zhang et al., 2020), demand side management (Bañales, et al., 2021), etc. Load clustering is an important method to extract typical electricity consumption patterns of users. It divides similar data into the same class and obtains several disjoint clusters by mining potential connections in load data (Deng, et al., 2021). According to different types of input, load clustering can be divided into direct clustering and indirect clustering. Direct clustering takes the original load data as the input of the clustering algorithm. (Al-Wakeel and Wu, 2016; Panapakidis, et al., 2017; Xu, et al., 2020). separately adopts the improved K-means algorithm, the improved fuzzy C-means algorithm and the improved spectral clustering algorithm respectively to achieve the clustering of daily load curve. Direct clustering method is simple and easy to interpret, but it challenges the computational efficiency by placing the clustering task in high dimensional space (Fang, et al., 2022).
Indirect clustering firstly uses dimensionality reduction technology to reduce user load data dimensionality and takes low dimensionality data as input for clustering algorithm. In indirect clustering, how to obtain the low dimensional features that can represent the power consumption characteristics of users through dimensionality reduction method is the focus of current research. In (Song, et al., 2019), six characteristic indicators of daily load curve were selected manually to reduce the dimensionality of daily load curve. However, the selection of such characteristic indicators is subjective and difficult to describe the temporal characteristics of load data. In (Lin, et al., 2017), piecewise aggregate approximation method was used to achieve data dimensionality reduction, and then spectral clustering was used in load classification. In (Koivisto, et al., 2012), Principal Component Analysis (PCA) and K-means algorithm were used for clustering. However, PCA belongs to linear dimension reduction method and is difficult to consider complex non-linear relations in time series data. In (Tian, et al., 2014; Ryu, et al., 2019; Duan, et al., 2021), autoencoder (AE) is used to learn the depth representation of load data, and then K-means or spectral clustering method takes it as the input to obtain clustering results.
K-means algorithm is a classic classification and clustering method, which has the advantages of simple operation, high efficiency and strong interpretability, and is widely used in electrical engineering. However, the K-means algorithm needs to manually set the clustering number and initial clustering center. If the initial clustering center is not selected properly, local convergence will be easily caused and the clustering effect will be affected (Si et al., 2021). In view of the above problems, Nikolaos et al. (2015) combines kernel method with K-means algorithm to improve the clustering effect, but there are problems such as long running time and artificial setting of kernel function parameters (Xu et al., 2015; Ai et al., 2020). Uses Hierarchical K-means to establish a hierarchical structure of massive data and select initial clustering centers for K-means to avoid the local convergence problem caused by random selection of initial clustering centers. Xu et al. (2017) selects the initial clustering center of K-means algorithm by calculating the data density, but the accuracy of selecting the initial clustering center only based on the data density is limited.
In order to extract the low dimensional characteristics of industrial users and effectively solve the local optimal solution in the traditional k-means method. This paper proposes a load pattern extraction method based on multidimensional electrical consumption feature construction (MECFC). Firstly, five indexes such as daily load rate and daily peak-valley difference number of industrial users were calculated, and each index was weighted with the improved entropy weight method to form an industrial load characteristic set indicating industrial users power consumption characteristics. In addition, Convolutional Auto-Encoder (CAE) is used to extract the temporal features of the industrial load data, and the multidimensional electrical consumption feature set of industrial users is constructed by combining the temporal features with industrial load characteristic set to solve the problem of high dimensionality of the industrial load data. Then, in order to solve the local optimal problem caused by the random selection of initial clustering center in the traditional K-means algorithm, the SK (SOM K-means) algorithm is proposed. The algorithm selects the initial clustering center of K-means algorithm by establishing Self-Organization Map (SOM) neural network to calculate the local density and distance attributes of nodes. Finally, taking the data set of industrial users in Zhejiang province as an example, the proposed method is compared with the traditional clustering method, which proves that the proposed method has certain advantages in clustering effect, operating efficiency and algorithm stability.
2 Industrial load characteristic set for industrial users
2.1 Load data preprocessing
Let
2.1.1 Missing data processing
Where
2.1.2 Outlier detection
In addition to the condition of missing data, the load data may also be abnormal due to the failure of the measuring device. For this situation, this paper uses the horizontal similarity detection method to identify the bad data.
Assume that
where a1 and b1 respectively represent the number of points taken forward and backward. In this paper, a1 = b1 = 5.
2.1.3 Data normalization
Since the power values of loads of different industrial users may be quite different, in order to better quantify the similarity between data and improve the accuracy of subsequent multidimensional power characteristics acquisition, the load data should be processed by Min-Max standardization:
where
2.2 Load characteristic indexes for industrial users
The power consumption characteristics of industrial users indicate the characteristics and properties of industrial users in the habit of using electricity, which can be described by the load characteristic indexes. In this paper, daily load rate
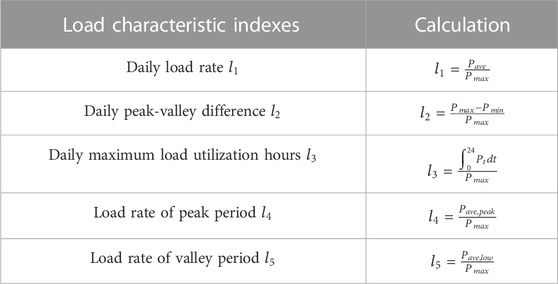
TABLE 1. Load characteristic indexes of industrial users.
In Table 1,
The above indexes describe the power consumption characteristics of industrial users from different degrees, and their degree of emphasis and importance varies. Therefore, it is necessary to set the weight coefficient of the load characteristic indexes so that they can objectively describe the importance of each index. In this paper, entropy weight method is used to determine the weights of different indexes. The specific steps are as follows: firstly, the entropy of each index needs to be calculated. Given that the index quantity to be weighted is 5 and the daily load data quantity is m, the entropy calculation formula of the c index is as follows:
where
According to the calculated entropy value of each index, the improved entropy weight calculation formula is adopted to calculate the corresponding weight value of each index. The weight calculation formula of the cth index is as follows:
The calculated weights are assigned to the above five power consumption characteristics indexes, and the above indexes are combined to form the industrial load characteristic set
3 Multidimensional electrical consumption feature construction for industrial users
The above five load characteristic indexes are artificially specified, which are subjective and difficult to represent the complex temporal relationship in the load curve. In order to improve the effect of industrial load clustering, it is necessary to consider the time sequence characteristics of load data and extract temporal features of industrial user load data. Traditional feature extraction method, such as Principal Component Analysis (PCA) or Independent Component Analysis (ICA), is difficult to mine the non-linear relationship between the data. Auto-Encoder (AE) is an unsupervised learning algorithm, which is composed of input layer, hidden layer and output layer, and belongs to a kind of neural network (Liu, et al., 2017). CAE uses convolution layer and pooling layer to replace the fully connected layer in traditional autoencoders, and its structure is shown in Figure 1. Due to weight sharing in the convolutional layer, the number of training parameters in CAE is less than that in the fully connected layer, which reduces the overfitting situation and speeds up the training speed, and is suitable for processing more complex high-dimensional data.
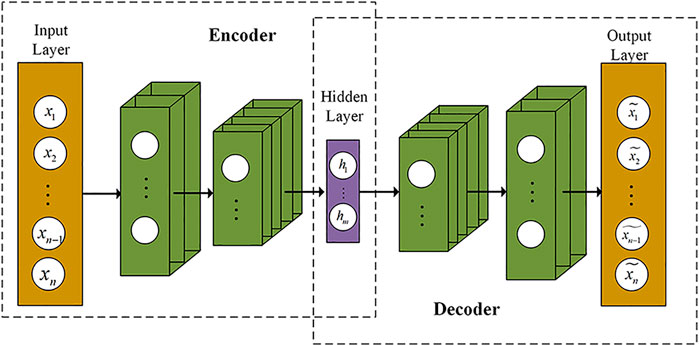
FIGURE 1. Convolutional auto-encoder network structure.
Formula 7 represents the CAE encoding process. Where We represents the one-dimensional encoder convolution kernel;
Formula 8 represents the CAE decoding process. Where Wd represents the one-dimensional decoder convolution kernel;
In this paper, Mean-square Error (MSE) is used as the CAE training loss function. CAE learns the optimal network parameters by minimizing the loss function, so that the reconstructed data
The low-dimensional feature vector H in CAE hidden layer is extracted as the temporal feature of industrial user load data, and is combined with the industrial load characteristic set L to form the multidimensional feature set C, and finish the multidimensional electrical consumption feature construction,
4 Industrial user load clustering based on SK algorithm
4.1 Introduction to SK algorithm
When traditional K-means method deals with clustering tasks, it will encounter two problems: 1) It is difficult to determine the initial clustering center; 2) The number of clustering k is difficult to determine. Rodriguez and Laio (2014) proposes two assumptions in the density peak clustering algorithm: 1) Clustering center generally has a large local density, that is, there are a large number of sample points around it; 2) The distance between different clustering centers is far. Based on the above two assumptions, this paper proposes a clustering algorithm based on SK algorithm. Firstly, SOM network is established to obtain the mapping relationship between daily load data and output layer nodes, then the local density of output layer nodes and the distance attribute of each node are calculated, and the initial clustering center of K-means algorithm is selected according to the two attributes of output layer nodes to improve the clustering performance of industrial users’ load.
4.2 Initial clustering center determination based on SOM network
SOM is an important unsupervised learning method, which is often used in clustering, high dimensional visualization, data compression, feature extraction and so on. SOM is essentially a double-layer neural network, consisting of an input layer and an output layer. The relationship between the output layer nodes and the input data is established through a competitive learning process, where each node competes to be the closest match to a given input data point. The output layer notes have the same dimension as the input data, and its network structure is shown in Figure 2.
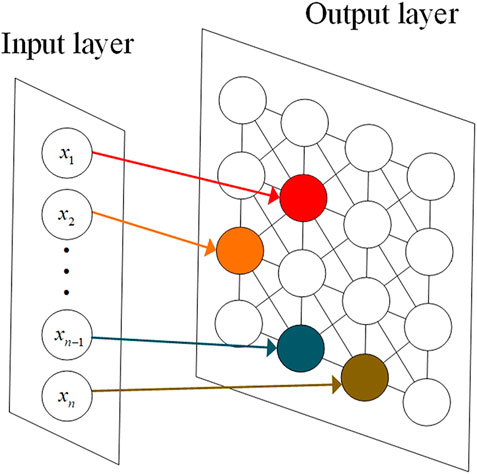
FIGURE 2. SOM network structure.
In this paper, the specific steps to select the initial clustering center based on SOM are described as follows:
1) Establish self-organizing mapping neural network.
SOM network is constructed with multidimensional feature set C for industrial users as input. The number of samples is set as m, and the dimension of samples is set as f. Set the number of neurons in the input layer as m and the number of nodes in the output layer as M*N, and M = N = 4. And randomly initialize the weight of neurons in the output layer
2) Traversing every node in the output layer to find the winning node.
Read
3) Calculate the weight updating amplitude G of each node.
Set the weight update amplitude at the winning node as 1. Based on the Gaussian kernel function, the update amplitude of all nodes is calculated according to the distance between each node and the winning node. The calculation formula is as follows:
where
where
4) Update the weight W of each node.
After the weight updating amplitude G of each node is obtained, the weight value of the winning node and its domain node is updated. The node weight updating formula is as follows:
Where
where
5) Repeat steps 2-4 until the number of iterations reaches maxstep, and the weight matrix of each node in the output layer is obtained after the training is completed.
6) Calculate the local density
According to the weight matrix of nodes
7) Calculate the distance attribute
In order to facilitate calculation, the weight matrix
If the node
8) Select the K-means initial clustering center.
Calculate the local density
4.3 Determine the number of clusters
The K-means algorithm needs to set the clustering number k artificially. If the value of k is improperly selected, the clustering effect will be adversely affected. In this paper, by observing DBI and SC under different number of clusters, k value with smaller DBI value and larger SC index value is selected as the number of experimental clusters. DBI and SC calculation formulas are detailed in Section 4.4.
4.4 Clustering performance evaluation
Load clustering expects each type of curve to have high intra-class similarity and low inter-class similarity (Zhang, et al., 2015). In this paper, Calinski-Harabasz Index (CHI), Davies-Bouldin Index (DBI) and the Silhouette Coefficient (SC) are used as indicators to evaluate the load clustering performance.
4.4.1 Calinski-harabasz index (CHI)
The CHI calculates the ratio between the degree of inter-cluster dispersion and the degree of intra-class dispersion. The larger the CHI is, the greater the intra-class similarity and the smaller the inter-class similarity, that is, the better the clustering performance. The calculation formula of CHI is as follows:
where
The calculation formulas of inter-class variance
where
4.4.2 Davies-bouldin index (DBI)
DBI describes the tightness of data in the same cluster, and the smaller the value, the lower degree of dispersion and the better the clustering performance. The formula for calculating DBI is as follows:
Where
4.4.3 Silhouette coefficient (SC)
SC combined with two factors of cohesion and separation degree, describes the definition of contour of each category after clustering, and the larger the value, the better the clustering performance.
where
4.4.4 The overall process of industrial users load pattern extraction
Figure 3 is a detailed algorithm flow chart of the proposed load pattern extraction method of typical power consumption modes of industrial users based on multidimensional electrical consumption feature construction and SK algorithm.
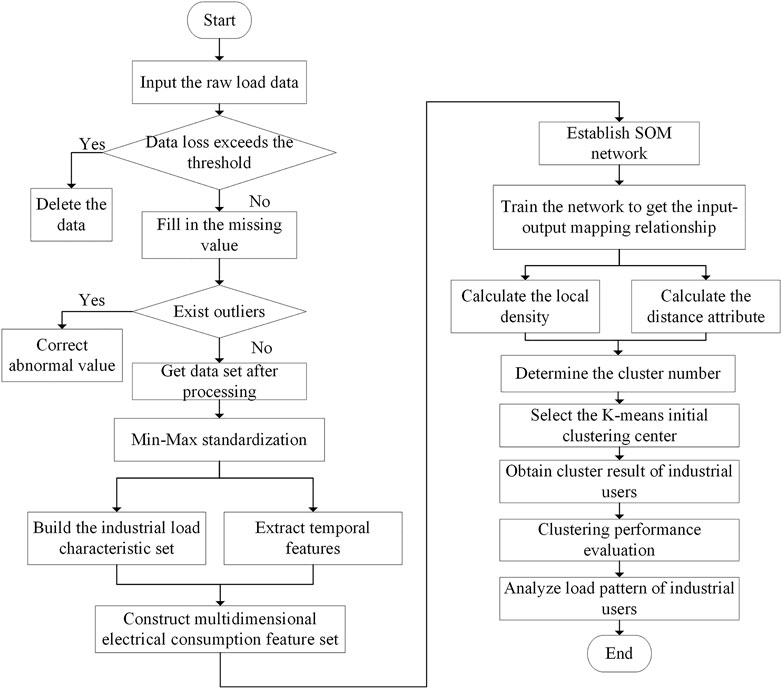
FIGURE 3. Flow chart of industrial load clustering.
5 Example analysis
5.1 Experimental data
After data preprocessing, this paper selects the winter typical daily load data of 574 industrial users in a district of Zhejiang Province, China in 2020 for cluster analysis. The daily load data is collected every 15 min, that is, 96 points a day. The total daily load curve is shown in Figure 4. Experiments in this paper were carried out in python 3.8.5, AMD Ryzen 7 4800H with Radeon Graphics 2.90 GHz environment.
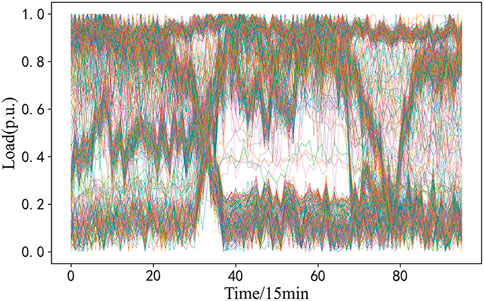
FIGURE 4. Total daily load curve of industrial users.
5.2 Construct multidimensional electrical consumption feature set
According to Table 1, the power consumption characteristic index of industrial users is calculated, and the weight vector W1 of users is calculated with the entropy weight method. The CAE takes 96*1 daily load data as input. The encoder consists of five convolutional layers, the number of convolutional cores is 16, 32, 64, and 128, the size of convolutional kernel is 3, and the step size is 2, 1, 2, and 2. Finally, 12-dimensional sequences are output in the hidden layer. After that, five deconvolution layers are used to reconstruct the data. The number of deconvolution layers’ kernels is 64, 32, 16, and 1, the size of the convolution kernels is 3, and the step size is 2, 1, 2, and 2, respectively. Adam optimizer is used in the training process. The training times are 300 and the batch size is 8. CAE network parameters are shown in Table 2. After the training is completed, the hidden layer sequence is taken as the temporal feature of the load data of industrial users, and combined with industrial load characteristic set of industrial users, the multidimensional feature set of industrial users is obtained as the input of the SK algorithm.
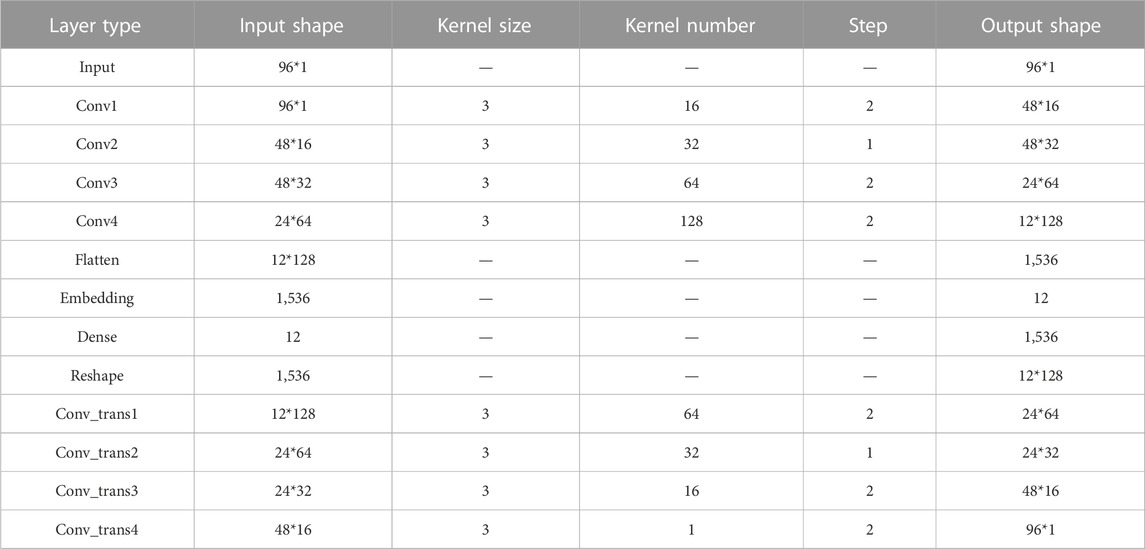
TABLE 2. Network structure of CAE.
5.3 Determination of optimal clustering number and selection of initial clustering center
In this paper, the number of clusters is changed from 2 to 12 to observe DBI and SC under different number of clusters. The change curve of DBI and SC is shown in Figure 5. When the number of clusters k = 4, the DBI value is small and the SC value is large, so the optimal cluster number of industrial users is taken as 4.
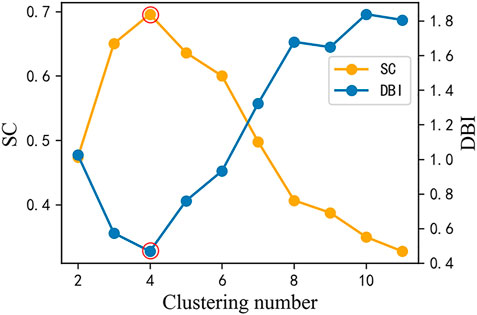
FIGURE 5. SC and DBI curve of industrial users.
SOM network is established and local density ρ and distance attribute γ of output layer nodes are calculated. In order to directly reflect the local density and distance attribute of each node in the output layer, the heat map of each node attribute is drawn in Figure 6. The darker the color in the figure, the larger the local density and distance attribute value of the node. The figure shows that the node W1,4, W3,4, W4,1 and W4,2 are the four nodes with large ρ and γ at the same time, so the four nodes are selected as the initial clustering center of the k-means algorithm.
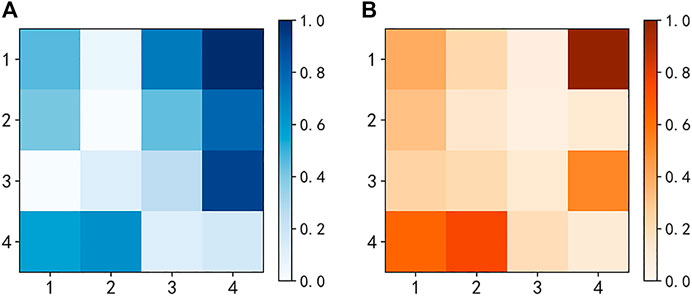
FIGURE 6. Heat map of SOM output layer nodes: (A) Local density; (B) Distance attribute.
5.4 Analysis of typical load pattern of industrial users
Figure 7 shows the clustering result diagram of industrial users, indicating typical load patterns of industrial users in this area. According to the clustering results, it can be seen that there are four typical power consumption modes for users in this area, and the peak load time, peak-valley difference and fluctuation rate are different among all types. Therefore, it is necessary to analyze each power consumption mode and formulate appropriate load management strategies.
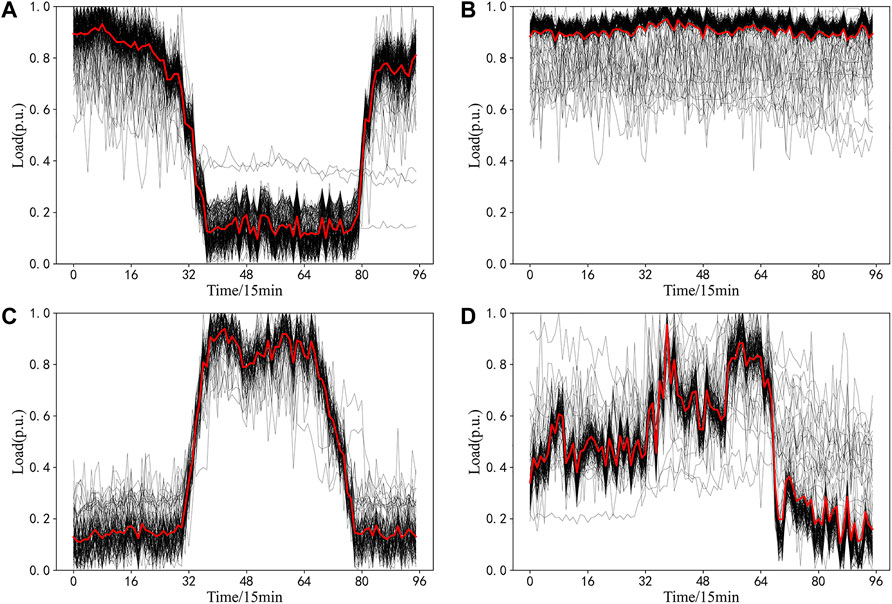
FIGURE 7. Industrial users daily load clustering result diagram: (A) Typical load pattern 1; (B) Typical load pattern 2; (C) Typical load pattern 3; (D) Typical load pattern 4.
Typical load pattern mode 1 of industrial users belongs to peak-avoiding load. This type of load pattern consumes less electricity in the peak period of the grid, but more electricity in the valley period, with high peak-valley difference, load rate of valley period and low load rate of peak period. The peak load time is 0:00–8:00 and 20:00–24:00, and the electricity consumption is very small between 8:00 and 20:00. Such users are greatly affected by TOU, and can well respond to the call of peak load shifting of the grid. They can actively use electricity in the off-peak hours of the grid load, and suspend production electricity in the peak hours.
Typical load pattern mode 2 of industrial users belongs to continuous load. This type of load pattern maintains a high level of electricity consumption throughout the day and requires high power continuity, with high daily load rate, daily maximum load utilization hour and low daily peak-valley difference. This kind of users generally have large power consumption and weak load transfer ability. Power companies need to have agreements with such customers in place to encourage them to use less electricity during tight months.
Typical load pattern mode 3 of industrial users belongs to daytime production load. This type of load pattern consumes more electricity in the peak period of the grid, but less electricity in the valley period, with high peak-valley difference, load rate of peak period and low load rate of valley period. The power consumption of these users is mainly from 8:00 to 17:00. During this time period, the load is stable, and the power consumption decreases slightly at noon. These users use electricity in concentrated and continuous hours, which affects the stable operation of the power grid. Such users should be encouraged to reduce their use of electricity during peak periods.
Typical load pattern mode 4 of industrial users belongs to daytime production load. This kind of user consumes more electricity in the daytime, but less electricity in the evening. The peak load appears between 9:00–11:00 in the morning and 14:00–16:00 in the afternoon, and the demand for electricity continuity is not high. For such users, power companies can contact users in advance to adjust the power consumption mode according to the actual demand of the power grid and the day-ahead dispatching requirements, so as to improve the operation level of the power grid.
5.5 Comparative analysis of clustering performance
In order to verify the effectiveness of multidimensional electrical consumption feature construction and SK algorithm (MECFC-SK) proposed in this paper, the performance of the proposed algorithm in industrial daily load clustering is compared with K-means, PCA + K-means, and Denoising Auto-Encoder (DAE) + K-means algorithms. CHI, DBI and SC are introduced to quantitatively analyze the clustering effect.
Table 3 records the evaluation indicators values of different algorithms in the data set. Compared with the above three algorithms, the algorithm proposed in this paper is better in each index, indicating that the MECFC-SK proposed in this paper is more effective than the traditional dimension reduction method, which can make the clustering has higher internal similarity and has greater external discrimination, and has better clustering performance.
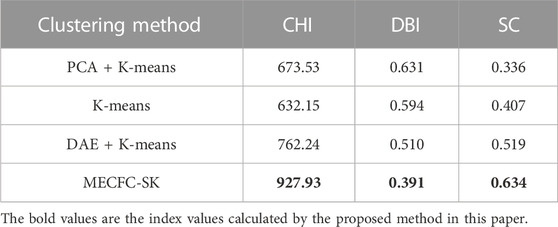
TABLE 3. Comparison of clustering performance of each method.
In addition, in order to visually display the differentiation of clusters of daily load data under various algorithms, this paper uses the t-distributed stochastic neighbor embedding (t-SNE) algorithm to reduce the multidimensional power feature set to 2 dimensions. Data visualization can be realized by drawing scatter plots on a plane (Van der Maaten and Hinton, 2008). The scatter diagram of daily industrial load data after dimension reduction in each algorithm is shown in Figure 8.
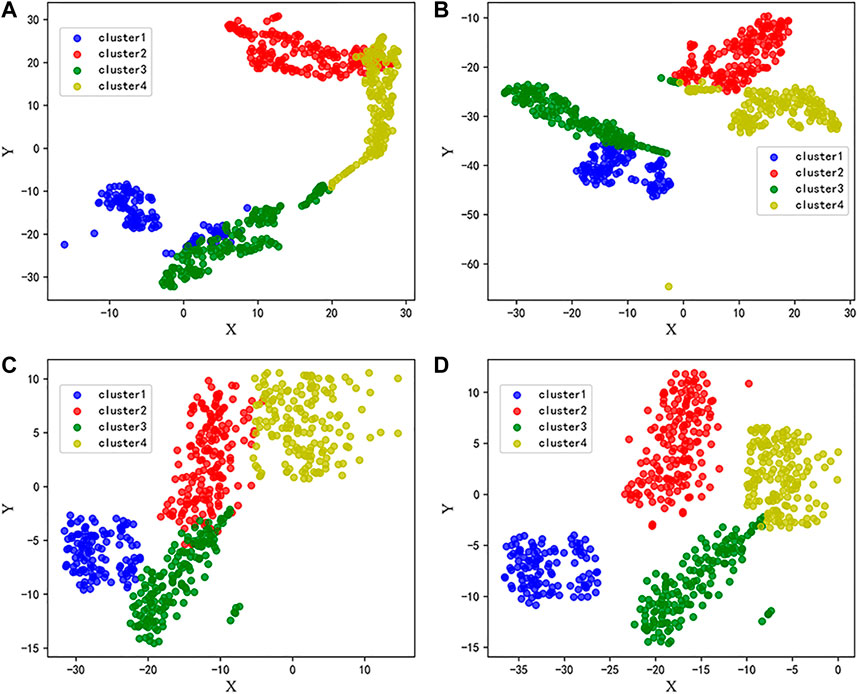
FIGURE 8. Scatter diagram after t-SNE dimension reduction: (A) K-means; (B) PCA + Kmeans; (C) DAE + Kmeans; (D) MECFC-SK.
Table 4 shows the average values of CHI, running time and iteration after 50 experiments using SK algorithm and tradition K-means in each simulation data set. Each simulation data set is built by adding different ratios of sample data and noise to the original data set. The purpose of adding sample data is to prove that SK algorithm can improve the running speed of traditional K-means algorithm, and the sample expansion ratio s varies from 100% to 600%. The purpose of adding noise is to prove that SK algorithm has better robustness in clustering performance, and the noise ratio r varies from 5% to 30%. When the noise ratio is small, there is a large gap between the two CHI, and the clustering effect of SK algorithm is obviously better than that of traditional K-means algorithm. As the ratio of sample expansion and noise continues to increase, SK has a small reduction in CHI compared with the traditional K-means algorithm, and it is significantly superior to the traditional K-means algorithm in terms of running time and iteration times, which proves that the SK algorithm proposed in this paper has a great improvement in operational efficiency.
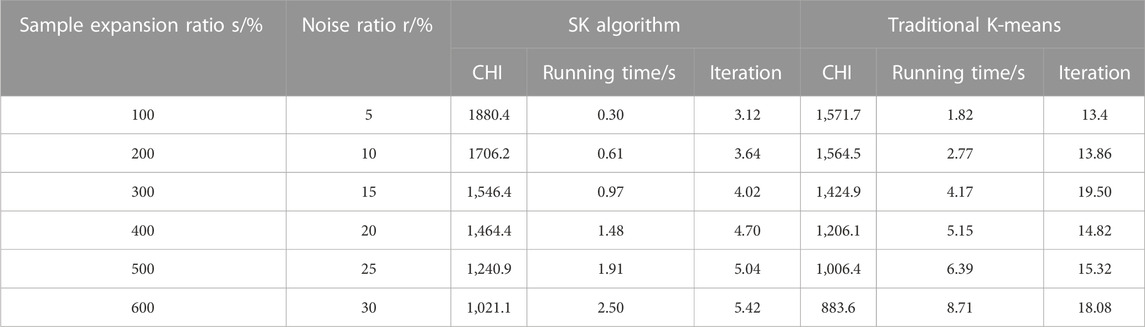
TABLE 4. Comparison of SK and traditional K-means clustering effect.
In order to prove that the initial clustering center selected by the algorithm in this paper can avoid the local optimal case and has better stability than traditional K-means, the coefficient of variation (CV) of CHI, operation time and iteration times obtained by the two algorithms on different simulated data sets are compared. CV is a normalized measure describing the degree of data dispersion, which is defined as the ratio of data standard deviation to the mean, which can effectively avoid the influence of the two groups of data dimensions and measurement scales. Table 5 shows the statistical table of CV collected on each simulation data set. It can be seen from the table that the CV of CHI of SK algorithm is much lower than that of traditional K-means, which proves that the clustering performance of SK algorithm in each experiment has little fluctuation, and effectively solves the problem that the traditional K-means algorithm is prone to fall into the local optimal solution. As shown in Table 5, CV of running time and the CV of iteration of the two algorithms are both low, indicating that the running time of the two algorithms does not fluctuate much in each clustering task. In addition, it can be seen from the experimental data recorded in Table 4 that the SK algorithm performs better in running time and iteration than traditional K-means. Therefore, it can be verified that SK algorithm is superior to Traditional K-means in running time and number of iterations in each experiment, which proves that SK algorithm has good stability and accelerates the speed of clustering.
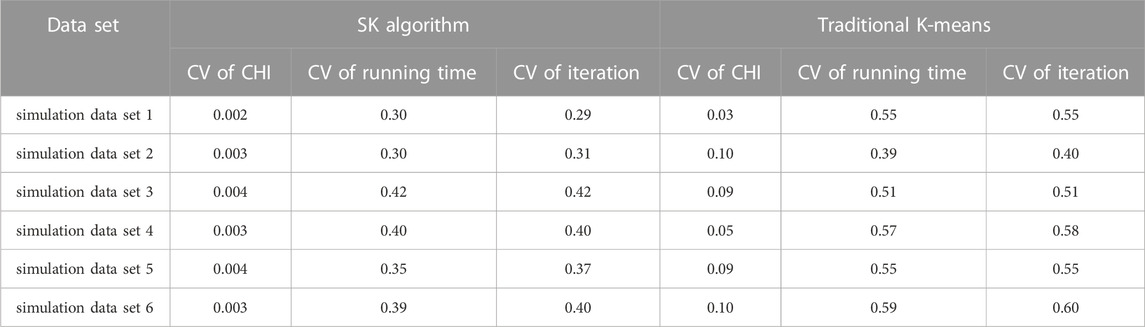
TABLE 5. Coefficient of variation table.
6 Conclusion
Mining typical load patterns of industrial users can classify industrial users according to their power consumption habits and group users with similar power consumption characteristics into one category for demand-side management. In order to extract the typical load patterns of industrial users accurately, this paper proposes an extraction method of typical load patterns of industrial users based on multidimensional electrical consumption feature construction and SK algorithm, which intends to solve the problems of high dimension and complex non-linear relationship of industrial users load data, and local convergence in traditional k-means algorithm. The data set of industrial users in Zhejiang Province, China is taken as an example. Compared with other clustering algorithms, the effectiveness of this method is proved, and the conclusions are as follows:
(1) In this paper, temporal features of industrial daily load data are obtained based on CAE and combined with industrial load characteristic set to construct multidimensional feature set of industrial users, which can effectively extract low-dimensional vectors of original data to achieve data dimension reduction and improve clustering performance.
(2) The SK clustering algorithm proposed can effectively solve the local optimal problem caused by the random selection of initial clustering center by traditional K-means method, improve the stability of the algorithm, speed up the algorithm running speed, and improve the clustering accuracy.
(3) By clustering the daily load data of industrial users, typical load patterns of users can be extracted, users can be classified according to their power consumption habits, and appropriate management schemes can be formulated for various users, which plays a positive role in promoting lean management and safe and reliable operation of the power grid.
Data availability statement
The raw data supporting the conclusion of this article will be made available by the authors, without undue reservation.
Author contributions
The author’s personal contributions are as follows: Manuscript writing, LW; writing instruction, JZ and XX. Data collection and interpretation JL, YL, and LZ; content and format correction, LW, JZ, and XX. All authors have read and agreed to the published version of the manuscript.
Funding
This work is sponsored by “Chenguang Program” supported by Shanghai Education Development Foundation and Shanghai Municipal Education Commission (19CG61). The funder was not involved in the study design, collection, analysis, interpretation of data, the writing of this article, or the decision to submit it for publication.
Conflict of interest
XX was employed by the company China Coal Technology and Engineering Group Shanghai Company Limited.
JL, YL, and LZ were employed by the company Huzhou Power Supply Company of State Grid Zhejiang Electric Power Company Limited.
The remaining authors declare that the research was conducted in the absence of any commercial or financial relationships that could be construed as a potential conflict of interest.
Publisher’s note
All claims expressed in this article are solely those of the authors and do not necessarily represent those of their affiliated organizations, or those of the publisher, the editors and the reviewers. Any product that may be evaluated in this article, or claim that may be made by its manufacturer, is not guaranteed or endorsed by the publisher.
References
Ai, X., Yang, Z., Hu, H., Wang, Z., Peng, D., and Zhao, L. (2020). A load curve clustering method based on improved k-means algorithm for virtual power plant and its application. Electr. Power Constr. 41 (05), 28–36. doi:10.12204/j.issn.1000-7229.2020.05.004
Al-Wakeel, A., and Wu, J. (2016). K-means based cluster analysis of residential smart meter measurements. Energy Procedia 88, 754–760. doi:10.1016/j.egypro.2016.06.066
Bañales, S., Dormido, R., and Duro, N. (2021). Smart meters time series clustering for demand response applications in the context of high penetration of renewable energy resources. Energies 14 (12), 3458. doi:10.3390/en14123458
Dai, X., Chen, H., Xiao, D., and He, Q. (2022). Review of applications and researches of industrial demand response technology under electricity market environment. Power Syst. Technol. 46 (11), 4169–4186. doi:10.13335/j.1000-3673.pst.2022.1328
Dehghan-Dehnavi, S., Fotuhi-Firuzabad, M., Moeini-Aghtaie, M., Dehghanian, P., and Wang, F. (2020). Decision-making tree analysis for industrial load classification in demand response programs. IEEE Trans. Industry Appl. 57 (1), 26–35. doi:10.1109/TIA.2020.3032932
Deng, S., Cai, Q., Zhang, Z., and Wu, X. (2021). User behavior analysis based on stacked autoencoder and clustering in complex power grid environment. IEEE Trans. Intelligent Transp. Syst. 23 (12), 25521–25535. doi:10.1109/TITS.2021.3076607
Duan, L., Ma, S., Aggarwal, C., and Sathe, S. (2021). Improving spectral clustering with deep embedding, cluster estimation and metric learning. Knowl. Inf. Syst. 63, 675–694. doi:10.1007/s10115-020-01530-8
Fang, M., Xiang, Y., Xu, B., Wang, T., Pan, L., Liu, Y., et al. (2022). Data-driven load pattern identification based on R-vine copula and random forest method. IEEE Trans. Industry Appl. 58 (6), 7919–7929. doi:10.1109/TIA.2022.3200920
Gupta, A. K., and Singh, R. K. (2022). Short-term day-ahead photovoltaic output forecasting using PCA-SFLA-GRNN algorithm. Front. Energy Res. 10. doi:10.3389/fenrg.2022.1029449
Hou, Y., and Xing, X. (2020). Demand elasticity, ramsey index and cross-subsidy scale estimation for electricity price in China. Sustain. Prod. Consum. 24, 39–47. doi:10.1016/j.spc.2020.06.008
Huang, N., Wang, W., Wang, S., Wang, J., Cai, G., and Zhang, L. (2020). Incorporating load fluctuation in feature importance profile clustering for day-ahead aggregated residential load forecasting. IEEE Access 8, 25198–25209. doi:10.1109/ACCESS.2020.2971033
Jiang, C., Wen, F., Xue, Y., Chen, F., Sun, Y., and Zhang, L. (2021). “Optimal power management strategy for industrial users based on the state task network considering user preferences,” in 2021 IEEE Kansas Power and Energy Conference (KPEC), Manhattan, KS, USA, 19-20 April 2021, 1–6. doi:10.1109/KPEC51835.2021.9446210
Koivisto, M., Heine, P., Mellin, I., and Lehtonen, M. (2012). Clustering of connection points and load modeling in distribution systems. IEEE Trans. Power Syst. 28 (2), 1255–1265. doi:10.1109/TPWRS.2012.2223240
Lin, S., Li, F., Tian, E., Fu, Y., and Li, D. (2017). Clustering load profiles for demand response applications. IEEE Trans. Smart Grid 10 (2), 1599–1607. doi:10.1109/TSG.2017.2773573
Liu, W., Wang, Z., Liu, X., Zeng, N., Liu, Y., and Alsaadi, F. E. (2017). A survey of deep neural network architectures and their applications. Neurocomputing 234, 11–26. doi:10.1016/j.neucom.2016.12.038
Nikolaos, T., Anastasios, T., Nikolaos, N., and Ioannis, P. (2015). A distributed framework for trimmed Kernel k-Means clustering. Pattern Recognit. 48 (8), 2685–2698. doi:10.1016/j.patcog.2015.02.020
Panapakidis, I., Asimopoulos, N., Dagoumas, A., and Christoforidis, G. C. (2017). An improved fuzzy c-means algorithm for the implementation of demand side management measures. Energies 10 (9), 1407. doi:10.3390/en10091407
Rodriguez, A., and Laio, A. (2014). Clustering by fast search and find of density peaks. science 344 (6191), 1492–1496. doi:10.1126/science.1242072
Ryu, S., Choi, H., Lee, H., and Kim, H. (2019). Convolutional autoencoder based feature extraction and clustering for customer load analysis. IEEE Trans. Power Syst. 35 (2), 1048–1060. doi:10.1109/TPWRS.2019.2936293
Shi, J., Wen, F., Cui, P., Sun, L., Shang, J., and He, Y. (2017). Intelligent energy management of industrial loads considering participation in demand response program. Automation Electr. Power Syst. 41 (14), 45–53. doi:10.7500/AEPS20170203002
Si, C., Xu, S., Wan, C., Chen, D., Cui, W., and Zhao, J. (2021). Electric load clustering in smart grid: Methodologies, applications, and future trends. J. Mod. Power Syst. Clean Energy 9 (2), 237–252. doi:10.35833/MPCE.2020.000472
Song, J., He, C., Li, X., Liu, Z., Tang, J., and Zhong, W. (2019). Daily load curve clustering method based on feature index dimension reduction and entropy weight method. Automation Electr. Power Syst. 43 (20), 65–72. doi:10.7500/AEPS20181115008
Tian, F., Gao, B., Cui, Q., Chen, E., and Liu, T. Y. (2014). Learning deep representations for graph clustering. Proc. AAAI Conf. Artif. Intell. 28 (1), 8916. doi:10.1609/aaai.v28i1.8916
Van der Maaten, L., and Hinton, G. (2008). Visualizing data using t-SNE. J. Mach. Learn. Res. 9 (11), 2579–2605.
Wang, Y., Chen, Q., Kang, C., and Xia, Q. (2016). Clustering of electricity consumption behavior dynamics toward big data applications. IEEE Trans. smart grid 7 (5), 2437–2447. doi:10.1109/TSG.2016.2548565
Xu, F. Y., and Lai, L. L. (2015). Novel active time-based demand response for industrial consumers in smart grid. IEEE Trans. Industrial Inf. 11 (6), 1564–1573. doi:10.1109/TII.2015.2446759
Xu, L., Yang, X., and Zhang, M. (2017). Industrial users of electricity behavior analysis based on data mining. Electr. Meas. Instrum. 54 (16), 68–74.
Xu, S., Si, C., Wan, C., and Cao, Z. (2020). Ensemble spectral clustering algorithm for load profiles considering dual-scale similarities. Automation Electr. Power Syst. 44 (22), 152–160. doi:10.7500/AEPS20200321005
Xu, T. S., Chiang, H. D., Liu, G. Y., and Tan, C. W. (2015). Hierarchical K-means method for clustering large-scale advanced metering infrastructure data. IEEE Trans. Power Deliv. 32 (2), 609–616. doi:10.1109/TPWRD.2015.2479941
Zhang, B., Zhuang, C., Hu, J., Chen, S., Zhang, M., Wang, K., et al. (2015). Ensemble clustering algorithm combined with dimension reduction techniques for power load profiles. Proc. CSEE 35 (15), 3741–3749. doi:10.13334/j.0258-8013.pcsee.2015.15.001
Zhang, T., and Gu, M. (2016). Overview of electricity customer load pattern extraction technology and its application. Power Syst. Technol. 40 (03), 804–811. doi:10.13335/j.1000-3673.pst.2016.03.021
Keywords: industrial user, load clustering, feature construction, auto-encoder, selforganizing map(SOM), k-means
Citation: Wang L, Zhao J, Xia X, Liu J, Lu Y and Zhao L (2023) Industrial users load pattern extraction method based on multidimensional electrical consumption feature construction. Front. Energy Res. 11:1161401. doi: 10.3389/fenrg.2023.1161401
Received: 08 February 2023; Accepted: 24 March 2023;
Published: 04 April 2023.
Edited by:
Bo Yang, Kunming University of Science and Technology, ChinaReviewed by:
Xiang Wei, Hong Kong Polytechnic University, Hong Kong SAR, ChinaYiqun Li, Harbin Institute of Technology, China
Feng Zhang, Shandong University, China
Copyright © 2023 Wang, Zhao, Xia, Liu, Lu and Zhao. This is an open-access article distributed under the terms of the Creative Commons Attribution License (CC BY). The use, distribution or reproduction in other forums is permitted, provided the original author(s) and the copyright owner(s) are credited and that the original publication in this journal is cited, in accordance with accepted academic practice. No use, distribution or reproduction is permitted which does not comply with these terms.
*Correspondence: Jian Zhao, emhhb2ppYW5lZUBmb3htYWlsLmNvbQ==