 Xiangli Deng1
 Shirui Wang
- 1School of Electric Power Engineering,Shanghai University of Electric Power, Shanghai, China
- 2State Grid Wenzhou Power Supply Company, Wenzhou, Zhejiang Province, China
- 3School of Electric Power Engineering, Chongqing University, Chongqing, China
This paper proposes a two-person multi-stage zero-sum game model considering the confrontation between cascading failures and control strategies in an AC/DC hybrid system to solve the blocking problem of DC systems caused by successive failures at the receiving end of an AC/DC system. A game model is established between an attacker (power grid failure) and a defender (dispatch side). From the attacker’s perspective, this study mainly investigates the problem of system line failures caused by AC or DC blockages. From the perspective of dispatch-side defense, the multiple-feed short-circuit ratio constraint method, output adjustment measures of the energy storage system, sensitivity control, and distance third-segment protection adjustment are used as strategies to reduce system losses. Using as many line return data as possible as samples, the deep Q-network (DQN), a deep reinforcement learning algorithm, is used to obtain the Nash equilibrium of the game model. The corresponding optimal dispatch and defense strategies are also obtained while obtaining the optimal sequence of tripping failures for AC/DC hybrid system cascading failures. Using the improved IEEE 39-node system as an example, the simulation results verify the appropriateness of the two-stage dynamic zero-sum game model to schedule online defense strategies and the effectiveness and superiority of the energy storage system participating in defense adjustment.
1 Introduction
Recently, there have been major outages caused by interlocking faults around the world. To analyze these incidents, the principles of interlocking fault propagation have been studied extensively (Ding et al., 2017; Fang., 2014). Currently, related research is still mainly focused on the conventional AC grid, for example, complex systems theory (Cao et al., 2012; Cao et al., 2011), particularly complex network theory (Fan et al., 2018; Dey et al., 2016; Xu et al., 2010), has been used to study the chain fault dynamics and evolution form in terms of complex network topology, but without considering the specific system fault risk. Moreover, based on the research perspective of tidal current calculation and stability analysis, the chain fault development process has been expressed. In the paper (Wang et al., 2019), the residual load rate and chain fault propagation distance metrics are used to quantify the impact of vulnerable lines on the depth and breadth of chain fault propagation; in the paper (Zhang et al., 2017), a branch fault percolation probability model was constructed to identify vulnerable branches of the grid under normal operation and predict the faulty branches of the grid after a fault occurs.
When a chain fault occurs in an AC system, it will easily lead to a DC lockout owing to a decrease in the support capacity of the AC system to the DC system, which will in turn lead to a larger-scale tidal shift and increase the probability of a major power outage in the grid. The existing N-k fault scheduling strategy requires a large amount of data calculation to determine chain faults, which consumes considerable time and cannot meet the actual needs. Therefore, studying a fast identification method for fault-tripping sequences and an optimal regulation strategy for tripping sequences in the chain fault evolution of hybrid AC/DC systems is necessary.
The chain of faults in the evolution process will continuously trigger the tripping and decommissioning of grid lines. The regulation strategy can simultaneously control the system to cut off the propagation path of the chain of faults, which can be considered as a multi-stage dynamic game between two people. Hence, game theory can be applied to the chain fault sequence search process. For example, the paper (Zhang et al., 2020) studied the contribution of various fault chains to grid losses by constructing a cooperative game framework for grid branches. Paper (Ding et al., 2016) analyzed the coordination between preventive control and blocking control of cascading failures, and a coordinated control model based on risk assessment is proposed for power system cascading failures in terms of reducing the risk of blackout.
Deep reinforcement learning algorithms have a broad application scenario for solving the Nash equilibrium of a two-person multi-stage game model and can be solved quickly and accurately. Since Minh et al. proposed the concept of deep Q-networks (DQN) in 2015, the application scenario and scope of the DQN algorithm have been continuously expanded. DQN is a novel deep reinforcement learning algorithm combining deep learning with reinforcement learning (Mnih et al., 2015; Van Hasselt et al., 2016); in particular, it combines the Q-learning reinforcement learning algorithm and convolutional neural network. This causes shorter convergence time and training time than the Q-learning algorithm and more convenient processing for increasing the data dimension of the AC/DC hybrid system trend. The introduction of deep learning in reinforcement learning strengthens the generalization ability of the algorithm.
As the grid is added to the DC transmission line, the corresponding novel energy-generating units will also be integrated into the system operation, along with the continuous development and progress of energy storage technology. The excellent power characteristics of the storage system can be triggered in the event of a fault on the AC side of the grid initiating DC side voltage fluctuations by quickly releasing or absorbing the stored power of the storage system to maintain the system’s normal operation. There has been further improvement in the fault ride-through capability of new energy units (Li et al., 2022). In the paper (Duan et al., 2019), a reinforcement-learning-based online optimal (RL-OPT) control method is proposed for the hybrid energy storage system (HESS) in ac–dc microgrids involving photovoltaic systems and diesel generators (DGs). The paper (Ying et al., 2023) proposes an online energy management strategy (OEMS) based on long short-term memory (LSTM) network and deep deterministic policy gradient (DDPG) algorithm to counteract the effects of these real-time fluctuations, and the proposed OEMS has the advantages of small tracking error, model-free control, and continuous action control. This paper (Yang et al., 2022) combined with the deep reinforcement learning algorithm, the Markov multi-energy interaction model is established with distributed structure, and the problem of continuous action in the model is solved, and finally the energy profit of the local energy market (LEM) in Energy Internet (EI) is maximized.
Therefore, energy storage system adjustment can be used as one of the control strategies employed in AC/DC hybrid systems to cope with chain failures; therefore, the capacity configuration of the storage system needs to be studied. Paper (Liu et al., 2016) proposed a control strategy using energy storage devices to improve the injection current characteristics of wind farms to ensure the smooth operation of the system; the capacity requirements of the storage system were studied by simulation. Studies (Yan et al., 2020; Dai et al., 2016; Song et al., 2018) have proposed an energy storage power control strategy to adjust the output based on the battery’s state of charge (SOC); they used simulation analysis to obtain the battery capacity requirements. In paper (Liu et al., 2022), an optimal configuration model of the energy storage double layer was established based on the effective use of energy storage for the load margin of the integrated energy system, thus achieving an effective balance of the load margin in the integrated energy system.
In summary, this study first constructs a two-person multi-stage zero-sum game model to consider the process of mutual confrontation between interlocking faults and regulation strategies in AC/DC hybrid systems. From the attacker (power grid failure)’s point of view, this study studied the problem of continuous fault decommissioning caused by AC disturbance or DC blocking from the defender (dispatch side)’s point of view. This study used sensitivity control, distance III protection adjustment, the multi-feeder short-circuits ratio constraint method, and energy storage system capacity adjustment measures as defense strategies to reduce system losses. With as many lines decommissioning data as possible as samples, the DQN deep reinforcement learning algorithm was used to find the Nash equilibrium of the game model and obtain the optimal fault tripping sequence of the AC/DC hybrid system chain fault while obtaining the corresponding optimal dispatching defense strategy.
2 AC/DC system interlocking fault and its defense model
2.1 AC/DC system fault evaluation index
2.1.1 Line return risk
AC/DC interlocking faults are analyzed in two main aspects: first, the tidal current transfer and hidden faults of protection are the main factors; second, the phase change failure of the DC system is the main factor triggering the DC system. Therefore, this study uses the risk factor as an evaluation index to further assess the impact of the subsequent decommissioning of the line.
The probability of grid line decommissioning is affected by the state of the grid after the occurrence of the previous fault; the corresponding Markov chain fault probability model is shown in Equation 1.
where
where
2.1.2 AC bus multi-feeder voltage support capability
In mixed-connection systems, the main focus is on assessing the voltage support capability of the AC system and the phase-change bus voltage. To evaluate the voltage stability of the hybrid system, a multi-feeder short-circuit ratio was used to reflect the system’s grid strength and voltage support capacity (Lin et al., 2008).
The multi-feeder short-circuit ratio indicator is defined as shown in Equation 3.
where is the short-circuit capacity of the converter bus; is the equivalent DC power after considering other DC effects, is the rated DC power of the DC, respectively, and is the multi-feed influence factor between branches. Therefore, the short-circuit ratio variation is established as an indicator to assess the voltage support capability of the receiving system, as shown in Equation 4.
Short-circuit capacity decline is mainly triggered by the fault line opening, which leads to changes in the system structure, causing the system impedance to become larger, and the AC to DC system support capacity is reduced, increasing the possibility of system voltage fluctuations. Thus, the multi-feed short-circuit ratio index can effectively reflect the impact of line opening on the system voltage support capacity.
2.1.3 Risk of DC phase change failure
The action criterion of phase-change failure protection is that the DC line’s bus voltage on the inverter side is lower than the threshold voltage and exceeds a certain time; then, the protection will be activated, and the DC line will be blocked. When the overrun arc extinguishing angle
where
where
2.2 Evaluation of interlocking faults in AC/DC transmission systems
Based on the basic structure of the AC/DC hybrid system and the possible risk of safety failure, this study compiles the evolution form of the chain failure of the AC/DC hybrid system, as shown in Figure 1.
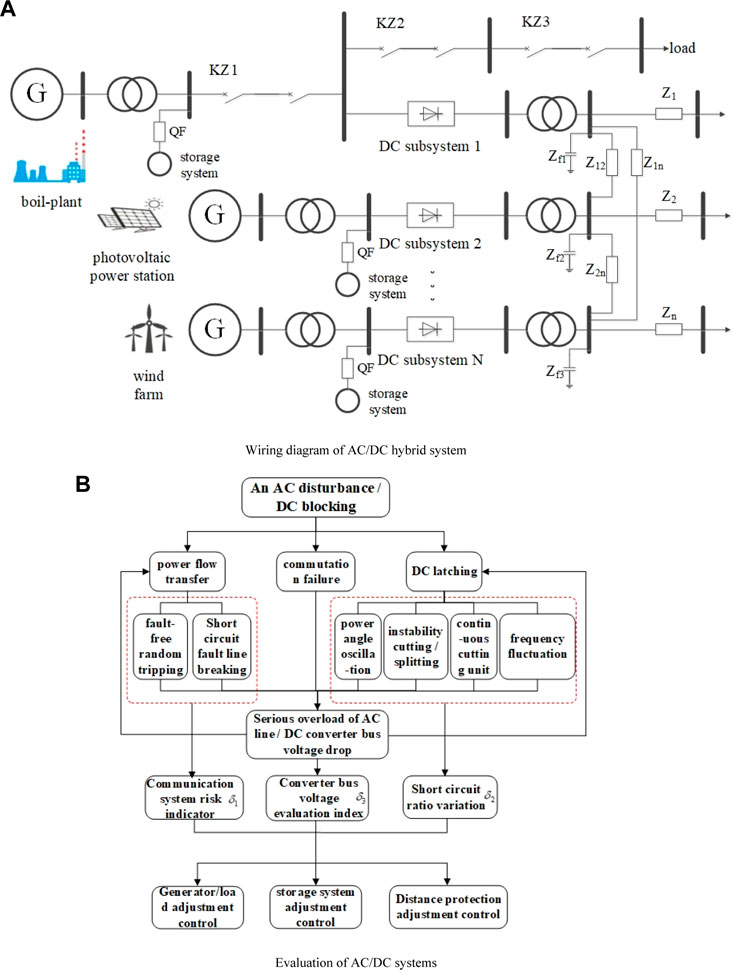
FIGURE 1. Evolution form of cascading failures in AC/DC hybrid system.
The AC system risk indicator
The analysis of the AC/DC hybrid system chain fault characteristics and assessment indexes shows that the evolution form of chain faults mainly lies in their mutual coupling on the AC/DC side of the development of changes and then continuously expands the scale and coverage of chain faults. Combined with the above chain fault mechanism analysis, the final establishment of line disconnection risk assessment indicators is shown in Eq. 7.
where
2.3 Chain fault regulation strategy
2.3.1 Response to chain failure power adjustment strategy
(1) Generator and load sensitivity control strategies
The branch’s overload due to the branch’s disconnection can be adjusted by the method of generator output and load control using sensitivity coefficient pairing. The sensitivity pairing method comprising generator and load pairing using a correlation matrix is simpler and quicker to control. Therefore, priority is given to controlling nodes with large power sensitivity to minimize system losses. Eq. 8 shows the power sensitivity
Therefore, the sensitivity control strategy is used to obtain the branch generator set output and the load power is to be adjusted, as shown in Eq. 9.
where
(2) Multi-feed short-circuit ratio constraint
For a grid containing multi-feeder DC systems, each DC system’s multi-feeder short-circuit ratio index needs to be controlled within the normal range to ensure that the AC system strength can match the transmission capacity of the DC system constrained, as shown in Eq. 10.
where
Therefore, the corresponding multi-feed-in short-circuit ratio parameters are calculated from the generator unit output at node
(3) Prevention of phase-change failure commutation bus voltage adjustment strategy
In the AC/DC hybrid system, the converter transformer ratio, DC operating current, converter phase reactance, converter bus voltage, and overrun trigger angle affect the magnitude of the arc extinguishing angle. The reactive power adjustment value of the inverter-side converter to be adjusted in the DC transmission system is obtained using the control strategy, as shown in Eq. 11.
where
Therefore, the corresponding reactive power adjustment is calculated using the converter bus voltage evaluation index
2.3.2 Scheduling and adjustment methods of storage, source, network, and load of the AC/DC hybrid grid
By adjusting the storage source and network load scheduling for each phase of the interlocking fault, the interlocking fault is cut off before expanding further. Here, the defensive measures for chain faults are mainly the multi-feeder short-circuit ratio constraint method, energy storage system adjustment, matching distance III protection action adjustment strategy (Yang et al., 2011; Lin et al., 2011) and sensitivity control (Xu et al., 2017) for auxiliary control of the AC side. The line adjustments for the tidal overload are as follows.
1) When the line is overloaded, the distance protection section Ⅲ is adjusted so that it does not misfire. The action characteristic angle of the distance protection section Ⅲ is first adjusted, and the energy storage system output near the branch is adjusted.
2) After ensuring that the distance protection section III does not misfire and that the energy storage system is involved in the adjustment, sensitivity control and multi-feeder short-circuit ratio constraint are used to complete the control of the line tide.
3) After ensuring that the system tide can operate normally, the power output of each energy storage system of the entire AC/DC system is calculated to restore the system’s balance.
(1) Energy-storage regulation strategy
When the system is in normal operation, the tidal shift or fault causes changes in the power output of the grid generating units and load power, which further affects the grid’s tidal fluctuation. The energy storage regulation strategy is initiated, charging the energy storage system when the active power output increases, and discharging the energy storage system to maintain the normal operation of the system when the active power output decreases or the load power is lost. Therefore, when a chain fault occurs in the hybrid system, the energy storage system can be used to adjust the power output of the storage unit to achieve tidal control of the grid; the control strategy requires a high response speed of the energy storage system. Therefore, this study mainly uses power-type energy storage devices such as supercapacitors in the storage unit.
The DC-side power variation during the dynamic process is given by Equation 12.
where
Let the energy flowing to the energy storage system during the failure time
Eq. 14 can also be obtained as follows.
Substituting Eq. 14 into Equation 13 yields the formula for calculating the capacity of the energy storage unit, as shown in Eq. 15.
where
Alternatively, after determining the power of the energy storage system based on the tidal short-circuit calculation, the supercapacitor capacity value (Tian et al., 2016) can be obtained to absorb and store all the power passing through the generator-side alternator to maintain the system voltage stability, as shown in Eq. 16.
where
The energy storage unit must store the excess power generated by the system because of the adjustment when the fault occurs, but not to exceed the upper limit of the storage unit. According to Eq. 16, Eq. 17, a schematic of the supercapacitor value versus the duration of the failure can be plotted, as shown in Figure 2.
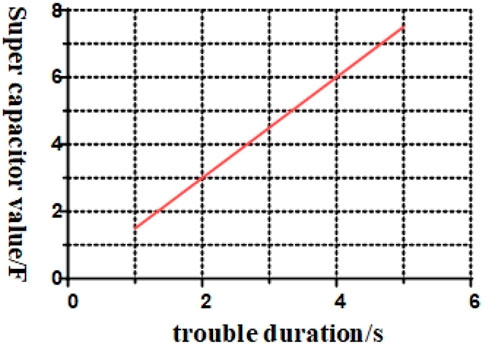
FIGURE 2. Relationship between super capacitance value and failure duration.
Figure 2 shows that the length of the fault duration is proportional to the supercapacitor value. According to the calculation of Eq. 16 and Eq. 17, if the fault duration of the generator set is 2 s, the required supercapacitor value is 3.06 F.
(2) Generator and load regulation strategies
According to the required adjustment amount of power output of all generating units and the required adjustment amount of load nodes obtained from the scheduling defense strategy in the previous section, mainly including the total power adjustment amount of each generating unit node side
(3) Grid section III distance protection setting adjustment strategy.
To prevent the distance protection from being triggered by the tidal current transfer when the chain fault occurs, distance protection control measures are used; that is, the action characteristic angle of section III distance protection is adjusted.
Whether the distance protection takes action is determined by identifying whether the measured impedance of the protection position falls into the action characteristics generated by the rectified impedance. Assuming that the measured impedance fully exhibits the resistance characteristics, the measured impedance is given by Eq. 18.
where
When the line is identified as having a tidal shift, the action characteristic of section III distance protection is adjusted to make
where
3 Optimal defense strategy for chain failures based on game DQN model
3.1 Multi-stage zero-sum game-based chain failure model
The above demonstrates that the goal of the chain fault is to cause damage to the power system, whereas the goal of the scheduler is to interrupt the development of the chain fault and reduce the loss of the power system. Therefore, the chain fault and scheduling adjustment can be regarded as an attacker and defender against the power system, respectively, and the interaction between them can be expressed as a game between them.
When a chain fault occurs, the state of the grid under each stage evolves; hence, the state of the grid at stage
Using the risk factor as a function of the gains of the attacker and defender at each stage of the fault development process subsequently allows for evaluating the losses triggered by the attacker. Therefore, the gains for both sides are given by Eq. 21 based on the assumptions above.
where
By analyzing the payoff function, we find that the payoff of the multi-stage zero-sum game pays more attention to the overall payoff generated by one game considering the single-stage payoff. When the defender considers the optimal adjustment strategy, the optimal attack strategy of the attacker can be sought as the Nash equilibrium of the game model, i.e., only the optimal gain of the attacker needs to be considered.
Therefore, both attackers and defenders must adopt the optimal strategy of
where
3.2 Nash equilibrium solution method for chain failure game model based on DQN algorithm
3.2.1 Q-learning reinforcement learning algorithm
A Markov decision process is typically used to solve a problem using reinforcement learning. It is mainly represented by
where
The Q-learning algorithm is updated as shown in Eq. 25.
The formation process of the Q-table and its parameters during the calculation of the Q-learning algorithm are shown in Figure 3.
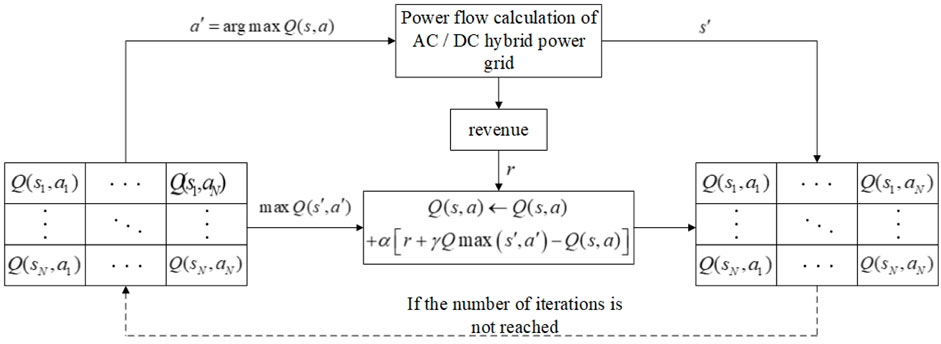
FIGURE 3. Q-Learning algorithm calculation flowchart.
3.2.2 Q-learning algorithm based on deep learning Q-function
However, maintaining and updating Q-table tables in the Q-learning algorithm requires a lot of computing resources and computing time, and there is a dimensional explosion problem. Therefore, a non-linear function approximator can be used to approximate Q. Neural network is a commonly used non-linear function approximator, and a Q-learning algorithm that uses a deep learning network as a Q function approximator is the DQN algorithm.
The DQN algorithm focuses on two main aspects: constructing the target network and introducing an experience-replay mechanism.
(1) Construction of the target network
The DQN algorithm continues to consider the task of agent-environment interaction in sequences of actions, observations, and rewards. In each stage, the agent selects an action
The agent aims to interact with the network by selecting actions that maximize future returns. Similarly, the depreciation factor
For the original Q-learning algorithm, the Bellman equation, i.e., linear function approximator is used as an iterative update to estimate the action-value function. While the DQN algorithm uses a non-linear function approximator, i.e., a neural network for estimation, we refer to the neural network function approximator with weights
where
For this neural network, we can use the stochastic gradient descent to minimize the loss function such that the parameters of the neural network can be updated to the maximum extent, and the gradient of the loss function is shown in Eq. 28.
Hence, the DQN algorithm updates the formula as shown in Eq. 29.
(2) Experience-replay mechanism
The interaction information between the agent and environment at each decision moment can be represented as one experience
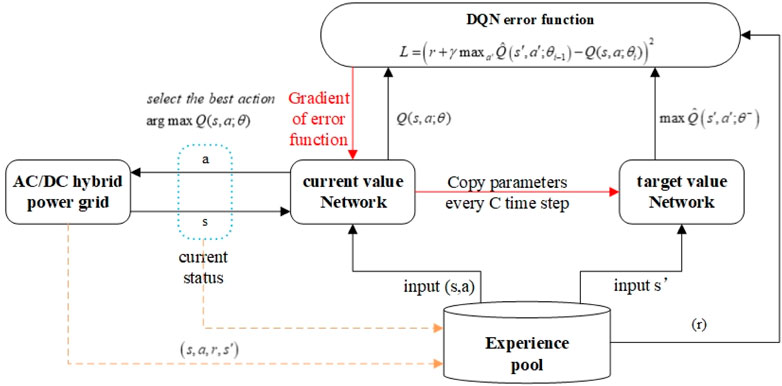
FIGURE 4. Structural diagram of Q value calculation for DQN algorithm.
Here, we adopted the
where
As the algorithm interacts with the environment, it is possible to make
(3) DQN algorithm training process.
Thus, the training process of the DQN algorithm is as follows.
1) First, initialize the current value network
2) Obtain the grid state based on the parameters of the AC/DC hybrid system
3) During the algorithm’s training, the action network is responsible for interacting with the environment to obtain the action
4) During the learning process, after selecting the action
5) Save the reward
6) At this time, to increase the number of games while judging whether the number of attacks reaches the maximum number of games, if the maximum number of games, stop iteration, initialize the grid state, return to step 2), and continue the algorithm training learning.
When the algorithm reaches the initially set maximum number of iterations, the algorithm training stops representing the end of learning. Through algorithm training and learning, the target value network parameters are continuously updated, and the optimal action value function
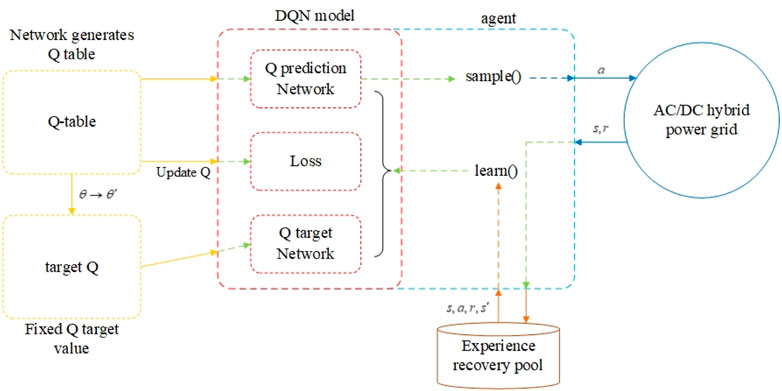
FIGURE 5. Flowchart of DQN algorithm calculation.
Through the reinforcement learning algorithm, the action value function
3.3 Optimal defense strategy for AC/DC grid interlocking faults
The algorithm of the deep reinforcement learning game model for optimal defense strategy in chain failures comprises learning training using the DQN algorithm to obtain the optimal action value function
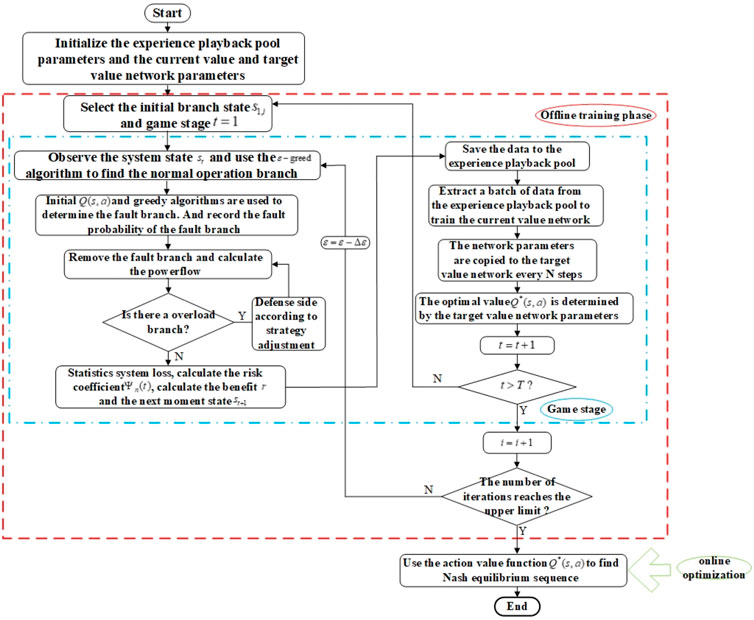
FIGURE 6. Flowchart for determining optimal branch trip sequence of cascading failures.
In the specific optimal branch trip sequence finding process, the attacker uses the
After all the training is completed, we enter the online optimization phase, in which we quickly complete the online optimization process of the optimal tripping sequence and optimal regulation strategy.
In summary, this study adopts the AC system risk index
4 Simulation example verification
4.1 Introduction to the simulation system
The above theory was simulated and analyzed using a modified IEEE39 node system with the specific wiring diagram shown in Figure 7. Among them, based on the original standard IEEE39 node AC system, the generating units on Buses 31–38 are changed to wind farm units with adjustable wind power output, and the adjacent transmission lines between Buses 25 and 26 and Buses 26–27 are modified as DC transmission systems, while the corresponding capacity of energy storage systems are configured at Buses 30–39, such that the original conventional AC system is changed to a hybrid AC/DC system with new energy access.
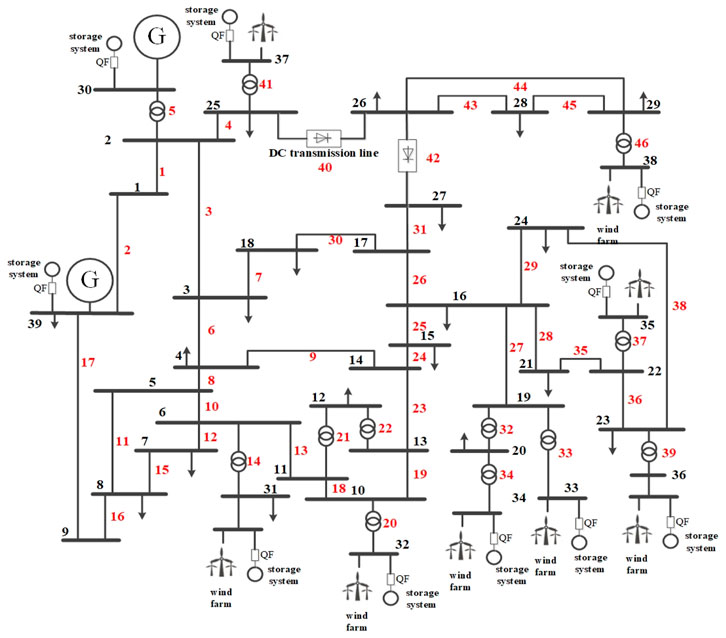
FIGURE 7. Example system wiring diagram.
4.2 DQN algorithm training results
When using the DQN algorithm for training, the relevant algorithm parameters were initialized as follows:
First, the DQN algorithm is trained. The two algorithm models with or without defense strategy are analyzed separately for comparison, while two or three game stages are taken for learning training. At the end of the algorithm learning training, the optimal action value function
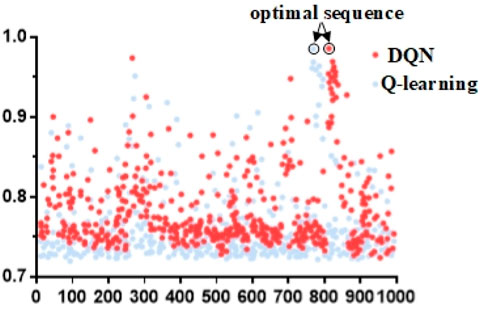
FIGURE 8. Q-table comparison of two algorithms.
As shown in Figure 8, the Q-learning algorithm produces cumulative Q values mostly in the lower position. In contrast, the DQN algorithm produces a larger fraction of Q values closer to the optimal sequence, indicating that the DQN algorithm exhibits better convergence.
To verify the performance of the DQN algorithm proposed here, it was compared and analyzed with the Q-learning algorithm. First, the convergence of the Q-value change curves of the DQN algorithm and the Q-learning algorithm are compared, and the two are compared in terms of Q-value estimation. The comparison in terms of Q-value change trends shows the advantages of the DQN algorithm proposed here in the offline training process. Figure 9A shows a comparison of the change trends of the Q-value under the two algorithms. Figure 9A shows that the Q-learning algorithm estimates the Q-value from a higher starting point under the same number of iterations. The DQN algorithm improves the overestimation of the Q-value caused by the problem of increasing the dimensionality of the data obtained from the tide calculation after the AC/DC hybrid system is added to the DC system owing to the optimization of the objective function.
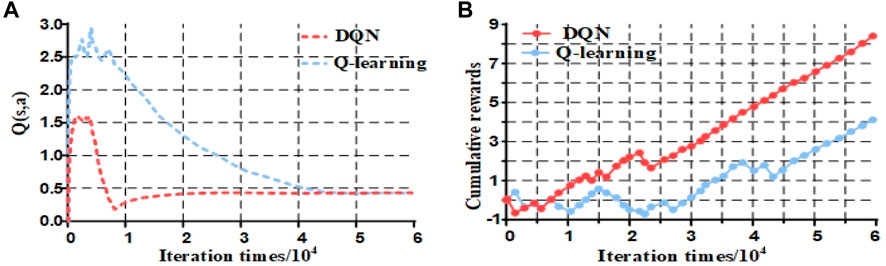
FIGURE 9. Comparison diagram of intelligent algorithms.
The algorithm’s convergence was verified by storing the cumulative gains obtained after each gaming phase; the results are shown in Figure 9B. The Q-learning algorithm cannot determine the correct action at the beginning of training. It only starts to find the correct action after the number of training iterations reaches 30,000. However, there are still some fluctuations between, and only after approximately 45,000 iterations are fully determined and continue to increase. In contrast, the DQN algorithm kept fluctuating and rising at the beginning of training, even though it was fumbling to find the correct action, and then selected the correct action to obtain a positive reward and kept rising linearly for approximately 25,000 iterations, indicating that the algorithm found a suitable control strategy to complete the convergence of the algorithm.
4.3 Analysis of online optimization search results
4.3.1 Comparison of AC/DC hybrid system and conventional AC system
After causing a chain failure in the system according to the initially set attack sequence
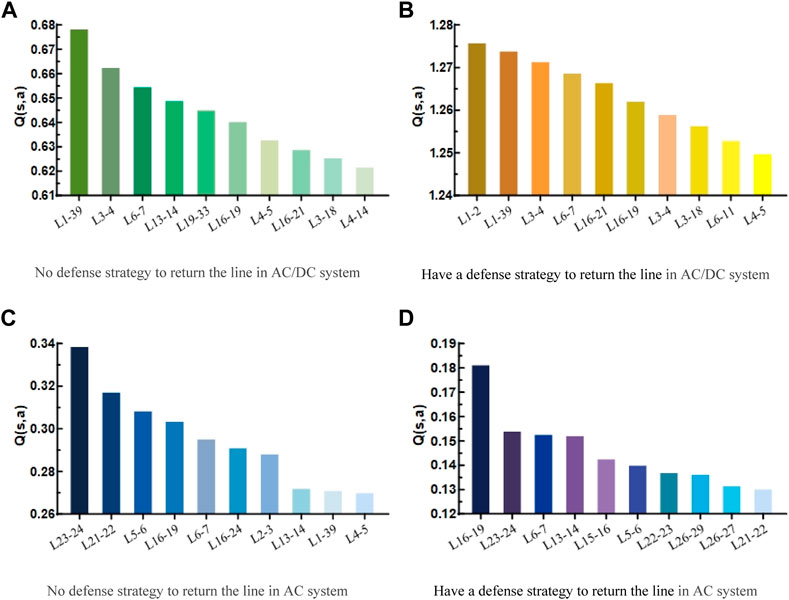
FIGURE 10. Return circuit diagram of system when T = 2.
The analysis of the faulty lines in Figure 10 shows a large part of duplication in the lines obtained by the search with or without the defines strategy. According to Figure 7, the fault lines mentioned above are lines around
The lines found are roughly the same whether in the AC system or the hybrid AC/DC system with the addition of DC lines and new energy generating units. However, owing to the influence of the new energy generating units and DC lines, the impact of the AC/DC system produces a larger Q value when a line closer to the DC system is decommissioned. Similarly, owing to the influence of the DC system, the risk caused by the failure of the system to produce a decommissioned line was greater than that of a pure AC system.
When three game phases are used, the attacker will cause multiple line failures in the hybrid system after attacking multiple phases, thus posing a significant threat to the grid. The risk ranking of the top ten ranked subsequent failed lines with and without the defense strategy is plotted in Figure 11.
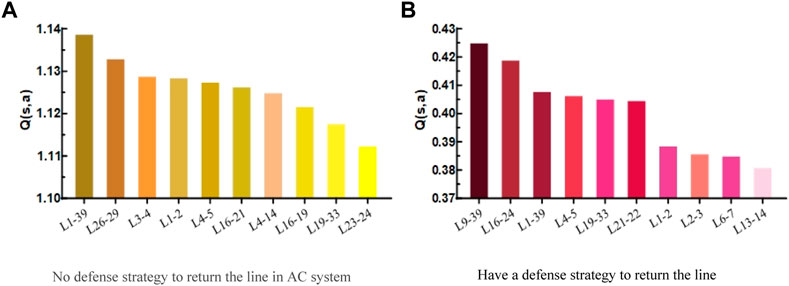
FIGURE 11. Circuit diagram of interlocking fault return when T = 3 in AC/DC system.
Because the optimal trip sequence needs to be searched by the fault gain function and the cumulative action value
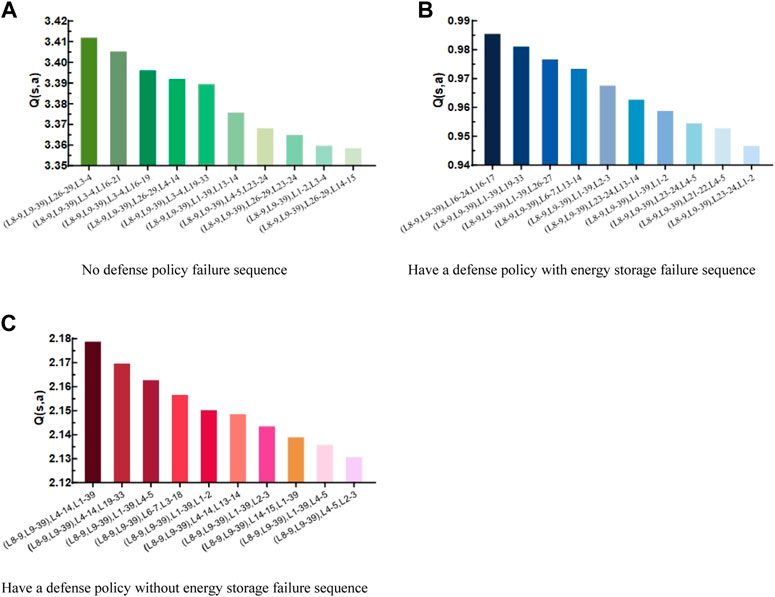
FIGURE 12. Interlocking fault trip sequence diagram with or without energy storage adjustment defense strategy.
An analysis of Figure 12 shows a significant difference between the cumulative
The cumulative benefit analysis shows that the attacker’s benefit is significantly higher without the defender’s participation than with the defender’s participation because the defender mainly aims to reduce grid losses. However, even if the defender adopts the optimal regulation strategy, the attacker still poses a greater risk to the system because the attackers are attacking the main system contact lines. Therefore, a large amount of energy storage system output must be regulated to mitigate the risk.
Using the above fault sequence
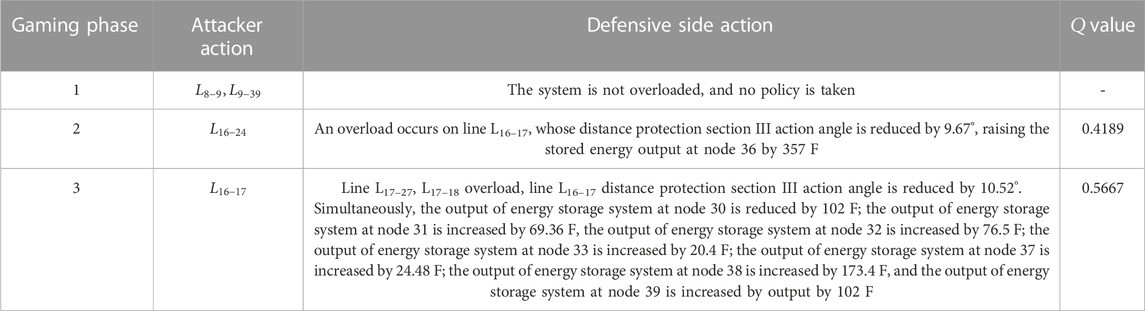
TABLE 1. Defense strategy with energy storage adjustment.
4.3.2 Comparison of energy storage system out of power participation or not
To consider the case of system failure when energy storage system capacity adjustment is used as the defense strategy here, the energy storage system output adjustment part of the original overall defense strategy is removed, and only the original AC side conventional defense strategy is retained before and after comparison. The chain fault trip sequence without energy storage adjustment defense strategy is plotted with the cumulative
Through the overall comparison of Figures 12B,C, it is first found that owing to the addition of new energy-generating units and DC lines in the hybrid AC/DC system, the original conventional AC steady-state defense strategy still plays a role in the chain fault of the AC/DC system. However, although the main role is still focused on the original direct connection line of each sub-grid and the adjustment at the level of conventional generating units, the DC lines and new energy units are not. Hence, it is impossible to take more defensive measures to reduce the final Q value, but there is still a greater risk threat. Second, when the energy storage system output adjustment comes into play, the cumulative Q value decreases significantly, and the risk of chain failures is significantly reduced by the joint action of the AC and DC sides, thus proving the feasibility of the defense strategy of increasing the energy storage system. Finally, comparing specific fault sequences reveals that after the addition of the energy storage system, the attacker of the system focuses more on its attack strategy of dealing with the connection between the nodes where the energy storage system is located after the second stage of the game. In contrast, the overall DC-side defense strategy makes it possible for each node to adjust individually, thus better targeting the attack strategy and proving the importance of the defense strategy to increase the energy storage system adjustment.
Using the fault sequence
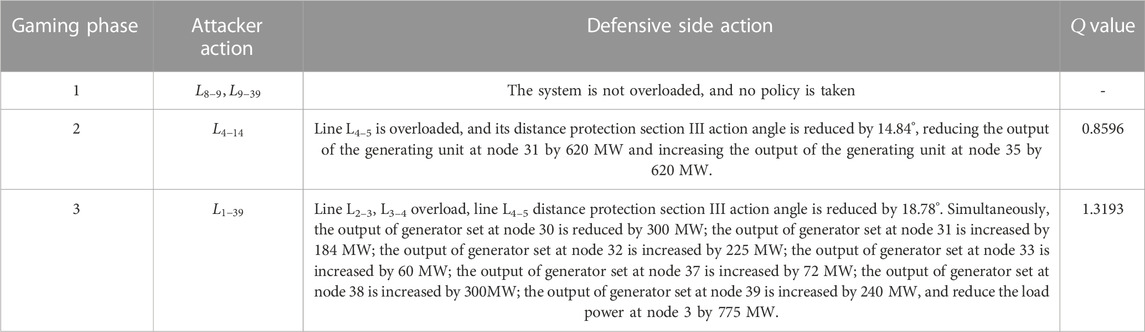
TABLE 2. Defense strategy without energy storage adjustment.
The above simulation results verify that the energy storage system adjustment as a defense strategy can be fast and efficient for interlocking faults in the hybrid AC/DC system. Because the energy storage system has a millisecond power response speed, it can effectively improve the resilience and flexibility of the hybrid AC/DC system, which can in turn minimize the damage caused and avoid the sudden load-cutting action of the system that would have otherwise caused greater losses on the user side. Similarly, the energy storage system can also smooth out the intermittent and fluctuating power generated by new energy-generating units, such as wind power and photovoltaics, during normal operation, which is conducive to new energy consumption.
4.3.3 Comparison of different methods
To show the advantages of the chain failure game model based on the deep reinforcement learning DQN algorithm proposed in this paper for obtaining the chain failure trip sequence and the optimal defense strategy, the simulation system in this paper is taken as an example, and compared with the traditional risk coefficient ranking method, and the results are shown in Table 3.

TABLE 3. Methods comparison.
It can be found from the table that the fault sequence found by the traditional risk ranking method is not the optimal sequence, which is only the fourth in the previous Figure 12A. The main reason is that the traditional risk ranking is to select the line with the highest risk as the attack target at each stage of cascading fault, which only considers the loss caused by each stage to the power grid, but does not consider the impact of the fault sequence on the power grid as a whole, It is easy to fall into local optimum; The model algorithm proposed in this paper focuses on the impact of a fault sequence on the power grid as a whole, and focuses on the global optimal defense strategy.
From the perspective of loss, the load loss is caused by the fault sequence found by the risk ranking method and the risk return is lower than the fault sequence in this paper, which shows that the algorithm in this paper can find the sequence that makes the maximum return. In the game with defense, the development direction of the fault sequence is changed, and the load loss and risk income caused by the fault sequence are far lower than those without defense, but it can find the fault sequence that makes the power system lose, so the model in this paper has certain advantages over the traditional risk ranking method.
5 Conclusion
The algorithm here considers the impact of interlocking faults on the AC/DC hybrid system from the perspectives of both steady-state and transient systems, establishes a multi-stage dynamic zero-sum game interlocking fault model by finding the fault sequence through the DQN algorithm, and proposes a corresponding defense strategy to provide reference to grid operation and dispatchers. In summary.
(1) This study proposes a method for searching chain fault-tripping sequences and finding optimal regulation and control strategies for hybrid AC/DC systems based on game deep reinforcement learning algorithms. The method applies the theory of multi-stage zero-sum game to the scheduling and control adjustment of the hybrid AC/DC system. It uses the DQN algorithm to train the optimal action value function to find the most threatening fault line in the complex hybrid grid and the optimal regulation and control defense strategy to reduce the risk of the grid.
(2) Here, a multi-stage zero-sum game chain fault model for an AC/DC hybrid system is proposed, which can completely describe the dynamic process after the chain fault occurs in an AC/DC hybrid grid and the involvement of a regulation strategy. Furthermore, a novel deep reinforcement learning algorithm was used to solve the Nash equilibrium of the game model, which improved the convergence and accuracy of the algorithm.
(3) The multi-feeder short-circuit ratio constraint method and the energy storage system adjustment strategy were used as defense strategies to cope with the faults occurring in the DC system in the hybrid AC/DC system. The energy storage system is fully utilized to improve the fault ride-through capability of new energy units and the rapidity and economy of fault handling. Considering the scheduling of the energy storage system at the whole grid level, it is superior as a defense strategy to cope with interlocking faults in complex AC/DC systems.
Data availability statement
The original contributions presented in the study are included in the article/Supplementary Material, further inquiries can be directed to the corresponding author.
Author contributions
The XD wrote the original draft. SW, WW, PY and XX provided the supervision, review, and editing of the draft. All authors contributed to the article and approved the submitted version.
Funding
This work was Funded by the National Nature Fund (51777119).
Conflict of interest
WW was employed by the State Grid Wenzhou Power Supply Company.
The remaining authors declare that the research was conducted in the absence of any commercial or financial relationships that could be construed as a potential conflict of interest.
The Reviewer HF declared a shared affiliation with the author XD, SW at the time of the review.
Publisher’s note
All claims expressed in this article are solely those of the authors and do not necessarily represent those of their affiliated organizations, or those of the publisher, the editors and the reviewers. Any product that may be evaluated in this article, or claim that may be made by its manufacturer, is not guaranteed or endorsed by the publisher.
References
Cao, Y. J., Chen, Y. R ., Cao, L. H., and Tan, Y. D. (2012). Prospects of studies on application of complex system theory in power systems[J]. Proc. CSEE 32 (19), 1–9+178. doi:10.13334/j.0258-8013.pcsee.2012.19.001
Cao, Y. J., Wang, G. Z., Cao, L. H., and Ding, L. J. (2011). An identification model for self-organized criticality of power grids based on power flow entropy[J]. Automation Electr. Power Syst. 35 (07), 1–6. CNKI:SUN:DLXT.0.2011-07-002.
Dai, W. C., Dong, Y., Zhao, X. F., Shang, X. J., Gao, K., and Jin, P. (2016). Allocated method for capacity of energy storage based on adjustment of SOC[J]. Acta Energiae Solaris Sin. 37 (2), 261–268. doi:10.3969/j.issn.0254-0096.2016.02.001
Dey, P., Mehra, R., Kazi, F., Wagh, S., and Singh, N. M. (2016). Impact of topology on the propagation of cascading failure in power grid. IEEE Trans. Smart Grid 7 (4), 1970–1978. doi:10.1109/TSG.2016.2558465
Ding, M., Qian, Y. C., and Zhang, J. J. (2017). Multi-timescale cascading failure evolution and risk assessment model[J]. Proc. CSEE 37 (20), 5902–5912. doi:10.13334/j.0258-8013.pcsee.162612
Ding, M., Qian, Y. C., Zhang, J. J., He, J., and Yi, J. (2016). Coordinated control model of power system cascading failures based on risk assessment[J]. Automation Electr. Power Syst. 40 (07), 1–8. doi:10.7500/AEPS20150522005
Duan, J., Yi, Z., Shi, D., Lin, C., Lu, X., and Wang, Z. (2019). Reinforcement-learning-based optimal control of hybrid energy storage systems in hybrid AC–DC microgrids. IEEE Trans. Industrial Inf. 15 (9), 5355–5364. doi:10.1109/TII.2019.2896618
Fan, W. L., Zhang, X. M., Mei, S. W., and Huang, S. W. (2018). Vulnerable transmission line identification considering depth of K -shell decomposition in complex grids. IET Generation, Transm. Distribution 12 (5), 1137–1144. doi:10.1049/iet-gtd.2017.0767
Fang, Y. (2014). Reflections on stability technology for reducing risk of system collapse due to cascading outages. J. Mod. Power Syst. Clean Energy 2 (3), 264–271. doi:10.1007/s40565-014-0067-x
Li, X. J., Ma, H. M., and Jiang, Q. (2022). Review of energy storage configuration technology on renewable energy side[J]. Electr. Power 55 (01), 13–25. doi:10.11930/j.issn.1004-9649.202109032
Lin, W. F., Tang, Y., and Bu, G. Q. (2008). Study on voltage stability of multi-infeed HVDC power transmission system[J]. Power Syst. Technol. 32 (11), 7–12.
Lin, X. N., Xia, W. L., Xiong, W., Li, Z. T., Liu, X. C., and Liu, J. Z. (2011). Study of adaptive adjustment of operation characteristics of distance backup protection immune to the impact of power flow transferring[J]. Proc. CSEE 31 (S1), 83–87. doi:10.13334/j.0258-8013.pcsee.2011.s1.036
Liu, J., Yao, W., Hou, Y. H., Wen, J. Y., and Chen, X. (2016). Stability control for improving the characteristic of wind farm injection current during low voltage ride-through using energy storage system[J]. Trans. China Electrotech. Soc., 31(14):93–103. doi:10.19595/j.cnki.1000-6753.tces.2016.14.011
Liu, S. Q., Gu, J., Lai, B. X., and Jin, Z. J. (2022). Bi-level optimal allocation of energy storage in regional integrated energy system considering load margin[J]. Electr. Power Autom. Equip., 42(07):150–158. doi:10.16081/j.epae.202202022
Mnih, V., Kavukcuoglu, K., Silver, D., Rusu, A. A., Veness, J., Bellemare, M. G., et al. (2015). Human-level control through deep reinforcement learning. Nature 58 (7540), 529–533. doi:10.1038/nature14236
Song, F. L., Wu, Z. Y., and Zhang, Y. (2018). Fuzzy scene clustering based grid-energy storage coordinated planning method with large-scale wind power[J]. Electr. Power Autom. Equip. 38 (02), 74–80. doi:10.16081/j.issn.1006-6047.2018.02.010
Tian, L., Zhang, Y., and Li, D. X. (2016). Power-type storage system capacity configuration and control strategy for enhancing LVRT ability[J]. Electr. Power Constr. 37 (8), 84–89. doi:10.3969/j.issn.1000-7229.2016.08.013
Van Hasselt, H., Guez, A., and Silver, D. (2016). “Deep reinforcement learning with double Q-learning[C],” in Proceedings of the Thirtieth AAAI conference on artificial intelligence, 12 February 2016, 2094–2100. doi:10.48550/arXiv.1509.06461
Wang, T., Liu, Y. M., Gu, X. P., and Qin, X. H. (2019). Vulnerable lines identification of power grid based on cascading fault space-time graph[J]. Proc. CSEE 39 (20), 5962–5972+6176. doi:10.13334/j.0258-8013.pcsee.181730
Xu, L., Wang, X. L., and Wang, X. F. (2010). Electric betweenness and its application in vulnerable line identification in power system[J]. Proc. CSEE 30 (01), 33–39. doi:10.13334/j.0258-8013.pcsee.2010.01.007
Xu, Y., Zhi, J., and Fan, S. T. (2017). Line overload emergency control based on power sensitivity and minimized economic compensation[J]. Electr. Power Autom. Equip. 37 (1), 118–123. doi:10.16081/j.issn.1006-6047.2017.01.019
Yan, G. G., Zhu, W., and Duan, S. M. (2020). Power control strategy of energy storage system considering consistency of lead carbon battery pack[J]. Automation Electr. Power Syst. 44 (11), 61–67. doi:10.7500/AEPS20190911004
Yang, L., Sun, Q., Zhang, N., and Li, Y. (2022). Indirect multi-energy transactions of energy Internet with deep reinforcement learning approach. IEEE Trans. Power Syst. 37 (5), 4067–4077. doi:10.1109/TPWRS.2022.3142969
Yang, W. H., Bi, T. S., Xue, A. C., Huang, S. F., and Yang, Q. X. (2011). Adaptive strategy for back up protections within power transferring area against cascading trips[J]. Automation Electr. Power Syst. 35 (18), 1–6.
Ying, Y., Liu, Q., Wu, M., and Zhai, Y. (2023). Online energy management strategy of the flexible Smart traction power supply system. IEEE Trans. Transp. Electrification 9 (1), 981–994. doi:10.1109/TTE.2022.3192141
Zhang, J., Tong, X. Y., and Jiang, J. W. (2017). Analysis on power system cascading failure based on percolation and risk theory[J]. Automation Electr. Power Syst. 41 (5), 46–52. doi:10.7500/AEPS20160515018
Keywords: AC/DC hybrid power system, cascading failure, energy storage system, deep reinforcement learning, multi-stage dynamic zero-sum game
Citation: Deng X, Wang S, Wang W, Yu P and Xiong X (2023) Optimal defense strategy for AC/DC hybrid power grid cascading failures based on game theory and deep reinforcement learning. Front. Energy Res. 11:1167316. doi: 10.3389/fenrg.2023.1167316
Received: 16 February 2023; Accepted: 20 March 2023;
Published: 31 March 2023.
Edited by:
Huan Xi, Xi’an Jiaotong University, ChinaReviewed by:
Yushuai Li, University of Oslo, NorwayHong Fan, Shanghai University of Electric Power, China
Copyright © 2023 Deng, Wang, Wang, Yu and Xiong. This is an open-access article distributed under the terms of the Creative Commons Attribution License (CC BY). The use, distribution or reproduction in other forums is permitted, provided the original author(s) and the copyright owner(s) are credited and that the original publication in this journal is cited, in accordance with accepted academic practice. No use, distribution or reproduction is permitted which does not comply with these terms.
*Correspondence: Shirui Wang, MjgzMTI2MzQ1QHFxLmNvbQ==