 Guanpeng Lu
 Ping Yang*
 Yi Yang
 Yufeng Tang
- Electric Power College of South China University of Technology, Guangzhou, China
The energy allocation method for regulable hydropower plants under the spot market significantly impacts their income. The available studies generally draw on the Conditional Value-at-Risk (CVaR) approach, which typically assumes a fixed risk aversion coefficient for generators. This assumption is based on the assumption that the total energy the power plant can allocate is constant during the decision period. However, the amount of energy that the regulable hydropower plant can generate will be affected by inflow and water level during the decision period, and the assumption of the fixed risk aversion coefficient is only partially consistent with the actual decision behavior of the hydropower plant. In this regard, the time-varying relative risk aversion (TVRRA) based method is proposed for the energy allocation of regulable hydropower plants. That method takes the change value of the hydropower plant’s energy generation as the basis for adjusting the time-varying relative risk aversion coefficient to make the energy allocation results more consistent with the actual decision-making needs of the hydropower plant. A two-layer optimal method is proposed to obtain the income-maximizing energy portfolio based on regulable hydropower plants’ time-varying relative risk aversion coefficient. The inner point method solves the optimal energy portfolio of income and risk in the upper layer. The time-varying relative risk aversion coefficient in the lower layer accurately describes the dynamic risk preference of hydropower plants for each period. The results and comparison show that the proposed method increases the income of the energy portfolio by 31%, and water disposal of regulated hydropower plants is reduced by 2%. The energy portfolio optimization method for regulable hydropower plants proposed in this paper not only improves the economic income of hydropower plants but also improves the utilization rate of hydro energy resources and enhances the market competitiveness of regulable hydropower plants.
1 Introduction
1.1 Motivation
Currently, China’s power market is mainly based on forward contract trading, and the construction of the spot market is gradually promoted. Regulable hydropower plants must allocate their energy in the forward contract and spot market to construct the energy portfolio for obtaining income. How to optimize the energy allocation of regulable hydropower plants to build the optimal power portfolio is becoming one of the research hotspots in the field of hydropower power trading research (Rotting and Gjelsvik, 1992; Maceira et al., 2002; Pereira-Bonvallet et al., 2016; Fernandes et al., 2018). Studying optimal energy portfolio methods of regulable hydropower plants under the spot market environment helps provide decision support for regulable hydropower plants to participate in market competition. It has important theoretical and engineering practical value for promoting high-quality hydropower development.
1.2 Related works and research gaps
Under the spot market environment, regulable hydropower plants need to make energy allocation decisions considering the risk of energy income due to the uncertainty of inflow and spot price and optimally allocate energy in the forward contract market and spot market to maximize the combined revenue-risk utility of the energy portfolio. For the problem of how to reasonably optimize the energy portfolio of regulable hydropower plants, Stochastic Programming (Bookstaber and McDonald, 1987; Moiseeva and Hesamzadeh, 2018; Camal et al., 2019; Lu et al., 2020), Robust Optimization (Soroudi, 2013), Minimum Variance (MV) (Liu and Wu, 2007a), Value-at-Risk (VaR) (Liu and Wu, 2007b; Safdarian et al., 2013) and Conditional Value-at-Risk (CVaR) (Carrión et al., 2007; Catalão et al., 2011) methods have been applied. Stochastic Programming requires a good estimation of the probability distribution of the uncertain parameters. Robust Optimization also requires a good definition of the uncertainty set. The MV approach and the VaR approach assume that returns are normally distributed. However, the electricity market’s income has significant skewness and fat-tail characteristics (Gong et al., 2009), which can lead to a lower risk value than the actual one obtained by using the above approach. CVaR has the advantage of not needing to solve the analytical formula of the joint distribution of multivariate risk variables, which is difficult to obtain in general, and can correctly distinguish the upward and downward deviations of energy portfolio income to avoid overly conservative optimization results, and can accurately reflect the tail loss risk of the energy portfolio, compared with other methods, and has been widely used in energy portfolio optimization studies.
Researchers have carried out a lot of research on CVaR-based energy portfolio optimization. The literature (Carrión et al., 2007) proposed an income risk measurement model for the energy portfolio of distribution enterprises based on the CVaR method considering spot price and load fluctuations. The literature (Catalão et al., 2011) constructed a risk optimization model for energy purchases by large energy consumers based on stochastic programming and CVaR methods. The risk aversion coefficient in CVaR reflects the risk aversion of energy producers, who will select the energy portfolio with the highest combined benefit-risk utility when making energy allocation decisions. Therefore, the value of the risk aversion coefficient has a significant impact on the income of the generator. The risk aversion coefficient in CVaR is assumed to be fixed (Fix Risk Aversion, FRA) in the above literature because the calculation of the risk aversion coefficient is based on the assumption that the total energy of the power plant is constant during the decision period. However, for regulable hydropower plants, the total energy over the decision period is affected by inflow and reservoir regulation capacity, and assuming a fixed risk aversion coefficient may lead to overly conservative or aggressive results in the optimization solution.
Some empirical tests and experimental results in recent years have shown that risk aversion is a time-varying, state-dependent variable more in line with the facts (Steffensen, 2011; Björk et al., 2014; Hentschel, 2015; Cui et al., 2016; Díaz and Esparcia, 2021), and some scholars have proposed the concept of Time-Varying Relative Risk Aversion (TVRRA) coefficient and applied it to the study of portfolio optimization, and achieved some results. The literature (Atmaca, 2022) proposes a portfolio optimization model that applies the time-varying risk aversion coefficient, which can follow the market trend to adjust the risk preferences of market participants, and verifies that the model has more stable profitability performance and risk aversion compared to the model with fixed risk preferences. In (Garcia et al., 2017), an energy portfolio optimization method based on the Sharpe and Treynor ratios of the electricity market that dynamically adjusts the risk aversion coefficient is proposed and validated using data from the Turkish day-ahead market, and the results show that the optimized energy portfolio has a better performance level. The above study shows that the portfolio optimized based on TVRRA has better return performance compared to fixed risk aversion coefficients while also achieving more flexible risk management effects. However, the introduction of a time-varying relative risk aversion coefficient in the optimal energy portfolio problem of regulable hydropower plants has not been studied yet, and further research and verification are needed on how to construct the TVRRA-based optimal energy portfolio method for regulable hydropower plants, the analysis of the effect of this optimal energy portfolio method and the influence of the regulable capacity of hydropower plants on the optimization effect.
1.3 Contributions
This study first analyzes the energy allocation framework for regulable hydropower plants under the spot market. Then we propose an energy portfolio method by introducing a time-varying relative risk aversion coefficient. We establish a two-layer solution method in the optimization stage to obtain the optimal energy portfolio. Compared with the fixed risk aversion coefficient, this method can improve the performance of the energy portfolio under a scenario with a high inflow fluctuation range. In summary, the main contributions of this paper include:
(1) An energy portfolio method by introducing a time-varying relative risk aversion coefficient is established is proposed. The method uses the change value of the hydropower plant’s energy generation adjusting the time-varying relative risk aversion coefficient to improve the energy portfolio’s income.
(2) A two-layer solution method that uses the interior point method to solve the optimal power portfolio in the upper layer and the DDDP method to solve the optimal risk aversion coefficient in the lower layer.
The optimal energy portfolio models with TVRRA and FRA are modeled through the GAMS platform. And then, we compare their performance in the energy portfolio’s income, the average water level per unit of energy generation, and the water level during the peak electricity demand period.
The paper is organized as follows. In Section 2, we introduce the energy allocation model for regulable hydropower plants. Include the objective function and constraints for energy portfolio optimization and gives the solution method. Section 3 provides the simulation results and analysis. Section 4 concludes the paper.
2 Optimal energy portfolio method based on time-varying relative risk aversion coefficient
Based on the market rules in most regions of China at this stage, the regulated hydropower plants participate in two main markets of energy trades: the forward market and the spot market. Assuming that the regulable hydropower plants participate in the spot market as price takers, the energy allocation decision behavior of regulable hydropower plants does not affect the spot price. Under the spot market environment, the regulable hydropower plant first gets the monthly planned energy generation for each month of the year according to the medium and long-term operation plan and then allocates the energy in the forward contract market and the spot market reasonably according to the forecast results of spot price, inflow, reservoir operation, and its own risk preference, in order to obtain more income. The energy allocation framework of regulable hydropower plants is shown in Figure 1.
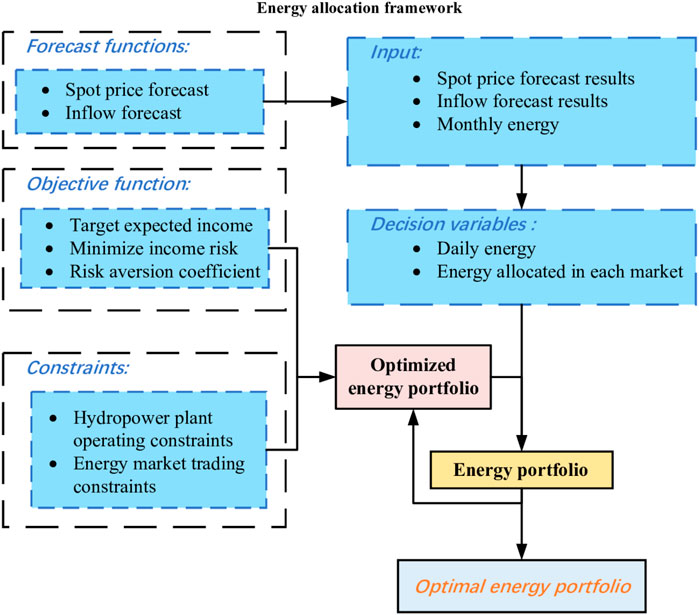
FIGURE 1. Regulable hydropower plants’ framework.
2.1 Objective function
The optimal energy allocation method based on a time-varying relative risk aversion coefficient can be described by a two-layer optimization framework, in which the upper optimization layer determines the energy portfolio of regulable hydropower plants, and the lower optimization layer determines the risk aversion coefficient under different spot prices, inflow, and reservoir operation conditions, whose framework diagram is shown in Figure 2.
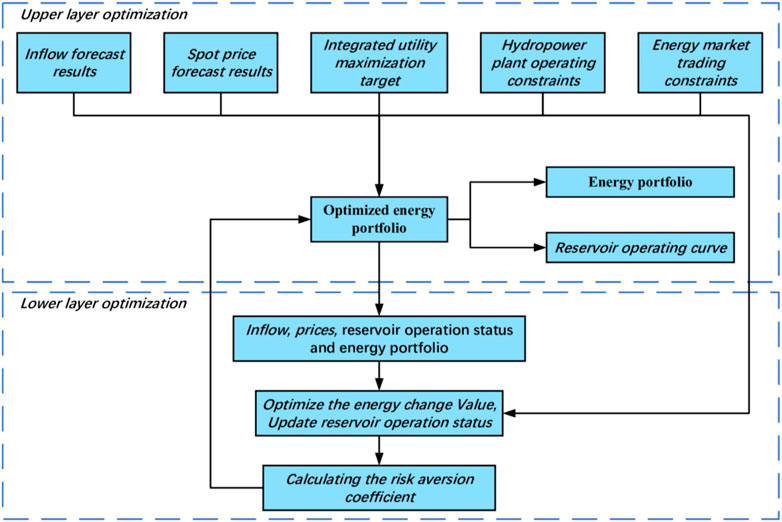
FIGURE 2. Double-layer optimization framework.
2.1.1 Upper layer objective function
The upper layer objective function for the optimal allocation of regulable hydropower plants’ energy is to maximize the combined benefit-risk utility of the energy portfolio, as shown in Eq. 1 (Ma et al., 2018).
Where:
2.1.1.1 The income function
Where
2.1.1.2 The risk function
Where
2.1.1.3 Risk aversion coefficient
Where
Where
2.1.2 Lower layer objective function
The lower layer objective function for the optimal allocation of regulable hydropower plants’ energy is to maximize the income from the daily energy generation change, as in Eq. 8.
2.2 Constraints
2.2.1 Upper layer constraints
The upper layer constraints include hydropower plant operating constraints (Yu et al., 2008) and energy market trading constraints (Li et al., 2022).
2.2.1.1 Hydropower plant operating constraints
2.2.1.1.1 Regulable reservoir capacity constraint
Where:
2.2.1.1.2 Water balance constraint
Where:
2.2.1.1.3 Hydropower plant outflow constraint
Where
2.2.1.1.4 Hydropower plant generation constraint
Where
2.2.1.2 Energy market trading constraints
Where:
2.2.2 Lower layer constraints
The lower layer constraints include hydropower plant operation and power market trading constraints. And only different constraints are shown to avoid duplication with the upper layer.
2.2.2.1 The hydropower plant operation constraints
2.2.2.1.1 Flow balance constraints
Where:
2.2.2.1.2 Inflow and outflow constraints
Where:
2.2.2.2 The energy market trading constraints
Where:
2.3 Solving method
The widely used two-layer optimization method is to derive the KKT (Karushe-Kuhne-Tucker) condition for the lower optimization and convert the lower one into the upper optimization constraint for solving. The optimization problem of the risk aversion coefficient of hydropower plants is non-linear programming, and its KKT conditions are difficult to obtain. Therefore, this paper uses the upper and lower optimization iterative methods to solve it. The initial solution of the objective function is first solved by using a fixed risk aversion coefficient in the upper optimization layer. Then the energy portfolio and reservoir operation state are used as the initial values in the lower optimization layer. The approximate solution of the risk aversion coefficient obtained in the lower optimization layer is sent back to the upper optimization layer to obtain new optimization results. The difference between the latest two results is compared, and the cycle is stopped when the difference meets the set accuracy requirements.
The integration of the joint probability density function
To simplify the solution process, introducing the dummy variables
The constraint of Eq. 13 is rewritten as:
The transformed objective function and constraints constitute the Linear Programming (LP) problem, which is solved in this paper using the Interior Point Method (IPM) (Wei et al., 1998; Wächter and Biegler, 2005; Nguyen et al., 2020), which is widely used in solving LP.
The lower layer optimization problem of the risk aversion coefficient is characterized by high dimensional order, multi-stage, non-linearity, and multiple constraints. To solve this type of optimization problem, researchers have proposed improved stochastic fractal search algorithm (ISFSA) (Phan et al., 2021), Coyote Optimization Algorithm (COA) (Heidari et al., 1971) and Discrete Differential Dynamic Planning (DDDP) (Bookstaber and McDonald, 1987; Diniz et al., 2020), etc. Among them, DDDP has the advantage of finding the optimal solution only in the locally feasible domain of state variables, which can effectively reduce the computational storage and computing time compared with other algorithms. This paper uses DDDP to solve the lower optimization problem. The flow chart of the solution is shown in Figure 3.
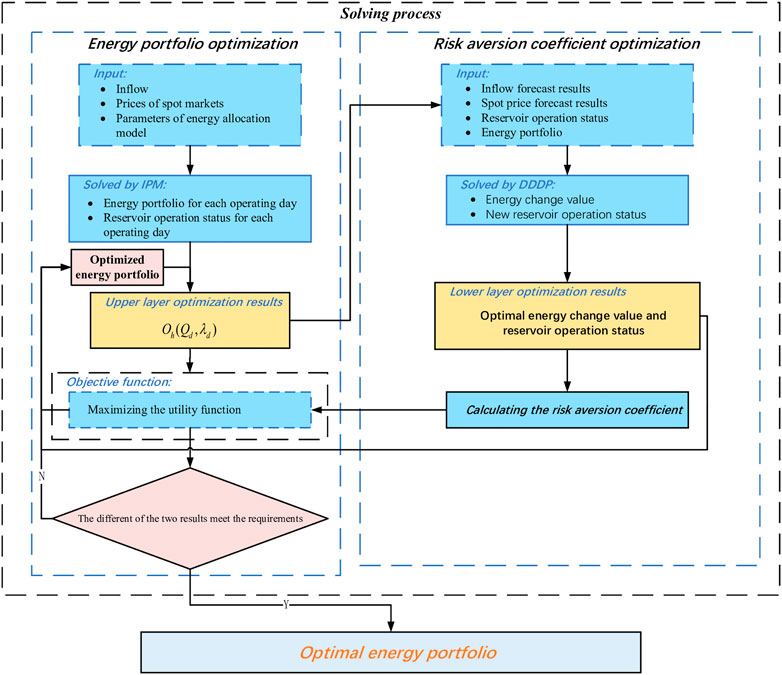
FIGURE 3. Solution process flow chart.
The solution steps are as follows.
(1) First, input the prediction results of inflow and spot price, then set the initial parameters of hydropower plant operation. Use the fixed risk coefficient to calculate the initial solutions of the energy portfolio and reservoir operation state sequence.
(2) Use the initial solutions of the energy portfolio and reservoir operation state as the initial values of the risk aversion coefficient optimization, calculate the energy change values and the new reservoir operation state, and output the approximate risk aversion coefficient.
(3) Use the approximate risk aversion coefficient as the parameter of the upper layer optimization objective function to solve the new energy portfolio and reservoir operation state sequence.
If the difference between them is less than the required accuracy
3 Simulation example
3.1 Data and parameters setting
A regulable hydropower plant in the upper reaches of the Jinsha River, which has a strong regulating capacity and is close to a provincial load center, is used as the study object, and its energy generation does not affect the price of the spot market in the province. The confidence level
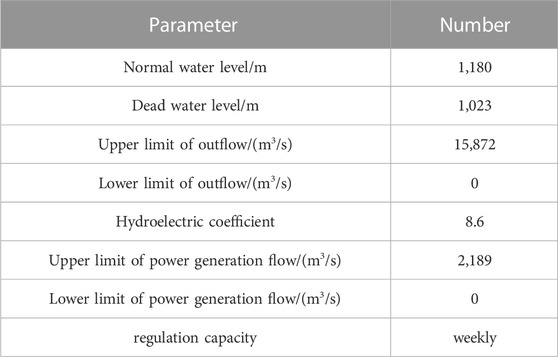
TABLE 1. Main parameters of hydropower station.
The CVaR calculation generally adopts the historical simulation method, which has the advantages of no need to estimate the distribution of trading varieties’ returns and no assumptions about model and parameter estimation risks. However, it requires at least 1,500 data for each trading market. China’s electricity spot market is still in the construction stage, and the trading rules are still being adjusted according to the trial run. So the data before the adjustment of trading rules cannot objectively reflect the latest market returns, and the data only after the rules adjustment is used less in quantity. The bootstrapping method can get the data of new data of good nature by repeated re-sampling in the case of small samples [34], which is a suitable data augmentation method for electricity spot markets with non-normal return distributions. To improve the accuracy of the optimization method, we first use the Bootstrapping method to augment the historical data:
• Forward contract prices (FCP).
• Spot prices (SP).
• Inflow.
Subsequently, the four essential statistical parameters of the augmented data, namely, the mean, variance, skewness, and kurtosis, were compared with those of the original historical data to establish the validity of the augmented data. The outcomes of the analysis are presented in Table 2.
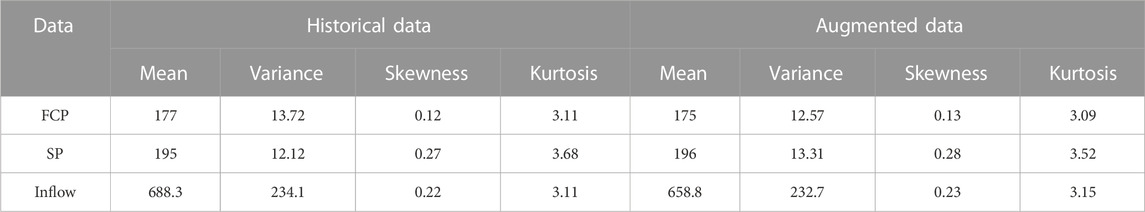
TABLE 2. Statistical indicators of historical data and simulated data.
The analysis of the matching of hydropower spot energy and the spot price is shown in Figure 4. The matching of hydropower plants in the spot market energy and the spot price is low, and hydropower plants need to improve the revenue of spot market power by follows:
(1) Optimizing the energy allocated in the spot market on each operating day.
(2) Allocating spot energy to the high price days in the spot market as much as possible.
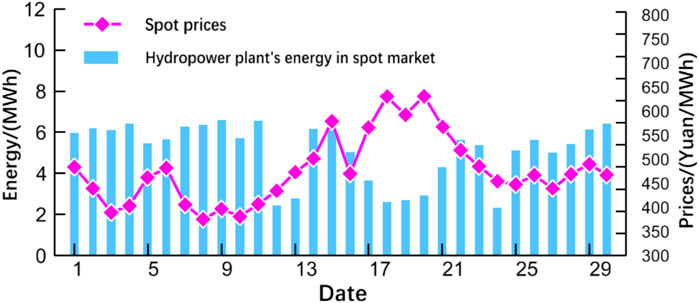
FIGURE 4. The matching analysis result of the hydropower plant’s energy in the spot market and the spot price.
3.2 Analysis of results
3.2.1 Analysis of optimization results
The results of the monthly energy portfolio optimization for the regulable hydropower plants are shown in Figure 5 and Table 3.
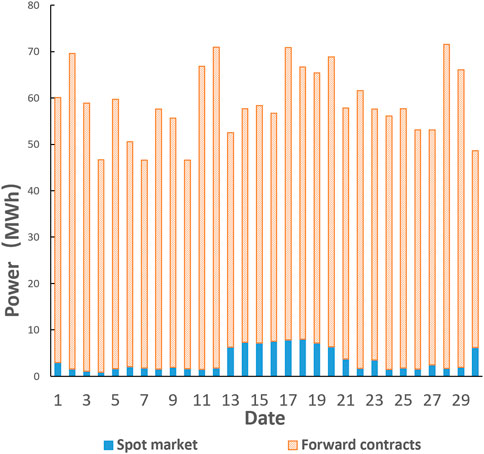
FIGURE 5. Result of the optimized energy portfolio.
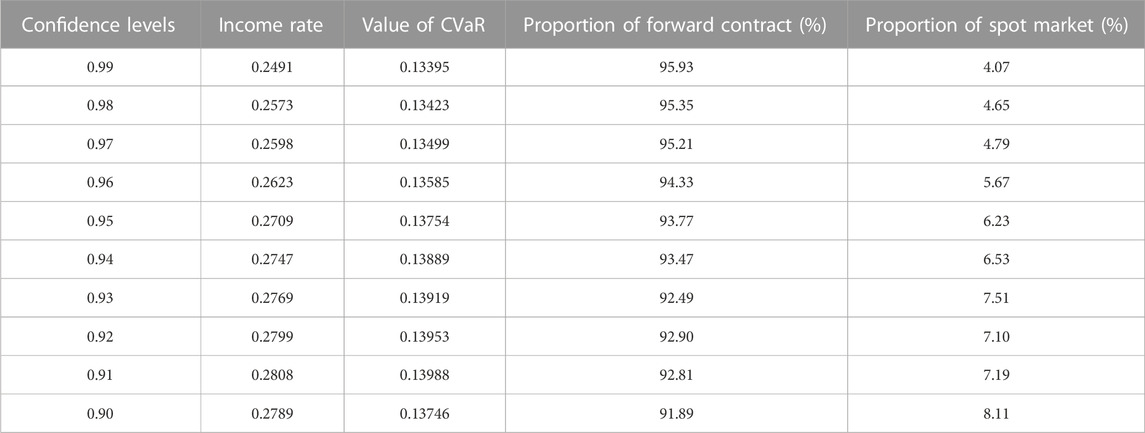
TABLE 3. Portfolios at different confidence levels.
The analysis of Figure 5 and Table 3 proves the effectiveness of the energy portfolio optimization method proposed in this paper.
(1) Forward contracts account for a large proportion of the monthly energy portfolio of regulable hydropower plants. Hydropower plants effectively lock in their income through forward contracts, reducing the overall risk of the energy portfolio, and the optimization results are in line with the actual situation of hydropower plant operation.
(2) As the set confidence level decreases, both the income and the risk value of the energy portfolio obtained from the optimization calculation increase simultaneously. That reflects the adjustable hydropower plant operators can obtain more income while being willing to take more risks, and the calculation results are consistent with the hydropower plant operators in the real market decision-making situation.
Figure 6 shows the variation in the inflow forecast data and the water level of the hydropower plant during the optimization process. Figure 7 shows the changes in the risk aversion coefficient of the hydropower plant for the energy portfolio in the optimization process. In the initial stage, the water level of the hydropower plant is high, the inflow is small, and the hydropower plant arranges the energy in an orderly manner to gradually reduce the water level. The risk aversion coefficient of the hydropower plant is low, and the hydropower plant has an aggressive risk appetite. From day 1 to day 6, the risk aversion coefficient gradually increases as the water level decreases. On day 7, the hydropower plant encounters a round of large inflow as the water level of the hydropower plant is high. The risk aversion coefficient turns from increasing to decreasing, and the risk preference of the hydropower plant is strengthened. On Day 9, after the influence of large inflow disappears, the water level of the hydropower plant gradually decreases, and the risk aversion coefficient increases simultaneously. From day 17 to day 22, when the second inflow is higher, the higher risk aversion makes the hydropower plants reduce the energy in the spot market. On day 23, the operating water level of the hydropower plants remains high, and the inflow maintains a higher flow until the end of the month. The risk aversion coefficient decreases slightly, which is conducive to the hydropower plants allocating more energy in the spot market and reducing water abandonment. The maxima and jumps in risk aversion coefficients occur from day 10 to day 16, when water levels and inflow fall simultaneously and truly reflect the operational behavior of hydropower plants. Hydropower plants tend to show a greater risk-averse preference during that period, allocating limited energy to forward contracts to avoid deviation assessment penalties.

FIGURE 6. Result of optimized water level curve and inflow process.
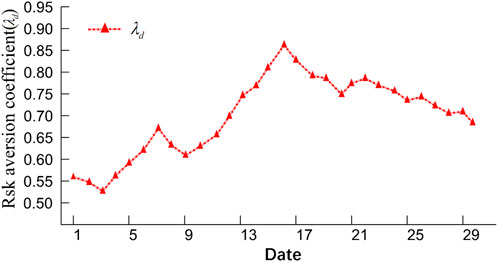
FIGURE 7. Risk aversion coefficient curve.
The energy allocated in the spot market before and after optimization in each operating day is shown in Figure 8. The optimized energy allocation curve of the hydropower plant has been improved to match the spot price. After the optimized allocation, the hydropower plant allocates the spot energy mainly in the high spot price periods and less energy in the low spot price periods. Among them, day 30 is the last operating day of the optimization cycle, and the hydropower station allocates all the remaining spot energy of the month on this operating day, resulting in the energy of this operating day not fully matching the electricity price. The Comparing of Figure 8 and Figure 4 shows that the hydropower plant improves the income of energy by shifting energy from the low price period to the high price period.
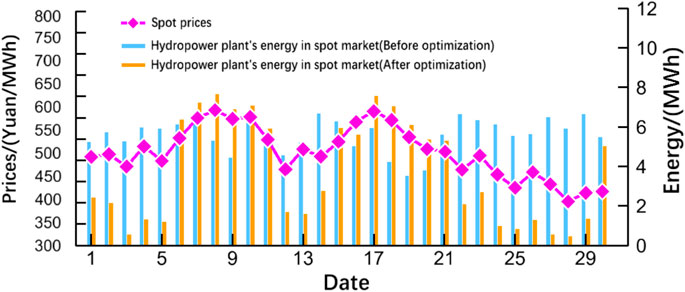
FIGURE 8. Energy portfolio before and after optimization.
3.2.2 The impact of hydropower plants’ regulable capacity
The optimization results of hydropower plants with different regulation capacities are shown in Table 4. The regulating capacity of the weekly regulating hydropower plant is smaller than that of the monthly regulating hydropower plant, and its water storage varies more drastically. The weekly-regulated hydropower plant completed the forward contract earlier, 4 days earlier than the monthly-regulated hydropower plant. This is due to the smaller regulation capacity of weekly regulation hydropower plants, which cannot fully hedge the uncertainty of inflow. The hydropower plant priority is given to completing forward contracts to avoid the risk of inflow uncertainty. The performance of the energy portfolio of monthly regulated hydropower plants is better than that of weekly regulated capacity hydropower plants. This is due to the stronger inflow uncertainty hedging capability of the monthly-regulated hydropower plants, which can allocate more energy to the higher-return spot market while ensuring the completion of the forward contracts. The simulation results show that the optimization method proposed in this paper is equally effective for hydropower plants with different regulation capacities.
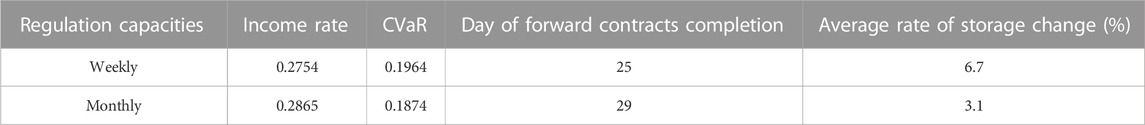
TABLE 4. Portfolio performance comparison with different regulation capacities.
3.3 Performance comparison
In order to verify the advantages of the proposed method in terms of risk management and energy income over the traditional method of energy allocation based on a fixed risk aversion coefficient, a comparison is made with the fixed risk aversion coefficient (
3.3.1 Energy portfolio optimization performance comparison
As shown in Table 5, under the same generation reservoir storage rate, the power portfolio income of the hydropower plant gradually decreases as the inflow fluctuation range gradually increases, which indicates that the increase of inflow uncertainty risk leads to the decrease of the energy portfolio income.
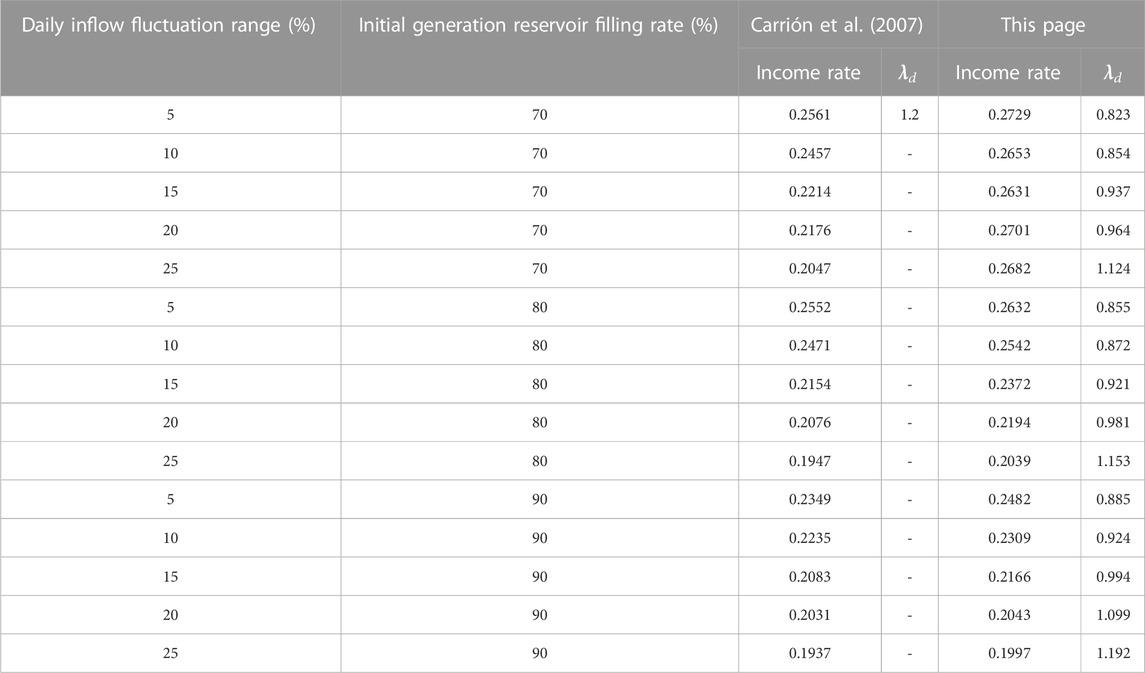
TABLE 5. Performance comparison of portfolio optimization.
The risk aversion coefficient of the proposed method is lower than that of the method in literature (Carrión et al., 2007), and the energy portfolio income is higher than that of the method in literature (Carrión et al., 2007) when both the income fluctuation range and the generation reservoir storage rate are low. With the gradual increase in the range of inflow fluctuation, the risk aversion coefficient obtained by the method proposed in this paper gradually increases, the energy portfolio income changes less, and the energy portfolio income obtained by the method in literature (Carrión et al., 2007) gradually decreases. In the scenario where the income fluctuation range is 25%, and the initial generation reservoir storage rate is 70%, the energy portfolio income obtained based on the method proposed in this paper is 31% higher than that of the literature (Carrión et al., 2007), which has a significant advantage. It shows that the method proposed in this paper can correctly use inflow forecast data and reservoir to adjust the risk aversion coefficient and effectively use the regulation capacity of hydropower plants to reduce the loss of energy portfolio income due to inflow uncertainty.
As the initial generation reservoir storage rate gradually increases, the advantage of the method proposed in this paper over the literature (Carrión et al., 2007) in terms of energy portfolio income gradually decreases. This is because the available regulation capacity gradually decreases, and the hydropower plant cannot fully hedge the loss of energy portfolio income due to inflow uncertainty by the reservoir. However, even in the scenario where the initial reservoir storage rate is 90%, the method proposed in this paper still has a 3%–5% advantage over the literature (Carrión et al., 2007) in terms of energy portfolio income.
3.3.2 Hydropower plant operation optimization performance comparison
As shown in Table 6, the TVRRA strategy significantly increases the average energy of hydropower plants during the water level (AEWL) by 4.1% compared to the FRA strategy. The average spillage of regulated hydropower plants is reduced by 2%, indicating that the TVRRA strategy can utilize the regulation capacity more effectively and reduce the water consumption of energy generation. The TVRRA strategy also increases the water level during electricity demand peak periods (WLP), which enables hydropower plants to generate more energy during peak load periods. Generally speaking, the price of electricity during peak periods is higher than in other periods. Hence, hydropower plants with higher operating water levels during peak periods are good for obtaining more economic income.
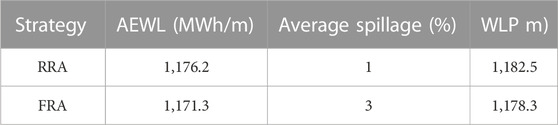
TABLE 6. Performance comparison of TVRRA and FRA.
4 Conclusion
This paper investigates the regulable hydropower plants’ energy portfolio optimization problem under the spot market. Firstly, an energy allocation model for regulable hydropower plants under the spot market is established. Then an optimal energy portfolio method for regulable hydropower plants with the introduction of a time-varying relative risk aversion coefficient is proposed based on the allocation model. The optimal allocation method uses the change value of the hydropower plant’s energy generation as the basis for adjusting the time-varying relative risk aversion coefficient to improve the performance of the energy portfolio optimization method. Finally, the following conclusions are drawn from the analysis of the results of the simulation.
(1) Compared with the fixed risk aversion coefficient, the proposed method accurately portrays the risk preferences of regulable hydropower plants in the energy allocation decision periods. It dynamically optimizes the energy portfolio according to this time-varying risk preference. The energy allocation curve obtained by this method matches the price curve better, and the energy portfolio income is improved by 31% under a scenario with an inflow fluctuation range of 25% and an initial reservoir storage rate of 70%.
(2) Compared with the fixed risk aversion coefficients, the proposed method increases the average water level per unit of energy generation in hydropower plants by 4.1% and reduces average spillage by 2%. At the same time, the hydropower plant has a higher water level during the peak electricity demand period, which improves favorable conditions for the hydropower plant to improve economic income further.
(3) The energy allocation method using a time-varying relative risk aversion coefficient can meet hydropower plants’ energy portfolio optimization needs with different regulation capacities. Still, the optimization effect is affected by the regulation capacity. Monthly regulation capacity hydropower plants can achieve a more effective energy portfolio effect than weekly regulation capacity hydropower plants using the optimal energy portfolio method using a time-varying relative risk aversion coefficient.
The construction of China’s electricity market is steadily advancing, and the models and algorithms described in this paper contain certain assumptions and simplifications. The energy portfolio optimization of hydropower plants needs to be studied in depth and tested in practice. The next step will be to conduct in-depth research on energy portfolio optimization according to the development of the electricity market.
Data availability statement
The raw data supporting the conclusions of this article will be made available by the authors, without undue reservation.
Author contributions
Author contributions: PY and GL designed the research, performed the research, and wrote the paper. YY and ZL analyzed the data, and YT collected the data.
Conflict of interest
The authors declare that the research was conducted in the absence of any commercial or financial relationships that could be construed as a potential conflict of interest.
Publisher’s note
All claims expressed in this article are solely those of the authors and do not necessarily represent those of their affiliated organizations, or those of the publisher, the editors and the reviewers. Any product that may be evaluated in this article, or claim that may be made by its manufacturer, is not guaranteed or endorsed by the publisher.
References
Atmaca, M. E. (2022). Portfolio management and performance improvement with Sharpe and Treynor ratios in electricity markets. Energy Rep. 8, 192–201. doi:10.1016/j.egyr.2021.11.287
Björk, T., Murgoci, A., and Zhou, X. Y. (2014). Mean–variance portfolio optimization with state-dependent risk aversion[J]. Math. Finance Int. J. Math. Statistics Financial Econ. 24 (1), 1–24. doi:10.1111/j.1467-9965.2011.00515.x
Bookstaber, R. M., and McDonald, J. B. (1987). A general distribution for describing security price returns. J. Bus. 60, 401–424. doi:10.1086/296404
Camal, S., Teng, F., Michiorri, A., Kariniotakis, G., and Badesa, L. (2019). Scenario generation of aggregated wind, photovoltaics and small Hydro production for power systems applications[J]. Appl. Energy 242, 1396–1406. doi:10.1016/j.apenergy.2019.03.112
Carrión, M., Philpott, A. B., Conejo, A. J., and Arroyo, J. M. (2007). A stochastic programming approach to electric energy procurement for large consumers. IEEE Trans. Power Syst. 22 (2), 744–754. doi:10.1109/tpwrs.2007.895164
Catalão, J. P. S., Pousinho, H. M. I., and Mendes, V. M. F. (2011). Optimal offering strategies for wind power producers considering uncertainty and risk. IEEE Syst. J. 6 (2), 270–277. doi:10.1109/jsyst.2011.2163009
Cui, X., Xu, L., and Zeng, Y. (2016). Continuous time mean-variance portfolio optimization with piecewise state-dependent risk aversion. Optim. Lett. 10 (8), 1681–1691. doi:10.1007/s11590-015-0970-8
Díaz, A., and Esparcia, C. (2021). Dynamic optimal portfolio choice under time-varying risk aversion. Int. Econ. 166, 1–22. doi:10.1016/j.inteco.2021.02.002
Diniz, A. L., Maceira, M. E. P., Vasconcellos, C. L. V., and Penna, D. D. J. (2020). A combined SDDP/Benders decomposition approach with a risk-averse surface concept for reservoir operation in long term power generation planning. Ann. Operations Res. 292 (2), 649–681. doi:10.1007/s10479-019-03419-4
Fernandes, G., Gomes, L. L., and Brandão, L. E. T. (2018). A risk-hedging tool for hydro power plants. Renew. Sustain. Energy Rev. 90, 370–378. doi:10.1016/j.rser.2018.03.081
Garcia, R. C., Gonzalez, V., Contreras, J., and Custodio, J. E. (2017). Applying modern portfolio theory for a dynamic energy portfolio allocation in electricity markets. Electr. Power Syst. Res. 150, 11–23. doi:10.1016/j.epsr.2017.04.026
Gong, X., Luo, X., and Wu, J. (2009). “Electricity auction market risk analysis based on EGARCH-EVT-CVaR model,” in 2009 IEEE International Conference on Industrial Technology, Churchill, VIC, Australia, 10-13 February 2009 (United States: IEEE), 1–5.
Heidari, M., Chow, V. T., Kokotović, P. V., and Meredith, D. D. (1971). Discrete differential dynamic programing approach to water resources systems optimization. Water Resour. Res. 7 (2), 273–282. doi:10.1029/wr007i002p00273
Hentschel, F. (2015). Optimal consumption and investment decisions under time-varying risk attitudes. SSRN Electron. J. 2015, 2607475. doi:10.2139/ssrn.2607475
Li, Z., Yang, P., Yang, Y., Lu, G., and Tang, Y. (2022). Solving stochastic hydro unit commitment using benders decomposition and modified stochastic dual dynamic programming. Front. Energy Res. 10 (2022), 955875. doi:10.3389/fenrg.2022.955875
Liu, M., and Wu, F. F. (2007). Portfolio optimization in electricity markets. Electr. Power Syst. Res. 77 (8), 1000–1009. doi:10.1016/j.epsr.2006.08.025
Liu, M., and Wu, F. F. (2007). Risk management in a competitive electricity market. Int. J. Electr. Power and Energy Syst. 29 (9), 690–697. doi:10.1016/j.ijepes.2007.05.003
Lu, J., Li, G., Cheng, C., and Yu, H. (2020). Risk analysis method of cascade hydropower station operation in medium term under multi-scale market copuling and settlement rules. Proc. CSEE 41 (3), 994–1003.
Ma, H., Chen, Y., Chen, Y., Liu, W., and Lin, S. (2018). Mechanism design of Southern China (starting from Guangdong Province) electric spot market. South. Power Syst. Technol. 12 (12), 42–48.
Maceira, M. E. P., Terry, L. A., Costa, F. S., Damazio, J. M., and &Melo, A. C. G. (2002). “Chain of optimization models for setting the energy dispatch and spot price in the Brazilian system,” in 14th power system computation conference—PSCC, Sevilla, Spain, 24-28 June 2002 (Germany: Springer).
Moiseeva, E., and Hesamzadeh, M. R. (2018). Strategic bidding of a hydropower producer under uncertainty: Modified benders approach. IEEE Trans. Power Syst. 33, 861–873. doi:10.1109/TPWRS.2017.2696058
Nguyen, T. T., Nguyen, T. T., Duong, M. Q., and Doan, A. T. (2020). Optimal operation of transmission power networks by using improved stochastic fractal search algorithm. Neural Comput. Appl. 32, 9129–9164. doi:10.1007/s00521-019-04425-0
Pereira-Bonvallet, E., Puschel-Lovengreen, S., Matus, M., and Moreno, R. (2016). Optimizing hydrothermal scheduling with non-convex irrigation constraints: Case on the chilean electricity system. Energy Procedia 87, 132–140. doi:10.1016/j.egypro.2015.12.342
Phan, V. D., Duong, M. Q., Doan, M. M., and Nguyen, T. T. (2021). Optimal distributed photovoltaic units placement in radial distribution system considering harmonic distortion limitation. Int. J. Electr. Eng. Inf. 13 (2), 354–367. doi:10.15676/ijeei.2020.13.2.7
Rotting, T. A., and Gjelsvik, A. (1992). Stochastic dual dynamic programming for seasonal scheduling in the Norwegian power system. IEEE Trans. Power Syst. 7 (1), 273–279. doi:10.1109/59.141714
Safdarian, A., Fotuhi-Firuzabad, M., and Lehtonen, M. (2013). A stochastic framework for short-term operation of a distribution company. IEEE Trans. Power Syst. 28 (4), 4712–4721. doi:10.1109/tpwrs.2013.2278076
Soroudi, A. (2013). Robust optimization based self scheduling of hydro-thermal Genco in smart grids[J]. Energy 61, 262–271. doi:10.1016/j.energy.2013.09.014
Steffensen, M. (2011). Optimal consumption and investment under time-varying relative risk aversion. J. Econ. Dyn. Control 35 (5), 659–667. doi:10.1016/j.jedc.2010.12.007
Wächter, A., and Biegler, L. T. (2005). Line search filter methods for nonlinear programming: Motivation and global convergence. SIAM J. Optim. 16 (1), 1–31. doi:10.1137/s1052623403426556
Wang, R., Shang, J. C., Zhou, X. Y., and Zhang, Y. C. (2005). “Risk assessment and management of portfolio optimization for power plants,” in 2005 IEEE/PES Transmission and Distribution Conference and Exposition: Asia and Pacific, Dalian, China, 18-18 August 2005 (United States: IEEE), 1–5.
Wei, H., Sasaki, H., Kubokawa, J., and Yokoyama, R. (1998). An interior point nonlinear programming for optimal power flow problems with a novel data structure. IEEE Trans. Power Syst. 13 (3), 870–877. doi:10.1109/59.708745
Keywords: hydropower plants, energy portfolio, risk measurement model, risk aversion coefficient, spot market
Citation: Lu G, Yang P, Li Z, Yang Y and Tang Y (2023) Optimal energy portfolio method for regulable hydropower plants under the spot market. Front. Energy Res. 11:1169935. doi: 10.3389/fenrg.2023.1169935
Received: 20 February 2023; Accepted: 27 March 2023;
Published: 06 April 2023.
Edited by:
Yu Dongmin, Nanchang University, ChinaCopyright © 2023 Lu, Yang, Li, Yang and Tang. This is an open-access article distributed under the terms of the Creative Commons Attribution License (CC BY). The use, distribution or reproduction in other forums is permitted, provided the original author(s) and the copyright owner(s) are credited and that the original publication in this journal is cited, in accordance with accepted academic practice. No use, distribution or reproduction is permitted which does not comply with these terms.
*Correspondence: Ping Yang, ZXBweWFuZ0BzY3V0LmVkdS5jbg==