 Kristina Džodić
 Željko Đurišić
- Department of Power Systems, School of Electrical Engineering, University of Belgrade, Belgrade, Serbia
The problem of frequency stability becomes more concerning as the presence of converter-interfaced units increases and conventional generators are suppressed. A decrease in total system inertia, inherently delivered by synchronous generators, results in abrupt frequency changes and jeopardizes power system stability. Therefore, securing sufficient flexible resources with frequency support capability is necessary. The rotational masses of wind turbines (WTs) are a significant and economical source of flexibility in power systems. However, the available kinetic energy (KE) of the WTs’ rotational masses depends on wind conditions and can only be exploited when the wind speed is sufficient for their rotation. When the wind speed is low, the WT is stopped and cannot support the frequency recovery. In this paper, a new concept of WT operation is proposed, which enables the permanent rotation of the WT under low and no wind conditions, making them reliable flexible resources that can continuously provide frequency support. Due to its widespread presence, the doubly-fed induction generator (DFIG) type of machine was considered. The variable-speed WT’s converter management allows rotational speed control, fast power injection, and release of the turbine’s stored KE even when no wind energy is available. The estimated accessible KE in the WT justifies the proposed concept, and the energy consumption due to motoring operation under low and no wind conditions is shown to be acceptable. A case study is performed for the South Banat region in Serbia to demonstrate the presented management concept. Additionally, a dynamic simulation was implemented to illustrate the permanent operation strategy’s impact on frequency stability in a low-inertia system under low and no wind conditions. Besides virtual inertia continuous capability, the proposed concept provides reduced wear of the WT mechanical components due to a lower number of on/off events.
1 Introduction
Environmental concerns accelerated the displacement of power plants relying on fossil fuels and intensified the integration of renewable energy sources (RES). This transition led to a significant dynamic characteristic change in power systems because most of these generation units are connected to the grid via power electronic converters and thus decoupled from the grid dynamics. Therefore, the overall system’s inertia reduces (Fernández-Guillamón et al., 2019; Makolo et al., 2021), resulting in deteriorated frequency behavior (Saha et al., 2023). The problem of system stability with a high share of RES is one of the main challenges regarding the sustainability of decarbonized power systems. To ensure the required level of stability and reliability of system operation, new inertia providers must take over the role of traditional power plants with synchronous generators (Shazon et al., 2022).
Inertia emulation, also known as synthetic or virtual inertia, combines power electronics and control algorithms to mimic the inertia of a conventional power system. Extensive research endeavors have been carried out to develop inertia emulation techniques (Cheema, 2020; M; Chen et al., 2020). These approaches may generally be distinguished based on the resource used as a synthetic inertia provider.
The first group is made of research where RES, namely, WTs and photovoltaic (PV) plants, are included in frequency control operations providing inertia response (Dreidy et al., 2017; Yap et al., 2019). In (Kushwaha et al., 2022), a novel day-ahead stochastic security-constrained unit commitment framework incorporates synthetic inertia and primary frequency support from wind and PV plants to ensure frequency response adequacy. In (Jawad and Masood, 2022) it is shown that PV plants can help to improve frequency parameters with appropriate deloading percentages for PV systems. Authors in (Hoke et al., 2017) implemented the rapid active power control method in a prototype PV inverter connected to a PV array. The response to various frequency events is experimentally confirmed to be fast and accurate. However, the drawbacks of using RES as inertia providers are the intermittency of the primary energy source and the fact that inertia response cannot always be guaranteed, yet it depends on available wind or solar energy.
Secondly, different energy storage systems (ESS) may be exploited to provide frequency services (Akram et al., 2020). Based on the review (Niu et al., 2023), the flywheel energy storage system (FESS) was concluded to be the most suitable candidate for inertia emulation. In (Karrari et al., 2020) adaptive controller based on inertia emulation is proposed for high-speed FESS while fuzzy-based virtual inertia with FESS is presented by (Kumar et al., 2022). The potential of stored energy in capacitor (Liang et al., 2023) to emulate the system inertia and superconducting magnetic energy storage (Salama et al., 2021) are also analyzed. Though ESS have fast response times, their application requires extra infrastructure, resulting in additional costs (Karbouj et al., 2019).
The third group of resources is distributed assets on the load side, such as electric vehicles (EVs) (Magdy et al., 2021; Khazali et al., 2022), smart loads (T. Chen et al., 2020), or heat pumps (Ibrahim et al., 2020). The problem arising from using EVs as inertia providers is that the cost incorporated to enable bidirectional response can be high, tear and wear of ESS of V2G stations due to the bidirectional response (Khalid and Peng, 2020) and state of battery packs due to accelerated aging (Khalid et al., 2022). In addition, large-scale implementation of these assets requires visibility of where the resources are to appropriately re-calibrate protection schemes, and response time is limited by customer comfort (Karbouj et al., 2019).
Due to their dimensions and KE storage potential, the rotating masses of WTs represent a significant and inexpensive flexibility resource (Aziz et al., 2018; Wang et al., 2018). Besides, virtual inertia can be easily integrated into existing information and communication infrastructure for remote control (Karbouj et al., 2019). However, the synthetic inertia capability of WTs strongly depends on wind speed, and it cannot be guaranteed under all wind conditions (Gloe et al., 2019). Though, there is the possibility of integrating wind generation units with EES, such as batteries (Ma et al., 2017; Watson et al., 2018; Dhundhara and Verma, 2020), supercapacitors (Sun et al., 2020) or FESS (Akbari and Izadian, 2021) for improving turbine’s synthetic inertia performance, these are related to additional infrastructure cost. Still, relatively frequent shutdowns caused by low wind represent an unsurpassed drawback. Throughout this paper, the term ‘low wind’ will refer to calm and wind speeds below cut-in wind speed (vcut-in) at hub height, which is around 3 m/s for most modern WTs. The focus of this paper is investigating the possibility and technical justification of permanently providing wind power flexibility, even when no wind energy is available. The analysis carried out in the paper refers to the doubly-fed induction generators (DFIG), widely used in wind energy applications. Existing technical solutions and control algorithms for including WTs in frequency control are applicable for operating wind speeds in the range vcut-in < v < vcut-out. This paper proposes a strategy for the permanent operation of the WT. When wind speed drops below vcut-in, instead of stopping, WT alters its operation to motoring mode and rotates maintaining the constant rotational speed. According to the proposed strategy, WTs will be stopped only in case of too strong winds v > vcut-out. These winds are rare, short-lived, and locally limited, so the proposed strategy is named permanent operation. Considering the dependence of WT inertial response on local wind speeds, with the proposed permanent operation strategy, periods of low wind would not present an obstacle and those turbines that would usually be stopped could still contribute to system stability. This could be achieved solely by modifying converter control system software without adding expensive infrastructure. This is an important contribution compared to other techniques, which involve constructing new elements, such as batteries and FESS, and require significant investment costs. A management concept of WT control was developed for v < vcut-in, which extends the availability of WTs for frequency support, contributes to the maintenance of the system’s inertia, and allows guaranteed provision of auxiliary services to the transmission system operator (TSO). The proposed concept maintains the rotational speed of the WT at the reference value under no and low wind conditions so that the KE stored in the rotating masses of the turbine can be injected into the grid, mitigating severe frequency excursions. With this novel WT operation concept, not only would power system stability improve, but mechanical stresses during often start-ups and shutdowns would be alleviated, as well. The latter is important to notice because fewer start-stop events will positively affect the lifespan of the main turbine components. The excessive stress and operation induced by frequent startup/shutdown could enhance the likelihood of WT component failure. A large number of startups/shutdowns could accelerate mechanical components’ aging and fatigue and shorten the circuit breaker’s or switchgear’s lifetime (Yin et al., 2017). Paper (Luan and Moan, 2021) showed that transient loads caused by startup and shutdown could multiply fatigue damage in the offshore WT tower. It can be expected that material fatigue during frequent transient processes can be significant, especially in modern WTs with a large blade diameter, where the transient forces are more drastically reflected in the bending moments at the root of the blades. In order to reduce the number of transient operations, the paper (Yin et al., 2017) proposed startup speed with a dead band to prevent frequent startup/shutdown of WTs. However, such techniques inevitably reduce annual energy production (AEP) and limit WT availability to provide inertial support. The concept proposed in this paper will contribute to multiple reductions in the adverse effects of on/off transients on the turbine’s lifetime. At the same time, it will contribute to the permanent readiness of WTs to provide auxiliary services such as voltage and frequency support to the power system.
This paper’s priority is to evolve the idea of WT permanent operation strategy. The conducted research investigates the potential of WTs in terms of frequency response in low wind conditions. A modified WT power curve is defined for v < vcut-in, which supports the permanent WT rotation strategy, allowing flexibility in the entire range of wind speeds v < vcut-out. The proposed strategy has the potential to improve the flexibility of the power system with a significant share of wind power plants (WPPs). Implementing this strategy requires only software changes, i.e., reprogramming the control algorithms of the WT for the range of low wind speeds. An analysis of the energy costs of applying the proposed concept in real wind conditions was performed, and the economic justification of the proposed strategy was demonstrated. In addition to improving flexibility, the proposed strategy could significantly increase the availability of WTs and extend their lifetime.
The remainder of the paper is organized as follows. The WT’s KE storage potential for frequency support under low wind conditions and the power curve extrapolation are discussed in Section 2. In Section 3, the case study is performed based on wind speed measurement data from the Banat region in Serbia, and annual energy consumption to maintain the WT in the motoring regime is estimated. In Section 4, the proposed concept’s effectiveness and contribution to arresting the initial frequency drop are demonstrated through dynamic simulations. Main conclusions are presented in Section 5. The layout diagram of the paper structure is shown in Figure 1.
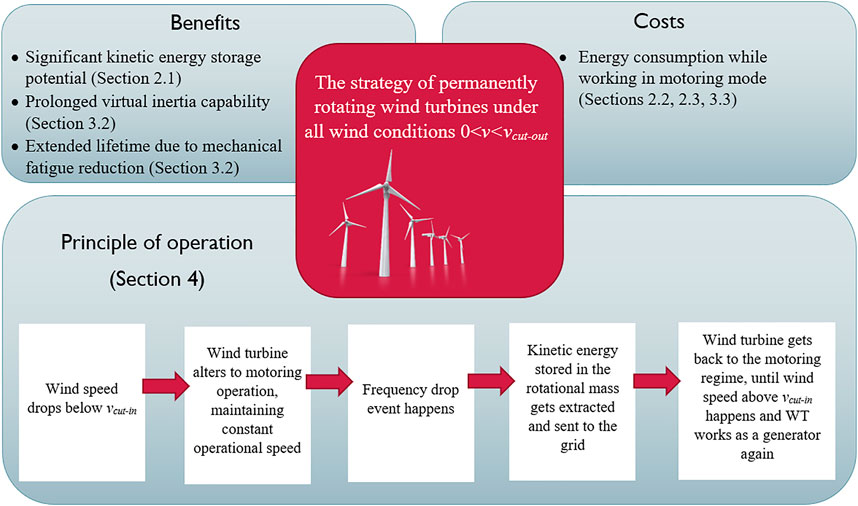
FIGURE 1. Layout diagram of paper structure.
2 Wind turbine operating under low wind conditions
2.1 Kinetic energy potential in wind turbines
Inertia is a property of rotational machines that allows them to store or release KE. Releasing KE in case of frequency drop is more significant since the over-frequency event can be solved by other generators’ power reduction or storage charging. In that sense, releasing KE by production units is more important from the system’s security point of view because it can be provided only by quick-to-react assets with available energy resources. Traditionally, this was achieved by utilizing the inertia property of online synchronous generators. The KE stored in the rotating mass (Ek) of a conventional generator is defined by the following expression:
where J is the sum of the moments of inertia in the shafts, and ω is the rotational speed.
The inertia constant H is often used as a measure of inertia, defined as:
where Sn and ωn are rated apparent power and rated rotational speed, respectively. The inertia constant has the dimension of time and it indicates the time it takes a synchronous generator to release all its KE assuming that the energy is released at a constant rate equal to the generator’s nominal power. Typical inertia constants for the generators in large conventional power plants range from 2 to 9 s (Tielens and Van Hertem, 2016), depending upon the size, speed, and type of the machine.
Even though there is no electromechanical coupling between WT and grid frequency, the inertia constant of a WT can be defined in the same manner. Its KE is stored mainly in the rotating blades, gearbox, and wind generator. Typical values of inertia constant of WTs are roughly the same, about 2–6 s (Tielens and Van Hertem, 2016). However, comparing inertia constants does not provide adequate information about accessible KE that can be used in case of disturbance.
Accessible KE depends on operating limits, i.e., rotational speed that machine can achieve. Substituting H for J in (Eq. 1), the following expression defines usable KE:
Where
The rotor in the conventional generators is synchronously locked with grid’s frequency, which has to be maintained within a narrow range around nominal frequency, so the accessible KE is significantly lower than the stored. ENTSO-E defines synchronous generator frequency design criteria of +3% to −5% of nominal frequency (StG CNC, 2021) meaning that rotational speed is within the same range. It should be noted that realistic frequency variations are far narrower.
On the other hand, DFIG can operate permanently within a wide speed range of 40%–100% of the rated speed (Wu et al., 2011). Although the ability of a WT to store and release energy to the grid is decoupled from system frequency, reliance on a converter’s control mechanism allows releasing completely stored KE until stopping. The technical feasibility of the proposed strategy relies on the research (Yongzheng Zhang and Ooi, 2012) that demonstrated low wind speed operation of a DFIG. It is shown that DFIG can stand low torques without exceeding the current limit when working in motoring operation. In the following subsection, it is demonstrated that the proposed management belongs to low torque area.
Figure 2 shows accessible KE by different providers after disturbance while operating within ENTSO-E frequency limits. The comparison is made between conventional synchronous generator (H = 4 s), WT (H = 4 s) working with different rotational speeds, and entire WPP consisting of 20 WTs.
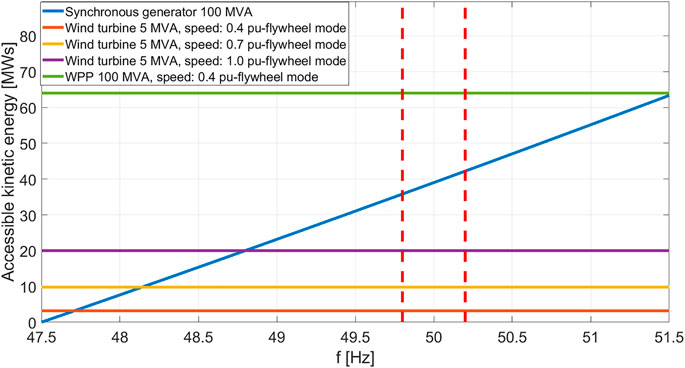
FIGURE 2. Usable KE for synchronous generator and WT of same inertia constant H = 4 s.
It can be concluded that the KE accessible in case of severe frequency drop in a WPP operating with minimal operational speed is around 60% higher than the usable KE in a conventional synchronous generator of the same power operating at the nominal frequency. Suppose only usual frequency variations are considered (red dashed lines). In that case, a single WT operating at the rated speed has 3 times more usable KE than the synchronous generator with the same inertia constant. This comparison justifies the idea of keeping the WT online even when no wind is available because of its KE storage capacity.
In the proceeding of the paper, it will be assumed that during low wind periods, rotational speed is kept at a minimal operational value. It could be higher, though, but that would require the absorption of more energy from the grid due to larger friction and Joule’s losses. Additionally, this approach allows an easy transition from motoring to generator regime when wind speed becomes larger than vcut-in.
2.2 Extended wind turbine power curve for motoring operation
Turbine manufacturers do not provide data about WT consumption in the motoring regime, and not many literature deals with WT operation when wind speed is around vcut-in (Eisenhut et al., 2007; Fan and Zhu, 2019). The concept proposed in this paper requires creating an appropriate model for assessing energy consumption during motoring regime operation. The traditional and proposed modification of power-wind speed (P-v) curve are shown in Figure 3.
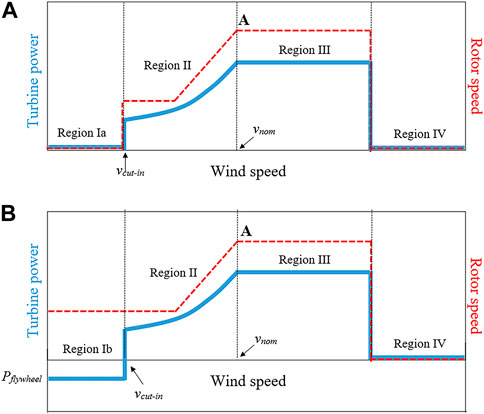
FIGURE 3. Traditional (A) and modified (B) P-v curve.
The traditional control strategy implies the WT being stopped in the state of standby or idling for wind speeds below vcut-in (Region Ia) because the torque exerted by the wind on the blades is insufficient to bring the turbine to rotate and cover all the power losses. For vcut-in and higher wind speeds up to rated wind speed, vnom, the WT aims to capture maximal wind energy by controlling the rotational speed. A detailed explanation of the control regions could be looked up in the literature (Saint-Drenan et al., 2020).
Modifying the standard power curve (Region Ib) means the transition to motoring operation under low wind conditions while turbine rotates with a minimal operational speed ωcut-in. Power consumption during motoring operation (Pmotoring) is considered to be constant in entire low wind speed range. This assumption is justified because mechanical losses are mainly speed-dependent and remain constant, and electrical losses will not vary significantly for a range of wind speeds 0<v < vcut-in since generator, transformer, and converter operate with less than 2% of rated power, as will be shown later. Considering the wind power cube dependence upon wind speed, it is assumed that the turbine extracts no wind power in the low wind speed region. Therefore, drawing electrical power from the grid is necessary to overcome the existing losses and maintain the WT’s rotational speed at a constant value.
The power flow diagrams of standard and flywheel operation are shown in Figure 4. The power which WT extracts from wind while working in generation mode and rotating with
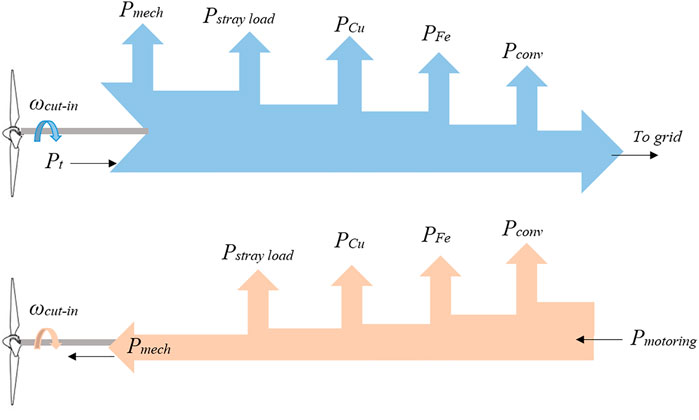
FIGURE 4. Power flow in traditional and motoring regime.
The motoring power, Pmotoring, drawn from the grid for maintaining rotational speed to ωcut-in in wind speed range 0<v < vcut-in is equal to the total power loss when turbine rotates with ωcut-in at wind speed vcut-in in traditional generation mode. In order to calculate these losses, operating point A (Figure 3) from standard P-v curve will be further analyzed.
The power which WT extracts from wind is a complex function of wind speed, rotor speed, and pitch angle, and according to (Carpintero-Renteria et al., 2020) it can be expressed as:
where
Values for coefficients in (6) and (7) are: C1 = 0.5109, C2 = 116, C3 = 0.4, C4 = 5, C5 = 21, C6 = 0.068, C7 = 0.08, C8 = 0.035 adopted from (Nouira and Khedher, 2012).
As stated in (Anfossi et al., 2005), low-frequency horizontal wind oscillations start to prevail for wind speeds below a specific value (1–3 m/s). Under these conditions, it becomes difficult to define a precise wind direction. It indicates that neither yaw nor pitch control during low wind speeds cannot be efficient. For this reason, it was assumed that the yaw control is not active during periods of low wind, and the pitch angle retains a constant value of β = 0°. Thus, the WT keeps the same azimuth, rotational speed, and pitch angle as when the wind speed drops below vcut-in. This also contributes to the reduced WT self-consumption while working in motoring mode.
The power that WT generates when wind speed is equal to vcut-in, can be defined as:
where PP-v (v = vcut-in) is electrical output power from the P-v curve provided by the manufacturer.
The minimum rotational speed can be estimated as a function of the rotor diameter, Drotor (Saint-Drenan et al., 2020):
Thus, the power curve can be extended for wind speed range 0 < v < vcut-in:
Previously described methodology was used to assess Pmotoring for three different commercial WTs. Standard air density of 1,225 kg/m3 is assumed. The results are presented in Table 1. Results show that commercial multi-MW WT consumes less than 2% of the rated power if controlled to work with the minimum operating speed during low wind periods.
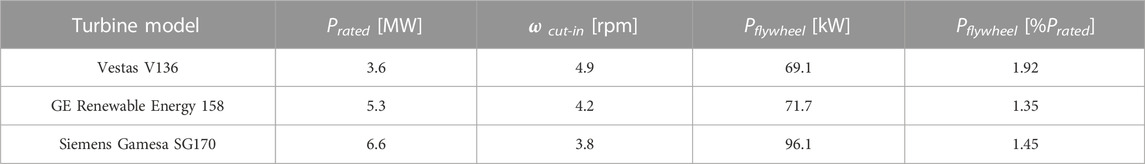
TABLE 1. Motoring regime consumption for different WT models.
It should be noted that the power
3 Costs and benefits of proposed strategy: case study for South Banat region
A case study was performed based on 1-year wind speed data collected in the South Banat region in Serbia. These data were used to estimate the annual energy consumption of a WT working in a permanent operation. Model Vestas V136-3.6 with a rated power of 3.6 MW and a hub height of H = 125 m, is used as a test turbine assumed to be installed at the location.
3.1 Wind energy resource at the site
The region of South Banat, with very flat terrain, is situated in the northeastern part of Serbia. Wind potential in this region is proven to be extensive (Đurišić and Mikulović, 2012), and several WPPs with a total rated power of around 400 MW are already being exploited, while up to 2,000 MW are planned to be installed until 2030, according to Ten-Year Network Development Plan for the Republic of Serbia. This region has two prevailing wind directions: southeast (the wind called košava) and northwest. Wind speed and wind direction measurements were carried out in 2018 with a 10-min record, at the height of 125 m, in the area called Bela Anta (44°52′14″N, 20°38′25″E).
The statistical processing of the collected wind speed data has been carried out. The average annual wind speed at 125 m above ground level is 7.3 m/s. The total annual duration of low wind periods, i.e., a total number of hours with wind speed below 3 m/s, is around 1347, which is 15% of the year. The wind speed histogram is shown in Figure 5. It should be mentioned that during the analyzed period, the wind speed was above vcut-out for only half an hour, which is negligible. Wind roses for the whole wind speed range and low wind range are presented in Figure 6. It is apparent that the prevailing wind direction is noticeable for low wind, but this is much less pronounced compared to medium and high wind speeds.
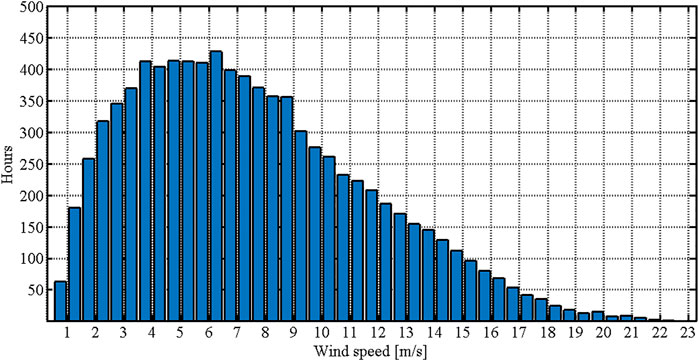
FIGURE 5. Histogram of wind speed data measured at the hub height of 125 m at the target site.

FIGURE 6. Wind roses for the whole wind speed range (A), and low wind range (B).
3.2 Wind turbine permanent operation during 1 year in South Banat
Based on the measured data set, the annual energy production of the Vestas V136-3.6 MW WT was estimated. The calculation was made according to the standard and the modified power curve, derived in Section 2.2. An air density of 1.2 kg/m3 was assumed.
Annual energy production of the WT working according to standard operation strategy is 14285 MWh. In the case of permanent operation, net annual production (the difference between produced and absorbed energy) is 14191 MWh. The latter comprises WT rotating all the time, but it must consume certain energy so that the net energy yield is reduced. It can be concluded that the energy which is used for the maintenance of the WT in permanent operation is about 100 MWh or around 0.7% of total standard annual energy production. Figure 7 shows WT output power for each 10-min period during 12 h on June 2, for both permanent and standard operation.
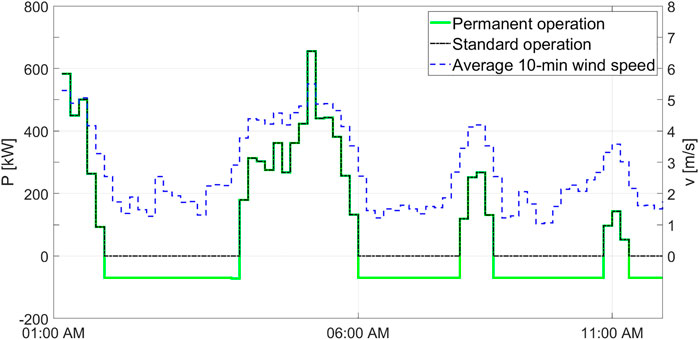
FIGURE 7. WT output power for two operating strategies.
With the standard operating strategy, WT would have 926 shutdowns and startups annually due to low winds, an average of about 2.5 stops per day, causing mechanical fatigue of the entire WT mechanical system. Besides, each startup of the WT requires energy consumption for acceleration, which can be treated as power loss, as well as energy loss due to delayed reaction after wind speed increases above vcut-in. Neither of these would exist in permanent operation unless frequency disturbance happens and WT has to react and release stored KE. In that case, WT decelerates and finally gets stopped, after which the usual startup procedure should be performed.
3.3 Annual energy consumption caused by permanent operation in various wind climate
Assuming Weibull distribution function, which is widely used for wind data analysis, it is possible to calculate the annual energy consumption for a specific location by using the extrapolated power curve described in Section 2.2. The general expression of the Weibull function is given by (Đurišić and Mikulović, 2012):
where k is the shape factor, and c is the scale factor, f(v) denotes a probability density distribution function that wind speed v appears. The expected annual consumed energy, caused by permanent operation can be calculated as:
where Pmotoring is the extrapolated part of the power curve for low wind range, defined by (10). The calculation is performed for different values of k and c parameters, and a graphical representation of results is shown in Fig 8. An increasing c results in decreased annual energy consumption, whilst low c values cause a relatively large amount of consumed energy, because of longer motoring operation. For most of the locations of interest, shape parameter k has value of around 2, so it can be estimated that the energy consumption is in the range of 50 MWh for sites with good wind potential (c = 9 m/s) to 250 MWh for sites with low wind potential (c = 6 m/s). Compared to AEP, the strategy of permanent operation requires about 1%, at locations with low and moderate wind potential, while at sites with higher wind speeds, it is even smaller.
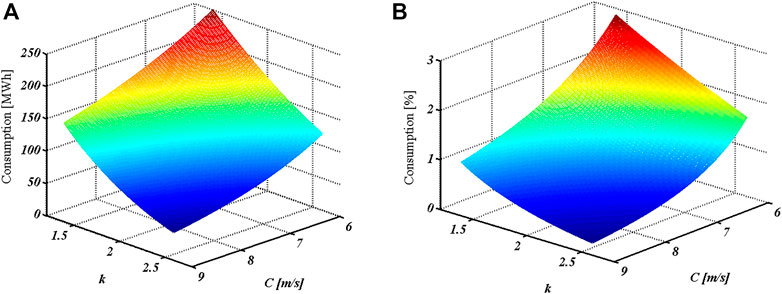
FIGURE 8. Annual energy consumption of continuous WT operation for different wind climate in MWh (A), expressed as a percentage of total annual energy production (B).
3.4 Pseudo-code for general calculation of kinetic energy potential and required energy for the proposed permanent operation
The pseudo-code of the proposed permanent operation calculations applied on WPP consisting of NWPP WTs is shown in Algorithm 1. The first step of the algorithm is to identify the set L of WTs, affected by low wind speed during the considered time horizon. In the next step, the rotational speed is defined, which may be higher than the minimal operational WT speed, depending on the tolerant energy consumption. The estimation of the total accessible KE potential of WPP starts in step 3. It implies setting the minimum rotational speed that WT can reach during a disturbance, possibly higher than zero. Knowing the technical characteristics of WTs, the calculation of inertia constants and accessible KE based on (Eqs 2, 3), respectively, is performed. The estimation of total active power consumed by WPP working in motoring operation starts in step 10. For wind speed equal to vcut-in, the turbine’s active power is read from power-wind speed curve data, and a speed ratio and power coefficient calculation, based on (Eqs 6, 7), respectively, are made. Finally, using Eq. 10, the power consumption of single WT is obtained.
Algorithm 1. Pseudo-code for calculation of KE potential required energy for proposed permanent operation of WTs in the WPP.
Input: Sn,i, ωn,i, Drotor,i , P-v data ∀i = 1, 2, . . . , NWPP
Output: ΔEk,WPP, Pmotoring,WPP
1:Indentify the set of L = {WTi | v<vcut-in }
2:Setωcut-in,i
3:fori
4:Set
5:CalculateHibased on Eq. (2)by introducing
6:CalculateΔEk,ibased onEq. (3)
7:ΔEk,WPP += ΔEk,i8: end for
8:end for
9:returnΔEk,WPP
10:fori
11:Read Pp-v (v =vcut-in,i) fromP-v data
12:Calculateλi(vcut,in,i,wcut-in,i) based onEq. (5)
13:CalculateCp(λi,0)based on Eq. (6) and Eq. (7)
14:CalculatePmotoring,i based on Eq. (10)
15:Pmotoring,WPP+= ΔPmotoring,i
16:end for
17:return Pmotoring,WPP
4 Dynamic simulation
4.1 Model description
A single bus model of an isolated hypothetical system is used to demonstrate the impact of the WT’s permanent operation on the system frequency response. The dynamic frequency scheme consists of a power system frequency response model, including conventional generation units, a simplified WT model working with a permanent operation strategy, and a PV power plant model insensitive to frequency change (Figure 9).
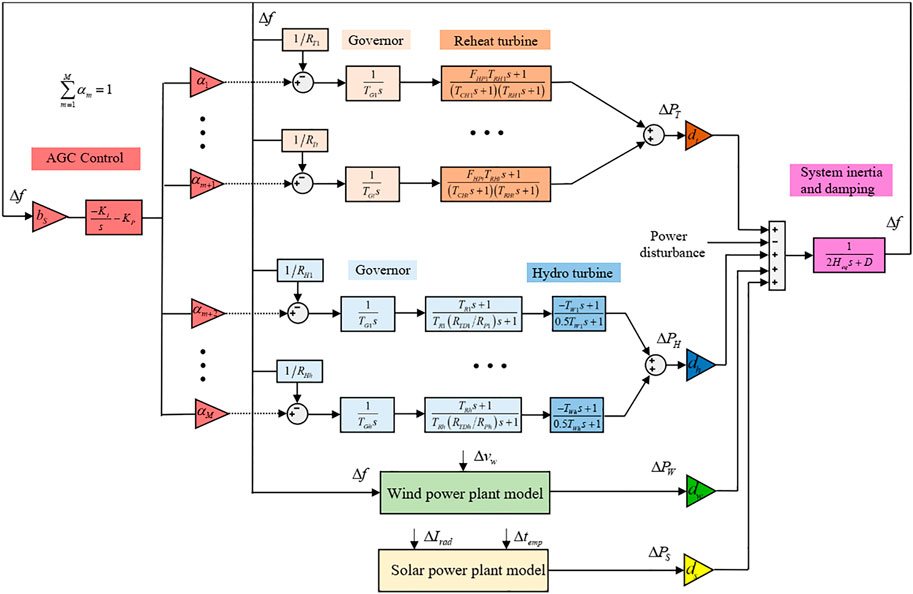
FIGURE 9. Block diagram of isolated system used for demonstration of WT permanent operation effect.
The parameters dw, dt, dh, and ds are the wind, thermal, hydro, and PV power plants’ generation share, respectively. Each online conventional unit, namely, hydro and thermal has a droop controller. The transfer functions and typical values for a thermal reheat steam turbine and the hydraulic unit, given in (Kundur and Malik, 1994) are used. The input to the model is the power disturbance caused by load disturbance, power plant outage, wind speed, or solar irradiation disturbance. The outputs are the system frequency deviation and the output power variations of all power plants (ΔPW, ΔPT, ΔPH, and ΔPS are WPP, thermal, hydro, and PV power plants’ total output power variations, respectively). The model also includes automatic generation control (AGC), assuming that only 50% of hydraulic units participate in it. The inertia of the system is described by equivalent system inertia Heq, and frequency load damping D. A review of system parameters used in the simulation is given in Table 2. The described system is suitable to emphasize the impact of the proposed management concept because of low overall inertia, and the analyzed generation mix could be called realistic when the perspective power system is considered. Transmission lines and transformers are not included in the simulation because of their minor impact on system frequency response. The model is made using Matlab/Simulink.
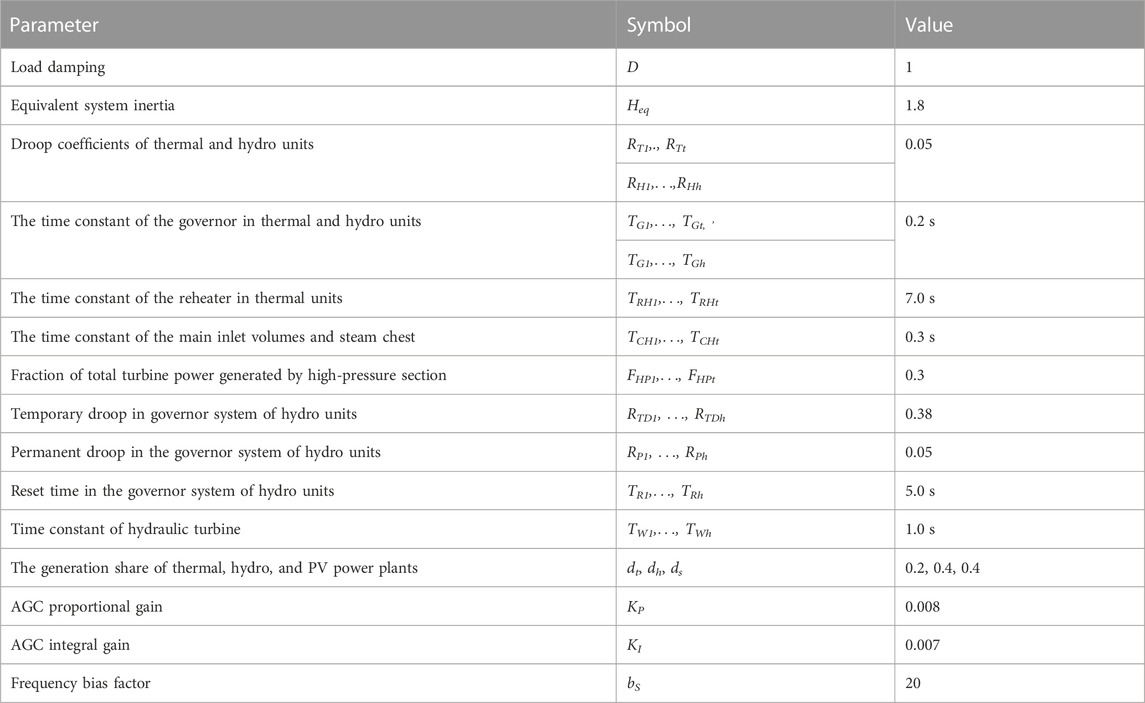
TABLE 2. Parameters of power system used in simulation.
The dynamic model of variable-speed WT is made based on the model and parameters from (Ullah et al., 2008) and is shown in Figure 10. Modifications are made in order to include permanent operation capability. The rotor speed, ωt, is computed from the inertia equation of the equivalent one-mass turbine and generator model (Eisa, 2019). The inertia equation uses the mechanical power extracted from the wind (Pt), constant power of losses (P0γ), and electrical power injected into the grid (Pe). In this simulation, it was assumed that there is no wind (calm), so Pm = 0. Based on the results of the analysis performed in 2.2, it was adopted that P0γ has a value of 2% of rated WT power. A first-order system approximates the power electronic interface dynamic with a time constant Tconv. The terminal voltage of the generator (VWT) is assumed to be constant, thus output power limitation can be included through Imax and -Imax generator current limit (in generator and motoring operation). Further details on the control scheme used here can be found in (Ullah et al., 2008).
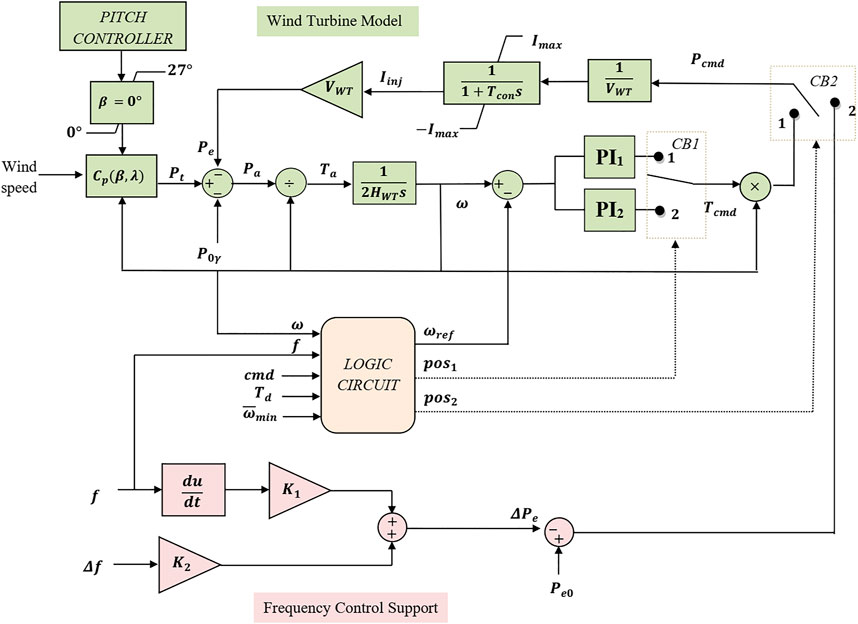
FIGURE 10. Control scheme of WT for frequency support under low wind conditions.
The proposed control contains an additional control loop that performs frequency support. Additional power is implemented as the inertia-droop model, which takes absolute variation in frequency and the rate of change of frequency as input signals (Morren et al., 2006). K1 is the inertia constant weighting frequency deviation derivative and is equal to 2HWT, where HWT is the inertia constant of a WT, while the K2 is controller gain weighting frequency deviation. The parameter values of WT used in the simulation are shown in Table 3.
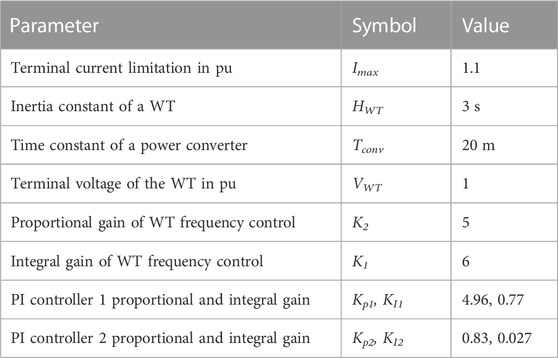
TABLE 3. Parameters of the DFIG-based WT used in simulation.
The operation mode is determined by a logic circuit (Table 4), which takes the measured values of frequency (f), rotational speed (ω), control signal (cmd), and WPP operator signals (Td and
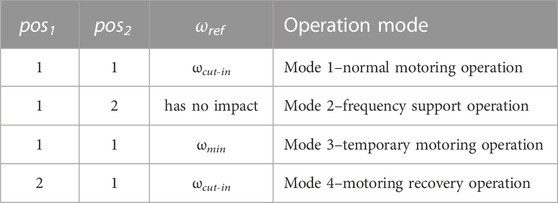
TABLE 4. Logic circuit description.
WT should work under low wind conditions in order to participate in frequency control if an external command (cmd) for that exists, otherwise, it is off-grid standing still. In case the permanent operation is applied, both pos1 and pos2 are equal to 1, PI controller 1 (fast response) regulates the rotational speed ωcut-in as long as the frequency belongs to the regular range and WT is working in Mode 1—normal motoring operation.
If the atypical frequency deviation happens, signal pos2 takes the value 2, and WT injects active power into the system (Mode 2- frequency support operation) until the available KE is used. This lasts until the rotational speed ωmin is reached, and then pos1 and pos2 both get value 1 again, but the reference speed is ωmin (Mode 3- temporary motoring operation). The transition from Mode 2 to 3 requires altering from generation to motoring operation.
When the system has responded to the disturbance and the frequency is back again in the permissible range, after the time delay Td, the signal pos1 becomes equal to 2, pos2 is equal to 1, and the reference rotational speed becomes ωcut-in. During this period, the process of KE recovery begins (Mode 4 - motoring recovery operation), whereby a PI controller 2 (slow response) is used. The parameter Td can take different values for each WT so that setting back in Mode 1 results in a smooth transition as possible.
4.2 Scenario 1: load disturbance 0.05 pu, different level of wind turbines in permanent operation
The analyzed scenarios refer to a sunny day without wind when PV power plants generation is high (covering 40% of system load) and constant during the period of interest, but WPPs production is missing. Though only active power deficit in the system will be considered as disturbance, permanent operation allows WT to react in case of frequency increase, as well. The system suffers a generation deficit situation by 0.05 pu at t = 5 s, causing a frequency drop. Several cases are explored: when all WTs stand still and make no contribution to frequency stabilization, and when the different shares of WTs are employed to work permanently. Frequency variation, WT speed, and WPP output power variation for each case are shown in Figures 11–13, respectively.
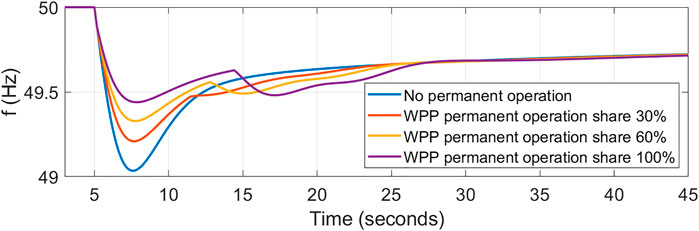
FIGURE 11. Frequency variation for different level of WTs in permanent operation.
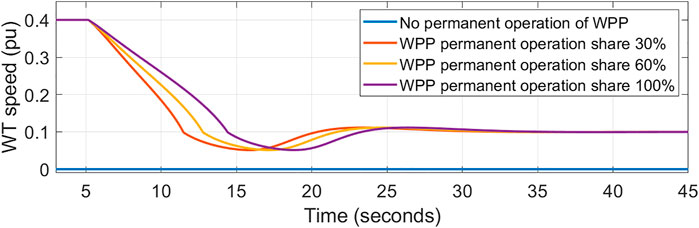
FIGURE 12. WT speed for different level of WTs in permanent operation.
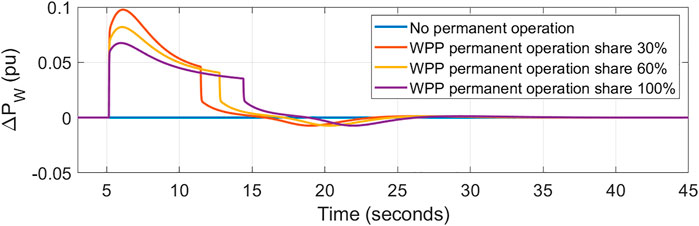
FIGURE 13. WPP output power variation for different level of WTs in permanent operation.
According to the standard control strategy, WTs are stopped (case: No permanent operation of WPP), disconnected from the grid and cannot help through additional active power support. Their speed and output power are zero during the entire simulation period. On the other hand, implementation of the proposed strategy implies that, at the moment of the disturbance, WTs work with the rotational speed at the pre-defined value ωcut-in = 0.4 pu and react to the sudden frequency drop. A higher number of turbines working in motoring operation results in a higher first frequency nadir, reduced rate of frequency change, and prolonged active power injection, but also causes a more intense secondary frequency dip. The latter is caused by the sudden transition of WTs from a generator to a motoring operation after the accessible KE is used entirely. An overview of frequency indices for the considered cases is shown in Table 5.
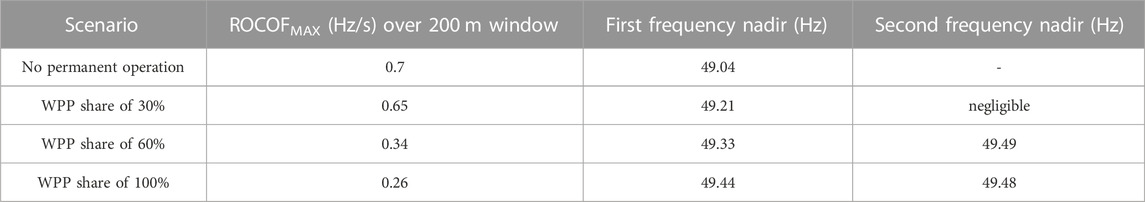
TABLE 5. Frequency quality parameters.
Output power variations for each plant type on a plant’s base for WPP permanent operation share of 60% are presented in Figure 14. It can be seen that the dynamic response of WPP is significantly faster compared to the dynamic response of conventional units. The maximum power injection is 8.2%, while the duration of frequency support to the system is about 7.8 s. The previous parameters depend on the setting of the inertia-droop controller parameters, the size of the disturbance, the pre-defined WT minimum speed of rotation, and the WPP permanent operation share.
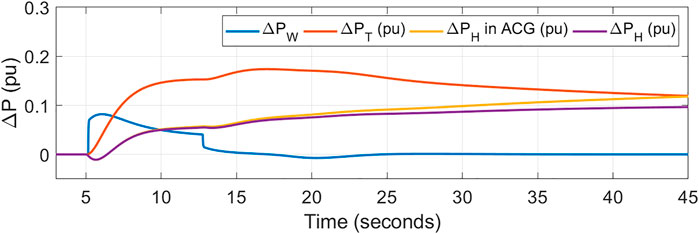
FIGURE 14. Output power variations for each plant type on a plant’s base.
4.3 Scenario 2: load disturbance 0.05 pu, speed recovery after disturbance
In order to demonstrate the WT rotational speed and KE recovery process, i.e., turbine acceleration during the motoring recovery operation, a longer time horizon was analyzed for 60% of WPP permanent operation share. The simulation horizon, in this case, includes the effect of AGC, which achieves the recovery of the frequency to the nominal value. When the frequency deviation becomes less than 0.002 pu, the countdown of the duration Td begins. Two cases were considered:
a) simultaneous speed recovery: all WTs start to speed up after Td = 50 s,
b) gradual speed recovery: each group of 25% of WTs starts to speed up, in consecutive steps of 10 s interspace.
Frequency and WPP output power variation are shown in Figures 15, 16. The results show that gradual speed recovery is more convenient, from the system’s security point of view, because it causes a mild transition to normal motoring operation. With the gradual transition, frequency disruption is smoother, with 4 small-scale drops, compared to a single larger one in case of simultaneous speed recovery.
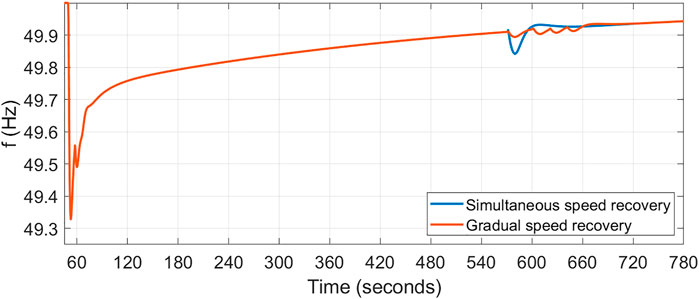
FIGURE 15. Frequency variation with simultaneous and gradual speed recovery.
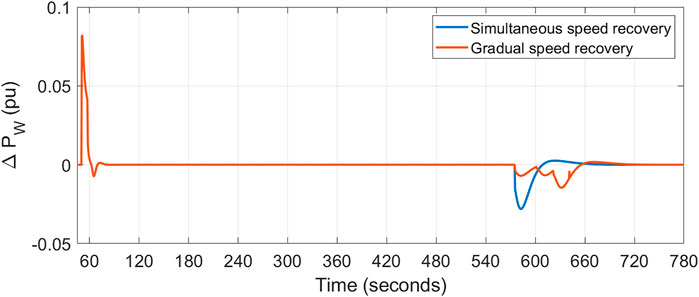
FIGURE 16. WPP output power variation with simultaneous and gradual speed recovery.
4.4 Comparison to other virtual inertia providers
Competing solutions for inertia emulation are various ESS, such as batteries, supercapacitors, FESS, and superconducting magnetic energy storage. Installing such systems is associated with high investment costs and a relatively short lifespan (Ahmed et al., 2023). Due to high capital costs, their presence in systems is insufficient to provide the necessary capacity of virtual inertia required by systems with a high degree of integrated WPPs and PV power plants.
In (Niu et al., 2023), a comparative analysis of the economy of different ESS to provide inertial response services was performed. Costs range from 0.13 USD/kW/s for Li-Ion batteries to over 20 USD/kW/s for supercapacitors. The relatively high costs of providing this auxiliary service are mainly the result of high investment costs. Given that providing inertial response by wind turbines does not require any additional investment in equipment, the cost of providing this service by the permanent operation of WT are determined practically only by the costs of electricity used to maintain the rotation of the wind turbine in conditions without wind. To estimate the cost of delivering inertia with permanent operation strategy of Vestas136-3.6 model with assumed inertia constant value of 4 s, is taken as reference. Using the results from subsection 2.2 for the consumption of electricity for permanent operation of the turbine, and the adopted price of electricity of 150 USD/MWh it was estimated that the cost to provide inertial response services by WT according to the proposed strategy would be only 0.005 USD/kW/s. The cost of inertia provision by permanently operating WT is multiple times lower than by any other ESS. The cost analysis proved the economy of the proposed concept.
Besides, according to (Makolo et al., 2021), the response speed of WPPs when emulating inertia is about 40 m, so they can be classified as systems with a relatively fast response. However, it is somewhat slower than battery systems and supercapacitors, where the response is 10–20 m.
It may be conlcuded that the proposed model of permanent operation allows WTs to provide reliable and economic system support and maintain the inertia constant regardless of wind conditions, which is particularly important for a systems with low inertia.
5 Conclusion
This paper’s main idea is to present the permanent WT operation strategy, i.e., operation without stopping during low wind periods. This strategy represses uncertainty over the inertial response capability of the power electronics-dominated systems. The practical implementation of the proposed management strategy does not require a hardware modification but only the WT control system software. Thus, it could be implemented without severe difficulties.
It was found that the power necessary to keep the WT rotating under low wind conditions is less than 2% of its rated power, and the annual energy consumption can be estimated at less than 1% of the annual energy yield. On the other hand, the duration of guaranteed virtual inertia support could be extended to last continuously.
Dynamic simulations proved that inertial capability of WTs working in flywheel mode could be of significant impact when disturbance happens in low inertia system during no wind period. The compromise should be made between number of WTs working in flywheel mode and severeness of secondary frequency dip.
Data availability statement
The data analyzed in this study is subject to the following licenses/restrictions: The datasets of wind speed measurements used in this study are restricted by the Energohelis Group Belgrade and are available for researchers who meet the criteria for access to confidential data. Requests to access these datasets should be directed to https://energohelis-group.ls.rs/rs/.
Author contributions
The Author’s personal contributions are as follows: formal analysis, methodology, manuscript writing—original draft preparation: KDŽ, conceptualization, manuscript writing—review and editing: KDŽ and ŽĐ, supervision: ŽĐ.
Conflict of interest
The authors declare that the research was conducted in the absence of any commercial or financial relationships that could be construed as a potential conflict of interest.
Publisher’s note
All claims expressed in this article are solely those of the authors and do not necessarily represent those of their affiliated organizations, or those of the publisher, the editors and the reviewers. Any product that may be evaluated in this article, or claim that may be made by its manufacturer, is not guaranteed or endorsed by the publisher.
References
Ahmed, F., Foley, A., McLoone, S., Best, R. J., Cameron, C., and Al Kez, D. (2023). Dynamic grid stability in low carbon power systems with minimum inertia. Renew. Energy S0960148123003774. 210, 486–506. doi:10.1016/j.renene.2023.03.082
Akbari, R., and Izadian, A. (2021). Modelling and control of flywheels integrated in wind turbine generators, in: Proceedings of the 2021 IEEE International Conference on Electro Information Technology (EIT). Presented at the 2021 IEEE International Conference on Electro Information Technology (EIT), IEEE, Mt. Pleasant, MI, USA, 106–114. doi:10.1109/EIT51626.2021.9491886
Akram, U., Nadarajah, M., Shah, R., and Milano, F. (2020). A review on rapid responsive energy storage technologies for frequency regulation in modern power systems. Renew. Sustain. Energy Rev. 120, 109626. doi:10.1016/j.rser.2019.109626
Anfossi, D., Oettl, D., Degrazia, G., and Goulart, A. (2005). An analysis of sonic anemometer observations in low wind speed conditions. Bound.-Layer Meteorol. 114, 179–203. doi:10.1007/s10546-004-1984-4
Aziz, A., Than Oo, A., and Stojcevski, A. (2018). Frequency regulation capabilities in wind power plant. Sustain. Energy Technol. Assess. 26, 47–76. doi:10.1016/j.seta.2017.10.002
Carpintero-Renteria, M., Santos-Martin, D., Lent, A., and Ramos, C. (2020). Wind turbine power coefficient models based on neural networks and polynomial fitting. IET Renew. Power Gener. 14, 1841–1849. doi:10.1049/iet-rpg.2019.1162
Cheema, K. M. (2020). A comprehensive review of virtual synchronous generator. Int. J. Electr. Power Energy Syst. 120, 106006. doi:10.1016/j.ijepes.2020.106006
Chen, M., Zhou, D., and Blaabjerg, F. (2020). Modelling, implementation, and assessment of virtual synchronous generator in power systems. J. Mod. Power Syst. Clean. Energy 8, 399–411. doi:10.35833/MPCE.2019.000592
Chen, T., Guo, J., Chaudhuri, B., and Hui, S. Y. (2020). Virtual inertia from smart loads. IEEE Trans. Smart Grid 11, 4311–4320. doi:10.1109/TSG.2020.2988444
Dhundhara, S., and Verma, Y. P. (2020). Grid frequency enhancement using coordinated action of wind unit with redox flow battery in a deregulated electricity market. Int. Trans. Electr. Energy Syst. 30. doi:10.1002/2050-7038.12189
Dreidy, M., Mokhlis, H., and Mekhilef, S. (2017). Inertia response and frequency control techniques for renewable energy sources: A review. Renew. Sustain. Energy Rev. 69, 144–155. doi:10.1016/j.rser.2016.11.170
Đurišić, Ž., and Mikulović, J. (2012). Assessment of the wind energy resource in the South Banat region, Serbia. Renew. Sustain. Energy Rev. 16, 3014–3023. doi:10.1016/j.rser.2012.02.026
Eisa, S. A. (2019). Modeling dynamics and control of type-3 DFIG wind turbines: Stability, Q Droop function, control limits and extreme scenarios simulation. Electr. Power Syst. Res. 166, 29–42. doi:10.1016/j.epsr.2018.09.018
Eisenhut, C., Krug, F., Schram, C., and Klckl, B. (2007). Wind-turbine model for system simulations near cut-in wind speed. IEEE Trans. Energy Convers. 22, 414–420. doi:10.1109/TEC.2006.875473
Fan, Z., and Zhu, C. (2019). The optimization and the application for the wind turbine power-wind speed curve. Renew. Energy 140, 52–61. doi:10.1016/j.renene.2019.03.051
Fernández-Guillamón, A., Gómez-Lázaro, E., Muljadi, E., and Molina-García, Á. (2019). Power systems with high renewable energy sources: A review of inertia and frequency control strategies over time. Renew. Sustain. Energy Rev. 115, 109369. doi:10.1016/j.rser.2019.109369
Gloe, A., Jauch, C., Craciun, B., and Winkelmann, J. (2019). Continuous provision of synthetic inertia with wind turbines: Implications for the wind turbine and for the grid. IET Renew. Power Gener. 13, 668–675. doi:10.1049/iet-rpg.2018.5263
Hoke, A. F., Shirazi, M., Chakraborty, S., Muljadi, E., and Maksimovic, D. (2017). Rapid active power control of photovoltaic systems for grid frequency support. IEEE J. Emerg. Sel. Top. Power Electron. 5, 1154–1163. doi:10.1109/JESTPE.2017.2669299
Ibrahim, I., O’Loughlin, C., and O’Donnell, T. (2020). Virtual inertia control of variable speed heat pumps for the provision of frequency support. Energies 13, 1863. doi:10.3390/en13081863
Inoue, A., Takahashi, R., Murata, T., Tamura, J., Kimura, M., Futami, M.-O., et al. (2006). A calculation method of the total efficiency of wind generators. Electr. Eng. Jpn. 157, 52–62. doi:10.1002/eej.20426
Jawad, A., and Masood, N.-A. (2022). A systematic approach to estimate the frequency support from large-scale PV plants in a renewable integrated grid. Energy Rep. 8, 940–954. doi:10.1016/j.egyr.2021.12.017
Karbouj, H., Rather, Z. H., Flynn, D., and Qazi, H. W. (2019). Non-synchronous fast frequency reserves in renewable energy integrated power systems: A critical review. Int. J. Electr. Power Energy Syst. 106, 488–501. doi:10.1016/j.ijepes.2018.09.046
Karrari, S., Baghaee, H. R., De Carne, G., Noe, M., and Geisbuesch, J. (2020). Adaptive inertia emulation control for highspeed flywheel energy storage systems. IET Gener. Transm. Distrib. 14, 5047–5059. doi:10.1049/iet-gtd.2020.0066
Khalid, H. M., Flitti, F., Muyeen, S. M., Elmoursi, M., Sweidan, T., and Yu, X. (2022). Parameter estimation of vehicle batteries in V2G systems: An exogenous function-based approach. IEEE Trans. Ind. Electron. 69, 9535–9546. doi:10.1109/TIE.2021.3112980
Khalid, H. M., and Peng, J. C.-H. (2020). Bidirectional charging in V2G systems: An in-cell variation analysis of vehicle batteries. IEEE Syst. J. 14, 3665–3675. doi:10.1109/JSYST.2019.2958967
Khazali, A., Rezaei, N., Saboori, H., and Guerrero, J. M. (2022). Using PV systems and parking lots to provide virtual inertia and frequency regulation provision in low inertia grids. Electr. Power Syst. Res. 207, 107859. doi:10.1016/j.epsr.2022.107859
Kumar, A. W., Ud din Mufti, M., and Zargar, M. Y. (2022). Fuzzy based virtual inertia emulation in a multi-area wind penetrated power system using adaptive predictive control based flywheel storage. Sustain. Energy Technol. Assess. 53, 102515. doi:10.1016/j.seta.2022.102515
Kundur, P. S., and Malik, Om.P. (1994). Power system stability and control. New York, NY, USA: McGraw-Hill Education.
Kushwaha, P., Prakash, V., Bhakar, R., and Yaragatti, U. R. (2022). Synthetic inertia and frequency support assessment from renewable plants in low carbon grids. Electr. Power Syst. Res. 209, 107977. doi:10.1016/j.epsr.2022.107977
Liang, J., Fan, H., Deng, Z., Wang, Y., Rong, S., Zhang, R., et al. (2023). Generic security-constrained inertia emulation scheme for VSI-based DC system using supercapacitor. Int. J. Electr. Power Energy Syst. 150, 109078. doi:10.1016/j.ijepes.2023.109078
Luan, C., and Moan, T. (2021). On short-term fatigue analysis for wind turbine tower of two semi-submersible wind turbines including effect of startup and shutdown processes. J. Offshore Mech. Arct. Eng. 143, 012003. doi:10.1115/1.4047542
Ma, Y., Cao, W., Yang, L., Wang, F. F., and Tolbert, L. M. (2017). Virtual synchronous generator control of full converter wind turbines with short-term energy storage. IEEE Trans. Ind. Electron. 64, 8821–8831. doi:10.1109/TIE.2017.2694347
Magdy, G., Ali, H., and Xu, D. (2021). A new synthetic inertia system based on electric vehicles to support the frequency stability of low-inertia modern power grids. J. Clean. Prod. 297, 126595. doi:10.1016/j.jclepro.2021.126595
Makolo, P., Zamora, R., and Lie, T.-T. (2021). The role of inertia for grid flexibility under high penetration of variable renewables - a review of challenges and solutions. Renew. Sustain. Energy Rev. 147, 111223. doi:10.1016/j.rser.2021.111223
Morren, J., Pierik, J., and de Haan, S. W. H. (2006). Inertial response of variable speed wind turbines. Electr. Power Syst. Res. 76, 980–987. doi:10.1016/j.epsr.2005.12.002
Niu, D., Fang, J., Yau, W., and Goetz, S. M. (2023). Comprehensive evaluation of energy storage systems for inertia emulation and frequency regulation improvement. Energy Rep. 9, 2566–2576. doi:10.1016/j.egyr.2023.01.110
Nouira, I., and Khedher, A. (2012). A contribution to the design and the installation of an universal platform of a wind emulator using a DC motor 8. Int. J. Renew. Energy Res. 2.
Saha, S., Saleem, M. I., and Roy, T. K. (2023). Impact of high penetration of renewable energy sources on grid frequency behaviour. Int. J. Electr. Power Energy Syst. 145, 108701. doi:10.1016/j.ijepes.2022.108701
Saint-Drenan, Y.-M., Besseau, R., Jansen, M., Staffell, I., Troccoli, A., Dubus, L., et al. (2020). A parametric model for wind turbine power curves incorporating environmental conditions. Renew. Energy 157, 754–768. doi:10.1016/j.renene.2020.04.123
Salama, H. S., Bakeer, A., Magdy, G., and Vokony, I. (2021). Virtual inertia emulation through virtual synchronous generator based superconducting magnetic energy storage in modern power system. J. Energy Storage 44, 103466. doi:10.1016/j.est.2021.103466
Shazon, N. H., Masood, N. A., and Jawad, A. (2022). Frequency control challenges and potential countermeasures in future low-inertia power systems: A review. Energy Rep. 8, 6191–6219. doi:10.1016/j.egyr.2022.04.063
StG, C. N. C. (2021). Frequency ranges: ENTSO-E guidance document for national implementation of frequency ranges for network codes on grid connection. Bezons, France: ENTSO-E.
Sun, D., Long, H., Zhou, K., Lv, Y., Zheng, J., and Chen, Q. (2020). Research on SCESS-DFIG DC bus voltage fluctuation suppression strategy for frequency inertia regulation of power grid. IEEE Access 8, 173933–173948. doi:10.1109/ACCESS.2020.3025292
Tamura, J. (2012). “Calculation method of losses and efficiency of wind generators,” in Wind energy conversion systems, green energy and Technology. Editor S. M. Muyeen (London, UK: Springer), 25–51. doi:10.1007/978-1-4471-2201-2_2
Tielens, P., and Van Hertem, D. (2016). The relevance of inertia in power systems. Renew. Sustain. Energy Rev. 55, 999–1009. doi:10.1016/j.rser.2015.11.016
Ullah, N. R., Thiringer, T., and Karlsson, D. (2008). Temporary primary frequency control support by variable speed wind turbines— potential and applications. IEEE Trans. Power Syst. 23, 601–612. doi:10.1109/TPWRS.2008.920076
Wang, D., Gao, X., Meng, K., Qiu, J., Lai, L. L., and Gao, S. (2018). Utilisation of kinetic energy from wind turbine for grid connections: A review paper. IET Renew. Power Gener. 12, 615–624. doi:10.1049/iet-rpg.2017.0590
Watson, D., Hastie, C., and Rodgers, M. (2018). Comparing different regulation offerings from a battery in a wind R&D park. IEEE Trans. Power Syst. 33, 2331–2338. doi:10.1109/TPWRS.2017.2747517
Wu, B., Lang, Y., Zargari, N., and Kouro, S. (2011). Power conversion and control of wind energy systems. Hoboken, NJ, USA: John Wiley & Sons.
Yap, K. Y., Sarimuthu, C. R., and Lim, J. M.-Y. (2019). Virtual inertia-based inverters for mitigating frequency instability in grid-connected renewable energy system: A review. Appl. Sci. 9, 5300. doi:10.3390/app9245300
Yin, Z., Bai, B., Liu, J., and Su, S. (2017). Startup speed with dead band in wind farms with low-medium wind speed profile—case study of Hong Kong. Energy Power Eng. 09, 562–572. doi:10.4236/epe.2017.94B062
Zhang, Yongzheng, and Ooi, B. T., 2012. Adapting DFIGs for doubly-fed induction motors operation, in: Proceedings of the 2012 IEEE Power and Energy Society General Meeting. Presented at the 2012 IEEE Power & Energy Society General Meeting. New Energy Horizons - Opportunities and Challenges, IEEE, San Diego, CA, USA, 1–8. doi:10.1109/PESGM.2012.6345113
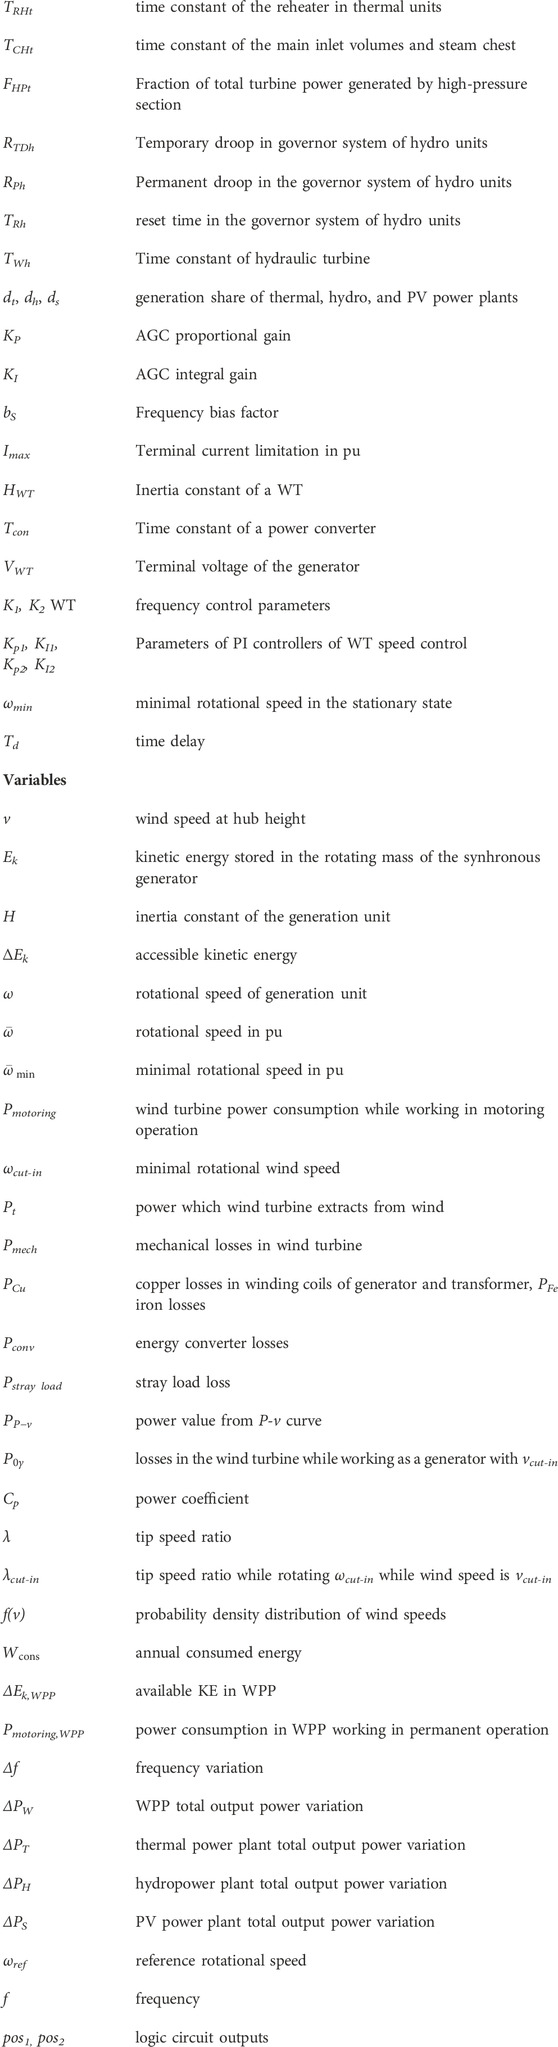
Nomenclature
Keywords: wind turbine, ancillary services, frequency support, low inertia system, inertia control, DFIG, low wind
Citation: Džodić K and Đurišić Ž (2023) The permanently rotating wind turbines: a new strategy for reliable power system frequency support under low and no wind conditions. Front. Energy Res. 11:1176680. doi: 10.3389/fenrg.2023.1176680
Received: 28 February 2023; Accepted: 26 April 2023;
Published: 18 May 2023.
Edited by:
Marianne Rodgers, Wind Energy Institute of Canada, CanadaReviewed by:
Haris M. Khalid, Higher Colleges of Technology, United Arab EmiratesKenneth E. Okedu, Senior Power System (Renewable Energy) Engineer, Australia
Copyright © 2023 Džodić and Đurišić. This is an open-access article distributed under the terms of the Creative Commons Attribution License (CC BY). The use, distribution or reproduction in other forums is permitted, provided the original author(s) and the copyright owner(s) are credited and that the original publication in this journal is cited, in accordance with accepted academic practice. No use, distribution or reproduction is permitted which does not comply with these terms.
*Correspondence: Kristina Džodić, a3Jpc3RpbmFkekBldGYucnM=