 Chen Deyang1
 Chen Chuyue
- 1Power Dispatch and Control Center of Guangdong Power Grid Company, Guangzhou, China
- 2School of Electric Power Engineering, South China University of Technology, Guangzhou, China
With the increasing proportion of wind power integration, the effect on the stability of the system power angle cannot be ignored. In this paper, based on the different power characteristics of direct-drive wind generators before a fault and after its clearance, the system model of the receiving-end grid with thermal units replaced by wind turbines is simplified. The influence of the increase in the replacement ratio of wind power in the receiving-end grid on the transfer impedance between the sending end and receiving end is analyzed. Based on the equal area rule, the influence of the replacement ratio k within the receiving-end grid, power grid operation mode, and wind power integration point on the system power angle stability is analyzed. It is concluded that the stability of the system’s power angle will first get better and then deteriorate with the increase in the replacement ratio of wind power, the system can bear a larger proportion of wind turbines under the low-load operation mode, and the system’s power angle of the replacement of wind power with equal capacity in the load center region is relatively better. The aforementioned conclusions are verified by simulation with real data from a bulk power system in China. Therefore, the method and conclusion can also be used to study the power angle stability of other large-scale power grids.
1 Introduction
With the depletion of fossil energy, clean energy has developed rapidly. Wind power is the most mature form of clean energy power generation, so countries all over the world are committed to the manufacture of large-scale wind power (Alexiadis et al., 1998; Feijóo and Villanueva, 2016a; Gu et al., 2021). The increase in wind power penetration has had a certain impact on the voltage of the grid, the short-circuit current, the frequency (Adetokun, Muriithi and Ojo, 2020; Ozioko et al., 2022a; Ozioko et al., 2022b), and other aspects. The use of a doubly fed induction generator (DFIG)-based low-voltage-ride-through (LVRT) scheme including a crowbar, power system stabilizer (PSS), rotor-side converter (RSC), and grid-side converter (GSC) in order to enhance the transient stability of a grid-connected DFIG has been proposed (Duong et al., 2016). A DFIG-based fault ride-through (FRT) scheme with a crowbar, and rotor-side and grid-side converters has been proposed for improving the transient stability; in particular, a hybrid cascade fuzzy-PI-based controlling technique has been demonstrated to be able to control the insulated gate bipolar transistor (IGBT)-based frequency converter in order to enhance the transient stability (Duong et al., 2018). At present, there are few research studies on the power angle stability of the receiving end of the power grid with large-scale wind power access, and this paper makes some original contributions to this field. Direct-drive wind turbines have the advantages of being suitable for low wind speed scenarios, having low operating and maintenance costs, and low energy consumption, which is more suitable for the development requirements of wind power in China. Therefore, according to the “Notice on Relevant Requirements for Wind Power Construction Management” in China, direct-drive wind turbines are used in the grid connection. Conroy and Watson studied the influence of permanent magnet direct-drive wind turbines on the transient stability of the power grid through simulation (Conroy and Watson, 2009).
The literature works are mainly researched on small-scale cases, while the goal of this paper is to study large-scale power grids derived from engineering practice. Due to the large difference in the power balance mode of the power grid at the sending end and the receiving end, there are also differences in the stability of the transient power angle at both ends. With the deepening of the Double Carbon goal proposed by the Chinese government (McGrath, 2020), the development of wind power will be accompanied by the withdrawal of certain thermal power units. From the perspective of the receiving-end power grid, this paper studies how to increase the penetration rate of wind power in the power grid by replacing thermal units with direct-drive wind turbines and uses the equivalent electrical distance of the system to reflect the stability of the system. Based on the equal area rule (Zhang et al., 1995), the influence mechanism of the replacement ratio, power grid operation mode, and the wind power access position on the power angle stability of the system is analyzed, and the theory is proved through simulation analysis with real data on a bulk power system in China.
2 Influence mechanism of direct-drive wind generator integration on the system electrical distance
2.1 Simplified model of direct-drive wind generators
Due to the unique randomness and intermittent nature of wind power generation, wind turbines must be connected to the grid through converters. Usually, the grid-connected converter (GFL) needs additional frequency devices for virtual inertia support, which does not behave directly in the frequency characteristics, so it can be equivalent to a negative constant load (Sajadi, Kenyon and Hodge, 2022) instability problems of large power grids.
Direct-drive wind turbines are usually controlled by constant power. When the grid is disturbed, the wind power will enter the low-voltage ride-through mode to provide reactive power to the grid (Alexandrova, Semken, and Pyrhönen, 2014). When the grid runs normally, the active power output of direct-drive wind generators remains unchanged and is positive, providing active power to the grid, while the reactive power remains zero, so the direct-drive wind generators under no fault conditions can be equivalent to a negative resistance. Suppose that the voltage of the wind power connecting point is U and the fault current is I during the fault period, then the power provided by the direct-drive wind generators to the grid can be expressed as follows:
where P and Q, respectively, represent the active and reactive power output by the direct-drive wind generators to the system during the fault period; rw and xw represent the equivalent resistance and reactance of the direct-drive wind generators, respectively. During the occurrence of a voltage drop, the active and reactive power output by the direct-drive wind generators is positive. When studying the stability situation at the global level of the large power grid, the details that have no essential influence can be ignored, and the direct-drive wind generators during fault are equivalent to parallel negative resistance and negative reactance. Figure 1 shows the simplified model of systems before and during a fault, where SG1 represents the sum of sending-end grid units; SG2 represents the sum of receiving-end thermal power units; and PMSG represents the sum of receiving-end wind turbines.
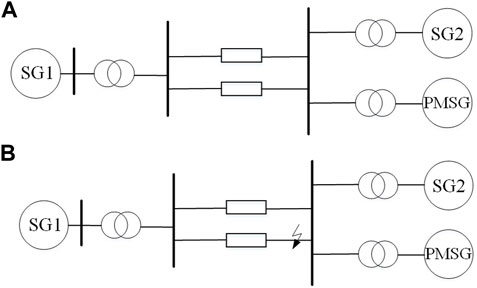
FIGURE 1. Simplified system model. (A) Simplified system model system before fault. (B) Simplified system model during fault.
According to the complex network theory, the topology conceals the physical information on the network and abstracts the relationship between nodes for study. When the object to be analyzed is a network structure with a large number of nodes and lines, the influence of the network topology structure is usually focused, while the internal details of the node elements are ignored. Therefore, when the research target is a large-scale power grid, the specific internal structure and operation mode of the turbine can be ignored.
Figure 1A shows a simplified system model before the fault. Figure 1B shows a simplified system model during the fault.
It has been proven that the doubly fed wind turbine can be simply equivalent to a pure impedance model when analyzing the power angle stability of large power grids (Liu, Shi, and Pang, 2020). In order to prove that the direct-drive wind generator can also be similarly equivalent, this paper analyzes the synchronous stability under disturbance (three-phase short circuit) when the doubly fed wind generator and the direct-drive wind generator are, respectively, connected to three power systems with different scales. The results are shown in Figure 2. It can be seen that with the increase in the scale of the power grid, the synchronous control capabilities provided by the direct-drive wind turbine and the doubly fed wind turbine tend to be the same. Combining the conclusions given in the previous literature studies, when studying the synchronous stability of large-scale power grids in this paper, the direct-drive wind generator is also similarly equivalent to impedance.
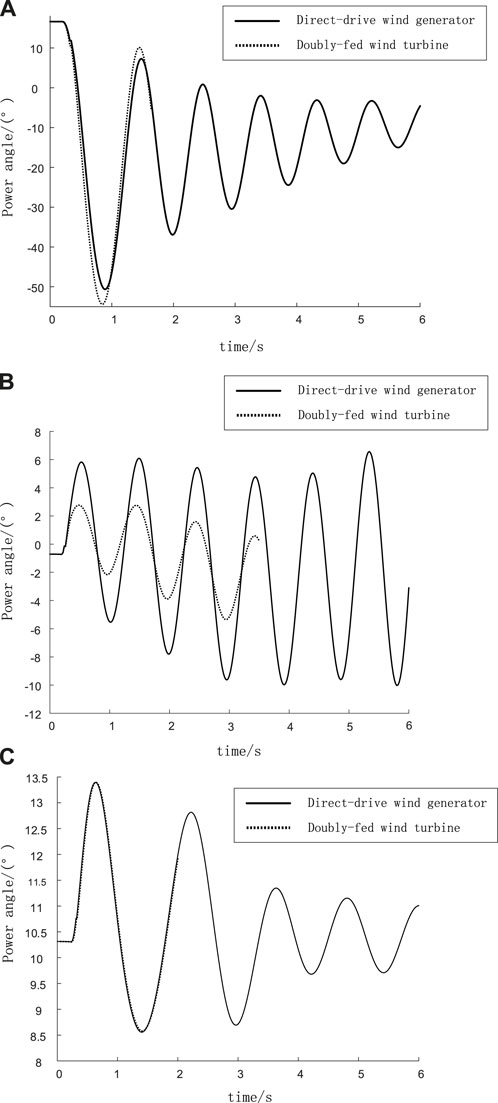
FIGURE 2. Comparison of the synchronization control ability of different types of wind turbines in three power systems with different scales. (A) Results in the IEEE 9-node sample system. (B) Results in the IEEE 39-node sample system. (C) The Guangdong power system with 21596 nodes in China.
Figure 2A shows the IEEE 9-node power grid (maximum difference: 6.92°). Figure 2B shows the IEEE 39-node power grid (maximum difference: 5.15°). Figure 2C shows the Guangdong power system with 21,596 nodes in China (maximum difference: 0.1268°).
2.2 Influence mechanism of wind power integration on an equivalent electrical distance of the power grid
In order to study the influence of wind turbine replacement on the power angle stability of the system under fault conditions, a short-circuit fault in the power grid at the receiving end is taken as an example. First, the system situation is analyzed before the fault occurs.
Figure 3A shows a simplified circuit without a wind turbine connected to the grid, where S is the equivalent node of the power grid at the sending end, R is the equivalent node of the power grid at the receiving end, and W is the position connected to the wind turbine; XdT1 is the equivalent reactance of generators and transformers of the sending-end grid, XL represents the equivalent reactance of the power transmission channels between the sending-end power grid and the receiving-end power grid, and XdT2 is the equivalent reactance of the receiving-end power grid units, transformers, and loads. Figure 3B is a corresponding simplified model of the system after the replacement in the receiving-end grid before the fault. Since the wind turbine only outputs active power, the equivalent impedance has only the real part. Let the capacity of a single wind turbine be the reference value of the per-unit system; hence, N represents the per-unit value of the total capacity of synchronous units and wind turbines in the receiving-end power grid, and k represents the proportion of thermal units replaced by equal-capacity wind turbines in the receiving-end power grid.
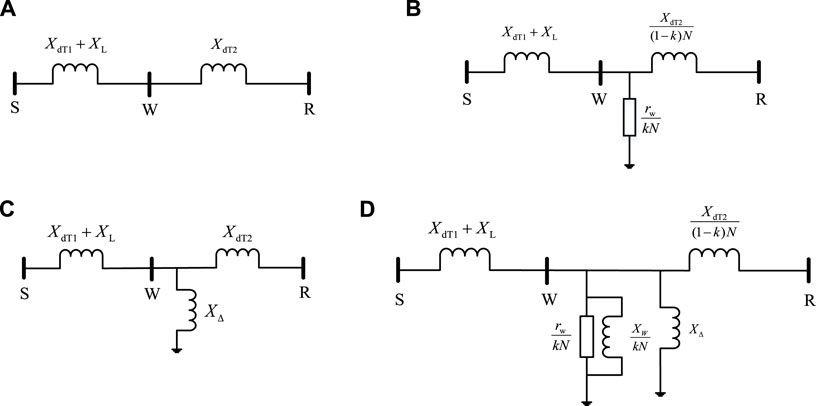
FIGURE 3. Simplified models of a power grid under different conditions. (A) Simplified model of power grid without wind turbine. (B) Simplified model of power grid replaced by wind turbines before fault. (C) Simplified model of power grid without wind turbine under fault. (D) Simplified model of power grid replaced by wind turbines under fault.
Figure 3A shows a simplified model of a power grid without a wind turbine. Figure 3B shows the simplified model of a power grid partially replaced by wind turbines before the fault. Figure 3C shows a simplified model of a power grid without a wind turbine under the fault. Figure 3D shows the simplified model of a power grid partially replaced by wind turbines under the fault.
Suppose that
For Figure 3B, the system transfer impedance with a wind turbine is as follows:
One can construct function F1 as follows:
where a1>0, b1 > 0, F1 (0) = 0, so function F1 is a concave function, and the extremum point is located in the left half of the coordinate system, and
Figure 3C is a simplified model of the system without wind turbine access during a fault, and Figure 3D is a corresponding simplified model of the system with wind turbines during a fault, where XΔ is the additional reactance during a short-circuit fault.
For Figure 3C, the transfer impedance between the system sending-end power grid S and receiving-end power grid R is as follows:
For Figure 3D, the transfer impedance of system with wind turbines is as follows:
The function F2 similar to Equation 4 is constructed as follows:
where d = m + n+1/XΔ.
For large networks, when N is large enough, d could be approximated as
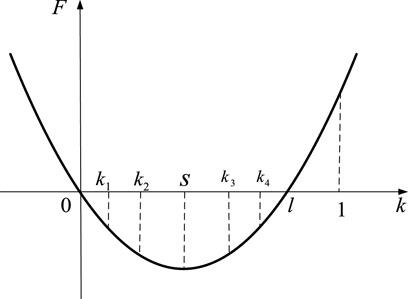
FIGURE 4. Curve of function F2.
When 0 < k<s,
When s<k<l,
When k>l,
3 Influence of the wind power ratio on the system power angle stability
3.1 Influence mechanism of the wind power ratio on the system power angle stability
The power characteristic equation of a generator during a fault is shown in Equation 9.
where
Suppose that the numerator of Z11 is (c + ej) when the denominator is removed.
As previously mentioned, for large networks, N is large, so the value of the imaginary part e containing N2 is much larger than that of the real part c. It can be approximated that c ≈ 0, sinθ11 ˜ 1, θ11 ˜ 90°, α11 ˜ 0°, and sinα11 ˜ 0. Now, Equation 9 can be expressed as follows:
For curve F in Figure 5A, when 0 < k1<k2<s, the acceleration and deceleration areas under different wind turbine ratios are shown in Figures 5B–D, where I, II, and III are, respectively, characteristic curves before a fault, during a fault, and after the clearance of the fault without a wind turbine; IV, V, and VI are, respectively, the characteristic curves before a fault, during a fault, and after the clearance of the fault when the wind turbine ratio is k1; VII, VIII, and IX are, respectively, the characteristic curves before a fault, during a fault, and after the clearance of the fault when the wind turbine ratio is k2.
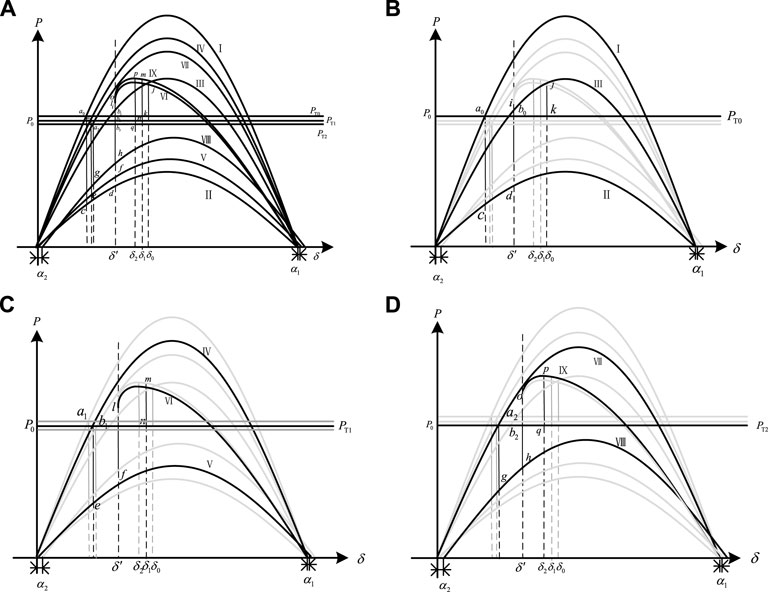
FIGURE 5. When 0 ≤ k < s, acceleration and deceleration areas under different turbine replacement ratios. (A) Comparison of acceleration area and deceleration area at different k. (B) When no turbine is connected. (C) When k = k1. (D) When k = k2.
Figure 5A shows acceleration and deceleration areas under different turbine replacement ratios with wind power access when 0 < k<s. Figure 5B shows the acceleration and deceleration areas under different turbine replacement ratios without wind power access. Figure 5C shows the acceleration and deceleration areas when k = k1. Figure 5D shows the acceleration and deceleration areas when k = k2.
When s<k3<k4<l, the acceleration areas and the deceleration areas under different wind turbine replacement ratios are shown in Figure 6. When the proportion of wind power increases gradually, in order to ensure the safe and stable operation of the power grid and consider the law of the development of the real power grid, it is usually necessary to replace thermal units with wind turbines and ensure the output of the thermal power unit at the same time. Therefore, it is assumed that before the fault, the power curve and the input power curve of the prime mover remain unchanged, where I is the power characteristic curve before the fault. II and III are, respectively, the power characteristic curves during the fault and after clearance of the fault when the wind turbine replacement ratio is k3. IV and V are, respectively, the power characteristic curves during the fault and after clearance of the fault when the wind turbine replacement ratio is k4. Suppose that the fault is cleared when the power angle is δ'. When k = k3, the acceleration area is
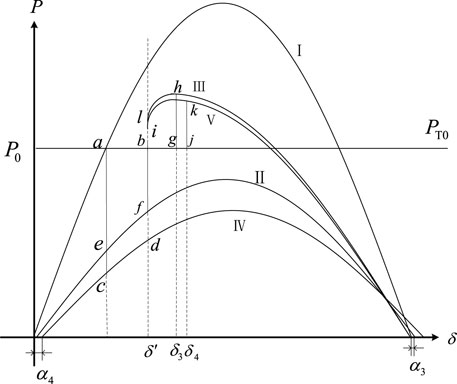
FIGURE 6. When s<k<l, acceleration and deceleration areas under different turbine replacement ratios.
When k>l, with the increase in the replacement proportion, the power angle curve and the prime mover input power curve during the fault gradually decrease, and compared with the condition that wind turbines cannot be accessed, the change cannot be ignored, so it will be more difficult to accurately find the critical value of the power angle with the equal area rule. In the actual operation of the power grid, when the proportion of wind power reaches a considerable value, it will cause instability of the grid voltage, frequency, and other problems. Furthermore, the operation of the actual power grid does not allow the elimination of excessive thermal power units, so this paper does not analyze the power angle stability of the scenario when k>l.
3.2 Example simulation and analysis
As an important coastal province, Guangdong has abundant offshore resources for the development of offshore wind power. At the same time, in order to ensure the high-load operation of the Guangdong Power Grid, it needs to rely on the power support of Yunnan, Guizhou, and Guangxi, which cause the Guangdong grid to become a typical receiving-end power grid in the Southern Power Grid.
The 2022 summer high-load operation mode of the China Southern Power Grid is taken as an example, in which the Guangdong Power Grid is the receiving-end network (R), as can be seen in Figure 7A. By replacing thermal power units in coastal cities with direct-drive wind turbines to improve the replacement ratio of the Guangdong Power Grid, six simulation scenarios are obtained, where k1 = 2.5%, k2 = 12.5%, k3 = 25%, k4 = 39.8%, k5 = 51.1%, and k6 = 60.28%.
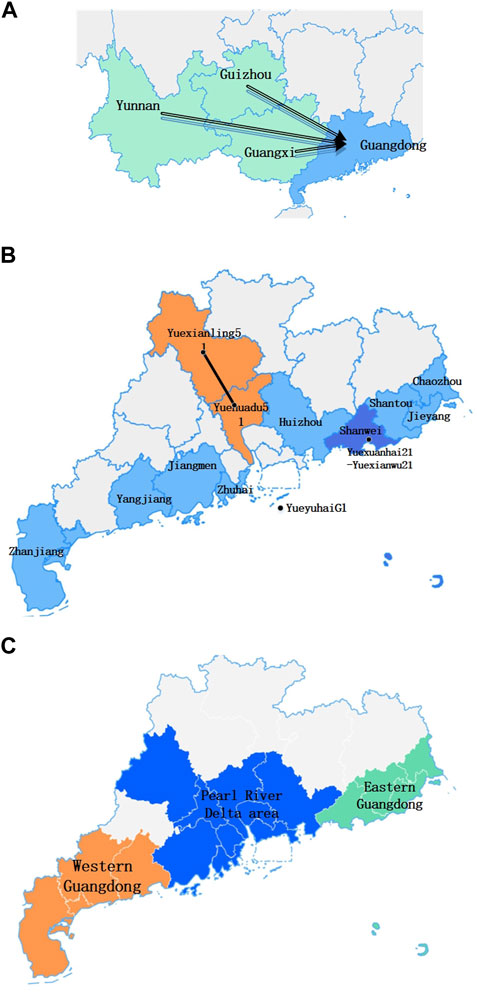
FIGURE 7. Map of the geographical location. (A) The global situation of power transmission from west to east in the China Southern Power Grid (B) The position of disturbed lines. (C) The position of the turbine access.
Figure 7A shows the global situation of power transmission from west to east in the China Southern Power Grid. Figure 7B shows the position of disturbed lines. Figure 7C shows the position of the turbine access.
At 0.2 s, two three-phase short-circuit disturbances are applied separately. The first fault happens on the transmission line from node Yuexuanhai21 near the integration point of the Guangdong Power Grid Xuanwu Offshore Wind Plant to node Yuexuanwu21, and the second fault happens on the transmission line from node Yuexianling51 to node Yuehuadu51, far away from the wind power integration point. Both of the two faults were removed at 0.32 s. Taking the power angle change of unit YueyuhaiG1 as an example, the approximate position of the disturbed line is shown in Figure 7B. Figures 8A,B respectively, show the power angle curves of YueyuhaiG1 in the wind power ratio of k1, k2, and k3 under the two faults.
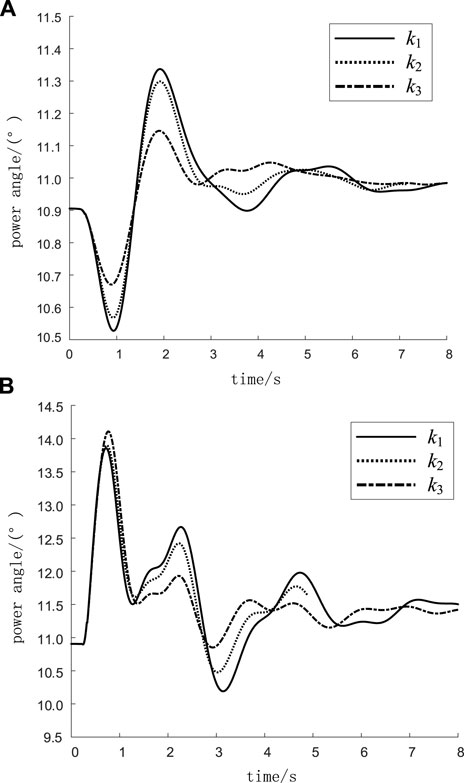
FIGURE 8. Power angle when k = k1, k2, and k3 in the high-load operation mode. (A) The Yuexuanhai21-Yuexuanwu21 line. (B) The Yuexianling51-Yuehuadu51 line.
Figure 8A shows the Yuexuanhai21–-Yuexuanwu21 line (a three-phase short circuit occurs). Figure 8B shows the Yuexianling51–-Yuehuadu51 line three-phase short circuit.
As can be seen in Figure 8, when the proportion of wind power is relatively small, with the increase in k, the swing amplitude of the system power angle decreases and the stability of the power angle increases, which is consistent with the results of the analysis in Figure 8.
Thermal power is continuously replaced with wind power, and the same disturbances are set. Figure 9 shows the power angle curve of YueyuhaiG1 when the proportion of wind power is k4, k5, and k6.
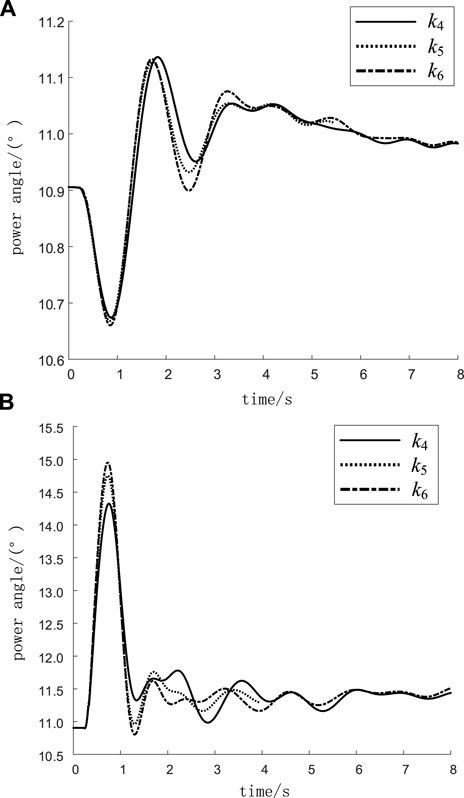
FIGURE 9. Power angle when k = k4, k5, and k6 in the high-load operation mode. (A) The Yuexuanhai21-Yuexuanwu21 line. (B) The Yuexianling51-Yuehuadu51 line.
As can be seen in Figure 9, when the proportion of wind power increases further, the swing amplitude of the system power angle will increase and the stability of the power angle will become weaker, which is consistent with the results of the analysis in Figure 6.
Figure 9A shows the Yuexuanhai21–-Yuexuanwu21 line (a three-phase short circuit occurs). Figure 9B shows the Yuexianling51–-Yuehuadu51 line three-phase short circuit.
According to the simulation results, compared to the fault far away from the wind power access point, the condition of the system power angle is more stable when the fault occurs near the wind power access point, and the whole swing of the system power angle is more consistent with the theoretical derivation results given in Section 2.1.
4 Study on the influence of the operation mode on the power angle stability of the system
According to the simulation in Section 2.2, when the Guangdong Power Grid operates in the high-load operation mode, there exists a proportion value of wind power replacement that makes the power angle situation the best, that is, k = s, and s is in the range 25% < s < 40%. According to Equation 7, there exists an extreme point of the wind power replacement ratio that makes the system power angle the most stable, which is
For a large network, the value N is quite large, so it can be approximated that
When the power grid operates in the low-load operation mode, the equivalent impedance of the power grid load at the receiving end becomes larger, leading to larger
Taking the 2022 summer low-load operation mode of the China Southern Power Grid as an example, in which the Guangdong Power Grid is the receiving network (R), the wind power replacement ratio of the Guangdong Power Grid is improved by replacing thermal power units in coastal cities with direct-drive wind turbines, and six simulation scenarios are obtained, where k1 = 0.25%, k2 = 10%, k3 = 22.05%, k4 = 32.63%, k5 = 43.12%, and k6 = 51.73%.
At 0.2 s, a three-phase short-circuit disturbance was applied to the transmission line from node Yuexuanhai21 near the integration point of the Xuanwu Offshore Wind Plant of the Guangdong Power Grid to node Yuexuanwu21, and the fault was removed at 0.32 s. The change in the power angle of unit YueyuhaiG1 was studied as an example. Figure 10A shows the power angle curve of YueyuhaiG1 when the ratios of wind power are k1, k2, and k3 during the fault. With the increase in the wind power ratio, the swing amplitude of the power angle decreases and the stability of the power angle increases.
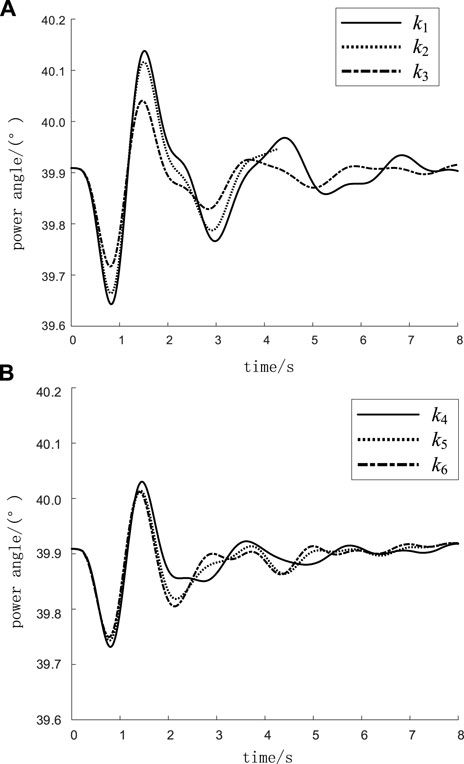
FIGURE 10. Power angle when k differs in the low-load operation mode. (A) The power angle when k = k1, k2, and k3. (B) The power angle when k = k4, k5, and k6.
Figure 10A shows the power angle when k = k1, k2, and k3 in the low-load operation mode. Figure 10B shows the power angle when k = k4, k5, and k6 in the low-load operation mode.
The thermal units are continuously replaced with wind turbines, and the same disturbances are set. Figure 10B shows the power angle curve of YueyuhaiG1 when the wind power ratios are k4, k5, and k6. When the wind power ratio increases from k4 to k5, the power angle stability of the system is still improved. Since the wind power ratio is still in the interval 0 < k<s, when it increases further and reaches k6, it will be found that the condition of the system power angle begins to deteriorate, and the proportion of wind power k enters the interval k>s. Therefore, under the low-load operation mode, the optimal power angle for wind power accounts for 32.63% < s < 43.12%, which can withstand a higher percentage of wind turbine replacement than the high-load operation mode, which is consistent with the theoretical analysis results.
In order to avoid the particularity of fault line selection, a short-circuit fault is set for several lines of the Guangdong Power Grid, and the transient power angle stability under fault is analyzed, considering the short circuit of two or three lines at the same time. Table 1 shows the results of the maximum generator power angle difference of the Guangdong Power Grid under different line short-circuit faults. According to the simulation, with the increase in the wind power replacement ratio, the transient power angle stability of the receiving power grid (Guangdong Power Grid) first improves and then deteriorates, which is consistent with the results of the theoretical derivation.

TABLE 1. Maximum generator power angle difference of the Guangdong Power Grid under different line faults.
5 Study on the influence of the wind power integration position on the power angle stability
The difference in the integration location of offshore wind power will affect the topological structure of the receiving-end grid. Taking the Guangdong Power Grid as an example, the integration points of the high-voltage DC transmission line from western provinces are concentrated in the Pearl River Delta region. Therefore, when offshore wind power is connected to the Pearl River Delta region, the equivalent reactance (
For Equation 7, suppose that d = n and F2 as the function of n, then F3 can be obtained as follows:
where a3<0, b3 < 0, and F3 (0)>0, the extreme point of the function is located in the left half of the coordinate system. Therefore, with the increase in n, F3 decreases, that is, with the decrease in
According to the Guangdong offshore wind power development plan, Guangdong will develop offshore wind power in the Pearl River Delta (Zhuhai, Huizhou, and Jiangmen), eastern Guangdong (Shantou, Shanwei, Jieyang, and Chaozhou), and western Guangdong (Zhanjiang and Yangjiang) coastal areas in the future. To study the influence of the centralized access area of wind power on the power angle of the system, under the 2022 summer high-load operation mode of the Guangdong Power Grid, roughly 9% of the wind turbines will replace the thermal units in the eastern and western Guangdong, and the Pearl River Delta, respectively. Figure 7C shows different access locations of wind turbines.
The three-phase short-circuit disturbance was set at 0.2 s in the non-offshore wind power access area, and the disturbance ended at 0.32 s. The change in the power angle of unit YueyuhaiG1 was studied as an example. Figure 11 shows the comparison of the system power angle after replacing the thermal units with wind turbines in the eastern Guangdong, western Guangdong, and Pearl River Delta regions.
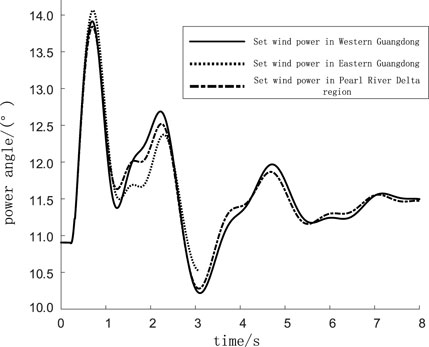
FIGURE 11. Wind power angle in different regions.
According to the simulation results, when the disturbance occurs in the non-offshore wind power access region and when offshore wind power is connected to the Pearl River Delta region, the power angle stability of the system is the best, followed by eastern Guangdong. The power angle stability is relatively poor when the thermal units are replaced by wind power in western Guangdong, which is consistent with the previous theoretical derivation results.
6 Conclusion
In this paper, based on the different power characteristics of direct-drive wind turbines before and during a fault, a simplified equivalent model of wind turbines is carried out. Before the fault, the wind turbine is equivalent to negative resistance, and during the fault, it is equivalent to negative resistance and negative reactance in parallel. Based on this simplified system model of the replacement of thermal units by direct-drive wind turbines in the receiving-end power grid, the influence of the replacement on the transient power angle stability of the receiving system is reflected by analyzing the effect of the replacement ratio on the electrical distance between the sending-end network and the receiving-end network. Based on the equal area rule, the influences of different wind power replacement ratios k, power grid operation mode, and wind power access position on the power angle stability of the system are analyzed. In addition, through the verification of the Guangdong Power Grid simulation, the following conclusions are obtained:
(1) As the ratio of thermal unit replacement by direct-drive wind turbines of the receiving-end grid increases, the transfer impedance between the sending-end and receiving-end grids will continue to increase before the fault. During a fault, the transfer impedance between the sending-end and receiving-end networks will first decrease and then increase. The change in transfer impedance will affect the power angle curve of the system and then the power angle stability of the system. As the replacement ratio of the receiving-end grid increases, the electrical distance between the sending-end and the receiving-end grid will first decrease and then increase, and the transient power angle stability of the system will first increase and then decrease.
(2) In theory, there exists a ratio value that makes the most stable power angle for the replacement, namely, k = s. In addition, the range of this value s is also different in the high- and low-load operation modes. In the low-load operation mode, the s value is relatively larger, that is, to ensure the stability of the power angle, the system can withstand a larger wind power replacement ratio. At the same time, according to the theoretical derivation, the optimal ratio of wind power replacement is related to the topology structure of the receiving-end network, and the influence of the network topology change caused by the development of the power grid on this extreme value can be considered in the subsequent research.
(3) Different locations of centralized access to offshore wind power also affect the stability of the system power angle, and the system power angle is relatively good when offshore wind power is integrated near the load center region.
The influence of the change in the inertia center caused by the position difference of the disturbance on the stability of the power angle of the system will be considered in the follow-up study. Combined with the actual situation of the power grid, the average electrical distance of the power grid between the sending end and receiving end is determined to quantitatively analyze the power angle stability of the system more accurately.
Data availability statement
The datasets presented in this article are not readily available because of confidential requests from state-owned enterprises. Requests to access the datasets should be directed to LZ, ODcxNDEwODE3QHFxLmNvbQ==.
Author contributions
CD proposed the initial concepts and ideas; LY, CJ, and YZ provided validation scenarios and corresponding data in engineering practice. LZ completed the data analysis and wrote the first draft of the paper. WZ provided a theoretical model. CC added an example. All authors contributed to the article and approved the submitted version.
Funding
This work is supported by the China Southern Power Grid Corporation (Project No. GDKJXM20198236).
Conflict of interest
Authors CD, LY, CJ, and YZ were employed by the Power Dispatch and Control Center of Guangdong Power Grid Company.
The remaining authors declare that the research was conducted in the absence of any commercial or financial relationships that could be construed as a potential conflict of interest.
Publisher’s note
All claims expressed in this article are solely those of the authors and do not necessarily represent those of their affiliated organizations, or those of the publisher, the editors, and the reviewers. Any product that may be evaluated in this article, or claim that may be made by its manufacturer, is not guaranteed or endorsed by the publisher.
References
Adetokun, B. B., Muriithi, C. M., and Ojo, J. O. (2020). Voltage stability assessment and enhancement of power grid with increasing wind energy penetration. Int. J. Electr. Power & Energy Syst. 120, 105988. doi:10.1016/j.ijepes.2020.105988
Alexandrova, Y., Semken, R. S., and Pyrhönen, J. (2014). Permanent magnet synchronous generator design solution for large direct-drive wind turbines: Thermal behavior of the LC DD-PMSG. Appl. Therm. Eng. 65 (1–2), 554–563. doi:10.1016/j.applthermaleng.2014.01.054
Alexiadis, M. C., Dokopoulos, P., Sahsamanoglou, H., and Manousaridis, I. (1998). Short-term forecasting of wind speed and related electrical power. Sol. Energy 63, 61–68. doi:10.1016/S0038-092X(98)00032-2
Conroy, J., and Watson, R. (2009). Aggregate modelling of wind farms containing full-converter wind turbine generators with permanent magnet synchronous machines: Transient stability studies. IET Renew. Power Gener. 3 (1), 39. doi:10.1049/iet-rpg:20070091
Duong, M. Q., Grimaccia, F., Leva, S., Mussetta, M., and Le, K. H. “Hybrid Fuzzy-PI cascade controller for transient stability improvement in DFIG wind generators,” in Proceedings of the IEEE International Conference on Fuzzy Systems IEEE, Vancouver, BC, Canada, July 2016, 1733–1739. doi:10.1109/FUZZ-IEEE.2016.7737899
Duong, M. Q., Leva, S., Mussetta, M., and Le, K. H. (2018) ‘A comparative study on controllers for improving transient stability of DFIG wind turbines during large disturbances’, Energies, 11, 480. doi:10.3390/en11030480
Feijóo, A., and Villanueva, D. (2016). Assessing wind speed simulation methods. Renew. Sustain. Energy Rev. 56, 473–483. doi:10.1016/j.rser.2015.11.094
Gu, B., Zhang, T., Meng, H., and Zhang, J. (2021). Short-term forecasting and uncertainty analysis of wind power based on long short-term memory, cloud model and non-parametric kernel density estimation. Renew. Energy 164, 687–708. doi:10.1016/j.renene.2020.09.087
Liu, Q., Shi, C., and Pang, S. (2020). SSO suppression strategy of DFIG-based wind turbine based on impedance reshaping. IOP Conf. Ser. Earth Environ. Sci. 555 (1), 012033. doi:10.1088/1755-1315/555/1/012033
Ozioko, I. O., Ugwuanyi, N. S., Ekwue, A. O., and Odeh, C. I. (2022a). Wind energy penetration impact on active power flow in developing grids. Sci. Afr. 18, e01422. doi:10.1016/j.sciaf.2022.e01422
Ozioko, I. O., Ugwuanyi, N. S., Ekwue, A. O., and Odeh, C. I. (2022b). Wind energy penetration impact on active power flow in developing grids. Sci. Afr. 18, e01422. doi:10.1016/j.sciaf.2022.e01422
Sajadi, A., Kenyon, R. W., and Hodge, B.-M. (2022). Synchronization in electric power networks with inherent heterogeneity up to 100% inverter-based renewable generation. Nat. Commun. 13 (1), 2490. doi:10.1038/s41467-022-30164-3
Keywords: high proportion of wind power, receiver-end grid, direct-drive turbine generator, angle stability, equal area rule
Citation: Deyang C, Zixi L, Yu L, Jinchang C, Zhennan Y, Zhigang W and Chuyue C (2023) Research on the influence of a high proportion of wind power connected to the receiving power grid on the system power angle stability. Front. Energy Res. 11:1205140. doi: 10.3389/fenrg.2023.1205140
Received: 13 April 2023; Accepted: 05 June 2023;
Published: 27 June 2023.
Edited by:
Juan P. Amezquita-Sanchez, Autonomous University of Queretaro, MexicoReviewed by:
Minh Quan Duong, The University of Danang, VietnamKenneth E. Okedu, Nişantaşı University, Türkiye
Feng Hong, North China Electric Power University, China
Copyright © 2023 Deyang, Zixi, Yu, Jinchang, Zhennan, Zhigang and Chuyue. This is an open-access article distributed under the terms of the Creative Commons Attribution License (CC BY). The use, distribution or reproduction in other forums is permitted, provided the original author(s) and the copyright owner(s) are credited and that the original publication in this journal is cited, in accordance with accepted academic practice. No use, distribution or reproduction is permitted which does not comply with these terms.
*Correspondence: Wu Zhigang, ZXB6Z3d1QHNjdXQuZWR1LmNu