 Ziyang Wan1
 Ziheng Pu
- 1Nanchang Electric Power Supply Company, Jiangxi Nanchang, China
- 2College of Electrical Engineering and New Energy, China Three Gorges University, Hubei Yichang, China
Lightning is one of the frequent natural disasters, which seriously affects the secure and stable operation of the power system, especially the distribution network lines with weak reliability. In order to improve the power supply reliability of the distribution network, higher requirements are put forward for the accuracy of lightning warning. Therefore, this paper establishes a lightning warning model based on comprehensive multi-meteorological factor thresholds and analyzes the meteorological factor data such as atmospheric field strength, echo intensity, echo-top height, and vertical cumulative liquid water content under thunderstorm weather. The threshold value of each factor warning is obtained, and the corresponding threshold weight is calculated by the entropy weight method. According to the weight of each threshold, the comprehensive threshold index of lightning warning is obtained, and the lightning warning is based on this index. A total of 105 lightning data from May to June 2022 in Nanchang city were analyzed as samples. The thresholds of atmospheric field strength, echo intensity, echo-top height, and vertical cumulative liquid water content were 1.2 kV/m, 40 dBZ, 8 km, and 5.2 kg·m−2, respectively. The corresponding weights of each factor were 0.4188, 0.2056, 0.2105, and 0.165, respectively. This model was used to warn a thunderstorm event in July 2022 in Nanchang area. The success rate of the model warning was 0.91, the false alarm rate (FAR) was 0.11, and the critical success index (CSI) was 0.80. Compared with the single-factor threshold lightning warning model, the warning FAR is decreased by 6%, and CSI is increased by 14% while ensuring the high warning success rate.
1 Introduction
In recent years, the global climate change and extreme weather have become obvious, and the lightning activity is more frequent and intense. The frequent occurrence of lightning damage poses a great threat to the security of ground construction facilities, personnel life, and property; equipment communication; and the stable operation of transmission and distribution systems (Shi et al., 2021; Wu et al., 2021). With the development of economy, the scale of distribution network continues to expand, the frequency of lightning strikes on distribution network lines and equipment increases, the impact becomes larger, and the requirements for lightning protection of distribution network are also increasing. Therefore, the demand for monitoring, early warning, forecasting and defense of lightning, and its disasters in distribution lines is becoming more and more urgent.
With lightning nowcasting and early warning based on weather radar, many scholars at home and abroad have carried out a lot of analysis work and achieved useful results. By analyzing 15 thunderstorm cases in Florida, Alabama, and New Mexico, Buechler et al. proposed to establish lightning warning indicators using two thresholds of echo intensity and echo-top height at −10°C (Romps et al., 2014). Through statistical analysis of 67,384 convective cells, Mosier et al. pointed out that 30-dBZ radar echoes can be detected by at least two continuous body scans at temperature levels of −15°C and −20°C. It can be used as a lightning warning indicator, and the critical success index of the indicator is 68% (Li et al., 2023). The lightning warning system of the Chinese Academy of Meteorological Sciences uses the double-echo intensity threshold and the echo intensity threshold at a certain temperature level, combined with the lightning location data, to predict the probability of a future lightning occurrence (Dokic et al., 2016). Based on the analysis of three strong thunderstorm processes in North China by Yixiaoyuan et al., it is found that there is a positive correlation between the frequency of CG lightning and the echo area of the convective cloud echo top higher than 11–12 km, and the echo area of the echo top higher than 11 km has an early warning significance for the intensity of CG lightning activity (Tong et al., 2021). However, the aforementioned studies only consider the use of single-radar meteorological data for lightning warning, and the radar data lack the information on thunderstorm clouds on electricity, so it will result in an insufficient success rate for lightning warning. In order to solve this problem, the researchers of the Shanghai Meteorological Disaster Prevention Engineering Technology Center analyzed the basic characteristics of the time series difference of the atmospheric electric field on sunny and thunderstorm days, and proposed a method of lightning warning by using the time series difference threshold of the atmospheric electric field instrument (Mostajabi et al., 2019). The researchers of Nanjing University of Information Science and Technology proposed to use the atmospheric electric field intensity value and its difference value as early warning parameters, and comprehensively consider the electric field, lightning location, and radar echo data to warn of lightning (Du et al., 2020). The researchers of the Xiamen Lightning Protection Center monitored the atmospheric electric field intensity and lightning distance using the atmospheric electric field instrument and the lightning location system, and comprehensively analyzed the lightning space and time to achieve a more accurate lightning short-term warning (Jun, 2017). Based on the radar meteorological data, these studies combine the electric field intensity and lightning location data to further improve the selection of lightning warning factors, and comprehensively carry out lightning warning, but they do not quantify the relationship between the threshold of each factor and the lightning warning results (Hieu et al., 2021).
In this paper, combined with the actual climatic characteristics of the Nanchang area in Jiangxi Province, a lightning warning model with a comprehensive meteorological factor threshold is established. First, the ground atmospheric electric field data and radar meteorological data are extracted and analyzed in combination with the lightning location data to obtain the optimized warning threshold of each meteorological warning factor. Then, the entropy weight method is used to quantify the warning threshold, and the atmospheric average ground electric field, radar meteorological data, and lightning location data are comprehensively used to warn the short-term approaching of the first ground flash of the thunderstorm cloud within a certain range of the distribution line electric field station, which provides a reference for the implementation of active lightning protection technology for distribution network lines.
2 Basic method of lightning warning
2.1 Lightning warning process
Radar, lightning locators, and electric field instruments can simultaneously observe the same thunderstorm activity. Figure 1 shows the observation of the electric field, radar, and lightning locator when thunderstorm clouds approach. The ROW in the figure represents the lightning threat area (as shown in CG), also known as the range of warning (ROW), which is within the effective range of electric field detection. In this area, when thunderstorm clouds develop, the changes in charge in the clouds can be observed using atmospheric electric field instruments, and the relevant information about thunderstorm clouds, such as strong echoes and thunderstorm cloud position information, can be detected by radar. These details can be used for lightning warnings. At the same time, all lightning positions, intensities, and other information that occur in thunderstorm clouds can be observed using lightning locators. Therefore, the temporal and spatial relationships between electric field, radar, and lightning location data make it possible to combine the three types of data for early warning. The lightning information generated by the thunderstorm cloud is detected by the lightning locator, and the electric field instrument detects the charge situation in the thunderstorm cloud, which can be used for lightning warning. However, due to different properties of these three types of data, this article considers quantifying them and calculating their weight values to fuse these data.
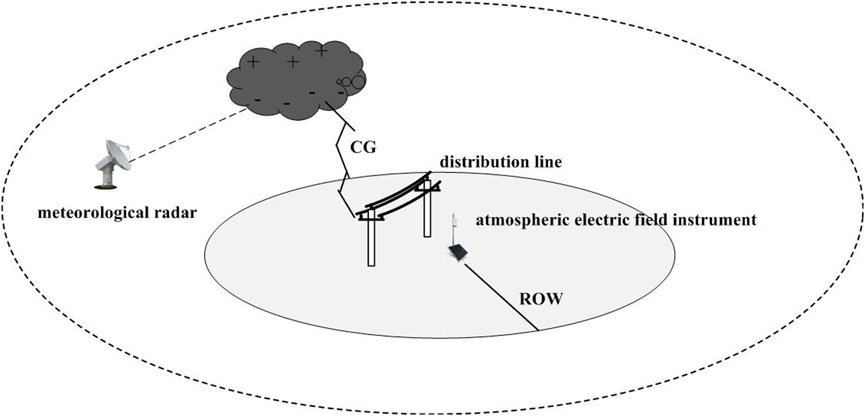
FIGURE 1. Electric field and radar measurement of the lightning process.
2.2 Lightning warning factor extraction
This paper extracted 105 thunderstorm cells and corresponding lightning warning factor data that occurred in the Nanchang area of Jiangxi Province from May to June 2022. The data are derived from radar, lightning location, and atmospheric electric field instrument data from the Jiangxi Meteorological Archives. The distribution of radar stations in Nanchang area is shown in Figure 2.
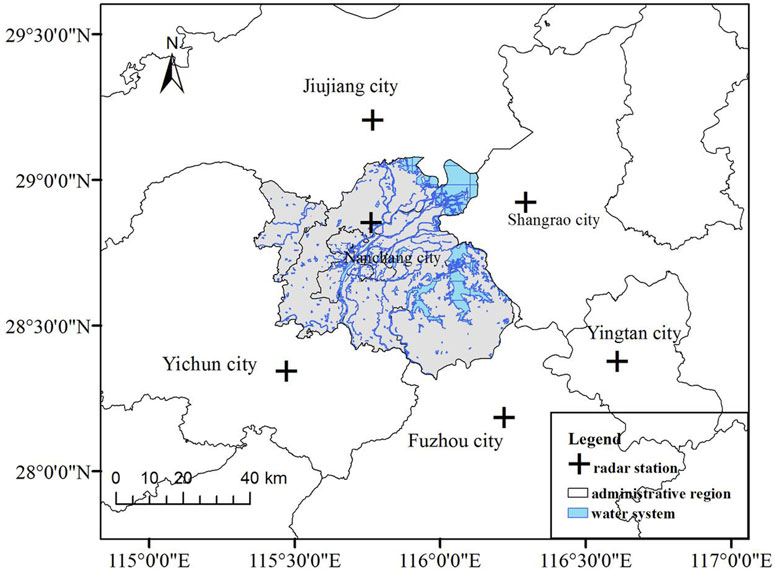
FIGURE 2. Radar site distribution map in the Nanchang area.
The lightning location system monitored the lightning situation in the Nanchang area from May to June, as shown in Figure 3. The red point represents the ground flash data monitored by the lightning location system in real time.
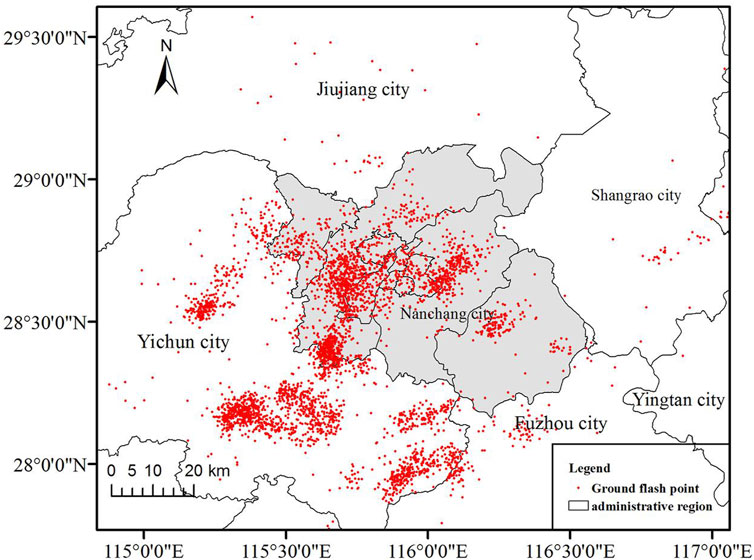
FIGURE 3. Real-time monitoring map of ground flash in the Nanchang area.
Four types of lightning warning index data on electric field amplitude, echo intensity, echo-top height, and vertical accumulated liquid water content of thunderstorm weather and thunderstorm ground flash data are compared and analyzed. According to the calculation method of the warning rate proposed in GB_T 38121 for thunderstorm warning, the thresholds of a successful warning rate (POD), false alarm rate (FAR), and critical success index (CSI) (Leite et al., 2019; Xiao et al., 2019) of lightning warning factors under different warning thresholds are calculated and optimized.
The definitions of the POD, FAR), and CSI used in this paper are shown in Table 1.
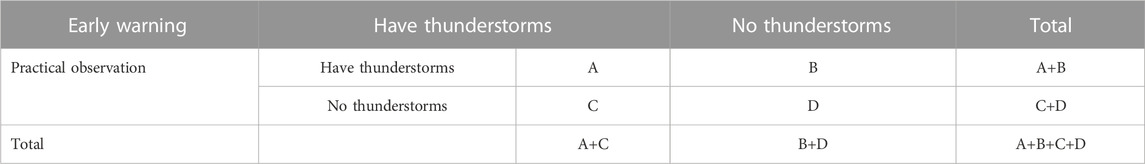
TABLE 1. Data definition table.
The POD indicates the percentage of successful lightning warning in live observation, and its value is between 0 and 1. The larger the value, the closer it is to the successful early warning, which is defined as
The FAR represents the percentage of false alarms in a lightning warning, and its value is between 0 and 1. The smaller the value is, the closer it is to the successful warning, which is defined as
The CSI is the percentage of correct warnings in the entire lightning warning event (including correct, false, and missed warnings). The value is between 0 and 1, and the larger the value, the closer it is to the successful warning, which is defined as
The concept of early warning advance time T is introduced, which is defined as the time interval between the time when the early warning index of radar echo appears and the time when the first ground flash occurs.
3 Threshold determination of the lightning warning factor
The Doppler effect was first discovered by the Austrian physicist J. Doppler in 1842 from a moving sound source (Ghaemi et al., 2022). The working principle of Doppler weather radar is based on the Doppler effect. The specific performance is when the precipitation particles are relatively moving relative to the radar transmitting beam, the difference between the high frequency of the received signal and the transmitted signal can be measured, and the required information can be obtained. Using this principle, the velocity of the scatterer relative to the radar can be measured, and the atmospheric wind field, the distribution of the vertical velocity of the airflow, and the turbulence can be inverted under certain conditions. Based on this principle, the monitoring data are analyzed and compared, and the threshold of the lightning warning factor suitable for the Nanchang area of Jiangxi Province is obtained.
3.1 The echo intensity threshold
It is found that the main activity center of lightning is related to the supercooled cloud layer, and the negative charge area of cloud-to-ground lightning is mainly located in the temperature level of −5 to −25°C (Bouchard et al., 2023). Considering that 40-dBZ echo intensity at the height of −10°C can be used as the best factor to predict the occurrence of the first lightning, Maribel analyzed several convective cells and found that the condition for lightning in the cell is that the top height of the echo above 40 dBZ in the cell must be higher than 7 km. Wu et al. (2018) analyzed 20 cells in summer in Beijing and concluded that 40 dBZ is a more suitable radar echo characteristic parameter for a lightning warning. It is a practical method to use 0°C and other temperature height layers as the basic characteristic height, combined with the proportion of −10°C and other temperature height layers and strong echoes for lightning comprehensive warning. Based on the geographical location and climatic characteristics of some areas in Nanchang, this paper proposes 18 echo intensity indicators for lightning warning identification. Then, according to the time and occurrence of ground lightning in the lightning location data, the radar echo volume scan data corresponding to the ground lightning period in the selected cases are statistically analyzed. The effect of cloud-to-ground lightning warning and a best indicator are obtained, as shown in Table 2.
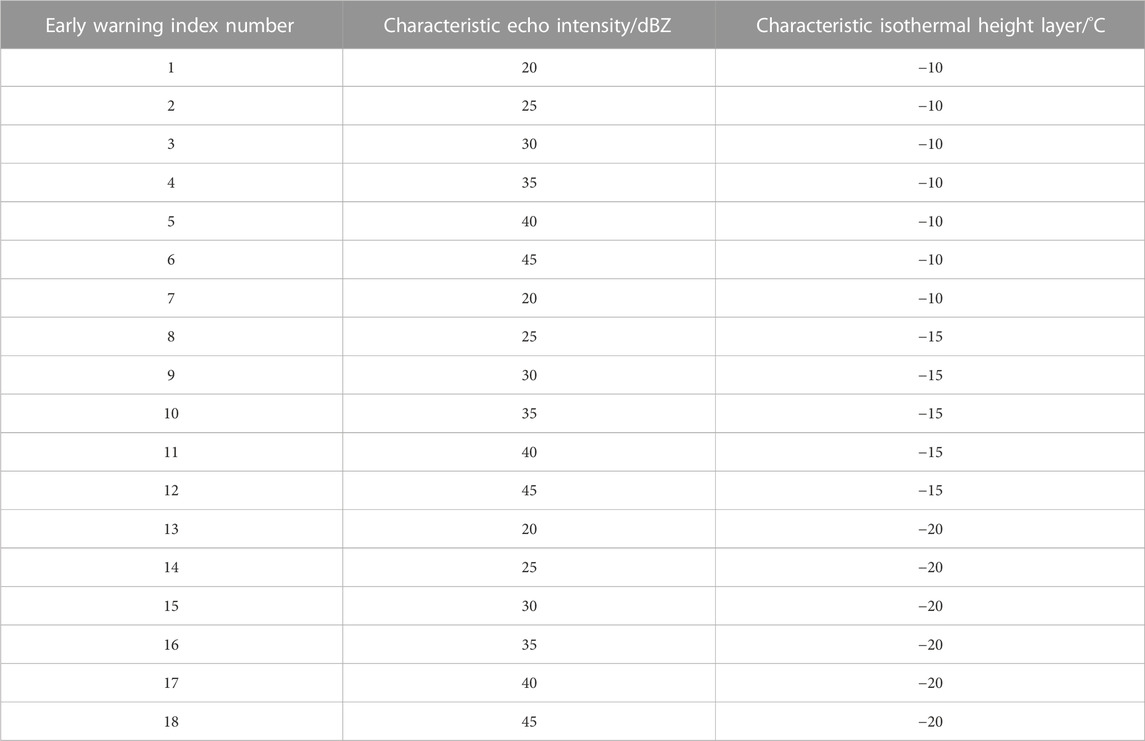
TABLE 2. Early warning index number.
Through the statistics of the top heights of 20 dBz, 25 dBz, 30 dBz, 35 dBz, 40 dBz, and 45 dBz radar echo intensities in 105 cells in the process of cell development and evolution, combined with the sounding data on each cell on the day of occurrence, the temperature height layers of −10°C, −15°C, and −20°C are comprehensively analyzed. It is calculated that the top height of 30 dBZ echo intensity in all thunderstorm cells can break through the temperature height layer of −10°C, and the proportion of thunderstorm cells whose top heights of 35 dBZ, 40 dBZ, and 45 dBZ echo intensities breaks through this height gradually decreases. Only 26% of thunderstorm cells have 45-dBZ echo intensity peak height exceeding this height.
For the non-thunderstorm cell, the proportion of the echo intensity top height of 30 dBZ and aforementioned breaking through −reak is much smaller than that of the thunderstorm cell. There are only cases of 40 dBZ and 45 dBZ echo-top heights breaking through the height of the non-thunderstorm cell. For −15°C and other temperature height layers, the results are similar to those of −10°C and other temperature height layers, but the statistical echo intensity of this layer is 5 dBZ smaller than that of the previous height layer. On this layer, the difference between thunderstorm cells and non-thunderstorm cells is larger at the top of 35 dBZ echo intensity, and the proportion of the two breaking through this height accounts for 77% and 23% of the total number of their respective cells. For −20°C and other temperature height layers, the results are also consistent with the statistics of the first two layers. The proportion of the top height breaking through the layer gradually decreases, and the proportion of the non-thunderstorm monomer breaking through the layer is always smaller than that of the thunderstorm monomer breaking through the layer.
Table 3 shows the results of the list calculation, and the actual effect statistics of different indicators in the selected 105 single cases are tested and analyzed. It can be seen that for a certain temperature height layer, POD decreases with the increase in the echo intensity threshold that breaks through the echo-top height of the height layer. At the same time, with the increase in the temperature height layer (corresponding to the decrease in the stratification temperature), the use of the top height of the same echo intensity threshold to break through the temperature height layer to warn the thunderstorm POD also gradually decreases because the lower the threshold, the easier it is to meet the requirements; the FAR value has a similar transformation trend with the POD value, but the effect is opposite, that is, the stronger the threshold, the smaller the FAR, which means that the stronger the convection, the higher the possibility of thunderstorms, and the lower the FAR.
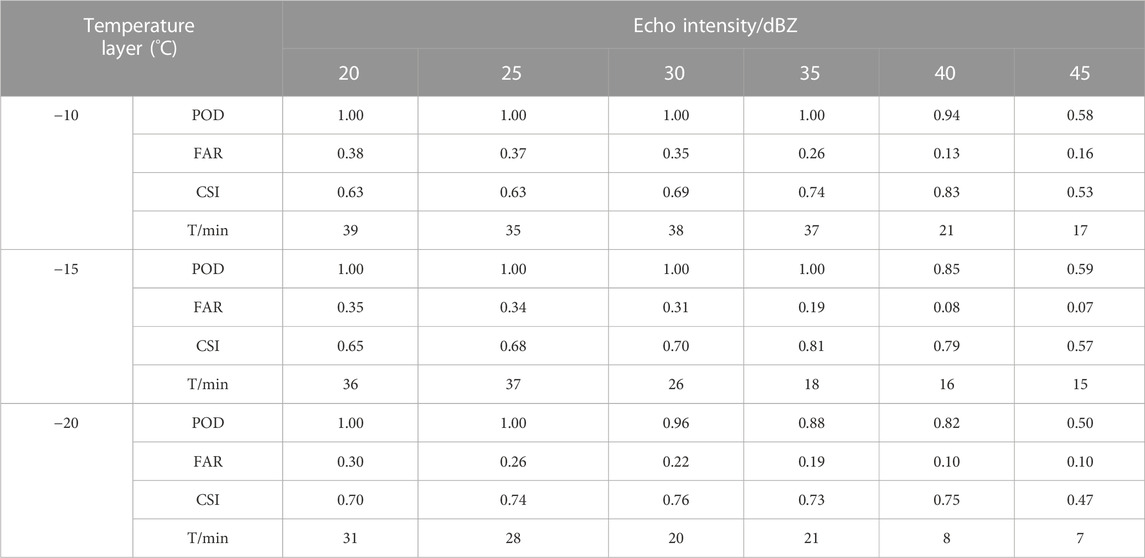
TABLE 3. Three kinds of echo intensity warning comparison.
Therefore, in order to find a most suitable early warning index, we must weigh the different performances of each index (POD, FAR, and CSI). By analyzing the aforementioned table, it can be seen that the three indexes of the 35-dBZ echo intensity top breakthrough −10°C, the 40 dBZ echo intensity top breakthrough −10°C, and the 35-dBZ echo intensity top breakthrough −15°C have the best early warning. The POD of the three indexes is 1.0, 0.96, and 1.0, respectively, and the FAR of the three indexes is not more than 0.3. The concept of early warning advance time is introduced, which is defined as the time interval between the time of the radar echo early warning index and the time of the first ground flash. The early warning time of the three indexes is 37 min, 21 min, and 18 min, respectively. Finally, considering the early warning effect of the three indicators, the two indicators with the maximum CSI of 0.83 and the 40-dBZ echo intensity top height breakthrough −echo are selected as the lightning warning indicators.
3.2 Echo-top height threshold
From the statistical results of the number of thunderstorm and non-thunderstorm cells with different echo-top heights in 105 thunderstorm cells from May to June 2022, it can be seen that the echo-top heights of all thunderstorm cells are greater than 6.0 km, specifically distributed in the range of 8.0–11.9 km, accounting for 88.0% of the total number of thunderstorms. The echo-top height of non-thunderstorm cells is mainly distributed in the range of 4.0–7.9 km, accounting for 89.18% of the total non-thunderstorm cells. The range of 6.0–7.9 km is another peak area of the proportion of non-thunderstorm cells, and there are 18 thunderstorms in this area. There are four non-thunderstorm cells in the range of 8.0–9.9 km. There is no monomer distribution below 4.0 km and above 10.0 km. It is not difficult to see that the ET values of thunderstorm cells and non-thunderstorm cells have obvious interval distribution. With 8.0 km as the threshold, the proportion of thunderstorm cells with the ET value above 8.0 km is 94.2% higher than that of total thunderstorm cells, while the proportion of non-thunderstorm cells with the ET value below 8.0 km is 89.2%. This shows that the intensity of the vertical development of the echo is closely related to the occurrence of lightning. The higher the development of the cloud top, the stronger the updraft of the thunderstorm cloud, and the greater the possibility of lightning.
In order to evaluate the early warning effect of different echo-top height warning thresholds, the POD, FAR, and CSI values under different warning threshold conditions are calculated according to the distribution table of echo-top height cells in Table 4. The calculation results are shown in Figure 4.
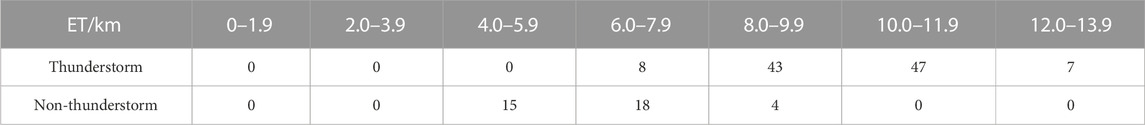
TABLE 4. Distribution table of the echo-top height cell.
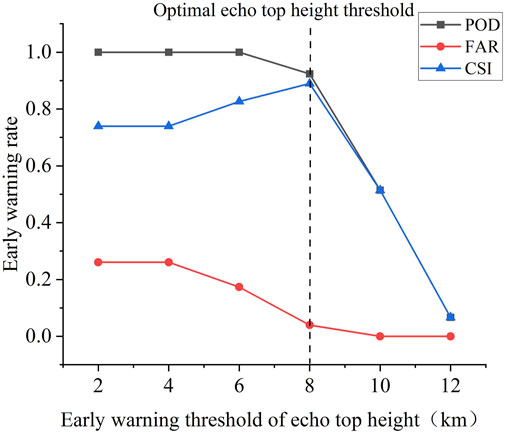
FIGURE 4. Early warning rate changes with the early warning threshold of echo-top height.
From the analysis of Figure 4, it can be seen that for Nanchang, Jiangxi, when the echo-top height threshold is set to 2 km and 4 km, the correct warning rate can reach 1, but the FAR is at a high threshold of 0.28, and the CSI value is also at a low threshold of 0.73. When the threshold of the echo-top height is increased, the POD value begins to decrease, and the FAR value gradually increases. When the ET value is 8.0 km, the POD of this index is as high as 0.90, and FAR is 0.20, which is still a large FAR. The CSI is 0.79, and the early warning advance time is 11 min, which almost reaches two individual scanning times. Therefore, the ET value of 8.0 km is a better index for discrimination.
3.3 Vertical cumulative liquid water content threshold
Yu et al. (2021) pointed out that the VIL value should not be very small or very large in the lightning warning when studying the radar threshold on the northeastern side of the plateau. If the VIL value is too small, the water vapor flux is insufficient so that the water vapor condenses into precipitation before the freezing height. It can be seen from the statistical analysis results (Table 5) that there is a good correspondence between lightning activity and VIL value. For thunderstorm cells, 66.7% of thunderstorm cells have a VIL value of 10.0–14.9 kg•m−2, 92.6% of thunderstorm cells have a VIL value of 5.2–14.9 kg•m−2, and 70.3% of non-thunderstorm cells have a VIL value below 5.2 kg•m−2. Therefore, when the VIL value is 5.2 and less than 15.0 kg•m−2, the possibility of lightning is greater.
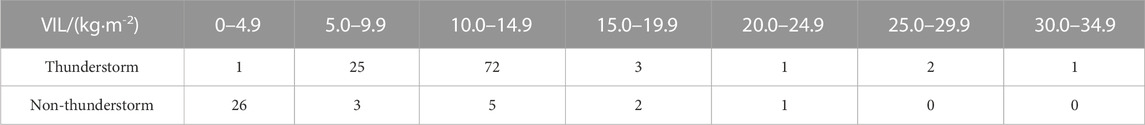
TABLE 5. Vertical cumulative liquid water content monomer distribution.
According to the distribution of VIL values of 105 convective cells, it is found that there is no obvious regularity in the changes in VIL values in the lightning activity area. The VIL values of both thunderstorm cells and non-thunderstorm cells are almost less than 15 kg•m−2, and the remaining thunderstorm cells are distributed in the range of 15–30 kg•m−2, and the non-thunderstorm cells are almost not greater than 15 kg•m−2.
The aforementioned analysis shows that VIL has little significance for the indication of the lightning warning value, and its index is not a necessary condition. It can be used as a sufficient condition to judge whether thunderstorms occur, that is, when other conditions are met, as long as the value is greater than 5.2 kg•m−2, it can be judged as thunderstorms occur, but its value should not be very large. It is found that it is advisable that the value should be less than 15 kg•m−2. Therefore, 5.2 kg•m−2 was selected as the early warning threshold for vertically accumulated liquid water content.
3.4 Atmospheric field strength threshold
Atmospheric field strength is the amplitude of the atmospheric electric field. The atmospheric electric field is the electric field existing in the atmosphere. Because the ground is negatively charged and the atmosphere contains net positive charges, there is always an electric field in the atmosphere. The direction of the atmospheric electric field points to the ground, and its intensity, the atmospheric field strength, changes with time, place, weather, and altitude. Figure 5 shows the characteristic curve of the atmospheric electric field change in Nanchang (28.69°N and 115.906°E) under thunderstorm weather on a certain day. It can be seen from the figure that the atmospheric value fluctuates greatly at 12:30–17:00 on the same day, and the amplitude is generally greater than 1.0 kV/m. Then, the lightning location system detected the occurrence of lightning.
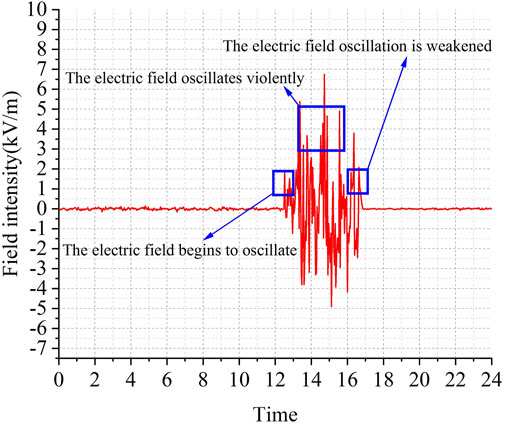
FIGURE 5. Atmospheric electric field intensity value of Nanchang on a certain day in May.
In order to evaluate the warning effect of different warning thresholds and obtain the appropriate warning threshold, this paper sets a series of warning thresholds between 0.2 kV and 4.0 kV, and counts the A (normal warning), B (missed warning), and C (false warning) events corresponding to different electric field thresholds under 105 thunderstorm cells.
In order to more intuitively reflect the accuracy of the early warning, according to the number of events in the cases of correct, false, and missing warnings under different electric field intensity thresholds, the POD, FAR, and CSI under different electric field warning thresholds are calculated and analyzed. The results are shown in Figure 6.
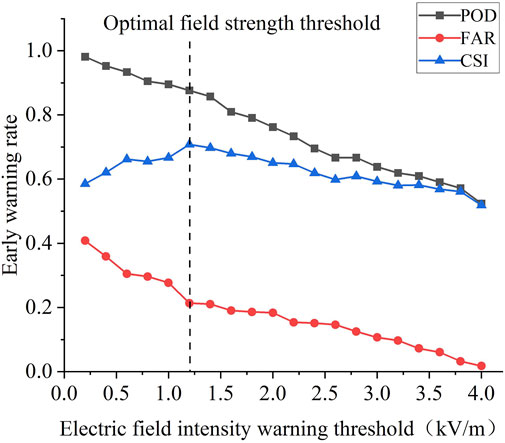
FIGURE 6. Early warning rate changes with the early warning threshold of electric field intensity.
Figure 6 shows that with the increase in the early warning threshold of electric field intensity, the values of POD, FAR, and CSI decrease to varying degrees on the whole. When the early warning threshold is set in the range of 0.2∼1.2 kV/m, the POD value decreases from 0.96 to 0.88. The analysis shows that the increase in the threshold needs to lose the early warning accuracy. The FAR value decreased from 0.41 to 0.22, but it was still a relatively large FAR. The CSI value increased from 0.58 to 0.70, and the overall result was smaller. When the warning threshold is greater than 1.2 kV/m, the decrease in the POD value increases. When the threshold is set to 1.2 kV/m, the FAR value reaches the minimum value under the adjacent threshold, and the CSI reaches the maximum value under the adjacent threshold. According to the definition of POD, FAR, and CSI, in order to select the most suitable early warning threshold of atmospheric electric field strength, it is necessary to comprehensively analyze and select the atmospheric field strength amplitude corresponding to the point with the largest POD value, the smallest FAR value, and the largest CSI value. Therefore, 1.2 kV/m is selected as the threshold of the atmospheric electric field strength in the Nanchang area. Under this threshold, the POD of thunderstorms reaches 0.88, the FAR is 0.21, and the maximum value of CSI is 0.70.
4 Multi-factor fusion lightning warning model
It can be seen from the previous section that the separate warning effect of different data shows that whether it is electric field data or radar data, the FAR obtained by taking a small threshold is quite high. Increasing the threshold will reduce the FAR, but the detection probability must be sacrificed. Different data can reflect different characteristics of thunderstorm clouds from different angles, so these data have different contributions to lightning warning, that is, they have different weight values. The optimal weight combination can be found from the quantitative values of different data to comprehensively utilize these data for early warning.
4.1 Construction of the lightning warning comprehensive threshold model
According to the theory of information entropy, the smaller the information entropy of the index, the greater the degree of change in the index value, the greater the amount of information provided, and the more obvious the role played in the evaluation system. Therefore, the information entropy under the lightning warning index can be used to objectively determine the weight (Zhang et al., 2023).
First, the four lightning warning indicators of electric field intensity, echo intensity, echo-top height, and vertically accumulated liquid water content are equivalent to positive indicators. The entropy weight method treats the positive indicators as follows:
where xab is the bth sample value of index a, which is an element in the original matrix
Furthermore, the normalized matrix
Then, the entropy weight of each lightning warning factor is calculated. First, the entropy of each lightning warning factor is calculated. The calculation formula is as follows:
Here,
Finally, the entropy weight wj of each index is calculated by entropy, and the calculation formula is as follows:
The entropy weight of the electric field intensity (
The aforementioned single-lightning factor threshold has been calculated. According to the comprehensive threshold calculation method, 105 thunderstorm cells are listed and analyzed. The threshold of the atmospheric field strength is 1.2 kV/m, the echo intensity is 40 dBZ, the echo-top height is 8km, and the vertical cumulative liquid water content is 5.2 kg·m−2. The single threshold normalized offspring is calculated into the formula, and the early warning comprehensive index threshold

TABLE 6. Comprehensive threshold index of lightning warning results.
4.2 Example verification
On 23 July 2022, a severe thunderstorm occurred in Nanchang, Jiangxi Province, accompanied by short-term precipitation and strong winds. In this process, 35 lightning return strokes, 8 positive ground flashes, 17 negative ground flashes, and more negative ground flashes were monitored within 15 km of a 10-kV distribution line of Anyi Company in the Nanchang area. The whole process lasted about 2 h, and the influence time was 16:00–18:00. According to the records of the local power grid, the thunderstorm process caused the distribution line in Nanchang to trip many times. Real-time weather radar data were retrieved; according to the data record, 16:42, in the northwest and south of this line, there is sporadic convective cloud cluster development. At 16:45, the echo intensity reached more than 40 dBZ, the echo-top height reached 6 km, and the vertical accumulated liquid water content was 4.5 kg·m−2. At 16:55, the atmospheric electric field instrument detected the fluctuation of the electric field, and the atmospheric electric field intensity reached 1.2 kV/m. The result of calculating the lightning warning comprehensive index
On 22 July 2023, a new round of strong thunderstorms occurred in Nanchang, Jiangxi Province, due to the impact of a typhoon, accompanied by precipitation and strong winds. During this process, a 10-kV distribution line within a 15 km range of Nanchang company detected a total of 158 lightning strikes, 11 positive ground flashes, and 27 negative ground flashes, with more negative ground flashes. The entire process lasted for about 4.5 h, with an impact time of 12:00 to 14:30. According to the local power grid power supply ledger records, this thunderstorm caused multiple trips on this distribution line in Nanchang city. Real-time weather radar data were retrieved, and according to data records, at 12:42, there are sporadic convective cloud clusters developing in the northwest and south of this route. At 12:45, the echo intensity was detected to be above 41.5 dBz, and the echo peak height reached 6.3 km. At this time, the vertically accumulated liquid water content was 4.6 kg/m2. At 13:05, the atmospheric electric field instrument detected fluctuations in the electric field, and the atmospheric electric field intensity reached 1.3 kV/m. The calculation of the lightning warning comprehensive index
The comparison and analysis of these two lightning events using single-factor threshold warning and the multi-factor comprehensive warning method in this article are shown in Table 7:
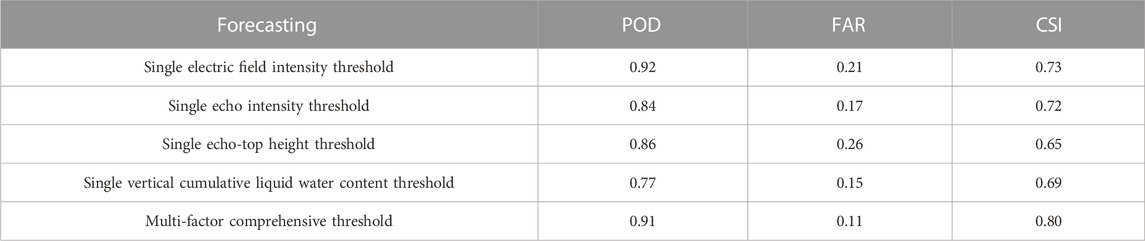
TABLE 7. Early warning results of different forecasting methods.
According to Table 7, the multi-factor comprehensive threshold method comprehensively considers the weight of four kinds of meteorological factors. Compared with the single-lightning factor threshold warning method, although the early warning accuracy is lower than the single electric field intensity threshold warning, POD can still reach 91%, and the multi-factor comprehensive threshold warning method FAR is 11%, which is 6% lower than the minimum value of FAR in single-factor warning, and CSI is 80%, which is obviously better than each single-factor threshold method.
5 Conclusion
Lightning is one of the frequent natural disasters, which seriously affects the secure and stable operation of the power system, especially the distribution network lines with weak reliability. In order to improve the power supply reliability of the distribution network, higher requirements are put forward for the accuracy of lightning warning. To this end, this paper combines the atmospheric field strength, echo intensity, echo-top height, vertical cumulative liquid water content, and other meteorological factor data under thunderstorm weather to make a list of analysis that obtains the threshold value of each factor warning, uses the entropy weight method to calculate the corresponding threshold weight, and establishes a lightning warning model with a comprehensive meteorological factor threshold. The conclusions are as follows:
(1) When the thunderstorm weather is approaching, the electric field amplitude, echo intensity, echo-top height, and vertical accumulated liquid water content will change to varying degrees, and the more severe the thunderstorm weather, the greater the change.
(2) The thresholds of four types of lightning warning factors are determined in the list, and a single factor is obtained for lightning warning. The threshold of electric field amplitude is 1.2 kV/m, the threshold of echo intensity is 40 dBZ, the threshold of echo-top height is 8 km, and the threshold of vertical accumulated liquid water content is 5.2 kg•m−2.
(3) The comprehensive threshold index of lightning warning is composed of four components: electric field intensity component, echo intensity component, echo-top height component, and vertical accumulated liquid water content component. After data analysis, the weight of the electric field intensity component is 0.4188, the weight of the echo intensity component is 0.2056, the echo-top height component is 0.2105, and the vertical accumulated liquid water content component is 0.165.
(4) The comprehensive threshold method was used to warn strong thunderstorm weather in Nanchang in July 2022. The success rate of early warning was 0.91, the FAR of early warning was 0.11, and the CSI was 0.80. When ensuring the success rate of early warning to reach more than 90%, the minimum FAR was reduced by 6% compared with the single-factor early warning method, and the maximum CSI was increased by 7%. The early warning method has been further improved.
Data availability statement
The original contributions presented in the study are included in the article/Supplementary Material; further inquiries can be directed to the corresponding author.
Author contributions
ZW put forward research ideas. ZW guided the research methods. ZP wrote the original draft and is the corresponding author. LF reviewed the paper. ZD and ZC conducted field tests. YZ edited figures and tables. XM performed the data analysis. All authors contributed to the article and approved the submitted version.
Funding
This study is funded by a key research technology project funded by State Grid Jiangxi Electric Power Company. The project name is Research and Application of Key Technologies for Lightning Protection in Distribution Networks, and the project number is 5218A022000G.
Conflict of interest
Authors ZW, LF, ZD, YZ, and XM were employed by Nanchang Electric Power Supply Company.
The authors declare that this study has received funding from the State Grid Corporation of China, Nanchang City, Jiangxi Province. Authors ZW, LF, ZD, YZ, and XM were employed by Nanchang Electric Power Supply Company. The sponsor participated in the following research: the design of the research plan, the collection and analysis of lightning data, and also participated in the writing and revision of this article.
Publisher’s note
All claims expressed in this article are solely those of the authors and do not necessarily represent those of their affiliated organizations, or those of the publisher, the editors, and the reviewers. Any product that may be evaluated in this article, or claim that may be made by its manufacturer, is not guaranteed or endorsed by the publisher.
References
Bouchard, A., Buguet, M., Chan-Hon-Tong, A., Dezert, J., and Lalande, P. (2023). Comparison of different forecasting tools for short-range lightning strike risk assessment. Nat. Hazards 115 (2), 1011–1047. doi:10.1007/s11069-022-05546-x
Dokic, T., Dehghanian, P., Chen, P. C., Kezunovic, M., Medina-Cetina, Z., Stojanovic, J., et al. (2016). “January). Risk assessment of a transmission line insulation breakdown due to lightning and severe weather,” in 2016 49th Hawaii international conference on system Sciences (HICSS) (USA: IEEE), 2488–2497. doi:10.1109/HICSS.2016.311
Du, Y., Liu, Y., Wang, X., Fang, J., Sheng, G., and Jiang, X. (2020). Predicting weather-related failure risk in distribution systems using Bayesian neural network. IEEE Trans. Smart Grid 12 (1), 350–360. doi:10.1109/TSG.2020.3019263
Ghaemi, A., Safari, A., Afsharirad, H., and Shayeghi, H. (2022). Situational awareness and deficiency warning system in a smart distribution network based on stacking ensemble learning. Appl. Soft Comput. 128, 109427. doi:10.1016/j.asoc.2022.109427
Hieu, T. T., Vinh, T. T., Duong, M. Q., et al. (2021). Analysis of protective solutions for underground cable system-application for Danang distribution grid 10th international conference on ENERGY and ENVIRONMENT (CIEM). USA, IEEE, 1–5.
Jun, X. (2017). “May). Study of distribution transmission line lightning stroke risk forecasting based on nonlinear time series analysis,” in International conference on Smart grid and electrical automation (ICSGEA) (USA: IEEE), 282–285. doi:10.1109/ICSGEA.2017.46
Leite, J. B., Mantovani, J. R. S., Dokic, T., Yan, Q., Chen, P. C., and Kezunovic, M. (2019). Resiliency assessment in distribution networks using GIS-based predictive risk analytics. IEEE Trans. Power Syst. 34 (6), 4249–4257. doi:10.1109/TPWRS.2019.2913090
Li, Y., Liu, Y., Sun, R., Guo, F., Xu, X., and Xu, H. (2023). Convective storm VIL and lightning nowcasting using satellite and weather radar measurements based on multi-task learning models. Adv. Atmos. Sci. 40, 887–899. doi:10.1007/s00376-022-2082-6
Mostajabi, A., Finney, D. L., Rubinstein, M., and Rachidi, F. (2019). Nowcasting lightning occurrence from commonly available meteorological parameters using machine learning techniques. Npj Clim. Atmos. Sci. 2 (1), 41. doi:10.1038/s41612-019-0098-0
Romps, D. M., Seeley, J. T., Vollaro, D., and Molinari, J. (2014). Projected increase in lightning strikes in the United States due to global warming. Science 346 (6211), 851–854. doi:10.1126/science.1259100
Shi, T., Hu, D., Ren, X., Huang, Z., Zhang, Y., and Yang, J. (2021). Investigation on the lightning location and warning system using artificial intelligence. J. Sensors 2021, 1–11. doi:10.1155/2021/6108223
Tong, C., Wang, J., Xu, J., Cai, Y., Xu, Y., Hua, X., and Wang, T. (2021). “A power flow transfer optimization strategy for important transmission channels based on lightning early warning,” in 2021 35th international conference on lightning protection (ICLP) and XVI international symposium on lightning protection (SIPDA) (USA: IEEE), 1, 1–7.
Wu, F., Cui, X., and Zhang, D. L. (2018). A lightning-based nowcast-warning approach for short-duration rainfall events: development and testing over Beijing during the warm seasons of 2006–2007. Atmos. Res. 205, 2–17. doi:10.1016/j.atmosres.2018.02.003
Wu, M., Yang, C., and Liu, X. (2021). Forecast of thunderstorm cloud trend based on monitoring data of thunder mobile positioning system. Mob. Inf. Syst. 2021, 1–11. doi:10.1155/2021/8062549
Xiao, M., Sun, Y., and Li, K. (2019). “Research on fault-environment association rules of distribution network based on improved Apriori algorithm,” in IOP conference series: Materials science and engineering (New York: IOP Publishing), 569. doi:10.1088/1757-899X/569/3/032079032079
Yu, H. Y., Suh, M. S., and Ryu, S. O. (2021). Improvement of thunderstorm detection method using GK2A/AMI, RADAR, lightning, and numerical model data. Korean J. Remote Sens. 37 (1), 41–55. doi:10.7780/kjrs.2021.37.1.4
Keywords: lightning warning, atmospheric field strength, echo intensity, echo-top height, vertical cumulative liquid water content, threshold, weight
Citation: Wan Z, Fu L, Pu Z, Du Z, Chen Z, Zhu Y and Ma X (2023) Optimization of the lightning warning model for distribution network lines based on multiple meteorological factor thresholds. Front. Energy Res. 11:1220867. doi: 10.3389/fenrg.2023.1220867
Received: 11 May 2023; Accepted: 28 August 2023;
Published: 18 September 2023.
Edited by:
Chenghong Gu, University of Bath, United KingdomReviewed by:
Minh Quan Duong, The University of Danang, VietnamHan Wang, Shanghai Jiao Tong University, China
Copyright © 2023 Wan, Fu, Pu, Du, Chen, Zhu and Ma. This is an open-access article distributed under the terms of the Creative Commons Attribution License (CC BY). The use, distribution or reproduction in other forums is permitted, provided the original author(s) and the copyright owner(s) are credited and that the original publication in this journal is cited, in accordance with accepted academic practice. No use, distribution or reproduction is permitted which does not comply with these terms.
*Correspondence: Ziheng Pu, cHpoZHFAY3RndS5lZHUuY24=