 Peng Yuan1
 Shuangyin Chen
- 1Central China Branch of State Grid Corporation of China, Wuhan, China
- 2School of Materials and Chemical Engineering, Hezhou University, Hezhou, China
Carbon neutrality is transitioning from a global consensus to global action. The power industry must urgently address carbon reduction and establish an effective evaluation system. However, current standard systems and literature studies both domestically and internationally reveal significant issues with the scientific, systematic, and operational aspects of carbon performance index systems. Therefore, this paper proposes the development of a carbon performance evaluation system for electric power enterprises, comprising of two subsystems: carbon management and carbon reduction. The evaluation system takes into full consideration the transmission and distribution characteristics of power grid companies, and conducts an empirical analysis on a regional power grid in China, including four provincial power grid companies A, B, C, and D. The findings indicate that the regional Power Grid has been committed to low-carbon initiatives for an extended period of time, with a greater emphasis on carbon reduction performance rather than carbon management performance between 2012 and 2021. To further enhance the potential for carbon reduction, it is imperative to prioritize carbon management in subsequent phases.
1 Introduction
In the past few decades, China’s economy has experienced rapid development. However, this growth has come at a cost to ecological resources due to high levels of carbon emissions from energy consumption. Additionally, the crude methods used for economic upgrading have resulted in incalculable losses and a series of environmental problems. On 22 September 2020, President Xi pledged to peak carbon emissions by 2030 and achieve carbon neutrality by 2060 at the 75th session of the United Nations General Assembly (Wu and Niu, 2022). Since then, China’s carbon emission reduction movement has been elevated to the level of national policy. However, according to statistics from the National Energy Administration, 45% of China’s total CO2 emissions in 2021 were generated by the power sector (BP Statistical, 2020). Therefore, effectively controlling and reducing carbon emissions from this sector is crucial for achieving national goals related to carbon peaking and neutrality.
Carbon reduction in the power industry cannot be achieved without an effective carbon performance evaluation system. As global low-carbon development is still in its infancy, a standardized system for evaluating carbon reduction performance in the power industry has yet to be established (Liu et al., 2020). The investigation revealed a dearth of literatureon carbon performance evaluation systems. Foreign research in this area began earlier, with early studies focusing on the classification of carbon performance impacts, carbon measurement techniques, and indicators (Myung et al., 2019; Zhou et al., 2020). Their focus lies in analyzing the economic aspects of enterprise carbon management, with little regard for environmental and social factors. Subsequent research on carbon performance has evolved from a single indicator to a specialized multi-indicator approach (Rietbergen et al., 2017; Luo et al., 2018; Padilla-Rivera et al., 2018), utilizing balanced scorecards, fuzzy analytical hierarchical processes, and data envelopment analysis to effectively evaluate enterprise carbon performance. However, these studies primarily focus on evaluating carbon performance at the operational level of enterprises while neglecting the evaluation of carbon performance at the process level, indicating room for improvement. The research on carbon performance in domestic enterprises started relatively late. In the early stages, carbon performance was only included as a category of indicators in the evaluation system for enterprise financial performance (Tan et al., 2007; Fan, 2018), and the results lacked relevance. Later, with the increasing importance of low-carbon development, studies on carbon performance evaluation began to be conducted for highly polluting industries such as thermal power, iron and steel, and cement (Yun et al., 2002; Zhang and Zhang, 2016; Alizadeh et al., 2020). However, due to their inherent industrial characteristics, they are closely linked to industry emission reduction targets, requirements and policies. These evaluation systems lack systematicity and operability, resulting in insignificant reference benchmarks. Therefore, to achieve China’s dual carbon goals and promote low-carbon development in the power industry, it is necessary to explore a low-carbon path with Chinese characteristics for the power industry by combining the actual situation of electric power enterprises and considering both process and results.
Based on the investigation of carbon performance evaluation standards, techniques, and literature both domestically and internationally, this study aims to construct a comprehensive evaluation system for the carbon performance of electric power enterprises by integrating qualitative and quantitative analysis methods in response to the inadequacies of existing carbon performance index systems. Considering the carbon emission processes and results of electric power enterprises, we have developed a comprehensive carbon management evaluation system and carbon reduction evaluation systems to provide theoretical support for electric power enterprises’ efforts in reducing their carbon footprint. Finally, we conducted a case study on a regional power grid to test and evaluate its overall carbon performance, thereby verifying the operability and scientific validity of our index system.
2 Materials and methods
2.1 Principles of selecting indicators
The proposed carbon reduction evaluation system for electric power enterprises not only adheres to the fundamental principles of scientificity, operability, foresight, systematicity, universality, and simplicity (Nakthong and Kubaha, 2019; Aghdam et al., 2020), but also integrates carbon management and reduction measures. The system aims to achieve two core objectives. Firstly, by establishing a carbon management evaluation model, it seeks to enhance the foundation of carbon management work and improve enterprise capability in this area. Secondly, by creating a carbon reduction evaluation model, it aims to guide enterprises in effectively reducing their carbon emissions while optimizing resource and energy usage, lowering costs associated with such reductions and improving overall efficiency.
2.2 Determination of key performance indicators (KPIs)
The comprehensive evaluation system consists of a carbon management subsystem and a carbon reduction subsystem, where the former serves as the process indicator while the latter represents the outcome. Regarding the carbon management subsystem, second-level indicators pertain to PDCA management processes that encompass four phases: Plan, Do, Check, and Action. The “Plan” phase initiates the cycle by primarily focusing on goal determination and implementation plan design, as reflected in target setting and management policy formulation. Subsequently, the “Do” phase involves executing the plan into action, while the “Check” phase entails inspecting and analyzing differences between previous stages to identify reasons and corresponding solutions. The final phase is “Action”, which summarizes successful experiences and optimizes shortcomings. According to ISO-50001, the entire subsystem is optimized and divided into six parts: Carbon Management System, Leadership, Planning, Support and Operation, Performance Evaluation, and Improvement. The optimized cycle provides more detailed insights into overall strategic planning and enterprise routes. Through this continuous cycle of improvement, enterprises can identify deficiencies in their carbon management work. Therefore, it is an effective approach to enhance the quality of management activities and guide enterprises towards a continuous improvement in their management practices.
For the subsystem of carbon reduction, after conducting a thorough review of relevant literature at both domestic and international levels, it has been determined that previous studies commonly utilize effectiveness indicators, efficiency indicators, and economic indicators as the primary types of metrics for evaluating carbon reduction performance (Antunes et al., 2014; Yang et al., 2017; Yong et al., 2019) (Table 1). Based on these indicators, the specificity of grid companies’ transmission and distribution processes is being considered. These indicators are further subdivided according to specific structures and technologies in order to more clearly and explicitly demonstrate the low-carbon benefits of each process within the grid enterprise, providing a reference point and foundation for future development priorities. Thus, This study aims to develop a comprehensive carbon reduction evaluation model based on four types of indicators: Sources, Processes, Outcomes, and Economics.
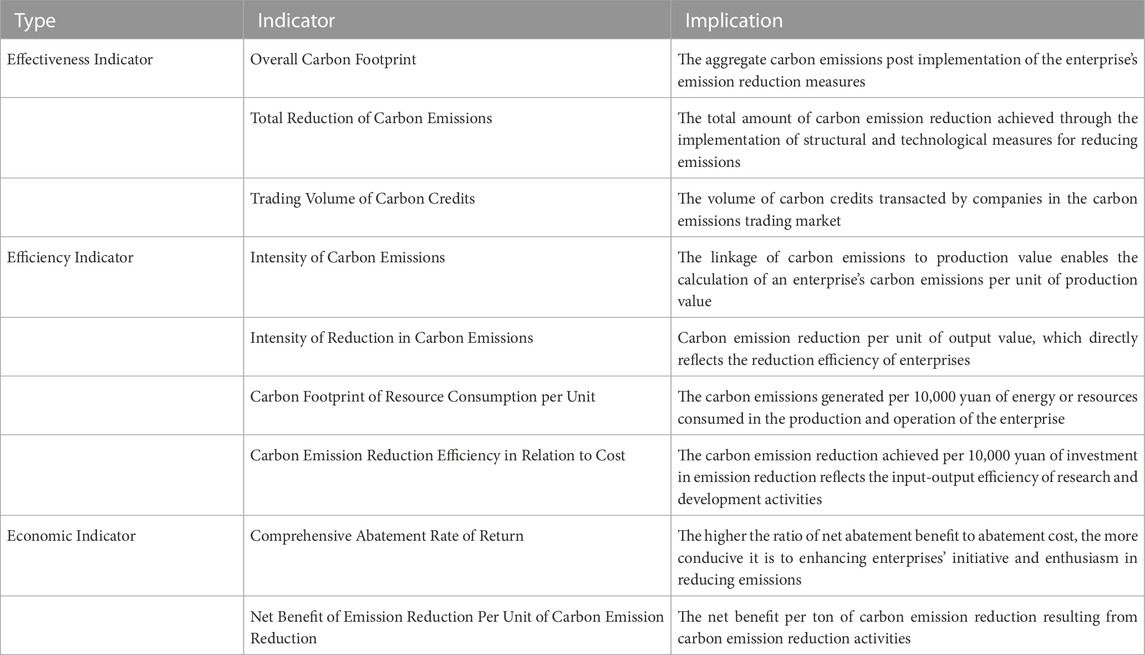
TABLE 1. Common carbon reduction evaluation indicators.
2.3 Reformulate the carbon evaluation index system
The bottom-up approach is employed to categorize and model the underlying factors that impact the carbon management and reduction performance of electric power enterprises. Through a comprehensive review of existing standards, technologies, and literature, key influencing factors were identified and utilized to construct an evaluation index system for carbon emissions in electric power enterprises. The indexes were deliberated, adapted, and optimized by means of self-testing and expert testing methods through the process of deleting, modifying, merging, and adding. Finally, the carbon evaluation index system was determined.
2.3.1 Improved carbon management evaluation model
The carbon management evaluation model is developed based on the maturity model, which draws upon previous studies (Bai et al., 2018; Standardization I O F, 2018; Coban et al., 2020). As illustrated in Figure 1, The structure of a maturity model, resembling that of a pyramid, effectively captures an enterprise’s performance and overall management status. However, with the continuous implementation of low-carbon policies in China, carbon management practices require rapid upgrading. A maturity path alone is insufficient for one company to use as reference. A continuous and fine-grained carbon management evaluation model is necessary to guide all carbon management processes.
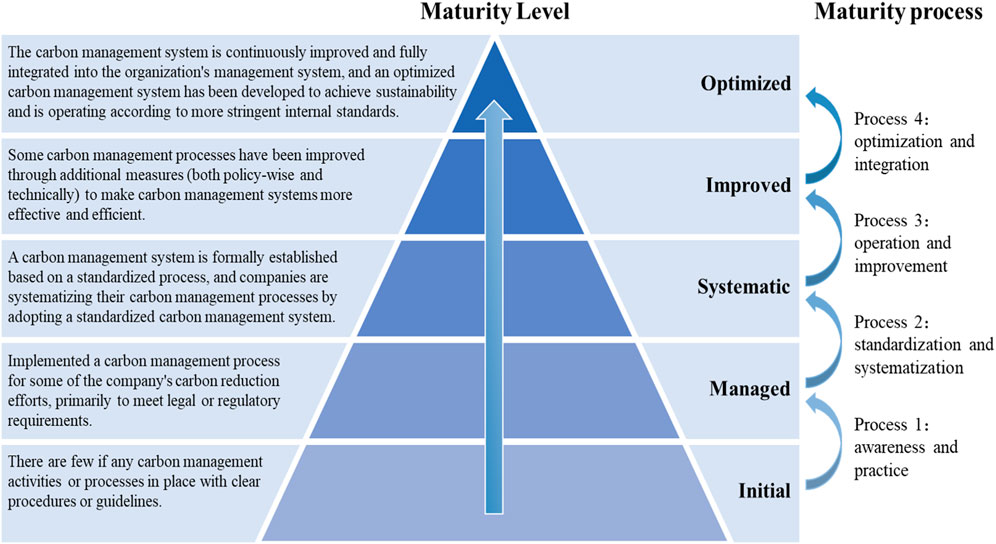
FIGURE 1. Carbon management maturity level and maturity stage.
The research team utilizes the ISO-50001 standard and PDCA management process to establish a maturity-based carbon management evaluation system, which takes into account the actual circumstances of power grid enterprises (Mcgrath and Romeri, 1994). The defined model of maturity levels represents a comprehensive understanding of China’s power grid enterprises’ carbon management systems and their level of maturity. Simultaneously, by integrating the successful factors recognized in other management maturity models with the specific characteristics of power enterprises, we establish carbon management evaluation indicators for “supply side”, “grid side” and “consumption side” management mechanisms and carbon reduction measures in both planning and operational implementation. Moreover, an intermediate level benchmark has been established with regards to the requirements of the energy management system and regulations related to GHG emissions.
The entire subsystem is categorized into five levels: initial, managed, systematic, improved, and optimized. Upon acquiring the definitions of each level of carbon management maturity for electric power enterprises, the process stages of evolving from lower to higher maturity levels are clarified and divided into four stages: awareness and practice; standardization and systematization; operation and improvement; optimization and integration. Furthermore, we have developed a more detailed model for carbon management maturity assessment, which includes six second-level indicators: Carbon Management System, Leadership, Planning, Support and Operation, Performance Evaluation and Improvement. Each of these indicators is further broken down into 24 third-level indicators (as shown in Table 2), allowing us to determine the level of maturity for each one.
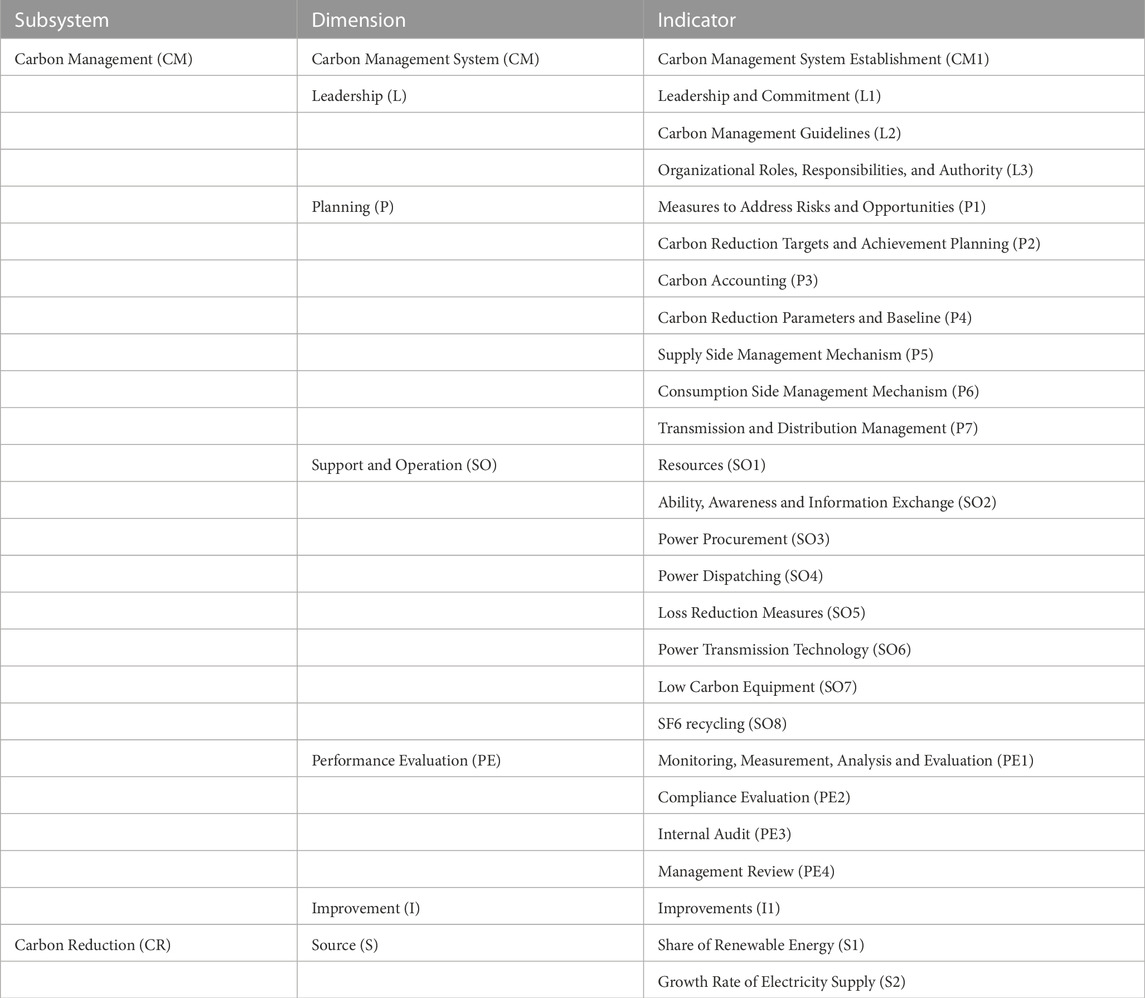
TABLE 2. Improved carbon evaluation index system.
2.3.2 Improved carbon reduction evaluation model
Considering the unique nature of power grid enterprises’ transmission and distribution processes, which primarily involve transporting power resources, specific indicators have been selected to comprehensively evaluate their carbon reduction performance based on corresponding structures and technologies. This will provide a clearer understanding of their low-carbon benefits and serve as a reference for future development priorities.
Through research on emission reduction technology in the power grid and combined with a carbon management evaluation system, we propose to establish a four-dimensional carbon reduction evaluation system tailored for power grid enterprises, covering sources, processes, results, and economy. The final index system is presented in Table 2.
(1) Resource: These are the carbon resource inputs and outputs in the transmission and distribution process of the power grid, including the proportion of renewable energy, growth rate of electricity supply, regional net inflow power ratio, etc.
(2) Process: These are the transmission and distribution processes with low carbon emissions, which are based on emission reduction planning and incorporate low carbon technologies and equipment, such as comprehensive line loss rates, SF6 recycling levels, etc.
(3) Result: These are the results of the implementation of emission reduction and management improvement, such as carbon emission growth rate, carbon emission factors, etc.
(4) Economy: These pertain to the economic benefits resulting from emission reduction efforts, including increases in infrastructure investment rates, electricity sales revenue growth rates, reductions in total waste costs, etc.
2.4 Determination of weights
The weights assigned to each indicator reflect their relative importance. A higher weight indicates a greater significance of the corresponding indicator. Various methods can be employed to determine these weights, which are broadly classified into three categories: subjective weighting, objective weighting, and combination weighting (Bakar et al., 2015). Subjective weighting method is a technique for determining attribute weights based on the decision-maker’s subjective assessment of each index’s importance. The original data is derived from the subjective judgment of experts or decision-makers, which has the advantage of reflecting their working experience and preference for indicators, as well as certain inheritability in indicator weighting. However, its disadvantage lies in its subjective arbitrariness, which can be easily influenced by cognitive culture and decision-maker’s level of experience. The objective weighting method is based on objective information, such as the decision matrix. The weight is determined by the correlation between attribute values or index values, or the degree of variation of attribute values. It does not rely on subjective human judgment. The advantages of this method lie in its solid mathematical foundation, objectivity, clear distinction between evaluation objects and indices, as well as transparency. However, the disadvantage is that the weight of indices may vary at different stages and lacks continuity. Additionally, relying solely on mathematical theories can complicate calculations while ignoring decision-makers’ subjective opinions. The combined weighting method, which integrates subjective and objective weighting methods, not only objectively reflects the importance of various indicators but also takes into account decision makers’ subjective preferences. However, its general algorithm’s complexity may hinder its effectiveness in practical applications, and there are still limited instances of its implementation.
The carbon performance evaluation system in this study comprises two modules: the carbon management performance evaluation system and the carbon reduction performance evaluation system. The weights of these modules are primarily determined by their relative importance, and can be subjectively assigned by internal leaders and experts based on the enterprise’s current stage of low-carbon development.
Regarding the specific indicators of these two models, it is imperative to maintain time continuity in order to effectively evaluate the performance of an enterprise’s carbon management system. Frequent adjustments to the evaluation method are not recommended due to potential changes in weights determined by objective assignment methods based on indicator values. This can result in incomparable evaluation results between different years. Therefore, the Delphi method has been selected. For the sake of convenience, qualitative indicators have been established in the carbon management evaluation system. The independent and repeated subjective judgments of over 50 experts were obtained to ensure relatively objective opinions. The vast majority agreed that all tasks related to carbon management performance are equally important, thus justifying the current practice of assigning equal weight to all indicators. However, enterprises may adjust the weights based on their overall level of carbon management in order to reflect the varying importance of different aspects of carbon management.
Considering that the assessment of carbon reduction performance is closely linked to the development direction of government and enterprise concerns, it is essential for the evaluative work to be aligned with these priorities in order to facilitate adjustments and updates based on actual enterprise conditions, thereby enhancing the effectiveness of carbon reduction efforts within enterprises (Jenatabadi, 2015). The subjective weighting method may affect the importance of each index in the carbon reduction performance index system, which encompasses carbon resource, emissions, and economic dimensions. Therefore, we have opted for the entropy-weight method and established quantitative indicators corresponding to the evaluation system for carbon reduction. For a set of evaluation data consisting of k indicators over an evaluation period of n years, the entropy method requires initial classification into positive and negative indicators. Subsequently, each datum Xij in the evaluation matrix is standardized using deviation standardization (Eq. 1). The weight Pij of each datum, which attributes to its indicator, is calculated by Eq. 2. Subsequently, the entropy value of each datum can be obtained using Eq. 3. Finally, the weight of each indicator can be determined through Eq. 4.
Yij: The outcome of the initial data normalization; Pij: The i sample’s proportion in the index of item j; Ej: The entropy of item j; Wj: The weight of item j.
In addition, this study assumes that the weights assigned to the carbon management performance subsystem and carbon reduction performance subsystem are denoted as CM and CE respectively (CM + CE = 1). Furthermore, each indicator of the carbon management performance evaluation module is weighted as Cm (ΣCm = CM), while each indicator of the carbon reduction performance evaluation module is weighted as Ce (ΣCe = CE). The weights of the two subsystems are determined using the Delphi method. The number of carbon management indicators exceeds that of carbon reduction. To minimize the impact of carbon management indicators on the overall evaluation system, it is recommended to assign a moderate weight to CM. Therefore, taking into full consideration the opinions of experts, the weights assigned to carbon management system performance and carbon reduction performance in this case are set to 0.36 and 0.64.
3 Results and discussion
Currently, low-carbon development in China is still in its infancy, and it remains challenging to gather carbon emission information and data from various enterprises within the power industry. Therefore, this paper selects a regional power grid, including the four provincial power grid enterprises of A, B, C, and D, as the research subject to conduct an evaluation of carbon reduction performance for power enterprises.
3.1 Data source
The electricity and loss data cited were primarily acquired from the China Electricity Statistical Yearbook (2012–2021) and the Central China Power Grid Comprehensive Statistical Compendium (2012–2021). The carbon management, SF6 emission and economic data were obtained through field investigation to the four provincial power grid enterprises. Additionally, publicly released research results and official departmental websites provide access to a wealth of information and reports. A detailed list of available data can be found in Table 3 and Table 4.
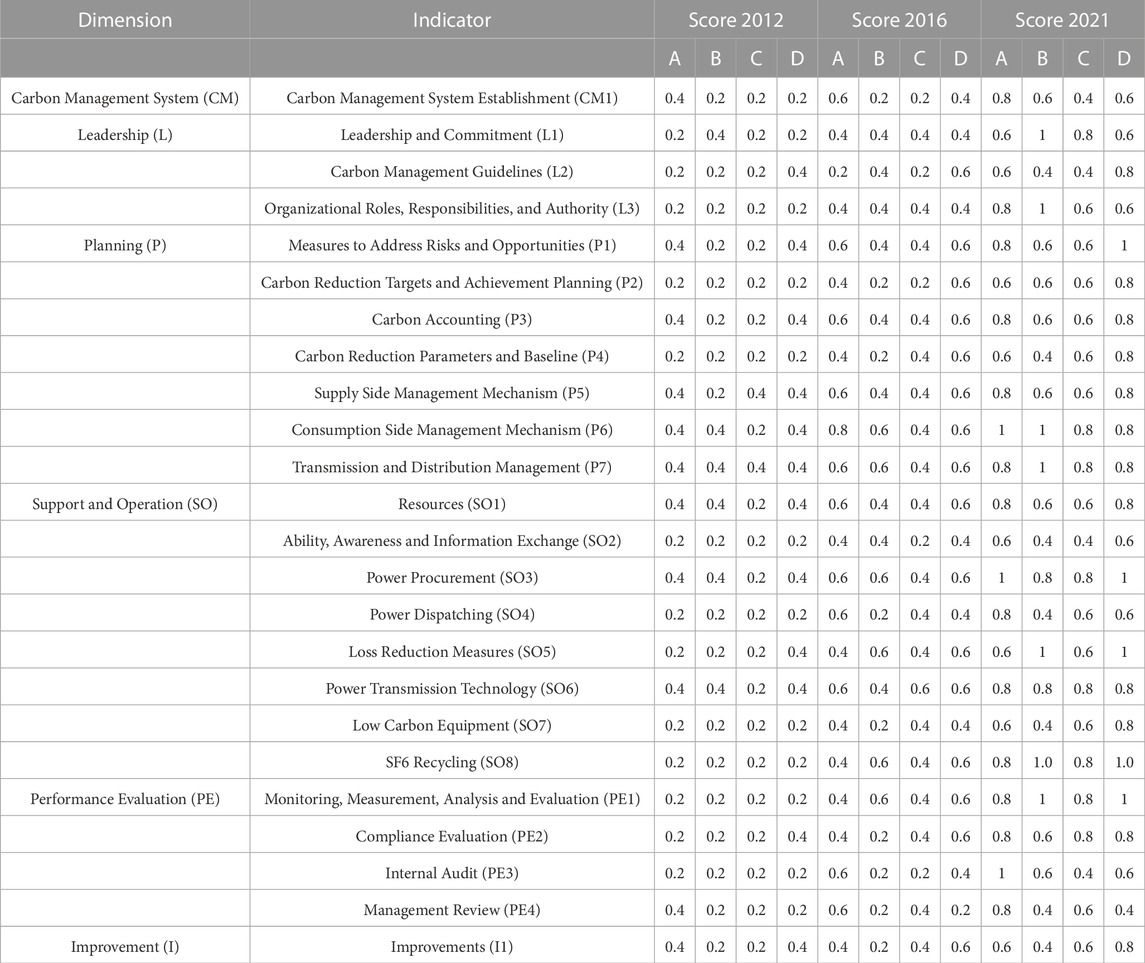
TABLE 3. The comprehensive inventory of carbon management.
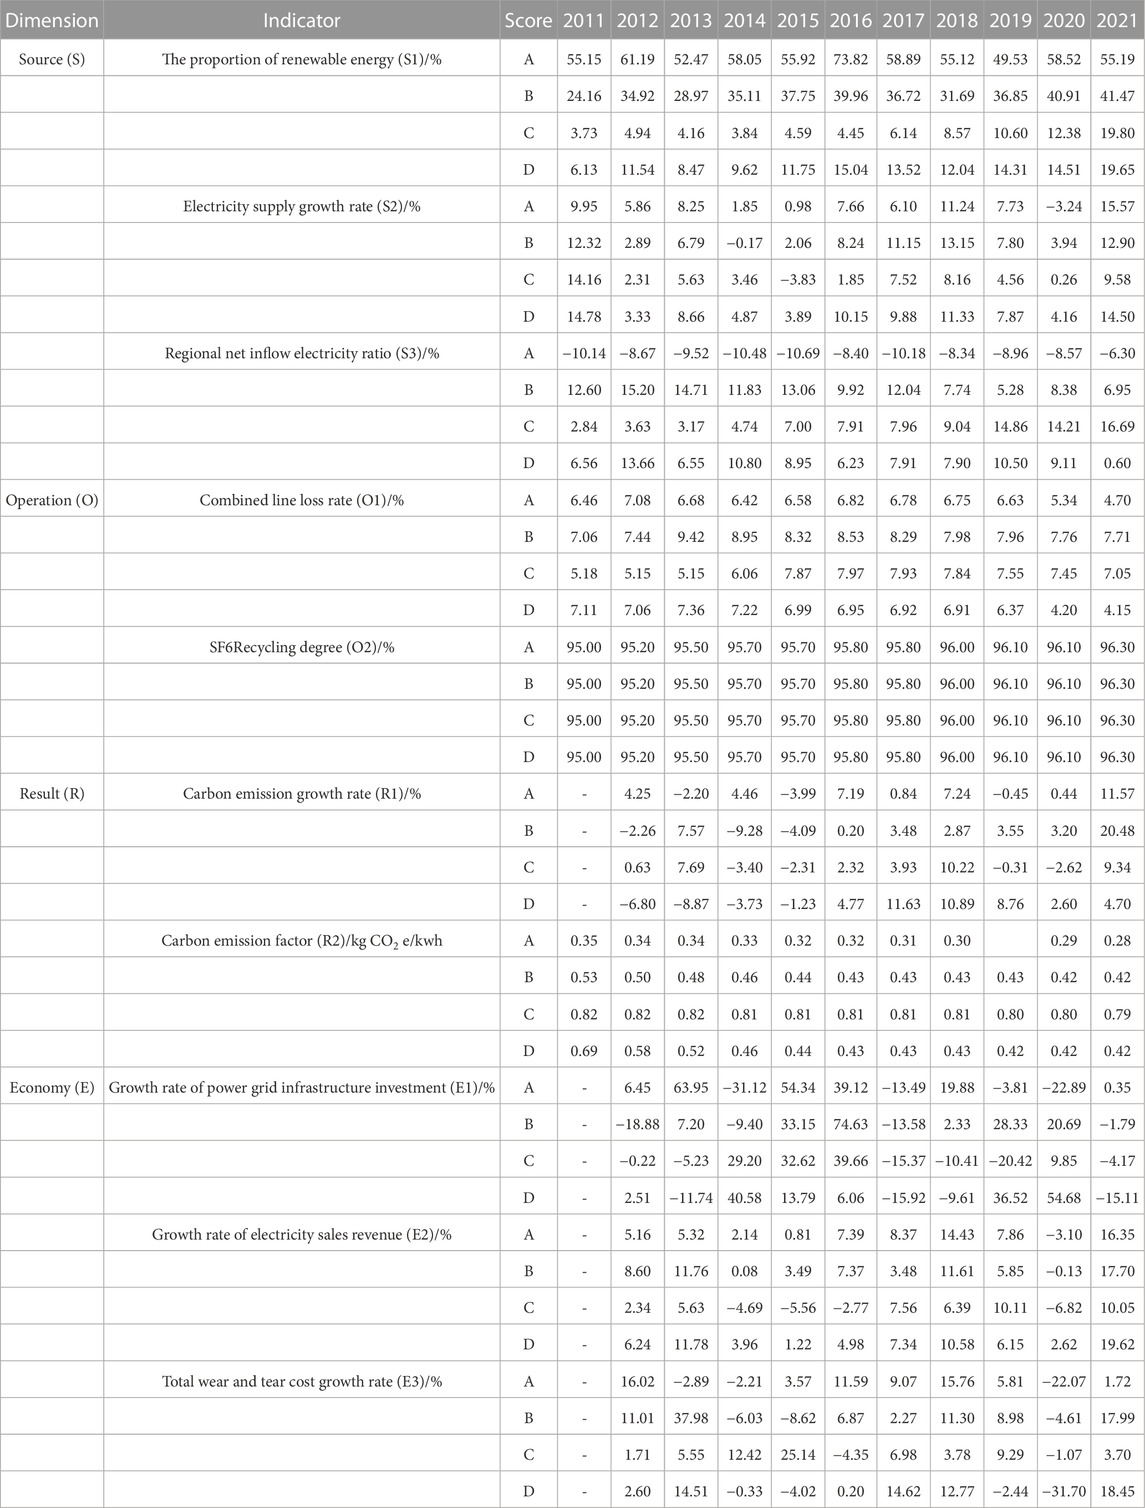
TABLE 4. The comprehensive inventory of carbon reduction.
3.2 Data analysis and findings
In order to enhance the operability and universality of the carbon evaluation system’s performance, the following assumptions have been formulated after consultations with managers and experts from domestic power grid enterprises. It is assumed that at this stage of evaluating carbon management performance, all indicators carry equal weight and are assigned an average score ranging from 0 to 1 across the five levels. The higher the maturity level of a specific indicator, the greater its corresponding parameter value. The results of carbon management performance for the four provinces are presented in Figure 2.
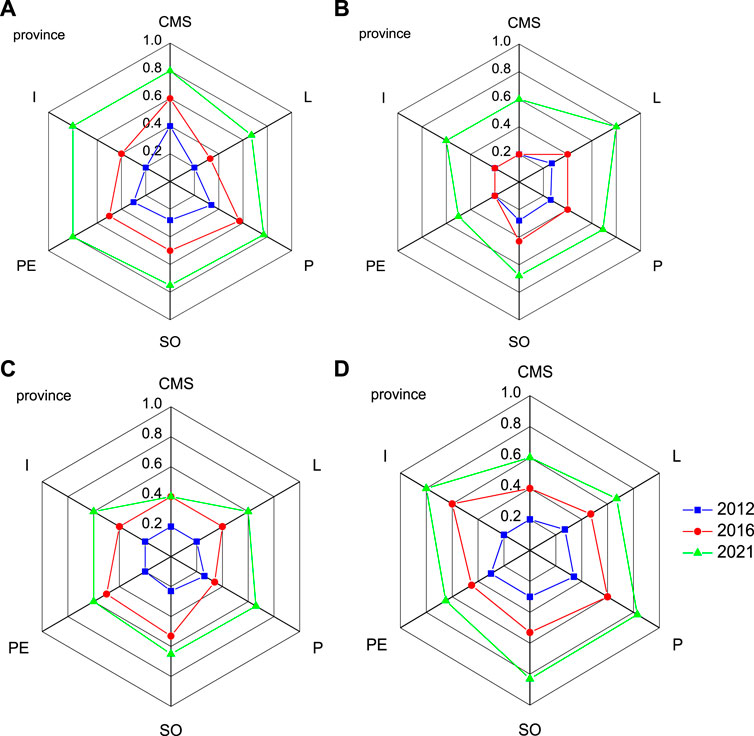
FIGURE 2. A province means the carbon management radar chart of (A) province in 2012, 2016, 2021. The same goes for (B–D) province.
Meanwhile, we computed their entropy weights utilizing the previously mentioned algorithm, and the outcomes of carbon emission reduction performance are illustrated in Figure 3A.
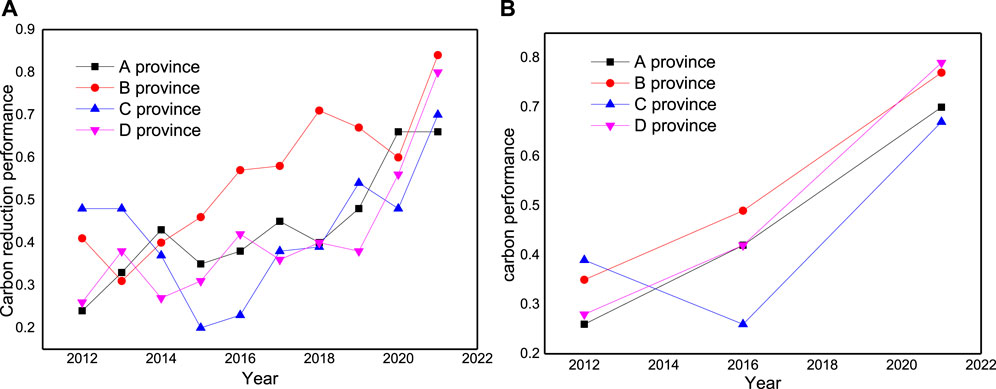
FIGURE 3. The carbon reduction (A) and conprehensive (B) performance.
4 Discussion
We employ the comparative analysis method to conduct a longitudinal and horizontal comparison of the carbon performance among four provincial power grid companies, and subsequently analyze their development trends.
As depicted in Figure 2, the carbon management performance of the four provinces within the region has exhibited varying degrees of improvement over the past decade. Notably, Province A has demonstrated the most comprehensive development, with all secondary indices except for leadership achieving a level of enhancement. With the exception of leadership, all other five secondary indices have achieved a level of improvement. The province of D ranked second, Three secondary indicators, namely, Planning (P), Support and Operation (SO), and Improvement (I), have achieved the level of improvement. Therefore, the focus should shift towards enhancing Carbon Management System (CM), Leadership (L) and Performance Evaluation (PE); However, the carbon management levels of provinces B and C are relatively low, indicating a need for continuous improvement in carbon management indicators during later stages.
As depicted in Figure 3A, the carbon emission reduction performance of the four provinces in the region has exhibited a gradual upward trend over the past decade, with an accelerating development momentum. In terms of carbon emission reduction, it is evident that D province has achieved the most significant results, with a gradual increase from 0.26 in 2012 to 0.80 in 2021, exhibiting an annual average growth rate of 23.08%. Following closely behind is A province, which increased from 0.24 in 2012–0.66 in 2021 at an average annual growth rate of 19.44%. B and C provinces followed suit with rates of only 11.65%–5.09%, respectively.
Furthermore, a comprehensive evaluation of carbon reduction performance was conducted based on the carbon management and emission reduction results of each province and city (see Figure 3B). With the enhancement of carbon management and reduction capabilities, the comprehensive carbon reduction performance indicators of all four provinces have improved, with Province D and Province B showing more prominent progress as depicted in Figure 3B. By 2021, the comprehensive performance indicators for both provinces have reached an above-medium level of 0.79–0.77 respectively. Furthermore, analysis of their growth trends indicates that the four provinces exhibit stronger momentum in the second 5-year period.
5 Suggestions
In light of the dual-carbon objective and enterprise carbon reduction performance evaluation results, power grid enterprises should focus on the following aspects to meet the requirements of green and low-carbon development:
First, to achieve high-quality development through multiple integration, it is necessary to adhere to both policy and market efforts. This can be done by promoting the participation of renewable energy in the electricity market, creating a green electricity trading mechanism and green electricity points system, as well as cultivating and meeting the green electricity carbon reduction needs of various users.
Secondly, we must expedite the transformation of our energy supply side by constructing a diversified clean energy supply system, deepening partnerships with power supply enterprises, accelerating the flexible conversion of coal-fired power plants, promoting the clean and efficient utilization of coal resources, optimizing our power structure, advancing the coordinated development between coal-fired power and new energies, and leading both upstream and downstream sectors in achieving low-carbon development together.
Thirdly, we must overcome low-carbon barriers through technological innovation. While further promoting the application of low-carbon technologies across all sectors, we will prioritize innovation-driven development and focus on meeting major national strategic needs. We aim to enhance our scientific and technological innovation system by jointly establishing an energy research and development innovation platform, improving the overall industry’s capacity for innovation, and strengthening the transformation and application of scientific achievements.
Fourthly, we must tailor our approach to local conditions in order to enhance quality and efficiency. This involves developing carbon reduction plans that are tailored to the specific circumstances of each province, leveraging the power grid optimization resource allocation platform to its fullest potential, and promoting large-scale grid integration, extensive allocation, and high levels of new energy consumption.
Fifthly, we will persist in enhancing the overall energy efficiency across all sectors. By leveraging the unique features of power grids and various industries, we will pursue energy conservation from multiple angles such as equipment optimization, system streamlining, and management refinement. We aim to develop tailored plans for different industries while simultaneously constructing enterprise-level energy management platforms and promoting comprehensive energy services cooperation.
Sixthly, it is imperative to enhance the internal communication of power grid enterprises. While continuously refining the system, intensify the exchange and sharing of internal development experience among power grid enterprises, stay abreast of industry trends, regularly release work reports, solicit rationalization proposals, and provide reference guidance for subsequent emission reduction efforts within the enterprise.
6 Conclusion
This paper focuses on the evaluation system of carbon performance for electric power enterprises in a regional power grid, which accurately reflects the actual situation and development of carbon management work across all provinces in the region over the past decade.
The carbon management subsystem has witnessed varying degrees of improvement in the four provinces within the region over the past decade. Province A boasts the most comprehensive development, followed by D province, and then B and C provinces.
The carbon reduction subsystem exhibits a gradual upward trend in the performance level of carbon emission reduction across the four provinces. Province D exhibited the most rapid growth, with an average annual growth rate of 23.08% over the course of a decade, followed by A province (19.44%), B province (11.65%), and C province (5.09%).
Furthermore, in order to conduct a comprehensive evaluation of carbon reduction performance, the comprehensive indicators for the four provinces have been enhanced. Notably, Province D and Province B have shown more significant improvements. As of 2021, their respective comprehensive performance indicators have reached above-medium levels at 0.79 and 0.77 respectively, followed by A province and C province.
Data availability statement
The original contributions presented in the study are included in the article/supplementary material, further inquiries can be directed to the corresponding author.
Author contributions
Conceptualization, PY, YZ, and SC; methodology, PY; formal analysis, PY; investigation, SC; resources, YZ; data curation, PY, and FL; writing—original draft preparation, SC; writing—review and editing, SC; project administration, PY; funding acquisition, YZ and FL. All authors contributed to the article and approved the submitted version.
Funding
This research was funded by the State Grid Corporation Central China Division 2022 Management Consulting Project, Project No. SGTYHT/21-WT-225.
Conflict of interest
Authors PY, YZ, and FL were employed by the company CentralChina Branch of State Grid Corporation of China.
The remaining author declares that the research was conducted in the absence of any commercial or financial relationships that could be construed as a potential conflict of interest.
The authors declare that this study received funding from the State Grid Corporation Central China Division. The funder had the following involvement in the study, including conceptualization, methodology, investigation, resources, data curation, project administration and funding acquisition.
Publisher’s note
All claims expressed in this article are solely those of the authors and do not necessarily represent those of their affiliated organizations, or those of the publisher, the editors and the reviewers. Any product that may be evaluated in this article, or claim that may be made by its manufacturer, is not guaranteed or endorsed by the publisher.
References
Aghdam, F. H., Kalantari, N. T., and Ravadanegh, S. N. (2020). Reconfiguration-based hierarchical energy management in multimicrogrid systems considering power losses, reliability index, and voltage enhancement[J]. Turkish J. Electr. Eng. Comput. Sci. 28 (5), 2433–2447.
Alizadeh, R., Beiragh, R. G., Soltanisehat, L., Soltanzadeh, E., and Lund, P. D. (2020). Performance evaluation of complex electricity generation systems: A dynamic network-based data envelopment analysis approach. Energy Econ. 91, 104894. doi:10.1016/j.eneco.2020.104894
Antunes, P., Carreira, P., and Da Silva, M. M. (2014). Towards an energy management maturity model. Energy policy 73, 803–814. doi:10.1016/j.enpol.2014.06.011
Bai, L., Wang, H., Huang, N., Du, Q., and Huang, Y. (2018). An environmental management maturity model of construction programs using the AHP-entropy approach. Int. J. Environ. Res. public health 15 (7), 1317. doi:10.3390/ijerph15071317
Bakar, N. N. A., Hassan, M. Y., Abdullah, H., Rahman, H. A., and Hussin, F. (2015). Energy efficiency index as an indicator for measuring building energy performance: A review. Renew. Sustain. Energy Rev. 44, 1–11. doi:10.1016/j.rser.2014.12.018
BP Statistical (2020). Review of world energy 2020[EB/OL]. Available at: https://www.bp.com/content/dam/bp/business-sites/en/global/corporate/pdfs/energy-econo-mics/statistical-review/bp-stats-review-2020-full-report.pdf.
Coban, V., Onar, S. C., and Oztaysi, B. (2020). Energy management maturity model based on fuzzy probabilistic linguistic term sets[J]. J. Multiple-Valued Log. Soft Comput. 35.
Fan, C. (2018). Research on evaluation of low-carbon performance of listed thermal power generation enterprises based on DPSIR model[D]. Nanchang: East China Jiaotong University. (in chinese).
Jenatabadi, H. S. (2015). An overview of organizational performance index: Definitions and measurements[J]. Available at: https://ssrn.com/abstract=2599439.
Liu, J., Liu, W., and Jin, L. (2020). “A performance evaluation framework of electricity markets in China[C],” in 2020 5th Asia Conference on Power and Electrical Engineering (ACPEE), Chengdu, China, 4th to 7th June 2020, 1043–1048.
Luo, X., Zhang, Y., and Wang, Y. (2018). Construction of enterprise carbon performance evaluation index system based on "3E" triangle model[J]. Commun. Finance Account. 10, 61–64. (in chinese).
Mcgrath, M. E., and Romeri, M. N. (1994). The R&D effectiveness index: A metric for product development performance. J. Prod. Innovation Manag. 11 (3), 213–220. doi:10.1111/1540-5885.1130213
Myung, J. K., An, H-T., and Lee, S-Y. (2019). Corporate competitiveness index of climate change: A balanced scorecard approach. Sustainability 11 (5), 1445. doi:10.3390/su11051445
Nakthong, V., and Kubaha, K. (2019). Development of a sustainability index for an energy management system in Thailand. Sustainability 11 (17), 4587. doi:10.3390/su11174587
Padilla-Rivera, A., Amor, B., and Blanchet, P. (2018). Evaluating the link between low carbon reductions strategies and its performance in the context of climate change: A carbon footprint of a wood-frame residential building in quebec, Canada. Sustainability 10 (8), 2715. doi:10.3390/su10082715
Rietbergen, M. G., Opstelten, I. J., and Blok, K. (2017). Improving energy and carbon management in construction and civil engineering companies—Evaluating the impacts of the CO2 performance ladder[J]. Energy Effic. 10 (1), 55–79. doi:10.1007/s12053-016-9436-9
Standardization I O F (2018). Energy management systems — requirements with guidance for use. ISO 50001. Geneva, Switzerland: International Organization for Standardization.
Tan, W., Shen, W., and Zhao, J. (2007). A methodology for dynamic enterprise process performance evaluation. Comput. Industry 58 (5), 474–485. doi:10.1016/j.compind.2006.10.001
Wu, G., and Niu, D. (2022). A study of carbon peaking and carbon neutral pathways in China's power sector under a 1.5° C temperature control target[J]. Environ. Sci. Pollut. Res. 2022, 1–19.
Yang, Y., Yuan, Z., Chen, J., and Guo, M. (2017). Assessment of osculating value method based on entropy weight to transportation energy conservation and emission reduction[J]. Environ. Eng. Manag. J. (EEMJ) 16 (10), 2413–2423. doi:10.30638/eemj.2017.249
Yong, X., Yan, C., and Qiang, X. (2019). A study on the construction of evaluative system of Smart City based on entropy-weighted matter-element model method. Concurrency Comput. Pract. Exp. 31 (9), e5010. doi:10.1002/cpe.5010
Yun, S-Y., Hamburger, R. O., Cornell, C. A., and Foutch, D. A. (2002). Seismic performance evaluation for steel moment frames. J. Struct. Eng. 128 (4), 534–545. doi:10.1061/(asce)0733-9445(2002)128:4(534)
Zhang, C., and Zhang, Y. (2016). Research on carbon performance evaluation indicators from the perspective of resource value flow and its practice in the iron and steel enterprise[J]. J. Hunan Finace Econ. Univ. 32 (1), 39–47. (in chinese).
Keywords: power grid, carbon footprint, carbon management, carbon reduction, performance assessment
Citation: Yuan P, Zhang Y, Li F and Chen S (2023) Assessment of carbon footprint performance by electric power enterprises in China. Front. Energy Res. 11:1225326. doi: 10.3389/fenrg.2023.1225326
Received: 19 May 2023; Accepted: 26 June 2023;
Published: 21 July 2023.
Edited by:
Qingrui Wang, Huazhong University of Science and Technology, ChinaReviewed by:
Huamei Duan, Chongqing University, ChinaYunhui Huang, Wuhan University of Technology, China
Copyright © 2023 Yuan, Zhang, Li and Chen. This is an open-access article distributed under the terms of the Creative Commons Attribution License (CC BY). The use, distribution or reproduction in other forums is permitted, provided the original author(s) and the copyright owner(s) are credited and that the original publication in this journal is cited, in accordance with accepted academic practice. No use, distribution or reproduction is permitted which does not comply with these terms.
*Correspondence: Shuangyin Chen, c3loaW5jMDk0QDE2My5jb20=