 Xuanjun Zong
 Sheng Zou1
 Xiaobo Dou
- 1Economic Research Institute, State Grid Jiangsu Electric Power Co., Ltd., Nanjing, China
- 2School of Electrical Engineering, Southeast University, Nanjing, China
To realize the cascaded utilization of energy, improve the effective utilization of energy, and further reduce the carbon emissions of integrated energy systems a robust stochastic low-carbon optimal dispatch model with economy, environmental protection and reliability is developed for a park-integrated energy system wherein the multiple uncertainties brought by source and load are fully considered. First, a two-stage robust optimization algorithm is employed to handle uncertain wind power generation. A multi-case analysis method for the uncertainties of photovoltaics and load is proposed based on an improved centralized reduction algorithm. Then, considering the depreciation of the weighted average of the comprehensive operation cost, carbon emissions, and energy undersupply rate, a robust stochastic optimal dispatch model can be derived and efficiently solved by using a multi-objective fuzzy optimization algorithm with an improved membership function. Finally, by comparing the four cases, the simulation results show that the computational complexity and calculation time of the system can be reduced, the trimming result errors can be decreased, and a balance between economy, environmental protection, reliability, and robustness can be achieved.
1 Introduction
Nowadays, power industry is continuously optimizing its energy structure in response to the national “carbon emission reduction.” Renewable energy is becoming increasingly prevalent because of its low pollutant emissions and sustainable supply (Alabi et al., 2022; Zhang K. et al., 2022; Zhang et al., 2022b; Wang F. et al., 2023; Zhang et al., 2023). However, renewable energy also has shortcomings, such as its random nature and fluctuations, which pose significant challenges to the safety and stability of park-integrated energy system (PIES). Although related research on energy output and load forecasting has improved (Li et al., 2021a; Sun Y. et al., 2021; Tang et al., 2022; Wang S. et al., 2023; Huang et al., 2023; Sun et al., 2023), the uncertainty remains a significant issue in system dispatch.
Over the past few decades, numerous studies have been conducted on the optimal low-carbon dispatch of PIES. By introducing power-to-gas (P2G) equipment into the system, the effectiveness of P2G technology in the PIES for wind power consumption was verified in (Cui et al., 2022). In (Qin et al., 2022), a refined model of P2G operation was established, and an electricity hydrogen storage system (P2HSS) was constructed; the simulation results showed that the P2HSS could reduce the system carbon emissions and achieve better performance. Carbon trading was taken as a tool utilizing market mechanisms to effectively reduce carbon emissions (Qi and Han, 2023). In (Sun P. et al., 2021), the authors discussed the influence of carbon trading price on system operation. A stepped carbon-trading mechanism was introduced into PIES in (Wang et al., 2022; Zhou et al., 2023), where electricity hydrogen production was completely considered. In (Yang et al., 2023), an optimal dispatch model containing a combined cooling, heating, electricity unit, and carbon capture device was proposed, in which the demand response could help to flexibly shift the load and reduce carbon emissions. In (Li H. et al., 2021), a novel stepped carbon-trading model was constructed by introducing rewards and punishments. In (Liu, 2022), a low-carbon dispatch model for PIES was developed considering whole-life carbon emissions. However, most of the existing results are deterministic models, and low-carbon optimal dispatch under the influence of multiple source- and load-related uncertainties is rarely considered.
For these uncertainties in load prediction and energy output in PIES optimal operation, case analysis, robust optimization, and fuzzy theory have been adopted (Zhang et al., 2022c; Ma et al., 2022; Yan et al., 2022). In (Li et al., 2021c), an interval optimal model under multiple uncertainty conditions was established and the simulation results showed that the number of optimal intervals gradually increased with an increase in the degree of uncertainty fluctuation. In (Wang et al., 2019), the characteristics of the prediction error of wind power and photovoltaic (PV) were analyzed in advance and a robust optimal model considering the prediction errors was provided. A Gaussian process regression method was used to determine the probability distributions of renewable energy and load forecasts, and a min-max rolling optimal model was established in (Dong et al., 2022). In (Mahdavi et al., 2022), the normal probability density function was used to describe the uncertainty of the load. In (Xiong et al., 2022), soyster robust was utilized to handle the uncertainty of photovoltaic and load, and the worst-case scenario was selected as the related output. To reduce the conservatism of robust optimization, a two-stage robust model was proposed, and its effectiveness in improving the system economy and robustness was analyzed in (Gao et al., 2022). The Monte Carlo analysis was used to generate cases of uncertainty in (Di Somma et al., 2017). These studies used a single method, and the characteristics of the uncertainty factors were rarely combinatorically optimized.
In terms of case analysis, wind power output and load cases were combined to obtain integrated cases and their probabilities (Xie and Xu, 2022). In (Qi et al., 2023), a risk aversion dispatch strategy was developed with a minimum objective of the conditional value at risk. The number of integrated cases in (Di Somma et al., 2017; Xie and Xu, 2022; Qi et al., 2023) increased exponentially when the number of uncertain variables increased, which significantly increased the system complexity and computation time. In (Zeng et al., 2020), an overall case generation and reduction method was proposed with the purpose of reducing the tediousness of operations; however, the influence of each uncertain variable on the reduction process was not considered, thereby increasing the error of the reduction results and easily leading to a single correlation.
The authors primarily focused on a robust stochastic low-carbon optimal dispatch of PIES with multiple uncertainties. The main contributions and novelty are presented as follows.
(1) For uncertain wind power output, a two-stage robust min-max-min optimization algorithm is utilized, and a multi-case analysis method based on an improved centralized case reduction is proposed. To handle the uncertainty of photovoltaic and load. The combination of the two methods reduces the conservatism of the robust optimization method.
(2) By introducing the stepped carbon trading mechanism, a robust stochastic low-carbon optimal dispatch method for PIES is constructed with economy, environmental protection and reliability indicator, which is solved using a multi-objective fuzzy optimization algorithm with an improved membership function. This enables the system to achieve comprehensive operation while reducing the subjectivity of setting multiple objective weights.
The remaining of the manuscript is arranged as: In Section 2, the structure of the PIES is described first, and then uncertain models for the load and PV are provided. In Section 3, the development of a robust stochastic low-carbon optimal dispatch strategy of the PIES and a detailed solution process are presented. In Section 4, a case study and comparison analysis are presented to demonstrate the effectiveness of the proposed model. Finally, the paper concludes with a discussion on future research.
2 System description
2.1 Structure of PIES
A diagram of the proposed PIES is presented in Figure 1. In terms of energy production, upper-level power grid, gas network, and photovoltaic PV and wind turbine (WT) unit are available. The energy conversion components include combined heat and power (CHP) unit, gas boiler (GB), electric chiller (EC), absorption chiller (AC), electrolyzer (EL), methane reactor (MR), hydrogen fuel cell (HFC), and multi-energy storage device. The energy outputs include the cooling, heat, electricity, and gas load. The carbon emissions generated by the PIES are ultimately traded in the carbon trading market.
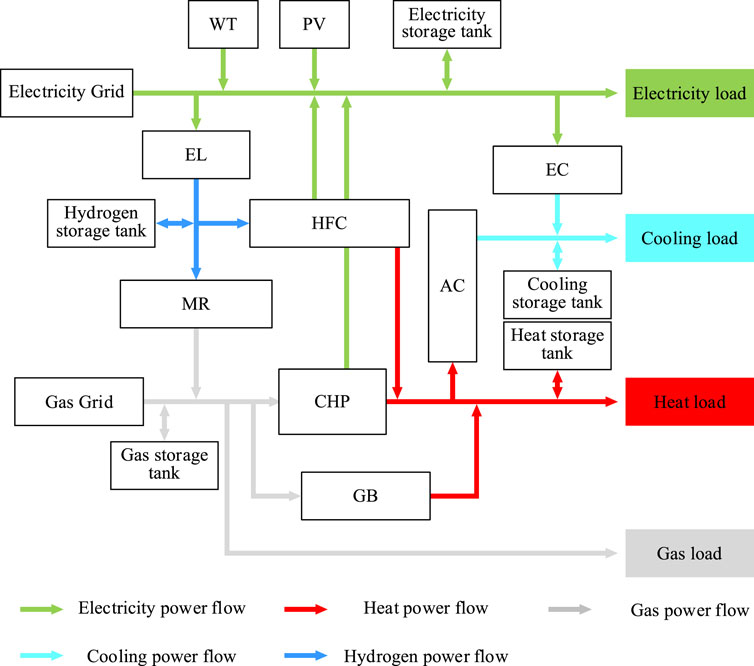
FIGURE 1. Schematic of PIES.
2.2 Mechanism of stepped carbon trading
To reduce greenhouse gas emissions, a carbon emission trading mechanism is developed as an effective approach. The stepped carbon trading mechanism is a flexible market-based approach to reducing carbon emissions. According to its mechanism: carbon emission reduction targets are divided into different tiers, and participants are rewarded by reaching or exceeding the goals of each tier. The mechanism includes carbon quota allocation, carbon trading and reward and punishment mechanism, which encourages enterprises and organizations to adopt innovative emission reduction measures to promote low-carbon economic development and achieve sustainable development goals.
The carbon emission sources considered in this study include purchasing electricity from the grid, CHP, GB, and gas load. The hydrogen conversion process of methane reactors can absorb some CO2, which is primarily consumed through the combustion of gases such as coal and natural gas, resulting in carbon emissions that need to be considered (Zhou et al., 2023).
2.3 Model of wind power with uncertainty
It is well known that wind power output is challenging to characterize accurately in real-world cases owing to various factors, such as wind speed and geographical location. However, obtaining a range of output values is relatively straightforward. Therefore, a boxing interval set
where
2.4 Multi-case model of uncertainties of PV and load
The predicted values of PV generation, cooling, heating, electricity, and gas load deviate. In this study, the actual values are taken as the sum of the predicted values and deviations, which are expressed as:
where
Without a loss of generality, in this study, photovoltaic generation and load are assumed to follow a normal distribution, and the basic parameters are given as:
where
For these uncertainties introduced by photovoltaic power output and load, the corresponding samples are generated through random sampling based on their probability distributions. In this study, the Latin hypercube sampling (LHS) is adopted, which ensures that the samples encompass the entire sample space of the random variable; detailed procedures can be found in (Xiong et al., 2022) and are excluded in this paper.
3 Robust stochastic low-carbon optimal dispatch model of PIES
Considering the uncertainties from sources and loads, a robust stochastic low-carbon optimal dispatch model is developed for the PIES. The model is divided into two stages: First, the multi-case analysis and multi-objective fuzzy optimization algorithm with an improved membership function are used to obtain the energy storage charging and discharging plan, grid interaction plan, and energy storage equipment output plan. Next, the robust min-max-min optimization algorithm is employed to minimize the energy purchase cost in the worst-case scenario. The proposed robust stochastic low-carbon optimal dispatch model is given by
where
3.1 Objective function
For a typical case of photovoltaic and load case, the objective function is described in detail to develop a robust stochastic low-carbon optimal dispatch model for PIES.
The first objective is to obtain the minimum operational cost within a dispatch period:
where
where
The second objective is to achieve minimal total carbon dioxide emissions, which are expressed as follows:
where
where
The third objective is the energy undersupply rate of system, which is shown as
where
3.2 Constraints
(1) Wind turbine (WT) output constraints
where
(2) PV generation constraints
where
(3) CHP constraints
where
(4) GB constraints
where
(5) EL constraints
where
(6) MR constraints
where
(7) HFC constraints
where
(8) EC constraints
where
(9) AC constraints
where
(10) Energy storage device constraints
where
(11) Power balance constraints
where
(12) Heat balance constraints
(13) Gas balance constraints
where
(14) Hydrogen balance constraints
(15) Cooling balance constraints
3.3 Solution to optimal model
The number of typical scenes generated by the traditional centralized reduction method is artificially adjustable, which can reduce computational complexity. However, it does not consider the impact of various uncertain variables such as dimensions and value ranges on the typical scene set and probability obtained through centralized reduction. Therefore, an improved centralized reduction method is proposed to handle sampled scene sets. For the developed optimal dispatch model, Latin hypercube sampling is adopted for scene generation, and because its initial scene set is large, an improved centralized reduction approach is developed to process the sampling scene set. In this method, the uncertain variables are sampled using a Latin hypercube. The obtained scene set is then normalized. The system sampling scene set under the improved centralized reduction method is combined. Finally, the heuristic synchronous back-substitution method is used to improve and reduce the typical scene set and its probability, which is expressed as:
where
An evaluation index called the comprehensive probability distance (CPD) is proposed to evaluate the performance of the proposed reduction strategy:
where
It is noteworthy that the min-max-min structure in a robust stochastic low-carbon optimal dispatch model cannot be solved directly. Therefore, the algorithm of column and constraint generation algorithm (CCG) is employed to decompose the main problem and sub-problem and solve them alternately; the large M method and duality theory can be used to transform the sub-problem into a single objective optimization issue, and a more detailed description can be found in (Ma et al., 2022), which is excluded here owing to the length-limit of the paper.
Furthermore, a new multi-objective fuzzy optimization algorithm with an improved membership function is developed, in which a continuously differentiable inverse sigmoid function in the definition domain is adopted. Based on the maximum and minimum satisfaction approaches, the minimum value of the three objective membership functions is set as satisfaction, and a single objective issue that satisfies all constraints and maximum satisfaction was derived (Wang et al., 2019).
The main steps of the proposed optimization model are as follows.
Step 1. The predicted values of the cooling, heat, electricity, gas loads, and PV generation are input and a large number of sample cases is generated using Latin hypercube sampling, which conformed to the corresponding probability distribution.
Step 2. A small number of typical representative scenes and their probabilities are obtained using a heuristic synchronous back-substitution method.
Step 3. A two-stage robust min-max-min optimization algorithm is developed to deal with the uncertainty of wind power. Typical cases are substituted into the model to build a robust stochastic low-carbon optimal dispatch model based on system equipment parameters and system structure.
Step 4. The fuzzy multi-objective optimization algorithm with an improved membership function is used to obtain the solution. A commercial solver, Gurobi, is employed based on Matlab 2020a.
The flow of the proposed optimization approach is illustrated in Figure 2.

FIGURE 2. Flow chart of the optimization algorithm.
4 Case study
4.1 Basic data
In this study, the optimal dispatch period is 24 h. The multidimensional load, the predicted output of wind and PV power in the PIES, and the purchase and sale prices of electricity at different times are illustrated in Figures 3–5. The natural gas price is set to 0.35 yuan/(kWh). Table 1 lists the basic parameter settings for each device, and Table 2 lists the parameter settings for each energy storage device. The carbon emission quota for unit power generation is set to 0.798 kg/(kWh). The carbon emission quota for the unit heat supply is set as 0.385 kg/(kWh) (Qin et al., 2022). The interval length of the stepped carbon trading mechanism was set to 2000 kg. Based on the data from (Dong et al., 2022), the price increase rate is set to 25% and the base price of carbon trading is set to 0.252 yuan/kg.
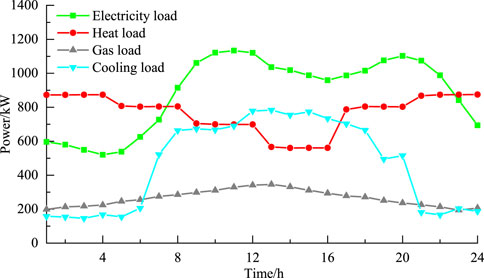
FIGURE 3. Prediction load curves in PIES.
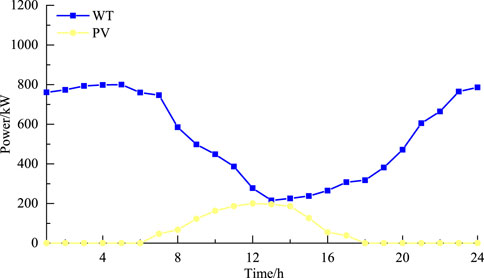
FIGURE 4. Prediction curves of wind power and photovoltaic in PIES.
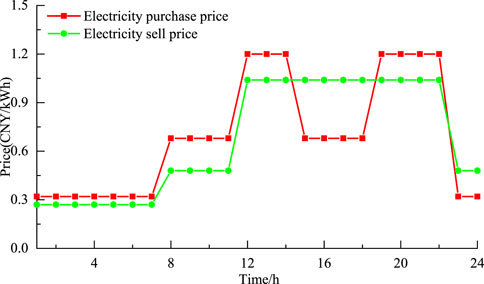
FIGURE 5. Electricity purchase and sale prices at different times.
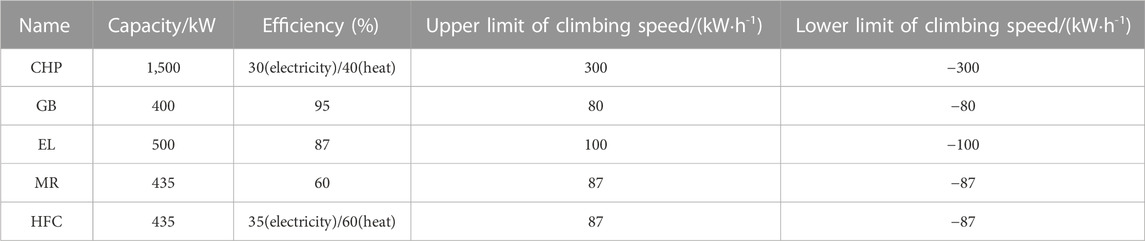
TABLE 1. Equipment parameters.
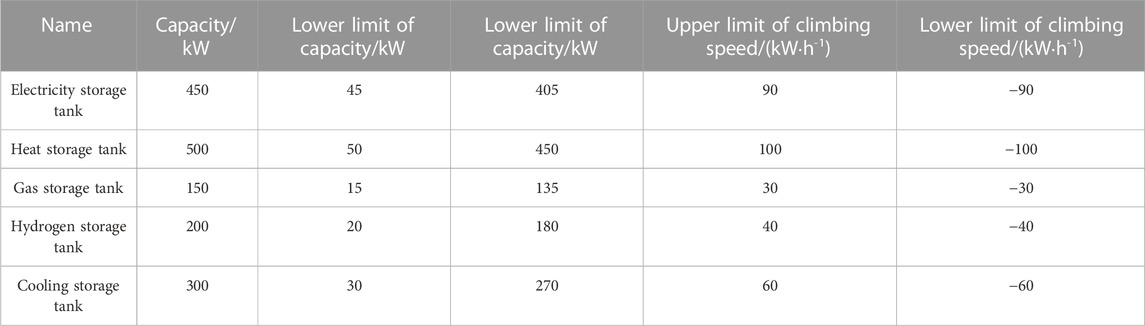
TABLE 2. Energy storage parameters.
Using the proposed method, a set of 1,000 sampled cases is generated, as shown in Figure 6. The sampled case set contains 1,000 × 120 data points, representing the size of the PV generation and the load of cooling, heat, electricity, and gas at every hour. A synchronous back-substitution method is adopted to improve and reduce the 1,000 scene sets. Eight typical scenes and their probabilities are shown in Figure 7.
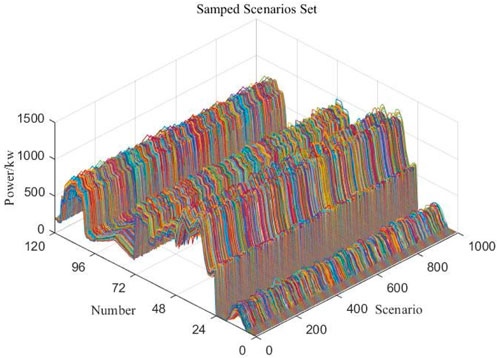
FIGURE 6. Sampled case set.
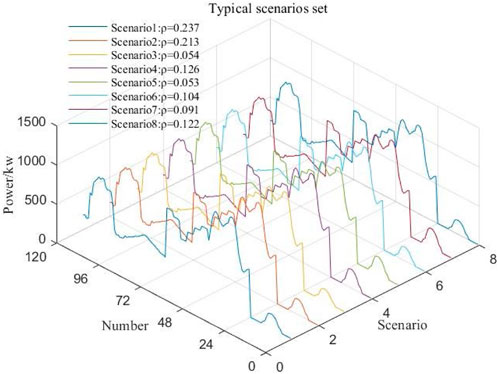
FIGURE 7. Typical case set.
To further demonstrate the performance of the improved case reduction method, the results are compared with those obtained by separate reduction and traditional centralized reduction with CPD. A comparison of the results is presented in Table 3; Figure 8.
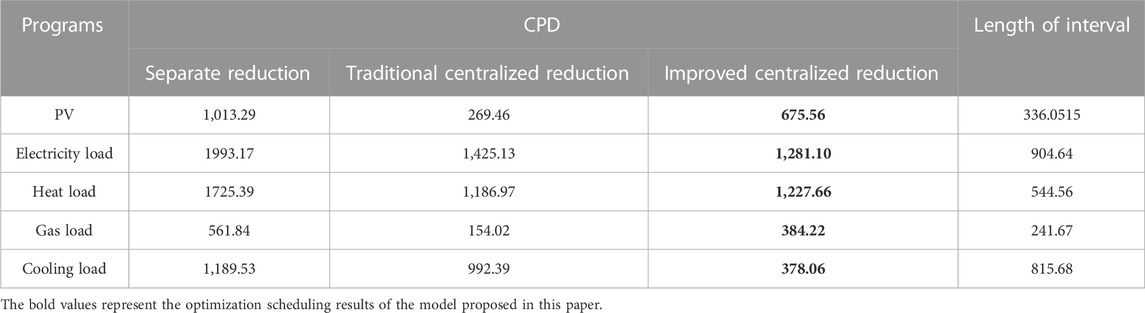
TABLE 3. Evaluation results of different reduction methods.
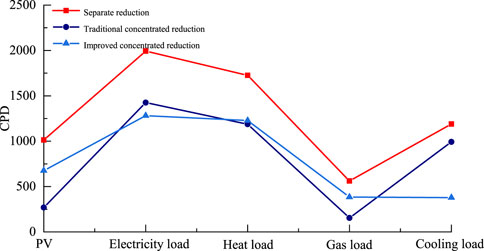
FIGURE 8. CPD line chart of different reduction methods.
From Table 3; Figure 8, the CPD of each uncertain variable is found to be more significant than that of centralized reduction and improved centralized reduction using the separate reduction method, because the heuristic synchronous backtracking algorithm calculates the probability distance between each scene in the generated scene set and the rest of the scenes. The scene pair with the smallest probability distance is selected and reduced by adding the probability of one scene to the other. This process was repeated until the number of scenes is reduced to one or fewer. As the number of scenes decreases, the CPD of the remaining scene pairs becomes the maximum CPD value for the same number of scene pairs in the original scene set.
For the traditional centralized reduction and improved centralized reduction methods, the CPD of the gas load is smaller when using the improved centralized reduction, while the CPDs of the electrical load and cooling load are larger when using the traditional centralized reduction because the value ranges of the photovoltaic, heat load, and gas load are relatively small, and the value ranges of the electric load and cooling load are relatively large. The traditional centralized reduction method has a greater impact on the probability distance of the scene set in the reduction process owing to the relatively large value ranges of the electric and cooling loads. The reduction process is more correlated with the electric and cooling loads; therefore, the reduction is more inclined to be conducted according to the trend of separate reduction of the electric and cooling loads. Therefore, the difference between the CPD under the traditional centralized reduction mode of the electric load and cooling load, and the CPD under the separate reduction mode is smaller. After adopting the improved centralized reduction mode, the uncertain variables in the scene set are normalized to obtain the normalized scene set, which significantly reduced the influence of the length of the value range of the uncertain variables on the reduction process. Simultaneously, the dimensionality of the uncertain variables can be eliminated. The influences of different variables on the reduction process are more balanced. Therefore, with the increase in the CPD of photovoltaic, heat load, and gas load, the correlation of the reduction process can be improved such that the error of the reduction result is reduced and a single correlation of the reduction result is avoided.
4.2 Analysis of simulation results
In this section, the advantages of a multi-objective low-carbon optimal PIES in terms of economic and environmental protection and reliability are discussed. Without loss of generality, the load demand and wind and PV power outputs are considered as the predicted values. The following four models were constructed with different objectives.
Model 1. PIES economic model to minimize optimal comprehensive operation cost.
Model 2. PIES low carbon model to minimize carbon emissions.
Model 3. PIES reliability model to minimize the energy undersupply rate.
Model 4. PIES multi-objective low-carbon optimal dispatch model considering economic and environmental protection and reliability indicator.
The optimization results are summarized in Table 4. Table 4 demonstrates that the carbon emissions of the PIES are 13.21% higher than the minimum emissions, and the energy undersupply rate is 12.47% higher. The system cost is 12.71% higher than the optimal economic cost. The energy undersupply rate is 24.48% higher. The energy undersupply rate is the lowest, and the system cost is 31.22% higher. The carbon emission is 49.38% higher. Compared with the single economic objective, the carbon emissions and energy undersupply rate increased by 3.30% and decreased by 3.60%, respectively. Compared with the single carbon emission objective, the system cost and energy undersupply rate decrease by 2.07% and 12.89%, respectively. Compared with the single minimum energy undersupply rate objective, the system cost reduces by 15.88%, and carbon emissions reduce by 21.71%, which is more suitable for meeting the engineering requirements.
Figure 9 shows the optimal results for Model 1. Wind power resources are abundant whereas the electric load is relatively low at 1:00–7:00 and 23:00–24:00. To absorb abundant wind power and promote economic operations, surplus wind power is sold through a higher-level power grid. Some part of it is input into the EL equipment for hydrogen production. Hydrogen is the first input into HFC because of its high energy-conversion efficiency. The remaining hydrogen is converted into natural gas via the MR or stored in a hydrogen storage tank. When energy prices are high, wind power generation is low at 8:00–22:00. The system mainly satisfies its electricity and heat-load demand through the CHP output, thereby reducing the system operation cost.
Figure 10 shows the optimal results for Model 2. The system relies on CHP to meet its load requirements of the electricity and heat throughout the day, compared to when the system operates in the economically optimal mode. When the economic objective is pursued, a portion of the abundant wind power is consumed by inputting the EL equipment for hydrogen production. Hydrogen can be used by HFC to output a large amount of electricity and heat, thereby improving the operating economy of the system. When carbon emissions are minimized, the system sells all surplus wind power through the higher-level power grid; thus, carbon emissions can be reduced. This is because the factor of carbon emission for purchased electricity is higher, resulting in all surplus wind power being sold in Model 2.
Figure 11 shows the optimal results for Model 3. Compared to the system in the economically optimal mode and the carbon emissions minimum mode, the surplus wind power is entirely consumed using the EL device for hydrogen production. A large amount of electricity and heat power are generated using HFC. However, owing to equipment capacity limitations, more than one HFC thermal power generation is required to satisfy the load demand. Therefore, the system relies primarily on a upper-level grid to satisfy its electricity load demand. A small number of CHP units are used to satisfy the heat demand. When the goal is to minimize the energy undersupply rate, the average energy conversion efficiency of the power-consuming units is higher than that of the gas-consuming units. Therefore, when the system needs to meet the same load demand, it must purchase less electricity than gas. To meet the electricity load demand, it tends to purchase electricity from the upper-level grid and meet the heat-load demand of the system using HFC. This reduces the output of the CHP units and causes a decrease in the purchase of gas by the system from the upper-level gas grid and a lower dependence on external energy purchases. Consequently, the operational reliability of the system improves.
Figure 12 shows the optimal results for Model 4. Compared with Models 1, 2, and 3, Model 4 comprehensively considers the multi-energy complementarity and collaborative optimization of wind power hydrogen production, CHP, and other equipment; it completely utilizes the existing wind and photovoltaic resources, interacts with external energy prices, such as time-of-use electricity and gas prices, and balances the three indicators of economic and environmental protection and reliability to obtain the optimal dispatch plan.
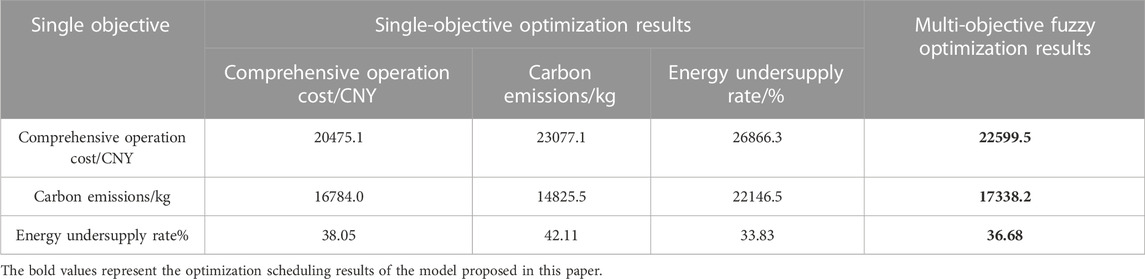
TABLE 4. Multi-objective results of different dispatch models.
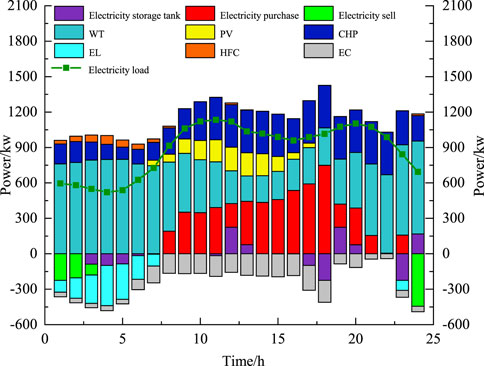
FIGURE 9. Dispatch results of Model 1.
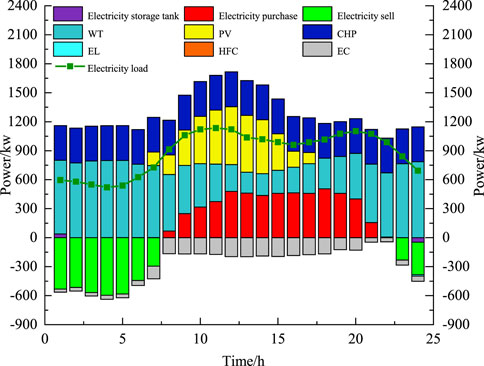
FIGURE 10. Dispatch results of Model 2.
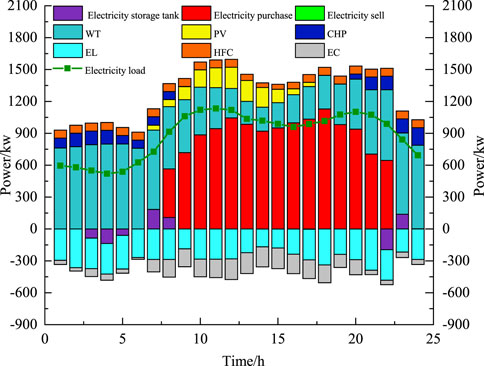
FIGURE 11. Dispatch results of Model 3.
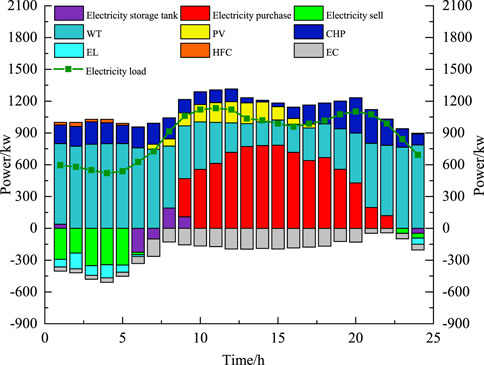
FIGURE 12. Dispatch results of Model 4.
4.3 Comparison of optimal models
In this subsection, four cases are presented. Additionally, the comparison of the advantages of the robust stochastic optimization model and its verification are explained.
Case 1. Source and load uncertainty are not considered;
Case 2. A multi-case analysis method is utilized for the uncertainties from the source and load.
Case 3. A two-stage robust optimization algorithm is utilized for source and load uncertainties.
Case 4. A two-stage robust optimization algorithm is employed for the uncertain wind power output, and a multi-case analysis method is used for the uncertainty of the photovoltaic output and load.
The comparison results of the different cases are listed in Table 5. In Case 1, uncertainty is considered; therefore, the results of the comprehensive operation cost and carbon emissions are the best, while the energy undersupply rate is not reliable. The worst case for each uncertain variable is considered in Case 3 to maximize the multi-objective result. The proposed robust stochastic optimization method represents the actual operation situation. Multi-objective results are obtained between those of Cases 1 and 3. Thus, the method improves the shortcomings of the over-conservative two-stage robustness and has more reference values.
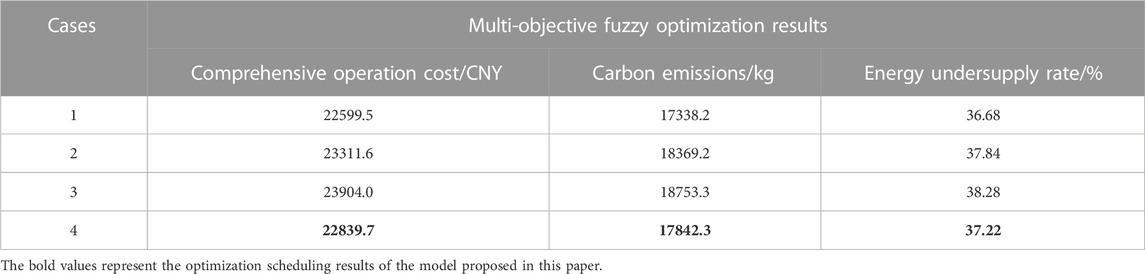
TABLE 5. Multi-objective results of different cases.
5 Conclusion
In this study, a robust stochastic low-carbon optimal dispatch strategy for PIES was constructed with economy and environmental protection and reliability factor, in which the uncertain source load factors were entirely considered and a stepped carbon-trading mechanism was introduced with multiple objectives. The optimal dispatch scheme was solved under the worst wind power cases by using a two-stage robust min-max-min optimization algorithm, with a focus on the uncertain wind power. A multi-scene analysis based on improved centralized reduction was proposed, which reasonably considered the impact of uncertain variables on the reduction process for photovoltaic and load uncertainty, compared to separate reduction and traditional concentrated reduction. Finally, a multi-objective fuzzy optimization algorithm with an improved membership function was adopted to solve the multi-objective optimal dispatch model, which can reduce the subjectivity of multi-objective weights to some extent. The simulation results demonstrated the usefulness and effectiveness of the proposed method, which could provide a reference for future applications of the PIES.
However, it should be pointed out that the proposed method in this paper still has certain subjectivity and conservatism. Therefore, in the future, some interesting research topics, such as further reducing conservatism by using distributed robust methods, further weaking the subjectivity of selecting the multi-objective weight and establish a more refined model, etc., which are some ongoing research directions.
Data availability statement
The original contributions presented in the study are included in the article/Supplementary material, further inquiries can be directed to the corresponding author.
Author contributions
XZ: Building models and simulation analysis. SZ and HZ: Literature collection and drafting. XD: Reviewing and editing. All authors contributed to the article and approved the submitted version.
Funding
This work is supported by the Science and Technology Project of State Grid Jiangsu Electric Power Co., LTD. (No. J2021191).
Acknowledgments
The authors would express their appreciation for the project for the contribution of the research fund. The authors would also like to acknowledge the reviewers for their constructive comments and careful revision of this paper.
Conflict of interest
XZ, SZ, and HZ was employed by State Grid Jiangsu Electric Power Co., Ltd.
The remaining authors declare that the research was conducted in the absence of any commercial or financial relationships that could be construed as a potential conflict of interest.
Publisher’s note
All claims expressed in this article are solely those of the authors and do not necessarily represent those of their affiliated organizations, or those of the publisher, the editors and the reviewers. Any product that may be evaluated in this article, or claim that may be made by its manufacturer, is not guaranteed or endorsed by the publisher.
References
Alabi, T. M., Agbajor, F. D., Yang, Z., Lu, L., and Ogungbile, A. J. (2022). Strategic potential of multi-energy system towards carbon neutrality: A forward-looking overview. Energy Built Environ. 4, 689–708. doi:10.1016/j.enbenv.2022.06.007
Cui, D., Ge, W., Zhao, W., Jiang, F., and Zhang, Y. (2022). Economic low-carbon clean dispatching of power system containing P2G considering the comprehensive influence of multi-price factor. J. Electr. Eng. Technol. 17, 155–166. doi:10.1007/s42835-021-00877-4
Di Somma, M., Graditi, G., Heydarian-Forushani, E., Shafie-khah, M., and Siano, P. (2017). Stochastic optimal scheduling of distributed energy resources with renewables considering economic and environmental aspects. Renew. Energy 116, 272–287. doi:10.1016/j.renene.2017.09.074
Dong, X., Zhang, C., and Sun, B. (2022). Optimization strategy based on robust model predictive control for RES-CCHP system under multiple uncertainties. Appl. Energy 325, 119707. doi:10.1016/j.apenergy.2022.119707
Gao, J., Yang, Y., Gao, F., and Wu, H. (2022). Two-stage robust economic dispatch of regional integrated energy system considering source-load uncertainty based on carbon neutral vision. Energies 15, 1596. doi:10.3390/en15041596
Huang, N., Wang, S., Wang, R., Cai, G., Liu, Y., and Dai, Q. (2023). Gated spatial-temporal graph neural network based short-term load forecasting for wide-area multiple buses. Int. J. Electr. Power & Energy Syst. 145, 108651. doi:10.1016/j.ijepes.2022.108651
Li, H., Ye, Y., and Lin, L. (2021b). Low-carbon economic bi-level optimal dispatching of an integrated power and natural gas energy system considering carbon trading. Appl. Sciences-Basel. 11, 6968. doi:10.3390/app11156968
Li, Y., Tang, F., Gao, X., Zhang, T., Qi, J., Xie, J., et al. (2021a). Numerical weather prediction correction strategy for short-term wind power forecasting based on bidirectional gated recurrent unit and XGBoost. Front. Energy Res. 9, 836144. doi:10.3389/fenrg.2021.836144
Li, Y., Wang, K., Gao, B., Zhang, B., Liu, X., and Chen, C. (2021c). Interval optimization based operational strategy of integrated energy system under renewable energy resources and loads uncertainties. Int. J. Energy Res. 45, 3142–3156. doi:10.1002/er.6009
Liu, X. (2022). Research on optimal placement of low-carbon equipment capacity in integrated energy system considering carbon emission and carbon trading. Int. J. Energy Res. 46, 20535–20555. doi:10.1002/er.7826
Ma, Z., Yang, M., Jia, W., and Ding, T. (2022). Decentralized robust optimal dispatch of user-level integrated electricity-gas-heat systems considering two-level integrated demand response. Front. Energy Res. 10. doi:10.3389/fenrg.2022.1030496
Mahdavi, M., Alhelou, H. H., Siano, P., and Loia, V. (2022). Robust mixed-integer programing model for reconfiguration of distribution feeders under uncertain and variable loads considering capacitor banks, voltage regulators, and protective relays. IEEE Trans. Ind. Inf. 18, 7790–7803. doi:10.1109/TII.2022.3141412
Qi, N., Cheng, L., Li, H., Zhao, Y., and Tian, H. (2023). Portfolio optimization of generic energy storage-based virtual power plant under decision-dependent uncertainties. J. Energy Storage 63, 107000. doi:10.1016/j.est.2023.107000
Qi, X., and Han, Y. (2023). Research on the evolutionary strategy of carbon market under “dual carbon” goal: From the perspective of dynamic quota allocation. Energy 274, 127265. doi:10.1016/j.energy.2023.127265
Qin, G., Yan, Q., Kammen, D. M., Shi, C., and Xu, C. (2022). Robust optimal dispatching of integrated electricity and gas system considering refined power-to-gas model under the dual carbon target. J. Clean. Prod. 371, 133451. doi:10.1016/j.jclepro.2022.133451
Sun, P., Hao, X., Wang, J., Shen, D., and Tian, L. (2021b). Low-carbon economic operation for integrated energy system considering carbon trading mechanism. Energy Sci. Eng. 9, 2064–2078. doi:10.1002/ese3.967
Sun, Y., Wu, X., Wang, J., Hou, D., and Wang, S. (2021a). Power compensation of network losses in a microgrid with BESS by distributed consensus algorithm. IEEE Trans. Syst. Man, Cybern. Syst. 51, 2091–2100. doi:10.1109/TSMC.2020.2968605
Sun, Y., Zhou, Y., Wang, S., Mahfoud, R. J., Alhelou, H. H., Sideratos, George., et al. (2023). Performance improvement of very short-term prediction intervals for regional wind power based on composite conditional nonlinear quantile regression. J. Mod. Power Syst. Clean Energy 10, 60–70. doi:10.35833/mpce.2020.000874
Tang, Y., Tang, Z., Gao, Y., Wei, L., Zhou, J., Han, F., et al. (2022). An adaptive forecasting method for the aggregated load with pattern matching. Front. Energy Res. 10. doi:10.3389/fenrg.2022.1088100
Wang, F., Lv, C., and Xu, J. (2023a). Carbon awareness oriented data center location and configuration: An integrated optimization method. Energy 278, 127744. doi:10.1016/j.energy.2023.127744
Wang, G., Zhou, F., Li, P., and Wang, Z. (2019). “Optimal operation analysis of integrated community energy system considering source-load uncertainty,” in Proceedings of 2019 IEEE 3RD International Electrical and Energy Conference, Beijing, China, September 2019, 1217–1222. doi:10.1109/CIEEC47146.2019
Wang, L., Dong, H., Lin, J., and Zeng, M. (2022). Multi-objective optimal scheduling model with IGDT method of integrated energy system considering ladder-type carbon trading mechanism. Int. J. Electr. Power & Energy Syst. 143, 108386. doi:10.1016/j.ijepes.2022.108386
Wang, S., Sun, Y., Zhang, S., Zhou, Y., Hou, D., and Wang, J. (2023b). Very short-term probabilistic prediction of PV based on multi-period error distribution. Electr. Power Syst. Res. 214, 108817. doi:10.1016/j.epsr.2022.108817
Xie, Y., and Xu, Y. (2022). Transmission expansion planning considering wind power and load uncertainties. Energies 15, 7140. doi:10.3390/en15197140
Xiong, J., Sun, Y., Wang, J., Li, Z., Xu, Z., and Zhai, S. (2022). Multi-stage equipment optimal configuration of park-level integrated energy system considering flexible loads. Int. J. Electr. Power Energy Syst. 140, 1–12. doi:10.1016/j.ijepes.2022.108050
Yan, L., Zhao, Y., Xue, T., Ma, N., Li, Z., and Yan, Z. (2022). Two-layer optimal operation of AC-DC hybrid microgrid considering carbon emissions trading in multiple scenarios. Sustainability 14, 10524. doi:10.3390/su141710524
Yang, P., Jiang, H., Liu, C., Kang, L., and Wang, C. (2023). Coordinated optimization scheduling operation of integrated energy system considering demand response and carbon trading mechanism. Int. J. Electr. Power & Energy Syst. 147, 108902. doi:10.1016/j.ijepes.2022.108902
Zeng, B., Liu, Y., Xu, F., Liu, Y., Sun, X., and Ye, X. (2020). Optimal demand response resource exploitation for efficient accommodation of renewable energy sources in multi-energy systems considering correlated uncertainties. J. Clean. Prod. 288, 125666. doi:10.1016/j.jclepro.2020.125666
Zhang, J., Tian, G., Chen, X., Liu, P., and Li, Z. (2023). A chance-constrained programming approach to optimal planning of low-carbon transition of a regional energy system. Energy 278, 127813. doi:10.1016/j.energy.2023.127813
Zhang, K., Xu, N., Ling, Y., Zhou, B., and Song, Y. (2022a). Economic dispatch analysis of comprehensive energy system considering carbon trading. Front. Energy Res. 546, 022058. doi:10.1088/1755-1315/546/2/022058
Zhang, Y., Fu, Z., Xie, Y., Hu, Q., Li, Z., and Guo, H. (2022c). A comprehensive forecasting-optimization analysis framework for environmental-oriented power system management-A case study of Harbin city, China. Sustainability 12, 4272. doi:10.3390/su12104272
Zhang, Y., Ni, M., and Sun, Y. (2022b). Fully distributed economic dispatch for cyber physical power system with time delays and channel noises. J. Mod. Power Syst. Clean Energy 10, 1472–1481. doi:10.35833/MPCE.2020.000847
Keywords: low carbon optimal dispatch, robust optimization, multiple uncertainties of source and load, improved centralized reduction, multi-objective fuzzy optimization
Citation: Zong X, Zou S, Zhou H and Dou X (2023) Robust stochastic low-carbon optimal dispatch of park-integrated energy system with multiple uncertainties from source and load. Front. Energy Res. 11:1226768. doi: 10.3389/fenrg.2023.1226768
Received: 22 May 2023; Accepted: 17 July 2023;
Published: 28 July 2023.
Edited by:
Nantian Huang, Northeast Electric Power University, ChinaReviewed by:
Yi Wang, Zhengzhou University, ChinaZhenkun Li, Shanghai University of Electric Power, China
Hassan Haes Alhelou, Tishreen University, Syria
Copyright © 2023 Zong, Zou, Zhou and Dou. This is an open-access article distributed under the terms of the Creative Commons Attribution License (CC BY). The use, distribution or reproduction in other forums is permitted, provided the original author(s) and the copyright owner(s) are credited and that the original publication in this journal is cited, in accordance with accepted academic practice. No use, distribution or reproduction is permitted which does not comply with these terms.
*Correspondence: Xuanjun Zong, em9uZ3h1YW5qdW5AMTYzLmNvbQ==