 Nan Shao
 Guobin Xu1*
 Xiang Yan
- 1State Key Laboratory of Hydraulic Engineering Simulation and Safety, Tianjin University, Tianjin, China
- 2School of Water Conservancy and Hydroelectric Power, Hebei University of Engineering, Handan, China
Experimental tests on two tandem triangular prisms were accomplished in synergistic flow-induced motion (FIM) to collect ocean current energy (OCE) with varied spacing ratios and Reynolds number ranges. Typical FIM responses and energy conversion are discussed and presented. The effects of parameters (system stiffness, spacing ratio, and load resistance) were considered to improve the energy harvesting of the system. The main findings can be summarized as follows: 1) with varied spacing ratios between the two tandem prisms, the active power (Pharn) was up to 1.95 times that of the single triangular prism (STP); 2) In general, the harnessed OCE capacity of the upstream triangular prism (UTP) was improved, while the energy harvesting of the downstream triangular prism (DTP) was suppressed by the interaction of the two prisms, 3) In the tests, electricity was generated at U = 0.516 m/s, and the active power, which consistently increased as flow velocity increased, reached Pharn = 32.24 W, with a corresponding efficiency of ηharn = 10.31%; and 4) The best energy conservation performance for harvesting the OCE occurred at L/D = 5, and the optimal load resistance was found at RL = 11 Ω.
Introduction
The efficient utilization of zero carbon energy has become an important topic in recent years. Abundant renewable energy may be contained in ocean currents, which could be an effective solution to meeting the worldwide energy supply shortage. Flow-induced motion exists surrounding various structures, such as bridges (Chen et al., 2018), offshore risers (Joshi and Jaiman, 2017), vehicle systems (MatinNikoo et al., 2018), transmission lines (Liu et al., 2017), multi-column offshore platforms (Matsumiya et al., 2018), and hydrofoil cavitation (Wu et al., 2017; Narendran et al., 2018), and is recognized as a destructive phenomenon. With further research on FIM, emerging FIM energy conversion has become a central issue for harnessing ocean current energy (OCE). Some creative prototypes and systems based on FIM have been established to study the oscillation responses and collect OCE.
In the past decade, diverse apparatus for harnessing OCE has been developed and received wide attention. Examples include the vortex-induced vibration aquatic clean energy (VIVACE) system developed by Bernitsas et al. (2008), the virtual damper–spring system (Lee and Bernitsas, 2011; Sun et al., 2015), and the passive turbulence control (PTC) cylinder (Chang et al., 2011). Many experiments with high damping, high Reynolds number, variable stiffness, and variable mass have been carried out. Sun et al. (2017) conducted experimental tests on two passive turbulence control (PTC) cylinders with spacing ratios of 1.57, 2.0, and 2.57 to enhance energy conversion, which was 2.56–13.49 times that of a single PTC cylinder. When testing multiple PTC cylinders, the optimal arrangement of cylinders has been defined by the Betz limit; the efficiency can reach 88.6%, and the optimal density is 875 W/m3. Scholars have studied the energy conversion of tandem PTC cylinders with a numerical model, and a high efficiency of 37% was achieved (Ding et al., 2013; Kim and Bernitsas, 2016). Zhu et al. (2023a) studied the flow structures and dynamic characteristics around a circular cylinder with bilateral splitter plates numerically at a low Reynolds number of 100, and the flow-induced rotation of three different types of bluff bodies was also investigated numerically (Zhu et al., 2023b).
Linking the VIVACE converter and non-cylindrical oscillators, Zhang et al. (2016a) and Zhang et al. (2016b) identified two typical galloping phenomena, soft galloping (SG) and hard galloping (HG), for a triangular prism, which is helpful for harnessing energy with large amplitude. For SG, the oscillation can be self-excited with the increasing flow velocity, but HG requires external excitation to begin galloping. Lian et al. (2017a) and Lian et al. (2017b) concluded that the conversion of SG and HG was an evolving process that was significantly influenced by damping, stiffness, and mass. Subsequently, Shao et al. (2018) introduced FIM tests of a T-section prism and revealed the complete FIM responses and energy conversion characteristics for a T-section prism with different load resistances and aspect ratios. Zhu et al. (2021) studied the characteristics of trapezoidal cylinders with five aspect ratios (d/D), where d is the length of the shorter base and D is the length of the longer base and the height of the cylinders, and the results showed that both the maximum oscillation response and energy conversion were observed at d/D = 0, where the trapezoidal cylinder had changed into a triangular prism. Lian et al. (2017b) compared the FIM responses and energy conversion of various types of cylinders (circular cylinder, regular triangle prism, right square prism, and diamond square prism). In the tests, the regular triangle prism had the best performance with larger amplitude and more active power, which means more efficient harvesting of the energy of ocean currents.
To harness more OCE, an important question is to understand the oscillation and power generation of multiple cylinders in water flow. The interference among cylinders is complex and diverse, especially the interactions between vortex and velocity. The FIM oscillation responses of multiple immersed cylinder configurations have been examined by many researchers. In the early studies, Zdravkovich (1985), Zdravkovich and Achenbach (1997), andZdravkovich and Achenbach, (2002) documented different wake interference regions through experiments. Different types of energy harvesters with plates were developed to improve the harvesting energy by Wang et al. (2021) andWang et al (2023); different locations of the plates were applied and analyzed. Alam et al. (2003a),Alam et al. (2003b), and Alam and Sakamoto (2005) conducted experiments on tandem cylinders. Mutual interference between the cylinders caused by the parameters was systematically analyzed. It was concluded that the space between two prisms has a large effect on the oscillation of the downstream prism. The interference is significant and can be observed in the experiments conducted by Assi et al. (2006) andAssi et al. (2010), as shown in Figure 1. The amplitude decreases at x0/D ≥ 4.0. For x0/D = 20.0, weak vibration can be observed. The increasing space has a negative effect on the oscillation; the cylinder begins to present similar vibration to an isolated body when the interference was irrelevant.
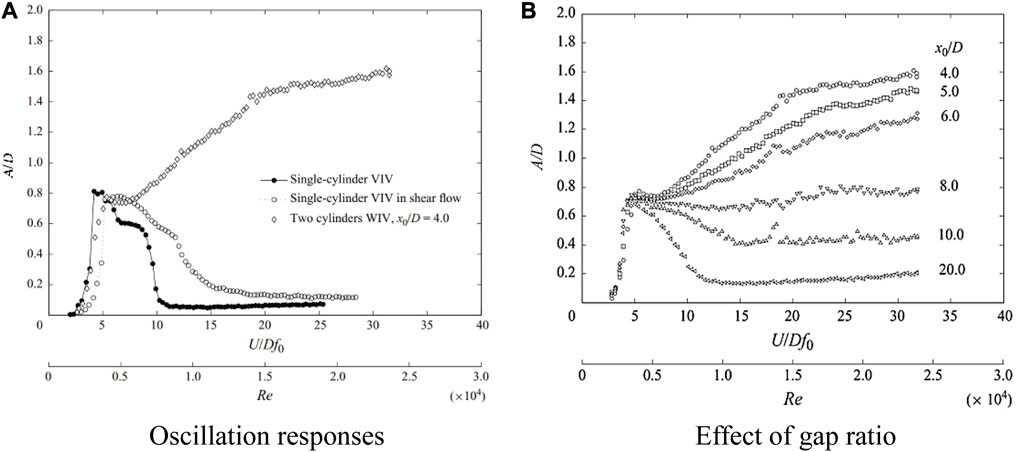
FIGURE 1. Comparison of amplitude responses for a cylinder downstream of a single cylinder (Assi et al., 2010). (A) Oscillation responses; (B) effect of the gap ratio.
Lin et al. (2002) presented the inflow condition of the cylinders by the particle-image-velocimetry method. On the other side, a large effect on the downstream cylinder was also observed. Mahir and RockWell (1996a), Mahir and RockWell (1996b), and Griffith et al. (2017) also performed experiments and found a significant effect between two cylinders. In recent years, the mutual disturbance of cylinders was recognized. Qin et al. (2017) andQin et al. (2018) studied the oscillation of two cylinders with different natural frequencies connected in tandem, which can decrease the oscillation. Wang et al. (2019) and Xu et al. (2019) conducted experiments on two tandem, long, flexible cylinders with an aspect ratio of 350 at 800 ≤ Re ≤ 16,000. Compared to a single cylinder, the upstream cylinder has the same oscillation; due to the interference, the other performs differently. Zhang et al. (2017) and Zhang et al. (2018) studied the energy conversion for two tandem cylinders at varied spacing ratios, and the pair with a Cir-Tri section had the optimal performance with a maximum efficiency η = 26.5%. Furthermore, numerical models were used to research and analyze the effect of aspect ratio on rectangular cylinders in a flow of 0.1–2.5 m/s. The oscillation responses and energy conversion of two rigidly coupled triangular prisms in a tandem arrangement were tested by Lian et al. (2022). Stiffness, spacing ratio, and load resistance were considered, and a maximum amplitude ratio of A*max = 2.24 and maximum active power of Pharn = 21.04 W were achieved in the experiments.
Based on our test apparatus, we explored some oscillation and energy conversion of non-circular single prisms such as triangular, square, and T-section prisms. The results show that the energy conversion characteristics of the triangular prism were better. To the authors’ knowledge, there are few studies on the energy conversion of two triangular prisms in a tandem arrangement (TTPT). In order to further improve the energy conversion of FIM and better understand the characteristic of TTPT, systemic experiments were conducted and analyzed. The results in this article can be summarized as follows: 1) Experimental research on TTPT (3 ≤ L/D ≤ 8) was completed to study the oscillation responses of the two triangular prisms; 2) Varied load resistances and spacing ratios were applied to explore the potential of improving the energy harvested by TTPT; and 3) Varied stiffness values, spacing ratios, and load resistances were considered and discussed to reveal the parameters that influenced the active power and efficiency of TTPT.
Experimental methods
Physical model
Test apparatus
The experimental tests described in this article were developed at the State Key Laboratory of Hydraulic Engineering Simulation and Safety (SKL-HESS) of Tianjin University. The flow velocity varied from 0.4 m/s to 1.40 m/s (41,521 ≤ Re ≤ 123,142) in the TrSL3 regime (Shao et al., 2018), and the corresponding reduced velocity range was 4.75 ≤ Ur ≤ 12.25, where Ur is defined as Ur = U/(D·fn). The two tandem prisms (upstream triangular prism (UTP) and downstream triangular prism (DTP)) were seated at two independent but identical systems, and the parameters are listed in Table 1.
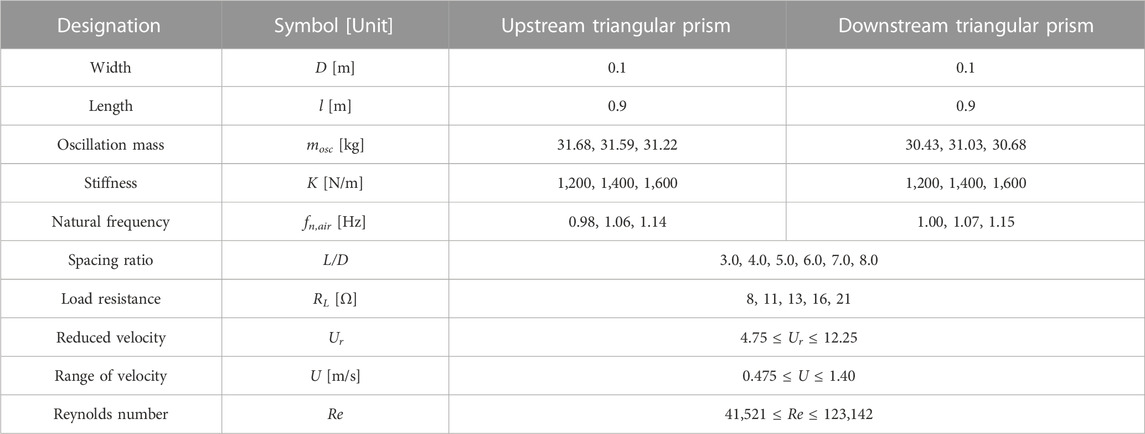
TABLE 1. Particulars of two triangular prisms in tandem.
The test apparatuses consisted of the oscillation and the energy conversion system. The two parts were equipped on the narrow flow channel, as shown in Figure 2. A pitot tube and differential pressure gauge were applied to ensure the accuracy of the flow velocity. The linear range of the differential pressure gauge was 0–6 kPa, and the sensitivity was 0.1%. An accuracy of ±0.1% met the accuracy requirement of the experimental tests. As the water acted on the triangular prisms, the prisms moved linearly, and the linear motion was transformed into a rotating motion to generate electricity by racks and gears in the energy conversion system, which allowed the generator to generate energy (Shao et al., 2020). All the electrical energy transformed through the signal line was consumed by the load resistance.
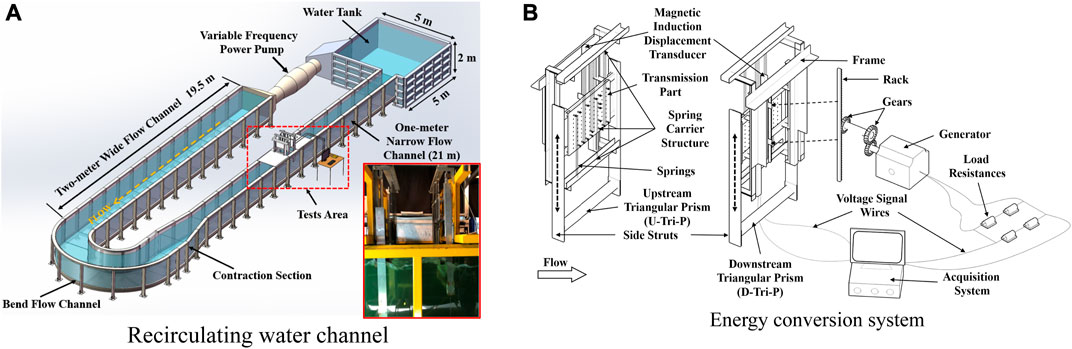
FIGURE 2. Physical model. (A) Recirculating water channel; (B) energy conversion system.
Triangular prisms
As seen in Figure 3A, the side length of the triangle was applied for the projection width (D = 0.1 m). The length of the prism was l = 0.9 m, and the thickness was d = 0.01 m. For the endplates installed, a thickness of 0.01 m was applied. To research the effect of the spacing ratio, varied distances (0.3 m, 0.4 m, 0.5 m, 0.6 m, 0.7 m, and 0.8 m) and corresponding spacing ratios (L/D = 3.0, 4.0, 5.0, 6.0, 7.0, and 8.0) were selected, as shown in Figure 3B.
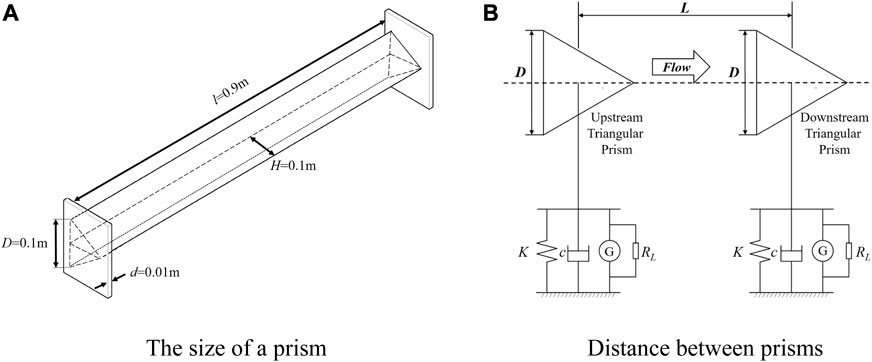
FIGURE 3. Triangular prisms. (A) Size of a prism; (B) distance between the prisms.
Data processing
In this article, a magnetic induction displacement transducer with a measurement of 800 mm was applied to collect the instantaneous displacement; the accuracy was 0.1% with an error range of ±0.05%. Two main parameters, the active power Pharn and the energy conversion efficiency ηharn, were used to evaluate the system. In order to illustrate the energy conversion characteristic, the output voltage u) was harvested within 60 s at 40 Hz.
The instantaneous power expression was calculated by the following equations:
where P(t) is the calculated power, u(t) is the measured voltage, and RL is the constant load resistance.
Active power can be defined as
where Pharn is the active power and T is the period.
Efficiency is defined as
where ηharn is the energy conversion efficiency, the Betz limit is 59.26%, and Pw is defined as
where ρ is the water density, U is the flow velocity, Amax is the maximum amplitude, D = 0.1 m, and L = 0.9 m.
The calculation formula for the natural frequency of the system is as follows:
where fn is the natural frequency of the system in the air, K is the stiffness, and mosc is the oscillation mass of the system.
The damping ratio of the system can be calculated by
where Ai is the ith peak amplitude and ζair is the damping ratio of the system in the air, which is derived as
Results and discussion
With varied load resistance, the total damping (Ctatol) and damping ratios (ζtotal) were tested by free decay tests, which are listed in Tables 2 and 3.
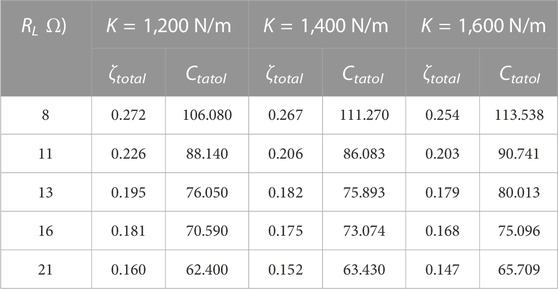
TABLE 2. System damping of the free decay test for the UTP.
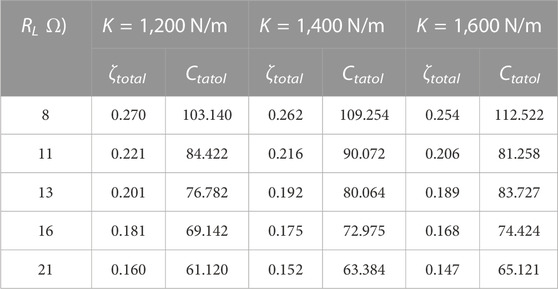
TABLE 3. System damping of the free decay test for the DTP.
Oscillation responses of TTPT
To further study the oscillation responses of TTPT, the FIM response curves for typical galloping, namely, hard galloping (HG) and soft galloping (SG),) were analyzed. The amplitude data were recorded at a 40-Hz sampling frequency and defined as the average of peak amplitudes within a continuous oscillation period. The frequency was obtained from the time history of displacement by the fast Fourier transform (FFT) method.
Typical HG responses
A constant load resistance (RL = 16 Ω) was selected to analyze the typical HG oscillation characteristics. In the range of 4.75 ≤ Ur ≤ 12.25, the single triangular prism goes into complete vortex-induced vibration (VIV) responses whether Ur increases or decreases. However, the UTP performs a complete oscillation from VIV to galloping, indicating that the UTP is affected by the DTP, as shown in Figure 4. The explanation is as follows:
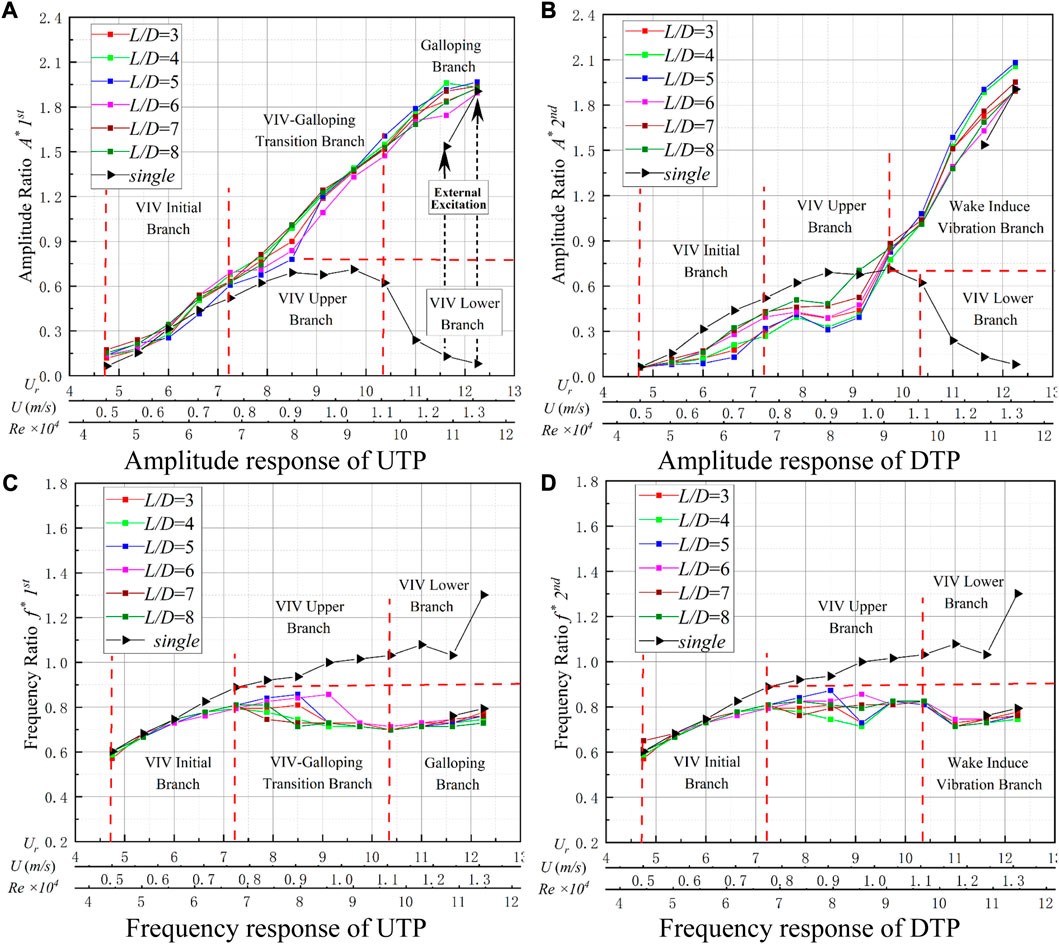
FIGURE 4. Amplitude and frequency responses for K = 1,400 N/m and RL = 16 Ω. (A) Amplitude response of the UTP; (B) amplitude response of the DTP, (C) frequency response of the UTP; and (D) frequency response of the DTP
For 4.75 ≤ Ur ≤ 7.25, the vibration performs the VIV initial branch, and the amplitude ratio (A*) and frequency ratio (f*) for the UTP and DTP increase gradually, performing a similar oscillation to a single triangular prism (STP). The A* values of the UTP with varied spacing ratios are close to but larger than those of the STP. In contrast, the DTP is inhibited by the UTP, and its A* value is smaller. The f* values of the two prisms are slightly smaller than that of the STP.
For 7.25 ≤ Ur ≤ 10.375, the A* of the UTP gradually increases with the flow velocity and performs significantly better oscillation than the A* of the STP. The maximum A* is approximately 1.60 for L/D = 4. At 7.25 ≤ Ur ≤ 9.125, the A* of the DTP fluctuates, indicating that unstable and suppressed oscillation exists. At Ur = 9.75, the A* of the DTP increases significantly and performs better oscillation than the A* of the STP. The f* of the UTP remains stable at approximately 0.72, which is slightly smaller than the f* of the STP, and the f* of the DTP remains at approximately 0.82, which is smaller than the f* of the STP.
As Ur ≥ 10.375, the UTP enters the galloping branch, with a large amplitude and low frequency. At Ur = 12.25, there exists the largest value of A* = 1.96 (L/D = 5), which is slightly larger than the STP (A* = 1.90). At the same time, the f* of the UTP is less than the f* of STP, which remains at 0.72–0.76. For Ur ≥ 9.75, the DTP was promoted by the UTP, and the A* of the DTP gradually increased with flow velocity, from 0.77 (L/D = 4) to 2.08 (L/D = 5). Additionally, for L/D = 5, the A* of the DTP (2.08) is larger than the A* of the UTP (1.96) and the A* of the STP (1.90) at Ur = 12.25. The f* of the DTP is also concentrated between 0.72 and 0.76, which indicates that the UTP has both an inhibitory effect on the DTP and a certain promoting effect in some working conditions.
To comprehensively illustrate the FIM response, the following discussions present the VIV initial branch, the VIV–galloping transition branch, and the galloping branch. The displacement time history and the spectra at Ur = 6.625 and L/D = 5 were analyzed. The two prisms have unstable displacement in general. The UTP has a larger oscillation than the DTP but less than the STP. As shown in Figure 5B, the dominant frequencies of two prisms are similar to but smaller than the frequencies of the STP.
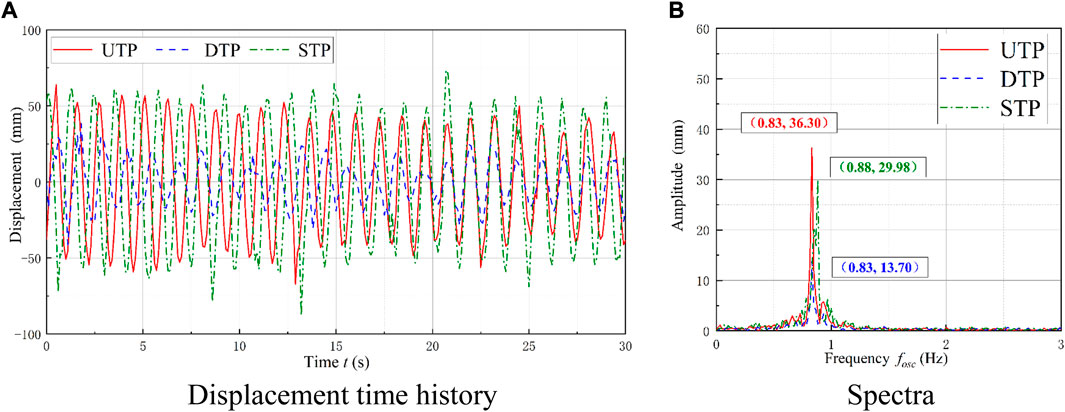
FIGURE 5. Comparison of displacement and spectra at the VIV initial branch. (A) Displacement time history; (B) spectra.
The case of Ur = 8.5 and L/D = 5 was selected to analyze the oscillation responses at the VIV–galloping transition branch. The two prisms have stable displacement, but the DTP has a lower amplitude than the UTP and the STP, as shown in Figure 6A. Two small peaks appear on both sides of the dominant frequency of the UTP, indicating that the oscillation of the UTP is affected by external factors. The reason may be related to the vortex shedding from the UTP onto the DTP. Due to the good co-movement, the two tandem prisms have the same dominant frequency. The dominant frequency of the STP is 1.01 Hz on the upper branch, similar to the natural oscillation frequency of the system. The “lock-in” phenomenon is observed, as shown in Figure 6B.
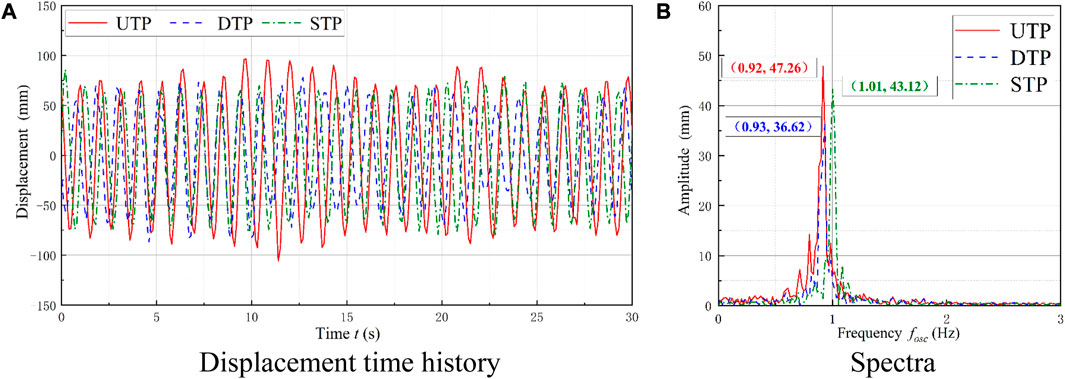
FIGURE 6. Comparison of displacement and spectra at the VIV-galloping transition branch. (A) Displacement time history; (B) spectra.
The case of Ur = 12.25 and L/D = 5 was selected to analyze the oscillation characteristics of the galloping branch. The displacement of the two tandem prisms has a stable high value, while the amplitudes are close to that of the STP, as shown in Figure 7A. The dominant frequency of the two prisms is consistent and prominent, indicating that energy is concentrated. This frequency is close to that of the STP, as shown in Figure 7B, which illustrates that mutual interferences between the two prisms are reduced, and the oscillations are similar to those of the STP.
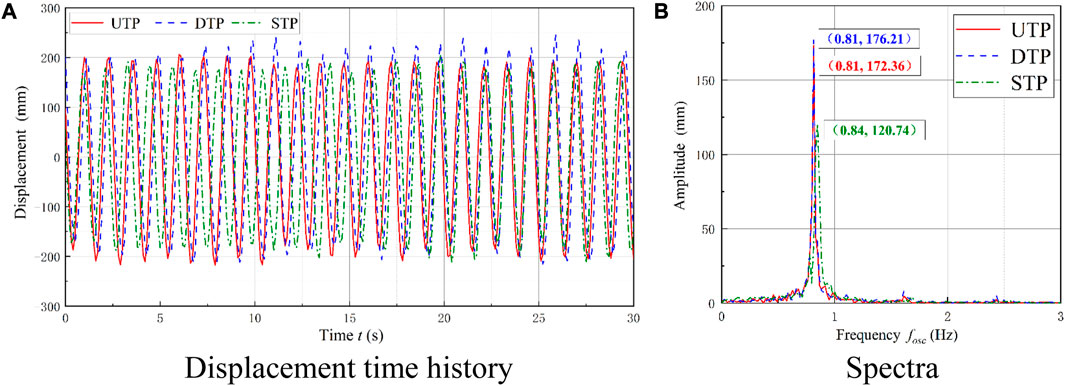
FIGURE 7. Comparison of displacement and spectra at the galloping branch. (A) Displacement time history; (B) spectra
In summary, the oscillation of the UTP is improved at hard galloping. In contrast, the oscillation of the DTP is inhibited at Ur ≤ 9.125. At Ur ≥ 9.75, the DTP enters the wake-induced vibration branch, wherein the amplitude increases and gradually approaches the amplitude of the STP. The violent oscillation in the galloping branch may cause the energy to be concentrated, which results in efficient energy harvesting.
Typical SG responses
A constant load resistance was selected at RL = 21 Ω to analyze SG oscillation. In the tests, the oscillation characteristics of the UTP are very close to those of the STP. The DTP is disturbed by the UTP, affecting the oscillation responses. Particularly at smaller L/D, there is a negative effect on A*. The evident suppression can be observed for Ur ≤ 8.5, and oscillation is enhanced under the condition of high flow velocity (Ur ≥ 8.5), as shown in Figure 8. The explanation is as follows:
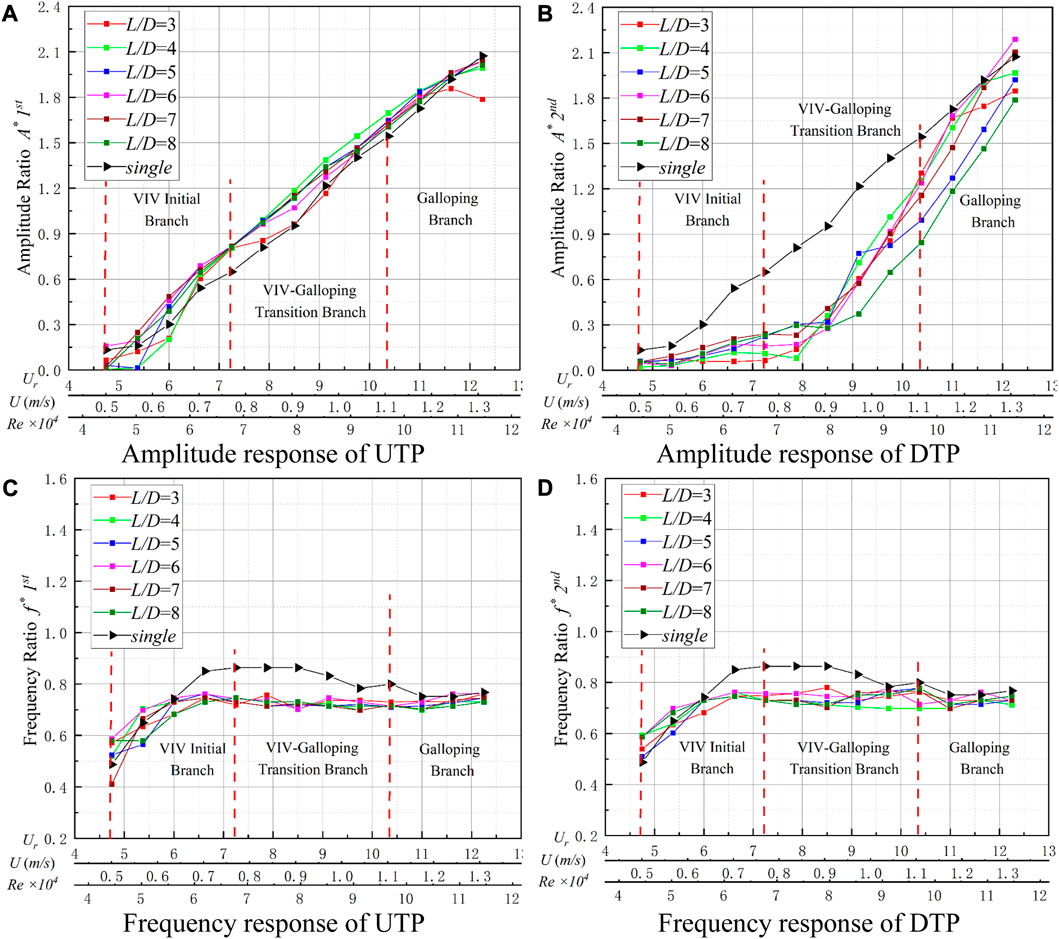
FIGURE 8. FIM responses for K = 1,400 N/m and RL = 21 Ω. (A) Amplitude response of the UTP; (B) amplitude response of the DTP; (C) frequency response of the UTP; and (D) frequency response of the DTP
For 4.75 ≤ Ur ≤ 7.25, the oscillation performs as the initial branch of VIV, and the responses of the UTP perform as they do in typical hard galloping. The suppression of the DTP becomes more prominent, and the A* is generally smaller than 0.3, as shown in Figure 8B. As the flow velocity increases, the frequency ratio (f*) gradually increases to 0.72–0.86, as shown in Figure 8D. For 7.25 ≤ Ur ≤ 10.375, the UTP transforms into a VIV–galloping transition branch; as the flow velocity increases, the A* can reach approximately 1.65 (L/D = 4). The f* of the UTP stabilizes at approximately 0.72, slightly smaller than the f* of the STP. The oscillation of the DTP is suppressed, and the A* is low. At Ur = 7.875, the amplitude of the DTP starts to increase; the smaller spacing ratio and higher amplitude have a stronger promoting effect. However, the amplitude ratio of A* is still significantly less than the A* of the STP, which varies from A* = 0.08 (L/D = 3) to A* = 1.30 (L/D = 3). The frequency ratio varies between 0.756 (L/D = 6) and 0.786 (L/D = 3). At Ur ≥ 10.375, the UTP enters the galloping branch, where A* continues to increase with increasing flow velocity. The maximum value reaches A* = 2.08 (L/D = 6), which is slightly smaller than A* = 2.10 for the STP. The f* of the UTP decreases to 0.72–0.76 gradually, which is smaller than the f* of the STP. At Ur ≥ 10.375, the amplitude of the DTP rises sharply, ranging between 0.84 D and 2.18 D. The maximum value A* = 2.18 for the DTP is larger than A* = 2.08 for the DTP, and A* = 2.10 for the DTP, which indicates the DTP is positively promoted. The f* of the two tandem prisms maintains the same value and is stabilized between 0.72 and 0.76, which is smaller than the f* of the STP. The results show that the UTP not only inhibits the DTP but also promotes the DTP in some working conditions.
To further describe the FIM responses for each branch with SG oscillation, the three typical branches were analyzed through the characteristic indicators of the oscillation (time history of displacement and spectra).
To analyze the oscillation characteristics of the VIV initial branch, the case of Ur = 6.625 (L/D = 5) was selected, which is similar to the initial HG branch. The time history of displacement and dominant frequency are shown in Figure 9.
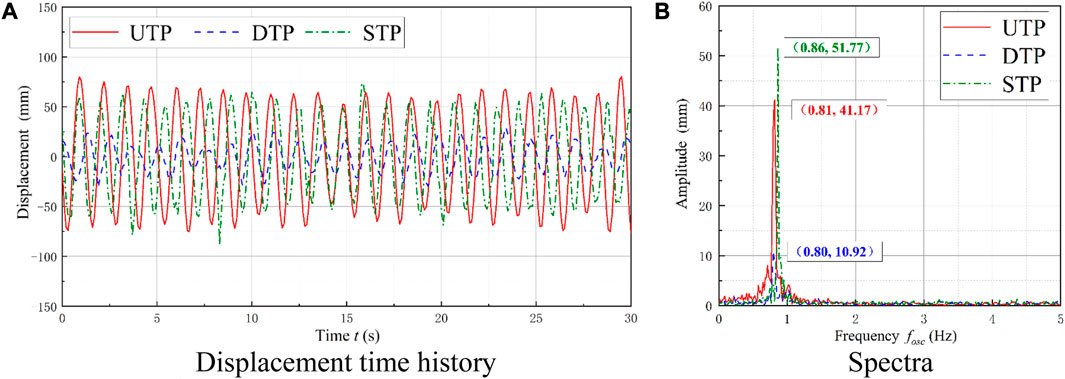
FIGURE 9. Comparison of displacement and spectra at the VIV initial branch. (A) Displacement time history; (B) spectra.
To analyze the oscillation characteristics of the VIV–galloping transition branch, the case of Ur = 9.125 and L/D = 5 was selected. The UTP and STP have stable displacement time histories, but the DTP fluctuates widely, and the oscillation is unstable. In contrast, the UTP has a larger amplitude, as shown in Figure 10A. The two prisms have the same dominant frequency, and the frequency band is narrow with good co-movement, indicating that energy is concentrated. However, the frequency is smaller than that of the STP, as shown in Figure 10B.
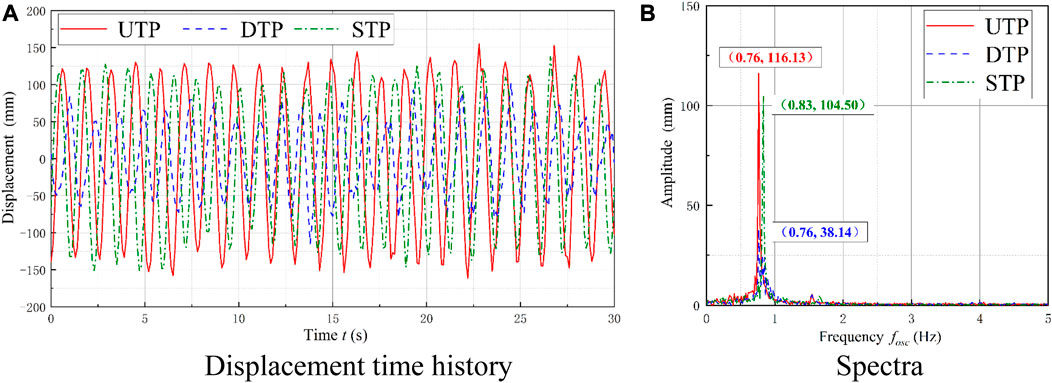
FIGURE 10. Comparison of displacement and spectra at the VIV-galloping transition branch. (A) Displacement time history; (B) spectra.
To analyze the oscillation characteristics of the galloping branch, the case of Ur = 11 and L/D = 5 is presented. The characteristics of two tandem prisms are very stable and closed, as shown in Figure 11.
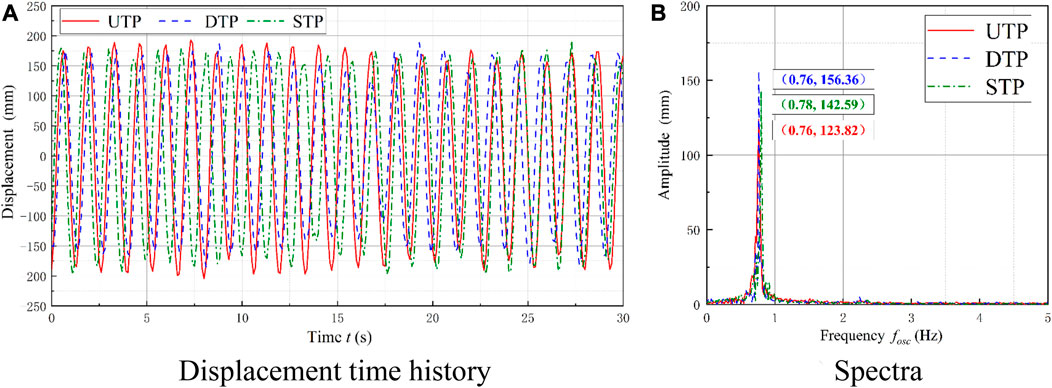
FIGURE 11. Comparison of displacement and spectra at the galloping branch. (A) Displacement time history; (B) spectra.
The oscillation characteristics of each SG branch are very similar to those of HG branches. In general, the UTP behaves like the STP, and the responses of the DTP suppress performance. The frequencies of SG in different branches are less than those of HG.
Co-movement of TTPT
In the experimental tests for TTPT, a significant phase difference exists between the two prisms, which fluctuates with varied spacing ratio and reduced velocity.
The instantaneous phase is defined as
where Phase(t) is the phase of the i + 1th peak value of displacement and Peak(i) is the time of the ith peak (i = 1,2,3 … ).
The Phase difference is defined as
where Phase difference(t) is the phase difference between two prisms; Phase1(t) and Phase2(t) are the instantaneous phases of the UTP and the DTP, respectively.
Effect of the spacing ratio on the phase difference
A phase difference between two tandem prisms was present, based on the displacement time history within a continuous 60 s. The typical cases of Ur = 12.25, RL = 16 Ω, and K = 1600 N/m at 3 ≤ L/D ≤ 8 were selected to analyze the effect of space on the phase difference. With varied spacing ratios, various phase differences appeared between the two tandem prisms.
For 3 ≤ L/D ≤ 5, the shedding vortex from the UTP has a large influence on the oscillation of the DTP. For L/D = 3 and L/D = 5, an advanced oscillation phase of 6π can be observed at the DTP. At L/D = 4, the phase difference between the two prisms increases to 14π, as shown in Figure 12. Surprisingly, at L/D = 5, the phase difference is 6π in 60 s. The phase difference during 0–15 s and 35–50 s did not change linearly but remained stable, indicating that the co-movement was good in these two periods. However, the phase difference was linear between 15 s and 35 s and between 50 s and 60 s, which indicates that the oscillation of the DTP may have been disturbed, as shown in Figure 12C. The vortex shedding from the UTP affects the DTP, and the effect varies significantly with different spacing ratios, which proves that the spacing ratio has a strong influence on the oscillation responses of the prisms.
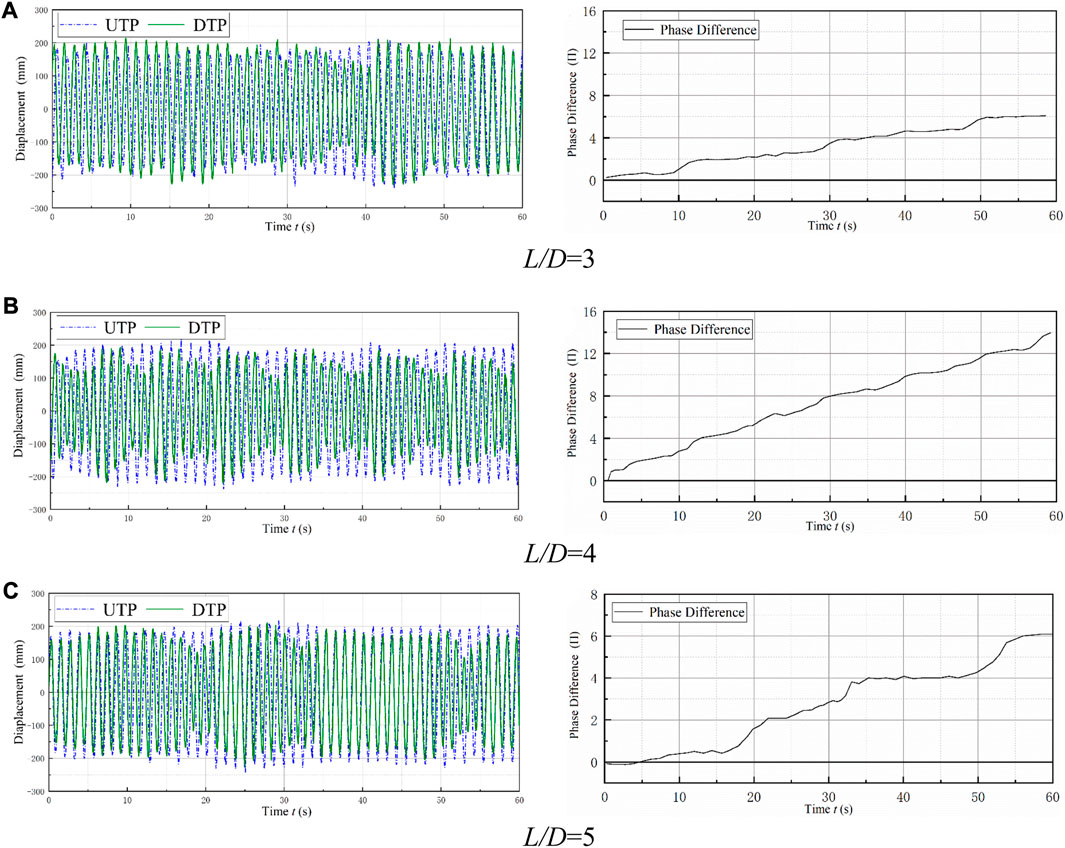
FIGURE 12. Displacement time history and phase difference of the two prisms (3 ≤ L/D ≤ 5). (A) L/D = 3; (B) L/D = 4; (C) L/D = 5.
For 6 ≤ L/D ≤ 8, although the phase difference fluctuates, the phase difference varies within 2π. Thus, the oscillations and phase differences of the two tandem prisms are stable within a certain spacing ratio, as shown in Figure 13.
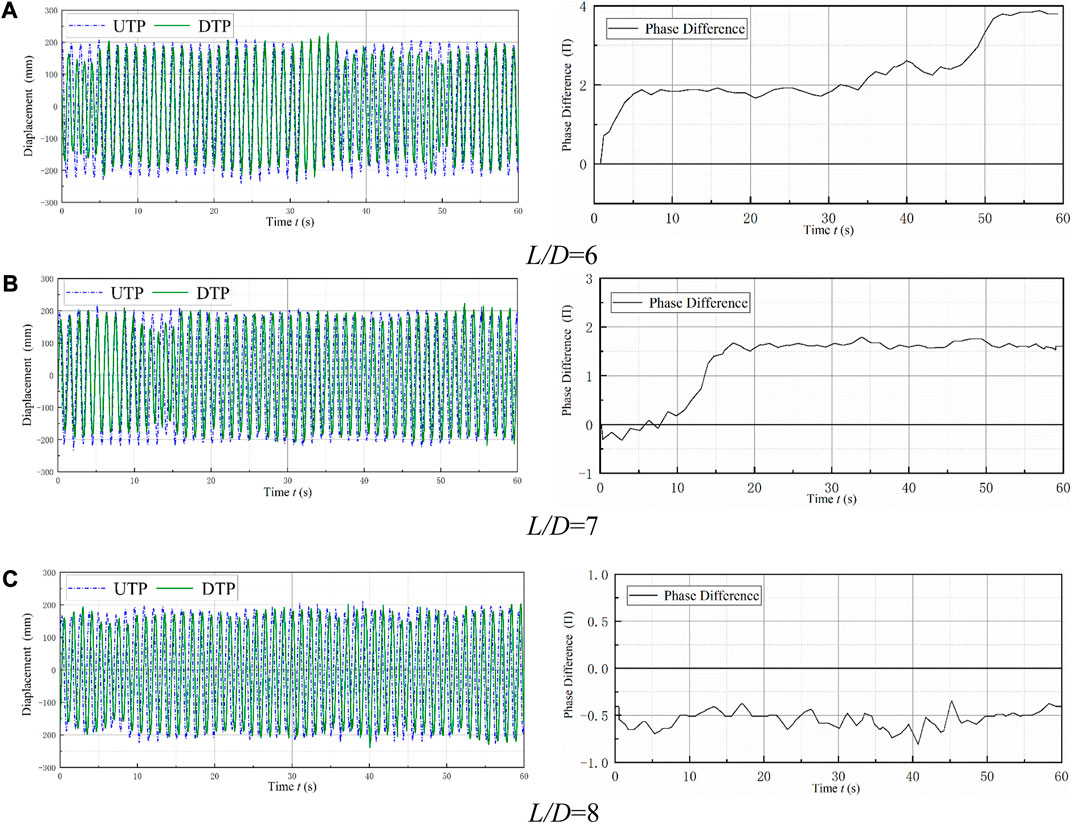
FIGURE 13. Displacement time history and phase difference of the two prisms (6 ≤ L/D ≤ 8). (A) L/D = 6; (B) L/D = 7; (C) L/D = 8.
Effect of reduced velocity on the phase difference
To analyze the phase differences with varied reduced velocity, the case of L/D = 8, RL = 16 Ω, and K = 1600 N/m with 8.5 ≤ Ur ≤ 12.25 was selected. At Ur = 8.5, the amplitude of the UTP is approximately 100 mm, the amplitude of the DTP is small and fluctuates widely, and the oscillation is very unstable, as shown in Figure 14A.
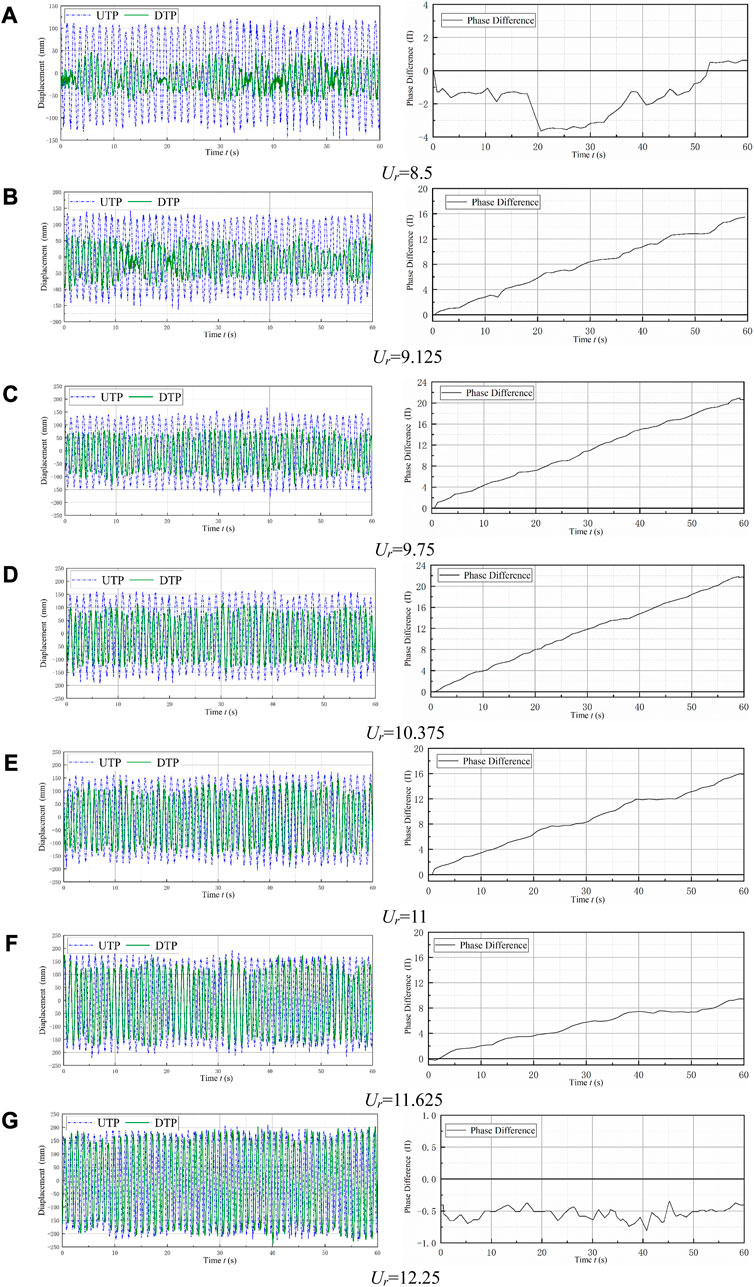
FIGURE 14. Displacement time history and phase difference of the two prisms (8.5 ≤ Ur ≤ 12.25). (A) Ur = 8.5; (B) Ur = 9.125; (C) Ur = 9.75; (D) Ur = 10.375; (E) Ur = 11; (F) Ur = 11.625; and (G) Ur = 12.25.
For 9.125 ≤ Ur ≤ 11.625, the phase difference between the two tandem prisms increases linearly. At Ur = 9.125, an advanced phase of 16π can be observed at the DTP, as shown in Figure 14B. For Ur = 9.75, the oscillation phase increases to 20π, as shown in Figure 14C. At Ur = 10.375, the oscillation phase continues to increase to 22π, as shown in Figure 14D. However, the oscillation phase begins to decrease to 16π when Ur = 11, as shown in Figure 14E. For Ur = 11.625, the oscillation phase decreases to 10π, as shown in Figure 14F. In the displacement diagram, the peak value of displacement for the UTP is generally larger. At Ur = 12.25, the oscillation phase and amplitude of the two tandem prisms are close, and the phase difference is π/4, as seen in Figure 14G. This similarity is very important for the co-movement energy conversion of multi-prisms.
The results show that the phase difference decreases with increasing velocity at a constant spacing ratio, which is caused by the varied velocity of the shedding vortex. As the reduced velocity increases, the effect of the vortex shedding from the UTP becomes weaker, so the phase difference continues to decrease.
To sum up, the oscillation of two tandem prisms is affected by the size of the prism, the flow velocity, and other factors. Generally, significant co-movement exists at 6 ≤ L/D ≤ 8. With increasing reduced velocity, the phase difference between the two prisms decreases gradually. The oscillation coupling mechanism is conducive to power generation and promotes the harvesting property of the system.
Energy conversion analysis
Overall analysis
The energy conversion property for TTPT is discussed in this section. The range of parameters selected are K = 1400 N/m, 3 ≤ L/D ≤ 8, and 8 Ω ≤ RL ≤ 21 Ω. The active power (Pharn) of the two prisms is summarized in Figure 15A, and the energy conversion efficiency (ηharn) of the two prisms is presented in Figure 15B. In general, the flow velocity U has promotional effects on Pharn. However, Pharn and ηharn increase and decrease. Ur is defined as Ur = U/(D·fn) for 4.75 ≤ Ur ≤ 12.25. For RL = 8 Ω, the Pharn and ηharn of the system are low and fluctuate at different spacing ratios. While Ur = 10.375, the optimal active power is 4.85 W (L/D = 5), and the corresponding efficiency is 3.03%. As flow velocity increases, Pharn becomes unstable in the VIV lower branch (97,039 ≤ Re ≤ 114,576 for K = 1,400 N/m), then it increases to 6.50 W (L/D = 5) at Ur = 12.25 with an efficiency of 2.07%, as shown in Figure 15. The reason is that the DTP is accelerated by the wake shedding of the UTP.
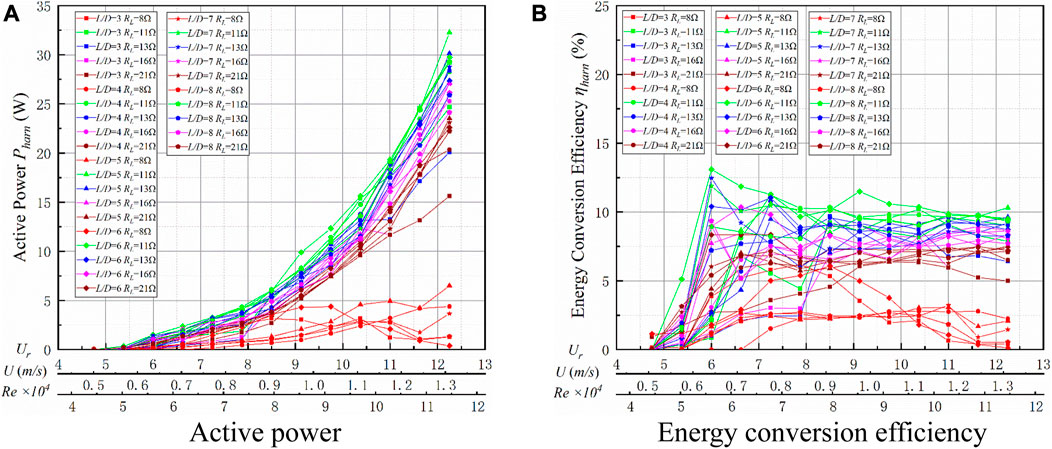
FIGURE 15. Energy conversion of TTPT (K = 1,400 N/m). (A) Active power; (B) energy conversion efficiency.
For 11 Ω ≤ RL ≤ 21 Ω, in the VIV region, the local maximum Pharn and ηharn appear at Ur = 10.375, with 15.63 W (L/D = 6) and ηharn = 10.06%. The optimal load resistances (RL) of Pharn exist for TTPT. At RL = 11 Ω, there is the best performance for L/D = 5–7 of the Pharn in the galloping branch, and the DTP is disturbed by the UTP. The local maximum Pharn and ηharn occur at Ur = 12.25; the optimal Pharn is 32.24 W (L/D = 5), and the corresponding efficiency is 10.31%.
Energy conversion for upstream and downstream prisms
To completely describe the energy conversion for TTPT, two working conditions of hard galloping (L/D = 5, RL = 13 Ω) and soft galloping (L/D = 7, RL = 21 Ω) were selected for analysis.
1) Hard galloping. With increasing flow velocity, the Pharn of the STP first increases and then begins to decrease. At Ur = 12.25, external excitation is applied on the STP, and hard galloping occurs, accompanied by Pharn rising sharply, as shown in Figure 16A. At Ur ≤ 9.125, the Pharn and ηharn of the UTP and the DTP are smaller than those of the STP. At Ur ≥ 9.75, the Pharn of the UTP starts to increase gradually and does not show the downtrend seen in the STP. For Ur ≥ 10.375, the Pharn values of the two prisms are larger than that of the STP, as shown in Figure 16C. In addition, the Pharn of the UTP (16.70 W) is larger than those of the UTP (13.43 W) and the STP (15.47 W). At Ur = 12.25, the corresponding ηharn of the STP (5.63%) is larger than those of the UTP (5.29%) and the DTP (4.25%). The total Pharn value of the two tandem prisms (30.13 W) is 1.95 times larger than that of the STP (15.47 W), while the total ηharn of the two tandem prisms (9.54%) is 1.69 times larger than that of the STP (5.63%), as shown in Figure 16.
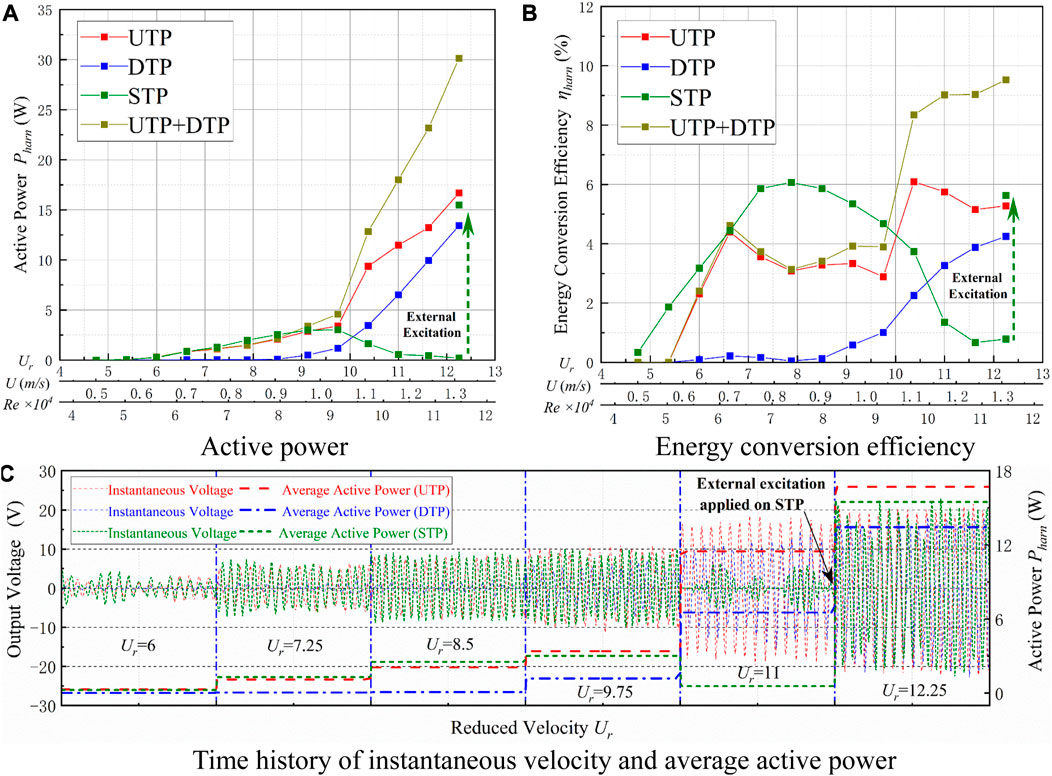
FIGURE 16. Energy conversion for L/D = 5. (A) Active power; (B) energy conversion efficiency; and (C) time history of instantaneous velocity and average active power.
2) Soft galloping. The Pharn values of all three prisms increase gradually as the flow velocity increases. The Pharn values for the two tandem prisms are similar to that of the STP, but the Pharn of the DTP is always smaller than that of the STP. For Ur ≤ 8.5, the Pharn and ηharn of the UTP increase more than those of the STP. At Ur ≥ 9.125, the STP has a larger Pharn than the two tandem prisms, as shown in Figure 17C. In addition, the Pharn of the STP (13.20 W) is better than those of the UTP (11.82 W) and the DTP (11.29 W). At Ur = 12.25, the corresponding ηharn of the STP (4.16%) is larger than those of the UTP (3.78%) and the DTP (3.61%). The total Pharn value of the two tandem prisms (23.11 W) is 1.75 times larger than that of the STP (13.20 W), while the ηharn of the two tandem prisms (7.39%) is 1.78 times larger than that of the STP (4.16%).
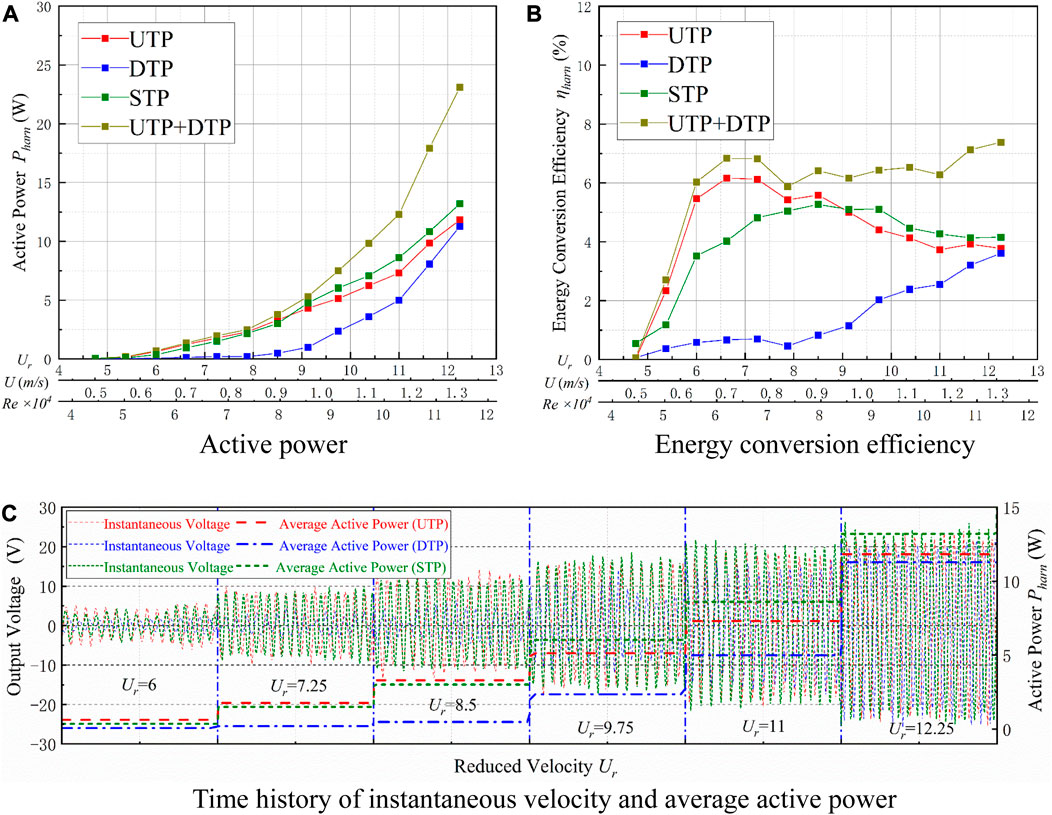
FIGURE 17. Energy conversion for L/D = 7. (A) Active power; (B) energy conversion efficiency; and (C) time history of instantaneous velocity and average active power.
It is clear that both inhibition and promotion exist between the two tandem prisms during HG and SG. Compared with the STP, the energy conversion of two tandem prisms has been significantly improved.
Effects of parameters on energy conversion
Pharn and ηharn vary with parameters, including the load resistances (RL), the stiffness (K), and the spacing ratio (L/D), and they are analyzed systematically in this section. The influencing parameters are listed in Table 4.
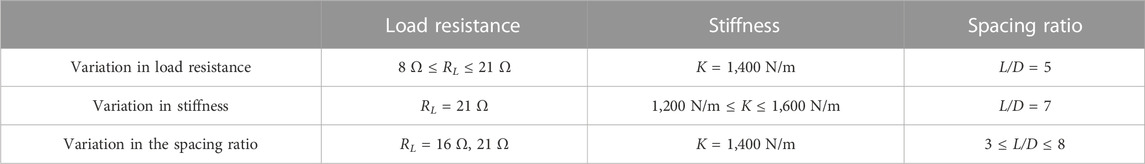
TABLE 4. Parameters for energy conversion.
Effect of spring stiffness
(a) For the UTP, the curves of Pharn and ηharn are shown as functions of K in Figure 18. The maximum Pharn reaches 12.65 W for K = 1,600 N/m (Ur = 12.25), and the corresponding ηharn = 3.12%. The Pharn values of larger stiffnesses are close and larger than that of K = 1,200 N/m. The variation trend of ηharn is different from that of the Pharn curve. The ηharn values of stiffnesses K = 1,400 N/m and K = 1,200 N/m are close and larger than that of K = 1,600 N/m. The maximum ηharn = 7.30%, which occurs at K = 1,400 N/m, can be clearly observed at Ur = 6.625, and a downtrend in ηharn can be seen at Ur ≥ 6.625.
(b) The DTP starts to output power at Ur = 8.5 for the three stiffness values. The maximum Pharn reaches 11.29 W at Ur = 12.25 for K = 1,400 N/m, corresponding to ηharn = 3.61%. At Ur ≥ 8.5, the energy generation of the system gradually increases, and the active power curves of the two conditions of K = 1,400 N/m and K = 1,600 N/m are nearly identical and larger than that of K = 1,200 N/m. The efficiency curves of the DTP show a similar trend to those of the UTP. For the galloping branch, the ηharn of K = 1,400 N/m gives the best results of the three stiffness values. It can be concluded that the case of K = 1,400 N/m has stable and efficient energy conversion.
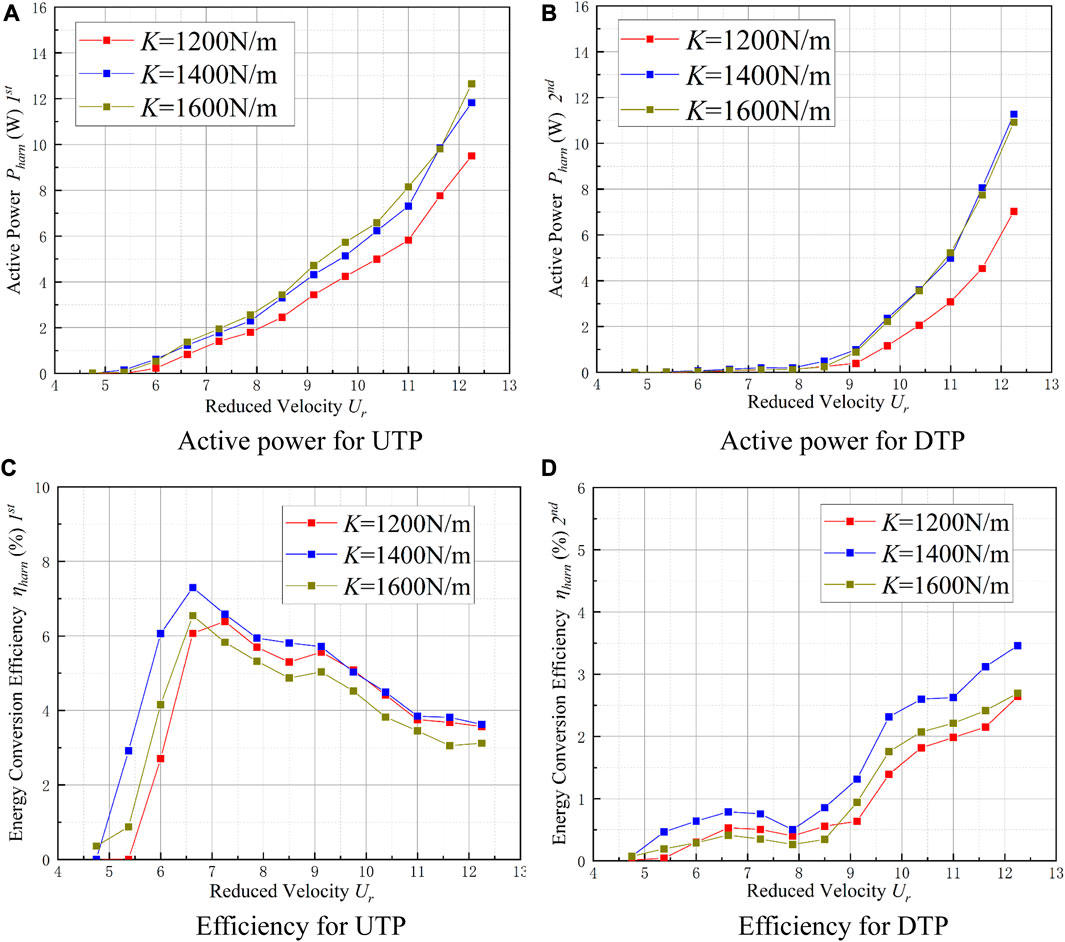
FIGURE 18. Energy conversion of TTPT at varied stiffness. (A) Active power from the UTP; (B) active power from the DTP; (C) efficiency of the UTP; and (D) efficiency of the DTP.
Effect of load resistance
In practical application, the varied load resistance has a significant effect on the energy conversion characteristic, and, within a certain range, the smaller the load resistance, the greater the damping of the system and the larger the energy output of the system.
For RL = 8 Ω, the UTP shows complete VIV. Pharn first increases and then decreases, and the optimal power Pharn = 2.10 W appears at Ur = 9.75 with a corresponding efficiency of ηharn = 2.42%. At Ur ≥ 10.375, the DTP is clearly positively promoted. The active power has a peak value of Pharn = 5.97 W, which appears at Ur = 12.25, corresponding to an efficiency of ηharn = 3.30%.
For both prisms, as the load resistances decrease, the Pharn and ηharn increase considerably for 11 Ω ≤ RL ≤ 21 Ω, as shown in Figure 19. For the UTP, the Pharn varies from 11.98 W (RL = 21 Ω) to 18.19 W (RL = 11 Ω) at Ur = 12.25, and the Pharn of the DTP changes from 11.54 W to 14.05 W. As the load resistances decrease, the rules of energy conversion efficiency suggest that ηharn is similar to active power (Pharn). Among them, the maximum ηharn of the UTP appears at Ur = 6–6.25, and the optimal efficiency of the UTP is in the range of 6.47% (RL = 16 Ω) ∼ 9.68% (RL = 11 Ω). The ηharn of the DTP changes smoothly, but efficiency is generally less than 5%. The varied load resistance causes different damping in the system. A smaller load resistance can promote better energy harvesting due to the increased damping; however, it may cause a strong damping force to suppress the oscillation of the prisms, which indicates poor energy conversion. The Pharn and ηharn of RL = 11 Ω are significantly larger than other load resistances, indicating that the optimal load resistance is RL = 11 Ω.
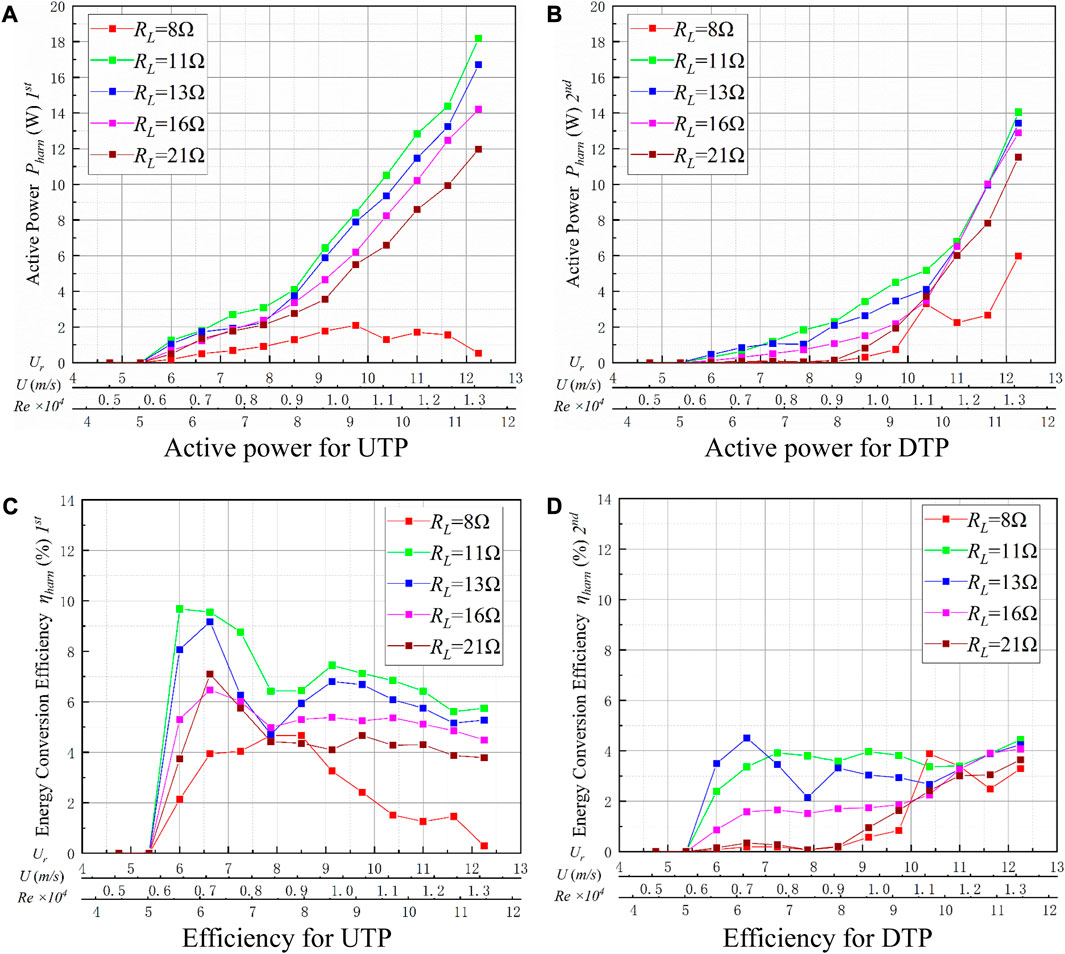
FIGURE 19. Energy conversion of TTPT at varied load resistances. (A) Active power from the UTP; (B) active power from the DTP; (C) efficiency of the UTP; and (D) efficiency of the DTP.
Effect of the spacing ratio
Hard galloping
The load resistance of RL = 16 Ω was selected to analyze the energy conversion of hard galloping. For Ur ≤ 8.5, the Pharn of TTPT has a similar value, and the active power curves are also interleaved with varied space. In general, the optimal spacing ratio is L/D = 8. At Ur ≥ 9.125, the VIV phenomenon of the STP does not occur on the UTP. As the flow velocity increases, the Pharn of the UTP increases gradually to a larger value than the Pharn of the STP. The active power curves of different spacing ratios are very similar, and the cases of L/D = 3 and L/D = 8 have smaller Pharn than other conditions, as shown in Figure 20. A peak active power can be observed at Pharn = 14.69 W (L/D = 6); the corresponding efficiency is ηharn = 4.50%. At Ur ≤ 9.75, Pharn becomes suppressed, and the DTP is disturbed by the UTP. For Ur ≥ 10.375, the power output of the DTP is larger than the power output of the STP. At Ur = 12.25, the maximum output power for the DTP is Pharn = 12.89 W (L/D = 5), and the corresponding efficiency is ηharn = 3.98%, which is less than that of the DTP (14.42 W, 4.0%).
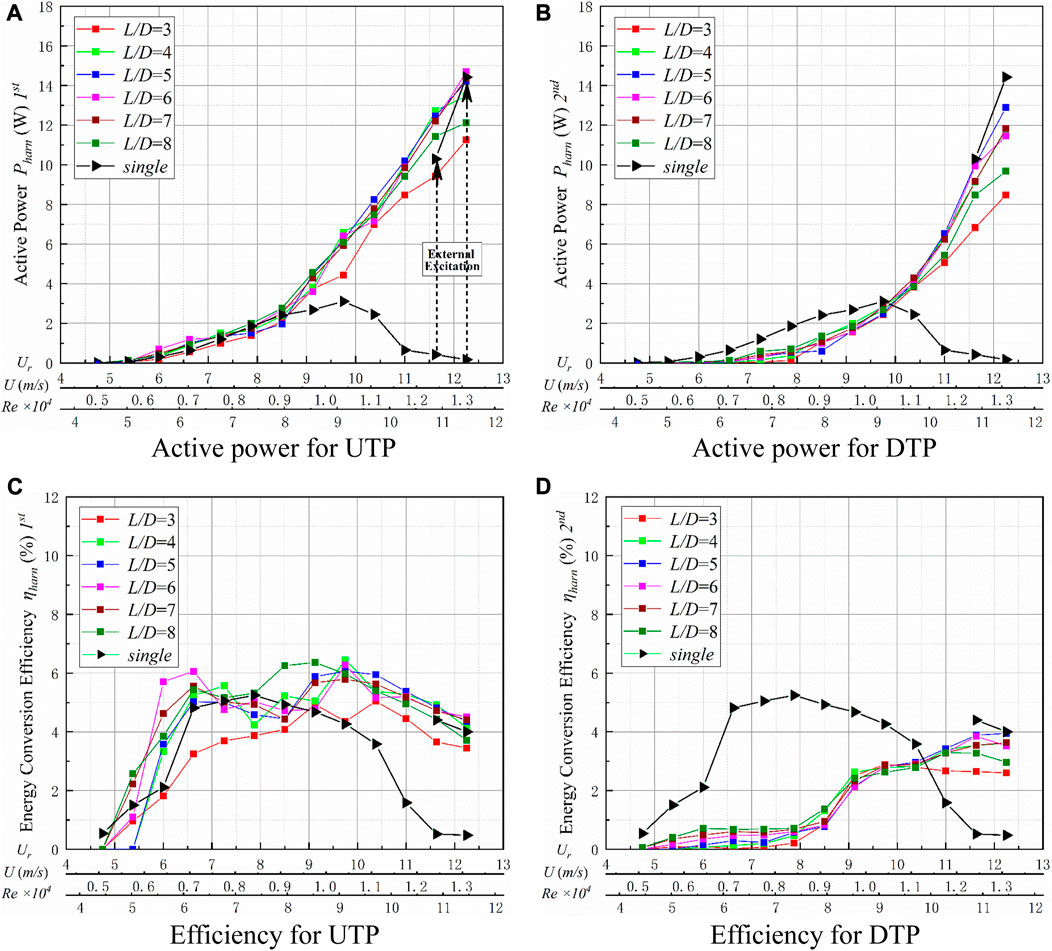
FIGURE 20. Energy conversion of TTPT at varied spacing ratios. (A) Active power from the UTP; (B) active power from the DTP; (C) efficiency of the UTP; and (D) efficiency of the DTP.
Soft galloping
With increasing flow velocity, the Pharn of the UTP increases slightly to a similar value to that of the STP as long as Ur ≤ 8.5. There is a slight difference between the values from the different spacing ratios. In addition, for Ur ≥ 9.125, the STP has a larger Pharn than the UTP. The optimal active power is Pharn = 11.95 W (L/D = 5) for the UTP, and the corresponding efficiency is ηharn = 3.67%. A little suppression can be observed in the DTP, which may be caused by the disruption of flow between the two tandem prisms. The Pharn and ηharn of the DTP are not as high as those of the UTP. The DTP begins to output power at Ur = 8.5, but the energy is small, and the Pharn of the DTP is inhibited and smaller than that of the two prisms. For the DTP, the overall performance of L/D = 5 is the best, as shown in Figure 21.
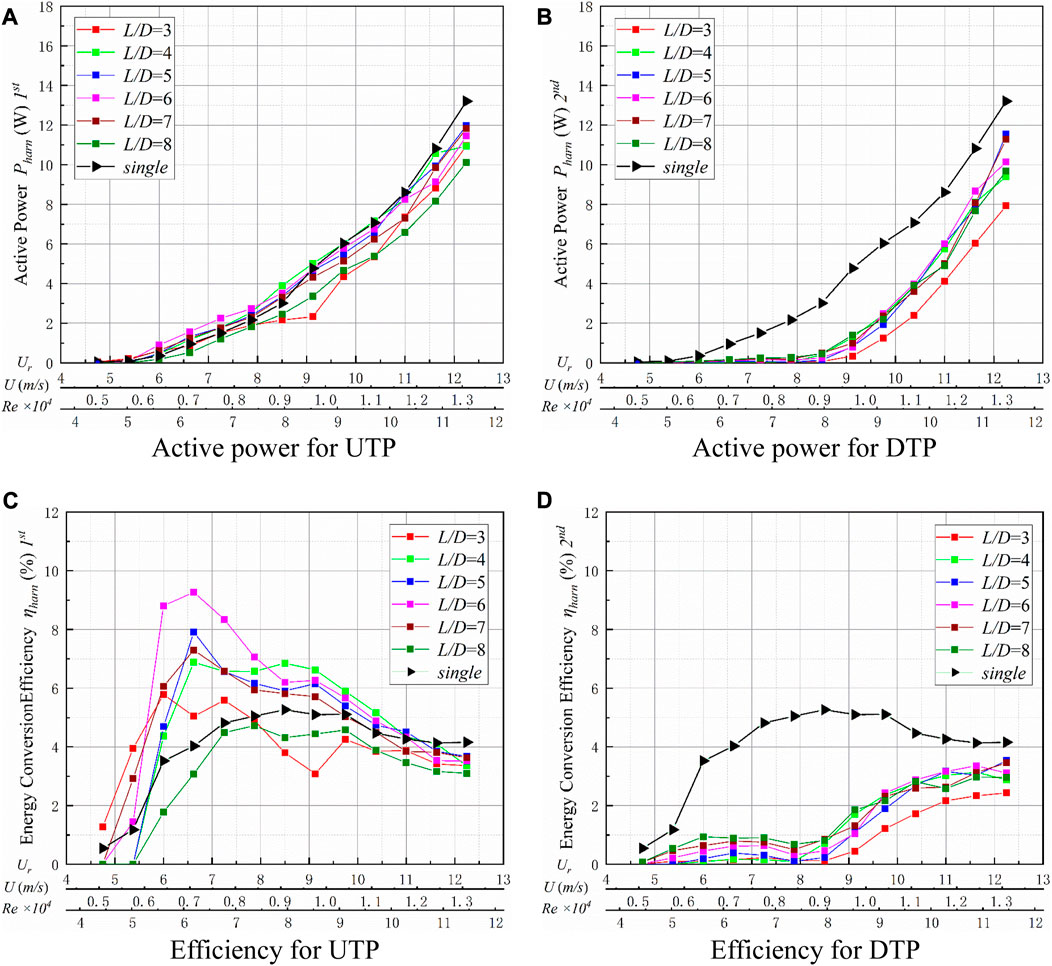
FIGURE 21. Energy conversion at varied spacing ratios (RL = 21 Ω and K = 1,400 N/m). (A) Active power from the UTP; (B) active power from the DTP; (C) efficiency of the UTP; and (D) efficiency of the DTP.
Conclusion
The FIM responses and energy conversion of two tandem triangular prisms were studied experimentally. Varied spring stiffness, load resistance, and spacing ratio with Reynolds numbers of 41,521 ≤ Re ≤ 123,142 were applied, and the flow velocity was kept at 0.4 m/s ≤ U ≤ 1.40 m/s. The optimal active power was tested, and the effects of spring stiffness, load resistance, and spacing ratio were discussed. Conclusions are summarized as follows:
(1) The results of oscillation tests show that the amplitude and frequency of the two tandem prisms have similar values. The oscillation of the DTP may be inhibited by the shedding vortex of the UTP, and the A* of the DTP is generally less than 0.3, at U ≤ 1 m/s. With increasing flow velocity, the amplitude of the DTP gradually increases; meanwhile, the amplitude and frequency tend to be close to those of the STP.
(2) The phase difference for the two prisms shows that for 6 ≤ L/D ≤ 8, the vortex shedding of the UTP has a large influence on the FIM responses of the DTP; the two tandem prisms have very similar frequencies, and the phase difference is stable. For other spacing ratios, there exist advanced oscillation phases for DTP than UTP. In addition, the phase difference will reduce gradually more than a certain critical speed.
(3) For the tested values, the total active power for the two tandem prisms (30.13 W) is up to 1.95 times than the STP (15.47 W) in a galloping branch (RL = 13 Ω and Ur = 12.25). The DTP has a positive effect on the UTP, and the active power increased by 7.95% compared to the STP (Ur = 12.25, K = 1,400 N/m, L/D = 5, and RL = 13 Ω). The highest active power Pharn = 32.24 W occurs at Ur = 12.25 for K = 1,400 N/m, L/D = 5, and RL = 11 Ω, corresponding to the efficiency ηharn = 10.31%.
(4) The analysis results of the parameter effect on energy conversion show that the optimal stiffness of energy conversion is K = 1400 N/m, and the output power is stable and efficient. The variation of load resistance has a significant influence on the system’s energy harvesting. In the tests, the smaller the load resistance value is, the more energy will be harvested, and the optimal load resistance is RL = 11 Ω. For varied spacing ratios, the UTP is generally promoted, and the DTP is generally inhibited because of the interaction between the two tandem prisms. The results show that the case of L/D = 5 has the optimal performance among the spacing ratios tested.
Data availability statement
The original contributions presented in the study are included in the article/Supplementary Material; further inquiries can be directed to the corresponding author.
Author contributions
Analysis of data, NS; development of primary manuscript draft, NS and GX; critical reading of the manuscript for important intellectual content and approval of the final manuscript, GX and ZW; project conceptualization and lead, NS and FL; development of the data analysis plan, XY and XW; writing—review and editing, ZW and XY. All authors contributed to the article and approved the submitted version.
Funding
This research was supported by the State Key Laboratory of Hydraulic Engineering Simulation and Safety, Tianjin University (Grant No. HESS-2202); the Hebei Natural Science Foundation (Grant No. E2022402074); the Science and Technology Project of Hebei Education Department (Grant No. BJK2023099); the Foundation for Innovative Research Groups of the Natural Science Foundation of Hebei Province (Grant No. E2020402074); and the National Natural Science Foundation of China (Grant No. U20A20316).
Acknowledgments
All workers from the State Key Laboratory of Hydraulic Engineering Simulation and Safety of Tianjin University are acknowledged. The authors are also grateful for the assistance of the reviewers.
Conflict of interest
The authors declare that the research was conducted in the absence of any commercial or financial relationships that could be construed as a potential conflict of interest.
Publisher’s note
All claims expressed in this article are solely those of the authors and do not necessarily represent those of their affiliated organizations, or those of the publisher, the editors, and the reviewers. Any product that may be evaluated in this article, or claim that may be made by its manufacturer, is not guaranteed or endorsed by the publisher.
References
Alam, M. M., Moriya, M., and Sakamoto, H. (2003b). Aerodynamic characteristics of two side-by-side circular cylinders and application of wavelet analysis on the switching phenomenon. J. Fluid Struct. 18 (3-4), 325–346. doi:10.1016/j.jfluidstructs.2003.07.005
Alam, M. M., Moriya, M., Takai, K., and Sakamoto, H. (2003a). Fluctuating fluid forces acting on two circular cylinders in a tandem arrangement at a subcritical Reynolds number. J. Wind Eng. Ind. Aerod. 91, 139–154. doi:10.1016/s0167-6105(02)00341-0
Alam, M. M., and Sakamoto, H. (2005). Investigation of Strouhal frequencies of two staggered bluff bodies and detection of multistable flow by wavelets. J. Fluid Struct. 20, 425–449. doi:10.1016/j.jfluidstructs.2004.11.003
Assi, G. R. S., Bearman, P. W., and Meneghini, J. R. (2010). On the wake-induced vibration of tandem circular cylinders: the vortex interaction excitation mechanism. J. Fluid Mech. 661, 365–401. doi:10.1017/S0022112010003095
Assi, G. R. S., Meneghini, J., Aranha, J., Bearman, P., and Casaprima, E. (2006). Experimental investigation of flow-induced vibration interference between two circular cylinders. J. Fluid Struct. 22, 819–827. doi:10.1016/j.jfluidstructs.2006.04.013
Bernitsas, M. M., Raghavan, K., Ben-Simon, Y., and Garcia, E. M. H. (2008). VIVACE (vortex induced vibration aquatic clean energy): a new concept in generation of clean and renewable energy from fluid flow[J]. J. Offshore Mech. Arct. Eng. 130 (4), 041101. doi:10.1115/1.2957913
Chang, C. C., Kumar, R. A., and Bernitsas, M. M. (2011). VIV and galloping of single circular cylinder with surface roughness at 3.0×10⁴≤Re≤1.2×10⁵. Ocean. Eng. 38, 1713–1732. doi:10.1016/j.oceaneng.2011.07.013
Chen, W., Gao, D., Li, H., and Hu, H. (2018). Wake-flow-induced vibrations of vertical hangers behind the tower of a long-span suspension bridge. Eng. Struct. 169, 188–200. doi:10.1016/j.engstruct.2018.05.049
Ding, L., Bernitsas, M. M., and Kim, E. S. 2-D. U. R. A. N. S. Vs. (2013). 2-D URANS vs. experiments of flow induced motions of two circular cylinders in tandem with passive turbulence control for 30,000<Re<105,000. J. Ocean. Eng. 72, 429–440. doi:10.1016/j.oceaneng.2013.06.005
Griffith, M. D., LoJacono, D., Sheridan, J., and Leontini, J. S. (2017). Flow-induced vibration of two cylinders in tandem and staggered arrangements. J. Fluid Mech. 833, 98–130. doi:10.1017/jfm.2017.673
Joshi, V., and Jaiman, R. K. (2017). A variationally bounded scheme for delayed detached eddy simulation: application to vortex-induced vibration of offshore riser. Comput. Fluids 157, 84–111. doi:10.1016/j.compfluid.2017.08.013
Kim, E. S., and Bernitsas, M. M. (2016). Performance prediction of horizontal hydrokinetic energy converter using multiple-cylinder synergy in flow induced motion. Appl. Energy. 170, 92–100. doi:10.1016/j.apenergy.2016.02.116
Lee, J. H., and Bernitsas, M. M. (2011). High-damping High-Reynolds VIV tests for energy harnessing using the VIVACE converter. Ocean. Eng. 38, 1697–1712. doi:10.1016/j.oceaneng.2011.06.007
Lian, J., Wu, Z., Yao, S., Yan, X., Wang, X., Jia, Z., et al. (2022). Experimental investigation of flow-Induced motion and energy conversion for two rigidly coupled triangular prisms arranged in tandem. Energies 15, 8190. doi:10.3390/en15218190
Lian, J., Yan, X., Liu, F., and Zhang, J. (2017b). Analysis on flow induced motion of cylinders with different cross sections and the potential capacity of energy transference from the flow. Shock Vib 2017, 1–19. doi:10.1155/2017/4356367
Lian, J., Yan, X., Liu, F., Zhang, J., Ren, Q., and Yang, X. (2017a). Experimental investigation on soft galloping and hard galloping of triangular prisms. Appl. Sci. 7, 198. doi:10.3390/app7020198
Lin, J. C., Yang, Y., and RockWell, D. (2002). Flow past two cylinders in tandem: instantaneous and averaged flow structure. J. Fluid Struct. 16, 1059–1071. doi:10.1006/jfls.2002.0469
Liu, Y. B., Xing, Y. L., Law, S. S., and Zhang, Y. Y. (2017). Internal resonance vibration induced by nonlinearity of primary suspension system in high-speed vehicle system. Nonlinear Dynam 88 (4), 2947–2956. doi:10.1007/s11071-017-3423-3
Mahir, N., and RockWell, D. (1996a). Vortex formation from a forced system of two cylinders. Part I: tandem arrangement. J. Fluid Struct. 10, 473–489. doi:10.1006/jfls.1996.0032
Mahir, N., and RockWell, D. (1996b). Vortex formation from a forced system of two cylinders. Part II: side-by-side arrangement. J. Fluid Struct. 10, 491–500. doi:10.1006/jfls.1996.0033
MatinNikoo, H., Bi, K., and Hao, H. (2018). Effectiveness of using pipe-in-pipe (PIP) concept to reduce vortex-induced vibrations (VIV): three-dimensional two-way FSI analysis. Ocean. Eng. 148, 263–276. doi:10.1016/j.oceaneng.2017.11.040
Matsumiya, H., Nishihara, T., and Yagi, T. (2018). Aerodynamic modeling for large-amplitude galloping of four-bundled conductors. J. Fluids Struct. 82, 559–576. doi:10.1016/j.jfluidstructs.2018.08.003
Narendran, K., Guan, M. Z., Ma, P. F., Choudhary, A., Hussain, A. A., and Jaiman, R. K. (2018). Control of vortex-induced motion in multi-column offshore platform by near-wake jets. Comput. Fluids 167, 111–128. doi:10.1016/j.compfluid.2018.02.025
Qin, B., Alam, M. M., Ji, C., Liu, Y., and Xu, S. (2018). Flow-induced vibrations of two cylinders of different natural frequencies. Ocean. Eng. 2018, 189–200. doi:10.1016/j.oceaneng.2018.02.048
Qin, B., Alam, M. M., and Zhou, Y. (2017). Two tandem cylinders of different diameters in cross-flow: flow-induced vibration. J. Fluid Mech. 829, 621–658. doi:10.1017/jfm.2017.510
Shao, N., Lian, J., Liu, F., Yan, X., and Li, P. (2020). Experimental investigation of flow induced motion and energy conversion for triangular prism. Energy 194, 116865. doi:10.1016/j.energy.2019.116865
Shao, N., Lian, J., Xu, G., Liu, F., Deng, H., Ren, Q., et al. (2018). Experimental investigation of flow-induced motion and energy conversion of a T-section prism. Energies 11 (8), 2035. doi:10.3390/en11082035
Sun, H., Kim, E. S., Bernitsas, M. P., and Bernitsas, M. M. (2015). Virtual spring-damping system for flow-induced motion experiments. J. Offshore Mech. Arct. Eng. 137, 061801. doi:10.1115/1.4031327
Sun, H., Ma, C., Kim, E. S., Nowakowski, G., Mauer, E., and Bernitsas, M. M. (2017). Hydrokinetic energy conversion by two rough tandem-cylinders in flow induced motions: effect of spacing and stiffness. Renew. Energy 2017, 61–80. doi:10.1016/j.renene.2017.01.043
Wang, J., Xia, B., Yurchenko, D., Litak, G., Li, Y., and Tian, H. (2023). Enhanced performance of piezoelectric energy harvester by two asymmetrical splitter plates. Ocean. Eng. 270, 113614. doi:10.1016/j.oceaneng.2022.113614
Wang, J., Zhang, C., Zhang, M., Abdelkefi, A., Yu, H., Ge, X., et al. (2021). Enhancing energy harvesting from flow-induced vibrations of a circular cylinder using a downstream rectangular plate: an experimental study. Int. J. Mech. Sci. 211, 106781. doi:10.1016/j.ijmecsci.2021.106781
Wang, J., Zhou, S., Zhang, Z., and Yurchenko, D. (2019). High-performance piezoelectric wind energy harvester with Y-shaped attachments. Energy Convers. Manage 181, 645–652. doi:10.1016/j.enconman.2018.12.034
Wu, Q., Wang, Y., and Wang, G. (2017). Experimental investigation of cavitating flow-induced vibration of hydrofoils. Ocean. Eng. 144, 50–60. doi:10.1016/j.oceaneng.2017.08.005
Xu, W., Ji, C., Sun, H., Ding, W., and Bernitsas, M. M. (2019). Flow-induced vibration of two elastically mounted tandem cylinders in cross-flow at subcritical Reynolds numbers. Ocean. Eng. 173, 375–387. doi:10.1016/j.oceaneng.2019.01.016
Zdravkovich, M. M. (1997). in Flow around circular cylinders. Editor E. Achenbach (Oxford; UK: Oxford University Press), Vol. 1.
Zdravkovich, M. M. (2002). in Flow around circular cylinders. Editor E. Achenbach (Oxford; UK: Oxford University Press), Vol. 2.
Zdravkovich, M. M. (1985). Flow induced oscillations of two interfering circular cylinders. J. Sound. Vib. 101 (4), 511–521. doi:10.1016/s0022-460x(85)80068-7
Zhang, B., Song, B., Mao, Z., Tian, W., and Li, B. (2017). Numerical investigation on VIV energy harvesting of bluff bodies with different cross sections in tandem arrangement. Energy 133, 723–736. doi:10.1016/j.energy.2017.05.051
Zhang, B., Wang, K. H., Song, B., Mao, Z., and Tian, W. (2018). Numerical investigation on the effect of the cross-sectional aspect ratio of a rectangular cylinder in FIM on hydrokinetic energy conversion. Energy 165, 949–964. doi:10.1016/j.energy.2018.09.138
Zhang, J., Liu, F., Lian, J., Yan, X., and Ren, Q. (2016b). Flow induced vibration and energy extraction of an equilateral triangle prism at different system damping ratios. Energies 9, 938. doi:10.3390/en9110938
Zhang, J., Xu, G., Liu, F., Lian, J., and Yan, X. (2016a). Experimental investigation on the flow induced vibration of an equilateral triangle prism in water. Appl. Ocean. Res. 61, 92–100. doi:10.1016/j.apor.2016.08.002
Zhu, H., Chen, Q., Alam, M. M., Tang, T., Zhong, J., and Zhou, T. (2023b). Flow-induced rotation and wake characteristics of polygonal prisms subjected to laminar flow. Phys. Fluids. 35, 057101. doi:10.1063/5.0151654
Zhu, H., Chen, Q., Tang, T., Alam, M. M., and Zhou, T. (2023a). Flow structures around a circular cylinder with bilateral splitter plates and their dynamic characteristics. Ocean. Eng. 269, 113547. doi:10.1016/j.oceaneng.2022.113547
Zhu, H., Tang, T., Zhou, T., Cai, M., Gaidai, O., and Wang, J. (2021). High performance energy harvesting from flow-induced vibrations in trapezoidal oscillators. Energy 236, 121484. doi:10.1016/j.energy.2021.121484
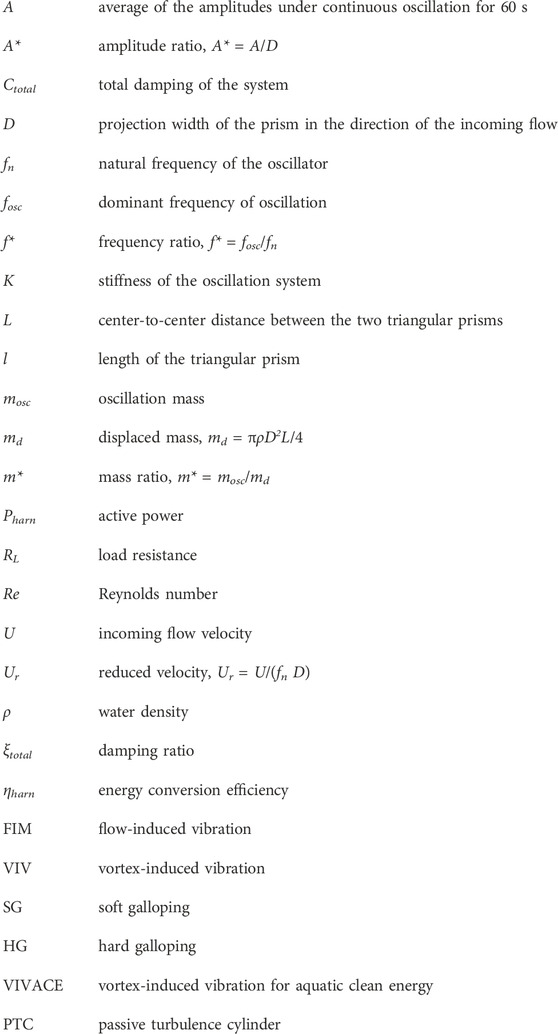
Nomenclature
Keywords: flow-induced motion, ocean current energy, spacing ratio, triangular prism, galloping
Citation: Shao N, Xu G, Wu Z, Liu F, Yan X and Wang X (2023) Experimental study on flow-induced motion and energy conversion for two triangular prisms in tandem arrangement. Front. Energy Res. 11:1231966. doi: 10.3389/fenrg.2023.1231966
Received: 31 May 2023; Accepted: 31 July 2023;
Published: 17 August 2023.
Edited by:
Chandan Bose, University of Birmingham, United KingdomReviewed by:
Yu Yao, Changsha University of Science and Technology, ChinaTongming Zhou, University of Western Australia, Australia
Alan Wang, Harbin Institute of Technology, China
Copyright © 2023 Shao, Xu, Wu, Liu, Yan and Wang. This is an open-access article distributed under the terms of the Creative Commons Attribution License (CC BY). The use, distribution or reproduction in other forums is permitted, provided the original author(s) and the copyright owner(s) are credited and that the original publication in this journal is cited, in accordance with accepted academic practice. No use, distribution or reproduction is permitted which does not comply with these terms.
*Correspondence: Guobin Xu, eHVndW9iQHRqdS5lZHUuY24=