 Yuanzheng Wang
 Renyi Cao
 Zhihao Jia
 Tao Huang
 Pin Jia
- College of Petroleum Engineering, China University of Petroleum, Beijing, China
The pore structure of shale reservoirs leads to the complex phase behavior of shale reservoir fluids, which is aggravated due to changes in fluid composition during reservoir development. Effective prediction of changes in the phase behavior of fluids in shale reservoirs is important. This paper proposes a pore-size-dependent Peng-Robinson equation of state (PR-EOS) to describe phase behavior in nanopores. The approach considers the shift of critical parameters and the gas-liquid capillary pressure and compiles by MATLAB. The verification of the model is satisfying by matching the result with Tnavigator PVTi using the published date. The results show that fluids in nanoscale pores are more likely to exhibit near-critical or condensate states. We also compare the changes in phase behavior when fluids dissolve CO2 and CH4 and observe the phase transition (from gaseous to liquid phase) of the lighter crude oil sample that dissolved more gas during the differential liberation experiment (DL). Finally, we use CO2 pre-pad energized fracturing of a shale oil reservoir in northern China as an example to explain abnormal production performances, such as a majority of light hydrocarbons in the produced fluid of the well during the flow back stage, single gas phase production in the early production stage, and stable gas/oil ratio (GOR) in the process of development. Our novel methodology and phase behavior change mechanism can enhance our understanding of the phase behavior of fluids in shale oil reservoirs during enhanced oil recovery.
1 Introduction
The rapid growth of production from shale oil reservoirs in recent years has made them more economically valuable than shale gas reservoirs, demonstrating their significant potential. However, the heterogeneity of the reservoir and the prevalence of nanopores pose unique challenges to their development and production (Clarkson and Pedersen, 1490; Honarpour et al., 2012). As a result, the production performance of LRS reservoirs often exhibits distinct production phenomena. For example, abnormal production gas-oil ratios (GOR) are captured in the Bakken shale oil development, with higher bottom-hole flow pressures and low gas flow rates (Nojabaei et al., 2013). The Eagle Ford shale oil development similarly exhibits more stable GOR. At the same time, increased critical gas saturation in nanopore-throat delays the timing of the two-phase flow (Khanal et al., 2021a; Khoshghadam et al., 1751; Khoshghadam et al., 1759), these abnormal production performances will continue for several years or more. The Gulong shale oil in China’s Daqing field discovered single gas phase flow in the early development after CO2 pre-pad energized fracturing. These phenomena are repeatedly captured in the development of shale reservoirs while exhibiting significant variability due to regional differences (Alfi et al., 1709; Liu et al., 2018a; Sun et al., 2021). Conventional fluid modeling is difficult to match to actual field data.
The analysis of the pore-scale structure and composition of rock showed that multiscale nanopore throat enhances the fluid-fluid/solid interaction (Fisher and Green, 1971; Ghanbariana et al., 2020; Dong et al., 2023), adsorption in the organic matter further complicates gas-liquid distribution, which leads to a bias in the conventional equation of state in evaluating the gas-liquid equilibrium process. Researchers began to look for alternative methods or reasonable modifications to conventional methods to once again assess the phase equilibria of fluids in nanopores. Currently, the study approaches of phase behavior in confined space mainly include physical experiments, equations of state, molecular simulation methods, and density functional theory (Singh et al., 2009; Li et al., 2014; Wang et al., 1708; Jin, 2018). Physical experiments are limited due to the harsh experimental conditions and equipment, only a few experiments have been carried out and most of them are for pure components and binary-ternary mixtures of light hydrocarbons (Wang et al., 1708; Alfi et al., 2017), which provide possibilities of mathematical modeling and validation for other approaches, but they do not apply to more complex conditions. The DFT method can better match the experimental data considering the intermolecular and fluid/surface interactions (Liu. et al., 2018b; Zhao. and Jin., 2019). The researcher adopts the DFT approach to analyze phase behavior and adsorption of fluid in the multiscale pores, and the simulation results are in good agreement with the field observation results (Jin. and Abbas, 2016). However, applying DFT directly in numerical simulation is difficult, and this approach is mainly used to provide necessary corrections and guidance for traditional EOS modeling. Molecular simulation effectively revealed the density distribution and the potential for phase transitions of the fluid in nanopores by molecular perspectives, but this approach is computationally expensive and difficult to be applied directly to numerical simulations. The EOS approach is currently widely used in the evaluation of gas-liquid phase equilibria due to its convenience and versatility, the traditional EOS fails to consider the inhomogeneity of surface adsorption and molecular density in nanopores, which is not negligible in nanopores. To accurately predict the phase behavior of fluid, the pore-sized-independent EOS has been established by modifying the relevant thermodynamic parameters through molecular simulation results. Furthermore, this modified EOS has been applied to numerical simulation studies in shale reservoirs (Vishnyakov et al., 2001; Zhang K. et al., 2019; Yang et al., 2019; Yang and Li, 2020; Cao et al., 2022). The thermodynamic equilibrium also considers significant capillary pressure (Sui and Yao, 2016; Cui et al., 2018; Zhang Y. et al., 2019). What’s more, the competitive adsorption in the multicomponent hydrocarbons is considered in the EOS (Song Z. et al., 2020; Song Y. et al., 2020; Chong et al., 2023; Cao et al., 1755). Other EOS has also been developed to evaluate fluid migration and composition changes in multiscale pores (Travalloni et al., 2014). In addition, the method adopts the minimum Helmholtz energy as the equilibrium condition shows that the fluid extracted from the nanopores can provide more oil than in the bulk space because the critical point in the nanopores is lowered (Luo et al., 2020; Luo et al., 2021).
Overall, modified EOS is now a commonly used method for investigating the phase behavior of fluids in nanopores. Several multiscale numerical simulation models have been developed to reproduce the specific phenomena of shale reservoir development (Khoshghadam et al., 1751; Khoshghadam et al., 1759). Gas injection is the most commonly used method for shale development to enhance oil recovery. CO2 has been shown to interact more with crude oil and rock than hydrocarbon gas (Haiyang et al., 2021; Lu. et al., 2022; Qi et al., 2023), which includes replacement, extraction, adsorption, and other mechanisms. These mechanisms have been studied through experiments and molecular simulations and further applied to numerical simulations (Samuel et al., 2022; Jia. et al., 2023; Zongfa et al., 2023). In addition, CO2 injection can effectively mitigate the potential threat of greenhouse gas emissions. However, changes in fluid components due to gas injection in nanopores have yet to be addressed in the current study, phase behavior of the fluid will be further affected due to changes of the components during development. This process may be accompanied by phase transition in the nanopores, affecting the actual production performance. Therefore, it is necessary to analyze the phase behavior of fluid in multiscale pores during gas injection in conjunction with the actual production performances in the field.
This study focuses on investigating the effect of nano-confinement on shale reservoir development by analyzing the changes in fluid phase behavior during depletion and gas injection in nanopores. In Section 2, we propose a method of vapor-liquid equilibrium calculation considering the nano-confinement effects. The reliability of the proposed method is validated in Section 3 by comparing the results obtained with the commercial software tNavigator PVTi and the data from published references. The behavior of fluids in nanopores during depletion and gas injection is analyzed in Section 4. In Section 5, we explain the production performances of an actual shale oil reservoir using the proposed methods. Finally, the conclusions are drawn in Section 6.
2 Methodology
2.1 Critical temperature and pressure shift of components in nanopores
The shale reservoir system is characterized by a multiscale porous medium consisting of matrix, natural and hydraulic fractures. The storage and phase behavior of hydrocarbons occur in pores that range from several nanometers to micrometers, with significant changes in capillary pressure, van der Waals, and structural forces. Traditional methods for describing the phase behavior of fluids in confined spaces are unsuitable. To accurately interpret the phase behavior of fluids in nanopores, the critical properties of components are considered as a function of the ratio of molecular size to pore size. Several publications employ the extended van der Waals (vdW) theory to describe the shift of critical temperature and pressure of fluids in nanopores, such as shown in Table 1.
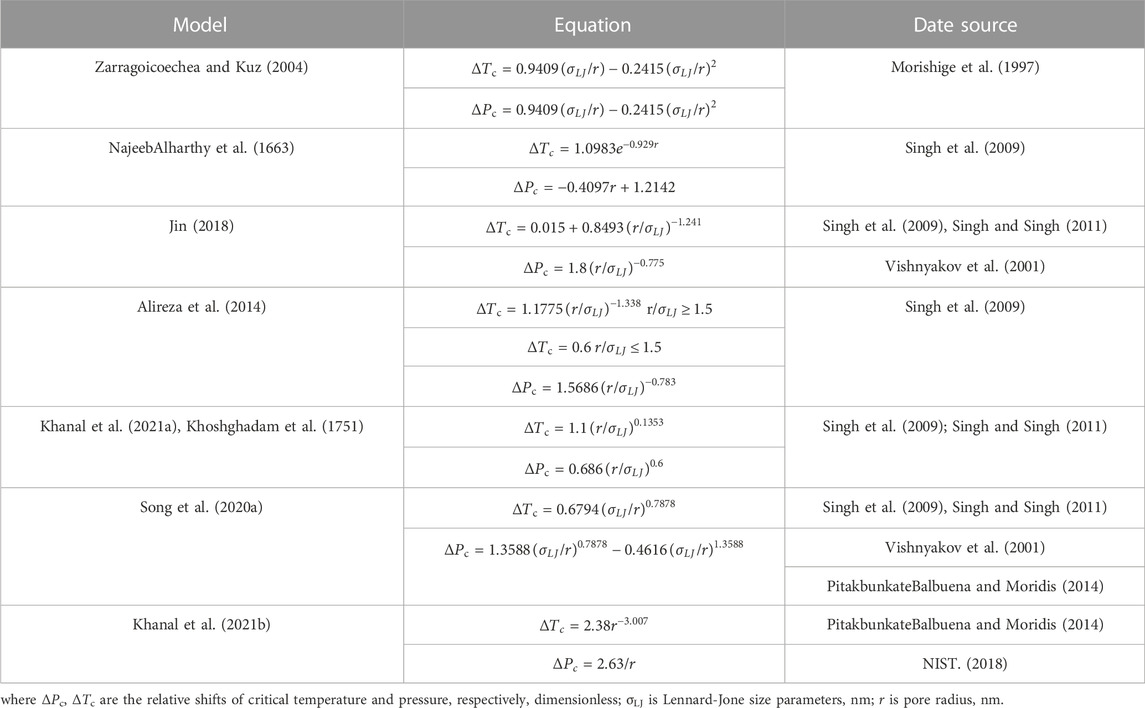
TABLE 1. The correlations for the shift of critical temperature and pressure.
The application of the above methods has some limitations. NajeebAlharthy et al. (1663), proposed a formula suitable for pores below 3 nm. In their study, the cutoff size of the critical parameter shift was set at less than or equal to 3 nm to eliminate the negative shift of critical pressure. This method was first applied by Singh et al. (2009). The critical parameters proposed by Khanal et al. (2021b), are very sensitive to pore radius, and the change in critical temperature is minimal when the pore radius is larger than 3. Song et al. (2020a) showed that the results are more accurate when σLJ/R < 0.2.
2.2 Effect of capillary pressure on phase behavior in nanopores
The conventional reservoir models tend to neglect capillary pressure, whereas its impact on the vapor/liquid equilibrium is considerable in nanopores (Teklu et al., 2014; Wang et al., 2017). Therefore, the fugacities of components in the liquid and vapor phases are equal, which can be expressed by:
where μL,i and μV,i are the chemical potential of component i in the liquid/vapor phase, respectively. xi and yi are the molar fractions of component i in the liquid/vapor phase, respectively. PL and PV are the pressure of the liquid/vapor phase, respectively, MPa.
We use Young-Laplace equation (Adamson, 1990) to calculate the capillary pressure:
where Pcap is capillary pressure, MPa. σ is interfacial tension, mN/m. θ is contact angle, °.
The gas-liquid interfacial tension is estimated using the Parachor model:
where ρL/V is the molar density of liquid/vapor phase, mol/m3. [P]i is the parachor of pure component i.
2.3 Vapor-liquid equilibrium calculation in nanopores
In this paper, Peng-Robinson equation of state (PR-EOS) (Peng and Robinson, 1976) is used as follow:
Where T is temperature, K. P is pressure, MPa. Vm is the molar volume, mol/m3. R is gas constant, J/(mol K). a and b represent the attractive and repulsive terms, respectively.
In the non-ideal system at equilibrium, Ki is usually related to the fugacity coefficient. At the same time, the K value is updated according to the calculation results:
Where the superscripts n is the iteration level, Ki is the equilibrium ratio. fiV and fiL are the fugacities of component i in the vapor-liquid phase, respectively, MPa.
Wilson’s correlation (Whitson and Sunjerga, 2012) is usually used to generate the initial guess of Ki.
Where Pc,i is the critical pressure of component i, MPa. Tc,i is the critical temperature of component i. ωi is the acentric factor.
Vapor-liquid equilibrium calculation for xi and yi used Rachford-Rice (R-R) equation (Rachford and Rice, 1952).
Where zi is the overall mole fraction of component i, and Fv is the vapor molar fraction.
The bubble point pressure needs to satisfy:
The dew point pressure needs to satisfy:
2.4 Flash calculation process
In this paper, the vapor-liquid equilibrium calculation module considering the shift of critical parameters and the gas-liquid capillary pressure in nanopores is compiled by MATLAB programming. Figure 1 is a flowchart. The black border is our modification for the traditional PVT model.
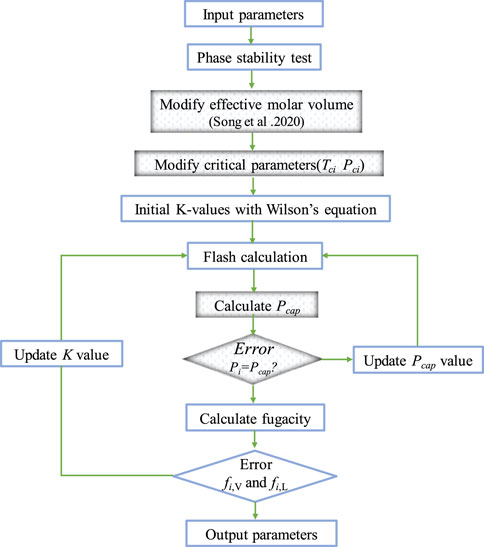
FIGURE 1. The calculation flowchart of phase behavior in confined space.
The components used in this paper are listed in Table 2. The pure component parameters were obtained from the tNavigator PVTi module database, and the Pseudo-Component parameters were obtained from a LRS reservoir in northern China.
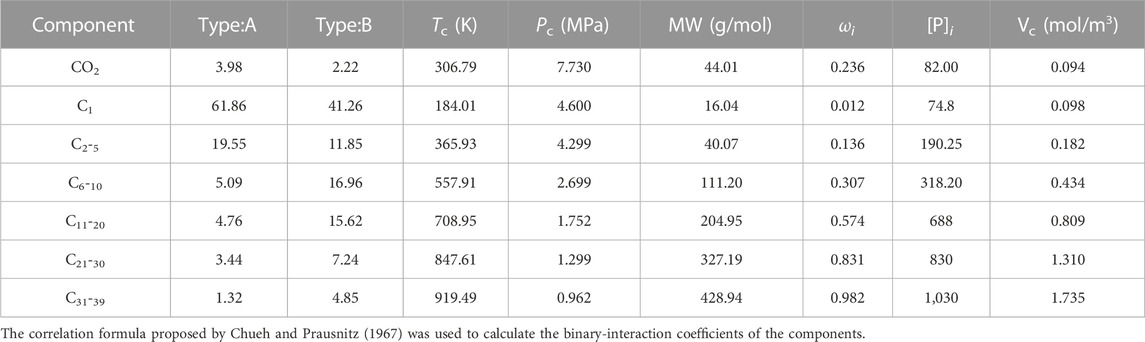
TABLE 2. Components and basic properties of the fluid.
3 Method validation
3.1 Validation of flash calculation method
We assess the validity of our model by comparing the calculated phase envelopes of component A and B fluids in bulk space (Figure 2A) with those obtained from commercial software. The good agreement between our model results and the software’s outputs confirms the reliability and accuracy of our established model.
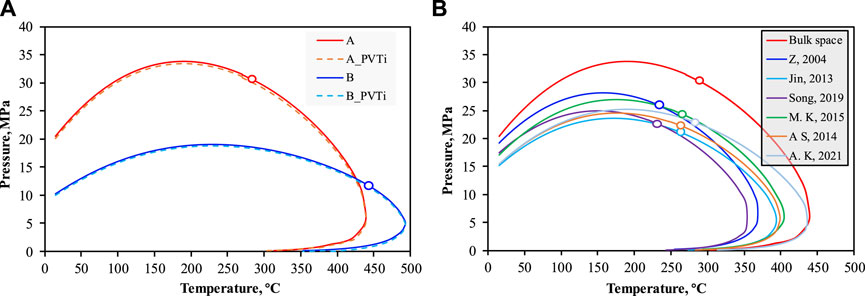
FIGURE 2. (A) Model validation of phase envelopes. The imaginary line (A_PVTi and B_PVTi) are the results of commercial software, and the solid lines (A,B) are our model results. (B), the result of phase envelopes under different models (10 nm). The red line is in bulk space.
Using A as an example, Figure 2B presents the phase envelope of the fluid obtained using different correlations. We did not include the method proposed by NajeebAlharthy et al. (1663), due to its specific application conditions.
The pressure difference of the bubble point line calculated with different correlations under the same temperature is within 5 MPa, while the difference along the dew point line is more noticeable. Overall, although the phase envelope exhibits variations, the underlying change pattern remains similar. To correct the critical parameter shift of the component, we employed the approach introduced by Zarragoicoechea and Kuz (2004) in this study.
4 Results and discussion
4.1 Phase envelope and fluid state in nanopores with nano-confinement effect
Three kinds of pores are classified based on pore size: micropores (<2 nm), mesopores (2–50 nm), and macropores (>50 nm) (Sing et al., 1985; Rouquerol et al., 1994). Microspores and mesopores are focused on in this study due to their significant contribution to the overall pore volume of shale reservoirs and their substantial influence on the phase behavior of fluids. Figure 3 Presents the phase envelope results for Component A under varying nanopore sizes. The bubble point line of the fluid demonstrates a decrease and inward contraction, mirroring the behavior observed in the dew point line. Notably, the coexistence region of two phases experiences a substantial reduction, with the proportion exhibiting a positive correlation with the pore radius. These findings indicate that fluids within nanopores exhibit a significantly different behavior compared to those in conventional reservoirs, often displaying a preference for single-phase conditions. Compared with previous studies, our calculations show satisfactory results.
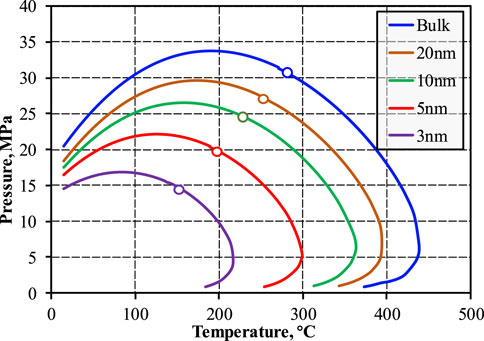
FIGURE 3. Phase envelopes of fluid under different pore radius.
In conventional reservoirs, the classification of reservoir types is typically based on the relative position of reservoir conditions in the phase diagram. However, this classification method may not have applied to the whole shale reservoirs due to nano-confinement effects, which alter the phase behavior of fluids in shale reservoirs compared to bulk space. To address this, we propose a revised classification approach that considers the matrix pore space as a “micro-supply source” influenced by the pore radius. According to this method, reservoirs with complex pore structures are categorized as “supply sources” exhibiting multi-phase behavior. As illustrated in Figure 4, the solid and dashed black lines represent the phase envelopes under weak and intense nano-confinement effects, respectively.
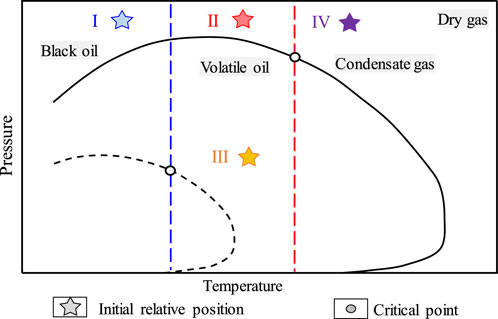
FIGURE 4. The difference in fluid phase behavior caused by nano-confinement. The solid black and dotted lines are fluid phase envelopes under intense/weak nano-confinement. The phase behavior in nanopores with different pore radii is more likely to change under the conditions with the relative position II.
I-IV represents the relative positions of the initial environment and pores conditions, such as position I, the fluid shows the characteristics of volatile oil. Similarly, pores with the position of IV show condensate gas under weak confinement and dry gas under intense confinement. When the pore is at the 2 position, the fluid may exhibit volatile and gas-oil condensate depending on the pore radius and fluid component. When the reservoir conditions and fluid components change (such as gas injection, pressure increase, injection of thermal fluids, etc.), the fluid may undergo the process of phase transition.
Data on typical shale reservoirs are collected from the published references, including pore structure, initial reservoir condition, and components (Nojabaei et al., 2013; NajeebAlharthy. et al., 1663; Ko et al., 2017; Ganjdanesh. et al., 2019). The impact of different pore structures on the gas-liquid distribution of the reservoir was illustrated, as shown in Figure 5. The pores volume of microspores and mesopores occupy 40% or even more.
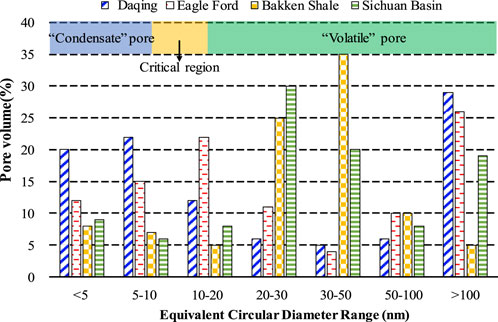
FIGURE 5. Part of the reservoir’s pore structure and initial fluid status. The blue and green regions represent the characteristics of fluid with condensate and volatile oil in the nanopores, respectively. The orange represents the near-critical region, which can be transformed by changing the external conditions.
4.2 Effects of nano-confinement on depletion development
The alteration of fluid components has a consequential impact on the gas-liquid distribution during the development of LRS reservoirs, as evidenced by changes observed in production performances. (Khoshghadam et al., 1759; Luo et al., 2020; Luo et al., 2021; Du and Chu, 2012). The development process of LRS reservoirs can be divided into four distinct stages, and an analysis of production performance will be conducted at each stage to evaluate its dynamics.
4.2.1 The first stage (A)
The single-phase flow predominates in the near-well area during the early stage of development. The formation pressure exceeds the saturation pressure within the corresponding porous medium. As a result, a greater amount of liquid is produced during the initial production phase. In the early development of the reservoir, a phase transition occurs, transitioning the reservoir from an LRS reservoir to a condensate reservoir, which subsequently leads to the production of a single gas.
4.2.2 The second stage (B)
The pressure within fractures declines rapidly due to their high conductivity. This decline results in the initial appearance of bubbles in the fractures and large pores, expanding the fluid volume. However, since the gas phase has not yet reached the critical gas saturation, two-phase flow has not been established in the matrix flow channel.
4.2.3 The third stage (C)
The escape of numerous bubbles results in the rapid coalescence of gas, quickly reaching critical gas saturation. Consequently, the gas occupies the nanopores and flow channels, leading to an imminent breakthrough. This phenomenon proves detrimental in conventional reservoirs as it causes a sharp decline in liquid phase production. However, the simultaneous release of all bubbles from nanopores is impossible in shale reservoirs. Nevertheless, when there is an appropriate gradient, this gas is a propellant, displacing oil from the nanopores and mesopores. This driving force resembles gas dissolution drive and may widely occur in nanopores, presenting potential advantages.
4.2.4 The last stage (D)
Following the escape of gas, the alteration in composition subsequently induces a shift in fluid phase behavior, ultimately leading the reservoir back to the single-phase flow with residual gas. Figure 6 visually represents the gas-liquid distribution and flow characteristics observed in each development stage of LRS reservoirs. As previously mentioned, the phase behavior shift within nanopores is a crucial factor contributing to the systematic and cost-effective production of LRS reservoirs. A multiscale pore structure gives rise to the coexistence of phase envelopes, a crucial element influencing recovery during the depletion process of LRS reservoirs.
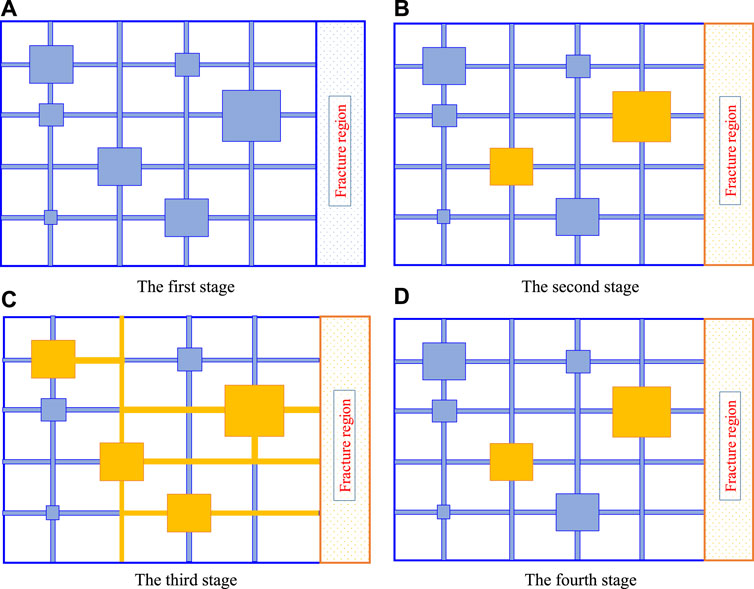
FIGURE 6. Stage division of depletion development in LRS reservoir. Yellow box is gas-rich fluid (Lei et al., 2016). 4.2.1 The first stage (A); 4.2.2 The second stage (B); 4.2.3 The third stage (C); 4.2.4 The last stage (D).
The pore structure of shale reservoirs varies across different regions, and this variation directly influences the duration of different development stages. It is essential to implement a well-planned development strategy to optimize reservoir production. Past experiences have indicated that maintaining reservoir pressure above the bubble point pressure is critical in shale development. The nano-confinement effect, which enhances fluid flow within nanopores during the two-phase flow stage, can extend the production period and increase recovery in LRS reservoirs.
4.3 Phase behavior change mechanism after gas injection with nano-confinement effects
Depletion development of shale reservoirs ultimately leads to an extremely low ultimate recovery. To enhance EOR, development strategies such as large-scale fracturing and gas injection are commonly employed. Researchers have adopted a multiscale approach, discretizing the distribution of pores from the macroscopic to the nanometer scale to simulate fluid composition changes in shale reservoirs during depletion development. Their findings highlight the selective release of light hydrocarbons in nanopores, leading to higher concentrations of intermediate hydrocarbon components and fewer light components. Many intermediate components remain in the nanopores as unsaturated fluids. Additionally, the fluid composition of pores near fractures changes gas injection, altering fluid phase behavior. This is a key consideration in reservoir development.
In this section, CH4 and CO2 were used as injection media to analyze the change of phase envelope after injection gas under different initial components (A, B). The mean matrix pore radius is 10 nm, and Figures 7A, B shows the impact of the injected gas on the phase envelope. The differences mainly reflect the following aspects.
(1) Critical point of mixed fluids. The critical pressure of mixed fluids is minimally affected by the molar fraction of CO2. Upon mixing the original component with 70 mol% injection gas, the critical pressure increased by a mere 3 MPa. This slight change can be attributed to the higher critical pressure and temperature of pure CO2 compared to the initial composition (mainly C1, C2-4).
(2) Near-critical region. The near-critical region, which encompasses the vicinity of the critical point on the phase envelope, experiences a leftward shift as the CO2 molar fraction increases. This shift implies that the fluid in the near-critical region tends to exhibit a condensate state, and the properties of the fluid in the vicinity of the critical point become better, such as viscosity. Specifically, for component A, the phase envelopes of the near-critical region demonstrate a high degree of overlap, indicating that the impact of CO2 molar fraction on the two-phase region and the pressure point of gas phase escape is minimal.
(3) Other regions (low-temperature and high-temperature regions). At temperatures below 100°C, the increased CO2 molar fraction resulted in a minor reduction in the bubble point. Conversely, injection CH4 led to a considerable increase in the bubble point and a significant expansion of the two-phase region in the mixed fluid. This observation suggests that CO2 injection can widen the gap between formation and saturation pressure, thereby delaying the two-phase flow stages. Conversely, at relatively high temperatures, CH4 slightly increased the dew point pressure.
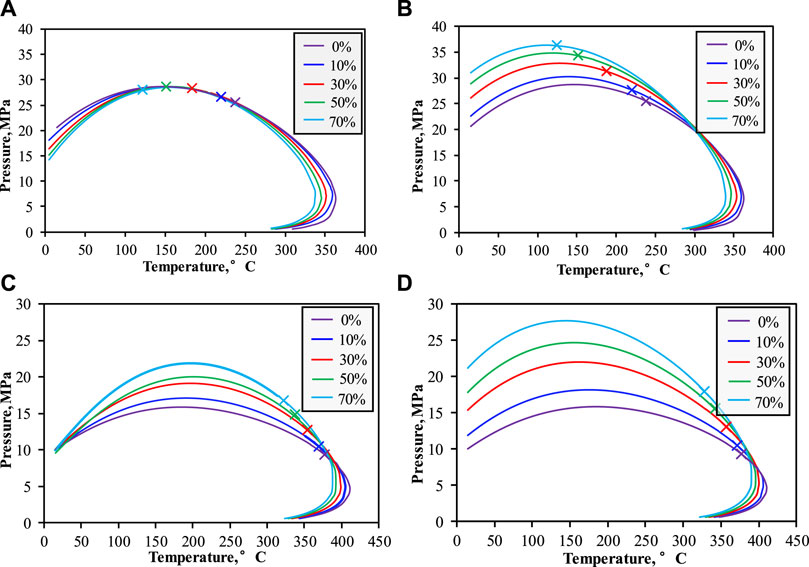
FIGURE 7. (A,B) The change of phase envelope of mixed fluid after injection gas. Original component A mixed with 0–70%mol injection gas at 10 nm. Left: CO2; Right: CH4. (C,D) The change of phase envelope of mixed fluid after injection gas. Original component B mixed with 0%–70% mol injection gas at 10 nm.
Similarly, the fluid transitions to a volatile oil state as the molar fraction of intermediate and heavy hydrocarbons increases. The alterations in the phase envelopes are depicted in Figures 7C, D. It was observed that both CO2 and CH4 led to an elevation in the critical pressure and temperature of the mixed fluid, with CH4 exhibiting a more significant impact. At temperatures below 100°C, the influence of CO2 molar fraction on the phase envelope gradually diminishes, whereas CH4 raises the bubble point significantly. The effect of different injected media on the dew point appears negligible. Gas injection development strategies will increase the average formation pressure, combined with Figure 3 and Figure 7, the nano-confinement effect reduces the saturation pressure of the mixed fluids, which makes the injected fluids easier to dissolve in oil phase. Meanwhile, the minimum miscibility pressure (MMP) of the fluid after CO2 injection is lower than CH4, which indicates that injection CO2 has a better miscible capability, and the single-phase flow is longer during the development process, which is favorable to oil production.
To investigate the fluid phase behavior during gas injection in LRS reservoirs, a constant differential liberation experiment (DL) was simulated at a reservoir temperature of 130°C. Figure 8 illustrates the variations in the phase envelope and critical point of the mixed fluid, represented by the solid purple and dotted lines, respectively. As the pressure decreases, the concentration of light components in the fluid gradually diminishes, leading to an increase in the critical temperature and a decrease in the critical pressure, which indicates a transition from volatile oil to black oil. In practical LRS reservoirs, the phase behavior of the remaining fluid undergoes changes, and the fluid within the pores may experience a reversion to single-phase flow (liquid phase) as the gas phase escapes. This transition is influenced by the critical gas saturation and the current reservoir pressure. Hence, the reservoir fluid may undergo phase transition due to the fluid composition and the pore size. When injecting 70%mol of gas (CO2, CH4), represented by the red and blue circles, the reservoir behaves as a condensate gas reservoir, which aligns with previous findings in this study.
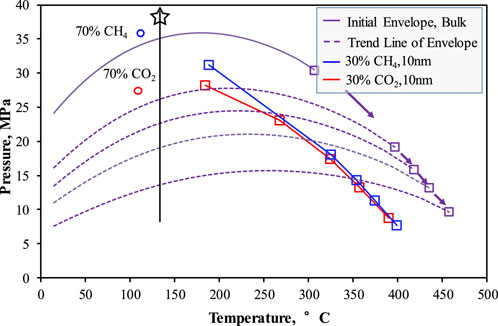
FIGURE 8. Variation trend of phase envelope (bubble point line) and critical point of mixed fluid (component A) during DL process. The solid purple line and dotted line show the dynamic change process of the bubble point line of the mixed fluid (Bulk space). Purple, blue, and red boxes show the variation of the critical points during the DL process under different initial conditions. The black pentagram is the initial condition of the reservoir. The blue and red circles are the initial critical points of the fluid after injection 70%mol CH4/CO2 (blue: 36.2 MPa, 124°C; red: 27.9 MPa, 122°C).
Figure 9 shows that as the concentration of heavy hydrocarbons in the fluid composition rises, the injected gas encounters challenges in inducing phase transition. Instead, the injected fluid primarily influences the distribution of gas and liquid phases.
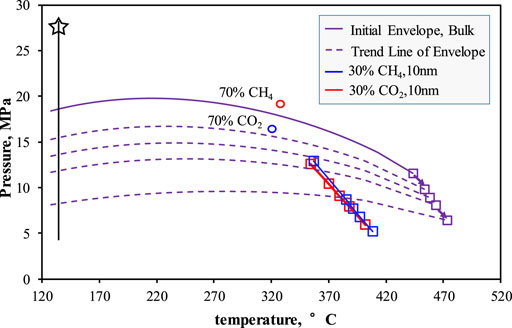
FIGURE 9. Variation trend of phase envelope (bubble point line) and critical point of mixed fluid (component B) during DL process.
5 Field application
This section presents a case study of a shale reservoir well in northern China. The reservoir is classified as a volatile oil reservoir and is being developed through CO2 pre-pad energized fracturing. The average permeability of the reservoir is less than 0.01 mD, with a temperature of 122°C, an initial reservoir pressure of 37.5 MPa, and an average porosity of 6%. The reservoir has been under production for 2 years. The results obtained from low-pressure adsorption and mercury-intrusion tests reveal that approximately 40% of the reservoir volume consists of nanopores with sizes below 10 nm, indicating that the nano-confinement effect could significantly impact reservoir development. Real-time production performance data and gas chromatographic analysis results of fluid samples are provided in Figure 10 and Table 3, respectively.
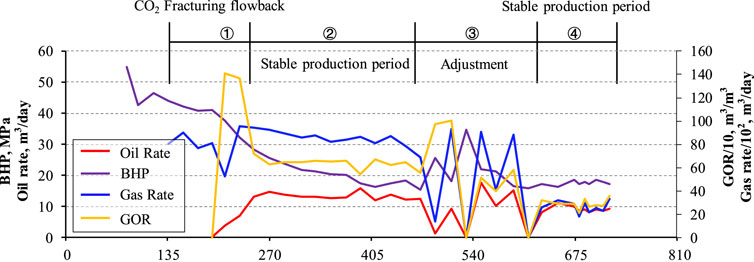
FIGURE 10. Production performance and stage division. The red, purple, blue, and yellow lines are oil rate, BHP, gas rate and GOR, respectively. The production performance is divided into four stages, the flowback stage (①), stable production stage (②), Adjustment stage (③), and stable production stage (④).
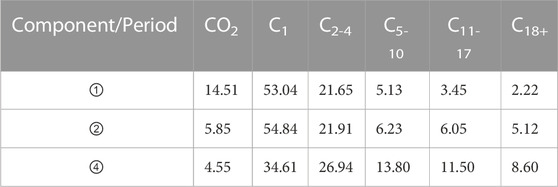
TABLE 3. Fluid components in different periods by gas chromatographic analysis.
Figure 10 illustrates the production performance of the well, with the production gas-oil ratio (GOR), bottom hole pressure (BHP), and production oil/gas rate serving as key indicators for analyzing the performance across different stages. The production performance is categorized into several distinct stages based on these parameters. Furthermore, the fluid samples collected during different production periods are utilized to deduce the current formation of fluid components, adhering to the fundamental principle of conservation of mass. Table 3 presents the current formation components, with the sampling periods designated as stages ①, ②, and ④.
Figure 11 presents the phase envelope of the fluid in bulk space, with distinct development stages indicated based on the pressure data. Initially, the phase behavior of fluid resides in a near-critical state, resembling condensate gas. As the mole fraction of CO2 decreases and hydrocarbon components increase, the reservoir fluid transitions to volatile oil (from the purple to the blue line). Over time, light hydrocarbons gradually release, notably CH4, which further alters the fluid phase behavior within the reservoir.
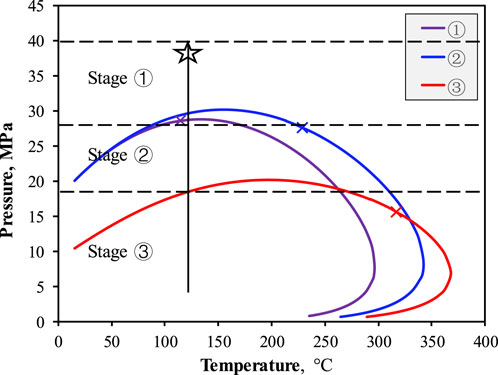
FIGURE 11. Phase envelope of fluid in three periods. The purple, blue, and red colors correspond to stages ①, ②, and ④ in Figure 10. The pentagram represents the initial reservoir condition.
Based on the analysis of Figures 10, 11 and Table 3, the production performance of the well is examined. During the fracturing flowback stage (①), the pressure ranges from 28 to 40 MPa. Following the flowback of the fracturing fluid (H2O), the early production stage (approximately 2 months) primarily dominates gas production, including CO2 and CH4. The current production performance of the well can be attributed to the phase behavior of the fluid, as indicated by the purple line in Figure 11, depicting the phase transition from volatile oil to condensate gas induced by the injected gas. According to the phase envelope, only a few bubbles are observed in the fracture, while the fluid in the matrix pores remains in a single phase. The rapid depletion of fluid in the fracture leads to a significant pressure drop by the end of this stage. Although the GOR does not exhibit a significant increase during this period, it can be attributed to the single-phase transport within the matrix.
In the second stage, the bottom hole pressure (BHP) ranges from 18 to 28 MPa. A noticeable reduction in the molar fraction of CO2 is observed in the fluid components, accompanied increased hydrocarbon content, particularly in the heavy components (Table 3, period ②). The fluid phase behavior reveals the presence of escaped gas in the nanopores near the wellbore matrix. Despite this, oil production and gas-oil ratio (GOR) remain stable, which can be attributed to the abundant distribution of nanopores throughout the reservoir. The nano-confinement effect delays the bubbles point and makes the gas escape stepwise, effectively promoting the flow of the liquid phase in small pores, showing the effect of the dissolved gas drive.
In the subsequent stage, as the production period prolongs, the physical properties of the fluid deteriorate, resulting in a reduction in the production capacity. Despite the decline in the production oil/gas rate, it maintains a relatively stable value when the pressure is maintained at around 18 MPa. The staged escape of gases facilitates the migration of fluids, which can be attributed to the combined effect of nano-confinement and the inherent heterogeneity of the pore structure. Notably, there is a sharp decrease in the molar fraction of CH4, indicating the preferential escape of methane through the flow channels, while the flow ability of other components is relatively poor. This change in composition further induces alterations in the phase behavior of the fluid (as observed in Figure 11, stage 3, represented by the red line). The formation pressure of 18 MPa is close to the saturation pressure point of the fluid, resulting in a single-phase fluid state, aligning with the pattern depicted in Figure 6D.
To comprehensively understand these development stages, Figure 12 provides a relevant schematic diagram for visual reference. Specifically, (a) represents the backflow stage of fracturing fluid, corresponding to stage ① as depicted in Figure 10, which illustrates the early stage of development, during which the fracture pressure gradually decreases until it reaches the bubble point pressure. It is noteworthy that most of the pores are in a single liquid phase. This stage occurs between stages ① and ②. Lastly, (c) represents the stable production period, aligning with stages ② and ④, which signifies the gradual emergence of bubbles in the nanopores near the fracture. The production performance demonstrates a stable period during this stage.
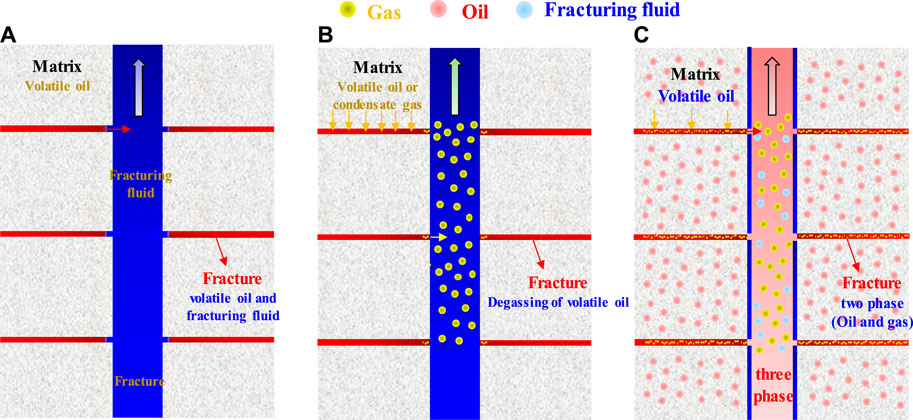
FIGURE 12. Schematic diagram of fluid distribution in reservoir pores at different development stages. (A) Refers to the fracturing fluid backflow stage, and (B) refers to the early stage of development. (C) Refers to the stable production period.
6 Conclusion
The phase behavior in nanopores is described in this paper by extending the PR-EOS to account for capillary pressure and critical parameter shifts. The key findings of this study are summarized as follows.
(1) The fluid phase behavior in nanopores is influenced by nano-confinement, with the pore radius playing a crucial role. Different pore structures result in diverse phase behaviors, and the nano-confined space is considered a “micro-supply source” exhibiting varying phase behaviors in this study, this method provides a reasonable explanation for understanding abnormal production phenomenon in shale reservoir development.
(2) The development of LRS reservoirs is characterized by multiple stages based on gas-liquid distribution. Nano-confinement effects influence the production performance in each stage. The results of DL simulations demonstrate the dynamic changes in fluid composition during LRS development, leading to alterations in fluid phase behavior, particularly phase transitions.
(3) A case study focuses on the CO2 pre-pad energized fracturing development of an LRS reservoir in northern China. The proposed method in this paper provides a reasonable explanation for the observed abnormal production performances, such as the presence of predominantly light hydrocarbons during the flowback stage, early-stage production dominated by a single gas phase, and stable gas-oil ratio (GOR) during the development process.
Data availability statement
The original contributions presented in the study are included in the article/supplementary material, further inquiries can be directed to the corresponding author.
Author contributions
YW: Programming and writing. RC and LC: Article structure. ZJ: Program guidance. TH, WD, and ZS: Translation, drawing, revision. All authors contributed to the article and approved the submitted version.
Funding
The authors acknowledge that this study was partially supported by the National Natural Science Foundation of China (Nos. 52174038 and 52004307), China Petroleum Science and Technology Project-major project-Research on tight oil-shale oil reservoir engineering methods and key technologies in Ordos Basin (ZLZX 2020-02-04) and Science Foundation of China University of Petroleum, Beijing (No.2462018YJRC015).
Conflict of interest
The authors declare that the research was conducted in the absence of any commercial or financial relationships that could be construed as a potential conflict of interest.
Publisher’s note
All claims expressed in this article are solely those of the authors and do not necessarily represent those of their affiliated organizations, or those of the publisher, the editors and the reviewers. Any product that may be evaluated in this article, or claim that may be made by its manufacturer, is not guaranteed or endorsed by the publisher.
References
Adamson, A. W. (1990). Physical chemistry of surfaces. fifth edition. New York, NY, USA: John Wiley & Sons. doi:10.1149/1.2133374
Alfi, M., Nasrabadi, H., and Banerjee, D. “Effect of confinement on bubble point temperature shift of hydrocarbon mixtures: experimental investigation using nanofluidic devices,” in Proceedings of the SPE Annual Technical Conference and Exhibition held in San Antonio, Texas, USA, October 2017. doi:10.2118/187057-MS
Alfi, M., Yan, B., Cao, Y., An, C., Wang, Y ., and Killough, J. “How to improve our understanding of gas and oil production mechanisms in liquid-rich shale,” in Proceedings of the SPE Annual Technical Conference and Exhibition, Paper SPE-170953-MS, Amsterdam, Netherlands, October 2014. doi:10.2118/170953-MS
Alireza, Sanaei., Ahmad, Jamili., and Callard, Jeffrey “Effect of pore size distribution and connectivity on phase behavior and gas condensate production from unconventional resources,” in Proceedings of the SPE Unconventional Resources Conference, The Woodlands, Texas, USA, April 2014, 1–3. doi:10.2118/168970-MS
Cao, C., Jia, P., Cheng, L., Jin, Q., and Qi, S. (2022). A review on application of data-driven models in hydrocarbon production forecast. J. Petroleum Sci. Eng. 212, 110296. doi:10.1016/j.petrol.2022.110296
Cao, Y., Yan, B., Alfi, M., and Killough, J. E. “A novel compositional model of simulating fluid flow in shale reservoirs–some preliminary tests and results,” in Proceedings of the SPE Reservoir Characterisation and Simulation Conference and Exhibition, Paper SPE-175589-MS, Abu Dhabi, September 2015. doi:10.2118/175589-MS
Chong, Cao., Cheng., Linsong, Jia., Pin, Shi., Junjie, and Hassan, Dehghanpour. (2023). A dynamic fracture model combining with Laplace transform and synchronous iteration method for transient behavior analysis of a four-zone system. J. HYDROLOGY 615, 128723. doi:10.1016/j.jhydrol.2022.128723
Chueh, P. L., and Prausnitz, J. M. (1967). Vapor-liquid equilibria at high pressures: calculation of partial molar volumes in nonpolar liquid mixtures. AIChE 13 (6), 1099–1107. doi:10.1002/aic.690130612
Clarkson, C. R., and Pedersen, P. K. “Production analysis of western Canadian unconventional light oil plays,” in Proceedings of the Canadian Unconventional Resources Conference, Paper SPE-149005-MS, Calgary, Alberta, Canada, November 2011. doi:10.2118/149005-MS
Cui, X., Yang, E., Song, K., Huang, J., Killough, J., Dong, C., et al. “Phase equilibrium of hydrocarbons confined in nanopores from a modified peng-robinson equation of state,” in Proceedings of the SPE Annual Technical Conference and Exhibition, Dallas, Texas, USA, September 2018. doi:10.2118/191547-MS
Dong., Xiaohu, Xu., Wenjing, and Liu, Huiqing, (2023). On the replacement behavior of CO2 in nanopores of shale oil reservoirs: insights from wettability tests and molecular dynamics simulations. Geoenergy Sci. Eng., 223–211528. doi:10.1016/j.geoen.2023.211528
Du, L., and Chu, L. “Understanding anomalous phase behavior in unconventional oil reservoirs,” in Proceedings of the Canadian Unconventional Resources Conference, Calgary, Canada, November 2012. doi:10.2118/161830-MS
Fisher, M. E. (1971). “The theory of critical point singularities,” in Crit. Phenomena, proc. 1970 enrico fermi int. Sch. Physics, Editor M. S. Green (Cambridge, Massachusetts, United States: Academic), 1–99.
Ganjdanesh., Reza, Wei, Yu., Xavier Fiallos., Mauricio, Kerr., Erich, Kamy, Sepehrnoori., and Raymond, Ambrose. “Gas injection EOR in eagle Ford shale condensate gas reservoirs,” in Proceedings of the SPE/AAPG/SEG Unconventional Resources Technology Conference, URTEC-2019-987-MS, Denver, Colorado, USA, July 2019. doi:10.15530/urtec-2019-987
Ghanbariana., Behzad, Feng, Liangb., and Liub, Hui-Hai (2020). Modeling gas relative permeability in shales and tight porous rocks. Fuel 272, 117686. doi:10.1016/j.fuel.2020.117686
Haiyang, Yu., Xu., Hang, and Fu, Wenrui, (2021). Extraction of shale oil with supercritical CO2: effects of number of fractures and injection pressure. Fuel, 285–118977. doi:10.1016/j.fuel.2020.118977
Honarpour, M. M., Nagarajan, N. R., and Orangi, A., “Characterization of critical fluid, rock, and rock-fluid properties-impact on reservoir performance of liquid-rich shales,” in Proceedings of the SPE Annual Technical Conference and Exhibition, San Antonio, Texas, USA, October 2012. doi:10.2118/158042-MS
Jia., Zhihao, Cheng., Linsong, and Feng, Haoran, (2023). Composition numerical simulation of CO2 utilization process in shale reservoir using projection-based embedded discrete fracture model (pEDFM) considering nano-confinement effect. Gas Sci. Eng., 111–204932. doi:10.1016/j.jgsce.2023.204932
Jin, Z. (2018). Bubble/dew point and hysteresis of hydrocarbons in Nanopores from molecular perspective. Fluid Phase Equilibria 458, 177–185. doi:10.1016/j.fluid.2017.11.022
Jin., Zhehui, and Abbas, Firoozabad. (2016). Thermodynamic modeling of phase behavior in shale media. SPE J. 21 (1), 190–207. doi:10.2118/176015-PA
Khanal, A., Khoshghadam, M., Jha, H. S., and Lee, W. J. “Understanding the effect of nanopores on flow behavior and production performance of liquid-rich shale reservoirs,” in Proceedings of the SPE/AAPG/SEG Unconventional Resources Technology Conference, URTEC-2021-5169-MS, Houston, Texas, USA, July 2021. doi:10.15530/urtec-2021-5169
Khanal, A., Khoshghadam, M., Jha, H. S., and Lee, W. J. “Understanding the effect of nanopores on flow behavior and production performance of liquid-rich shale reservoirs,” in Proceedings of the SPE/AAPG/SEG Unconventional Resources Technology Conference, URTEC-2021-5169-MS, Houston, Texas, USA, July 2021. doi:10.15530/urtec-2021-5169
Khoshghadam, M., Khanal, A., and Lee, W. J. “Numerical study of production mechanisms and gas-oil ratio behavior of liquid-rich shale oil reservoirs,” in Proceedings of the SPE Annual Technical Conference and Exhibition, Paper SPE-175137-MS, Houston, Texas, USA, September 2015. doi:10.2118/175137-MS
Khoshghadam, M., Khanal, A., Makinde, I., Lee, W. J., and Rabinejadganji, N. “Numerical study of production mechanisms in unconventional liquid-rich shale volatile oil reservoirs,” in Proceedings of the SPE/CSUR Unconventional Resources Conference, Paper SPE-175994-MS, Calgary, Alberta, Canada, October 2015. doi:10.2118/175994-MS
Ko, L. T., Loucks, R. G., Ruppel, S. C., Zhang, T., and Peng, S. (2017). Origin and characterization of eagle Ford pore networks in the south Texas upper cretaceous shelf. AAPG Bull. 101 (3), 387–418. doi:10.1306/08051616035
Lei, Wang., Yin., Xiaolong, Neeves, Keith B., and Ozkan, E. (2016). Effect of pore-size distribution on phase transition of hydrocarbon mixtures in nanoporous media. SPE J. 21 (6), 1981–1995. doi:10.2118/170894-PA
Li, Z., Jin, Z., and Firoozabadi, A. (2014). Phase behavior and adsorption of pure substances and mixtures and characterization in nanopore structures by density functional theory. SPE J. 19 (6), 1096–1109. doi:10.2118/169819-PA
Liu, B., Shi, J. X., Fu, X. F., Lv, Y. F., Sun, X. D., Gong, L., et al. (2018a). Petrological characteristics and shale oil enrichment of lacustrine fine-grained sedimentary system: A case study of organic-rich shale in first member of cretaceous qingshankou formation in gulong sag, songliao basin, ne China. Petroleum Explor. Dev. 45 (05), 884–894. doi:10.1016/s1876-3804(18)30091-0
Liu., Yueliang, Jin., Zhehui, and Andy, HuazhouLi. (2018b). Comparison of peng-robinson equation of state with capillary pressure model with engineering density-functional theory in describing the phase behavior of confined hydrocarbons. SPE J. 23 (5), 1784–1797. doi:10.2118/187405-PA
Luo, S., Chen, F., Zhou, D., and Nasrabadi, H. (2021). Multiscale pressure/volume/temperature simulation of decreasing condensate/gas ratio at greater than dewpoint pressure in shale gas-condensate reservoirs. SPE J. 26 (6), 4174–4186. doi:10.2118/203905-PA
Luo, S., Lutkenhaus, J. L., and Nasrabadi, H. (2020). Effect of nanoscale pore-size distribution on fluid phase behavior of gas-improved oil recovery in shale reservoirs. SPE J. 25 (3), 1406–1415. doi:10.2118/190246-PA
Lu., Taojie, Zeng., Kecheng, and Jiang, Peixue, (2022). Competitive adsorption in CO2 enhancing shale gas: low-field NMR measurement combined with molecular simulation for selectivity and displacement efficiency model. Chem. Eng. J., 440–135865. doi:10.1016/j.cej.2022.135865
Morishige, K., Fujii, H., Uga, M., and Kinukawa, D. (1997). Capillary critical point of argon, nitrogen, oxygen, ethylene, and Carbon dioxide in MCM-41. Langmuir 13 (13), 3494–3498. doi:10.1021/la970079u
NajeebAlharthy., S., Nguyen., Thanh N., Teklu., Tadesse W., Kazemi., Hossein, and Graves., Ramona M. “Multiphase compositional modeling in small-scale pores of unconventional shale reservoirs,” in Proceedings of the SPE Annual Technical Conference and Exhibition, SPE-166306-MS, New Orleans, Louisiana, USA, September 2013. doi:10.2118/166306-MS
NIST. (2018). Thermophysical properties of fluid systems. Gaithersburg, Maryland, United States: NIST.
Nojabaei, B., Johns, R. T., and Chu, L. (2013). Effect of capillary pressure on phase behavior in tight rocks and shales. SPE J. 16 (3), 281–289. doi:10.2118/159258-PA
Peng, D. Y., and Robinson, D. B. (1976). A new two-constant equation of state. Ind. Eng. Chem. Fundamen. 15 (1), 59–64. doi:10.1021/i160057a011
Pitakbunkate, , Balbuena, P. B., and Moridis, G. J. “Effect of confinement on PVT properties of hydrocarbons in shale reservoirs,” in Proceedings of the SPE Annual Technical Conference and Exhibition, Amsterdam, Netherlands, October 2014. doi:10.2118/170685-MS
Qi, Liao., Zhou., Junping, and Xian, Xuefu, (2023). Competition adsorption of CO2/CH4 in shale: implications for CO2 sequestration with enhanced gas recovery. Fuel, 339–127400. doi:10.1016/j.fuel.2023.127400
Rachford, H. H., and Rice, J. D. (1952). Procedure for use of electronic digital computers in calculating flash vaporization hydrocarbon equilibrium. JPT, J. Pet. Technol. 4 (10), 19–23. doi:10.2118/952327-G
Rouquerol, J., Avnir, D., Fairbridge, C. W., Everett, D. H., Haynes, J. M., Pernicone, N., et al. (1994). Recommendations for the characterization of porous solids (technical report). Pure Appl.Chem. 66 (8), 1739–1758. doi:10.1351/pac199466081739
Samuel, Afari., Kegang, Ling., and Sennaoui, Billel, (2022). Optimization of CO2 huff-n-puff EOR in the Bakken Formation using numerical simulation and response surface methodology. J. Petroleum Sci. Eng., 215–110552. doi:10.1016/j.petrol.2022.110552
Sing, K. S. W., Everett, D. H., and Haul, R. A. W., (1985). Reporting physisorption data for gas/solid systems with special reference to the determination of surface area and porosity (recommendations 1984). Pure Appl. Chem. 57 (4), 603–619. doi:10.1351/pac198557040603
Singh, S. K., Sinha, A., Deo, G., and Singh, J. K. (2009). Vapor-liquid phase coexistence, critical properties, and surface tension of confined alkanes. J. Phys. Chem. 113 (17), 7170–7180. doi:10.1021/jp8073915
Singh, S. K., and Singh, J. K. (2011). Effect of pore morphology on vapor–liquid phase transition and crossover behavior of critical properties from 3d to 2d. Fluid Phase Equilibria 300 (1-2), 182–187. doi:10.1016/j.fluid.2010.10.014
Song, Y., Gu, S., Song, Z., Zhang, Z. Y., Chang, X. Y., and Guo, J. (2020b). Effect of confinement on the three-phase equilibrium of water-oil-CO2 mixtures in nanopores. Petroleum Sci. 1 (19), 203–210. doi:10.1016/j.petsci.2021.09.024
Song, Z., Song, Y., Guo, J., Zhang, Z., and Hou, J. (2020a). Adsorption induced critical shifts of confined fluids in shale nanopores. Chem. Eng. J. 385, 123837. doi:10.1016/j.cej.2019.123837
Sui, Hongguang., and Yao, Jun. (2016). Molecular simulation of competitive adsorption of CO2/CH4 in kerogen. J. China Univ. Petroleum Nat. Sci. Ed. 40 (2), 147–154. doi:10.3969/j.issn.1671-1815.2016.11.023
Sun, L., Liu, H., He, W., Li, G., Zhang, S., Zhu, R., et al. (2021). An analysis of major scientific problems and research paths of Gulong shale oil in Daqing Oilfield. NE China 48 (03), 453–463. doi:10.11698/PED.2021.03.02
Teklu, T. W., Alharthy, N., Kazemi, H., Yin, X., Graves, R. M., and AlSumaiti, A. M. (2014). Phase behavior and minimum miscibility pressure in nanopores. SPE Reserv. Eval. Eng. 17 (3), 396–403. doi:10.2118/168865-PA
Travalloni, L., Castier, M., and Tavares, F. W. (2014). Phase equilibrium of fluids confined in porous media from an extended Peng–Robinson equation of state. Fluid Phase Equilibria 362, 335–341. doi:10.1016/j.fluid.2013.10.049
Vishnyakov, A., Piotrovskaya, E. M., Brodskaya, E. N., Votyakov, E. V., and Tovbin, Y. K. (2001). Critical properties of Lennard-Jones fluids in narrow slit-shaped pores. Langmuir 17 (14), 4451–4458. doi:10.1021/la001641a
Wang, J., Luo, H., Liu, H., Cao, F., Li, Z., and Sepehrnoori, K. (2017). An integrative model to simulate gas transport and production coupled with gas adsorption, non-Darcy flow, surface diffusion, and stress dependence in organic-shale reservoirs. SPE J. 22 (1), 244–264. doi:10.2118/174996-PA
Wang, L., Neeves, K. B., Yin, X. L., and Ozkan, E. “Experimental study and modeling of the effect of pore size distribution on hydrocarbon phase behavior in nanopores,” in Proceedings of the Paper presented at the SPE Annual Technical Conference and Exhibition Paper SPE-170894-MS, Amsterdam, Netherlands, October 2014. doi:10.2118/170894-MS
Whitson, C. H., and Sunjerga, S. “PVT in liquid-rich shale reservoirs,” in Proceedings of the presented at the SPE Annual Technical Conference and Exhibition, San Antonio, Texas, USA, October 2012. doi:10.2118/155499-MS
Yang, G., Fan, Z. Q., and Li, X. L. (2019). Determination of confined fluid phase behavior using extended Peng-Robinson equation of state. Chem. Eng. J. 378, 122032. doi:10.1016/j.cej.2019.122032
Yang, G., and Li, X. L. (2020). Modified Peng-Robinson equation of state for CO2/hydrocarbon systems within nanopores. J. Nat. Gas Sci. Eng. 84 (12), 103700. doi:10.1016/j.jngse.2020.103700
Zarragoicoechea, G. J., and Kuz, V. A. (2004). Critical shift of a confined fluid in a nanopore. Fluid Phase Equilibria 220, 7–9. doi:10.1016/j.fluid.2004.02.014
Zhang, K., Jia, N., and Liu, L. (2019a). Generalized critical shifts of confined fluids in nanopores with adsorptions. Chem. Eng. J. 372, 809–814. doi:10.1016/j.cej.2019.04.198
Zhang, Y., Di, Y., Yu, W., and Kamy, S. (2019b). A comprehensive model for investigation of Carbon dioxide enhanced oil recovery with nanopore confinement in the bakken tight oil reservoir. SPE Res Eval Eng. 22 (1), 122–136. doi:10.2118/187211-PA
Zhao., Yinuo, and Jin., Zhehui (2019). Hydrocarbon-phase behaviors in shale nanopore/fracture model: multiscale, multicomponent, and multiphase. SPE J. 24 (6), 2526–2540. doi:10.2118/198908-PA
Zongfa, Li., Su., Yuliang, and She, Fuxiao, (2023). Investigation of CO2 storage and EOR of alternating N2 and CO2 injection using experiments and numerical simulation. Fuel, 340–127517. doi:10.1016/j.fuel.2023.127517
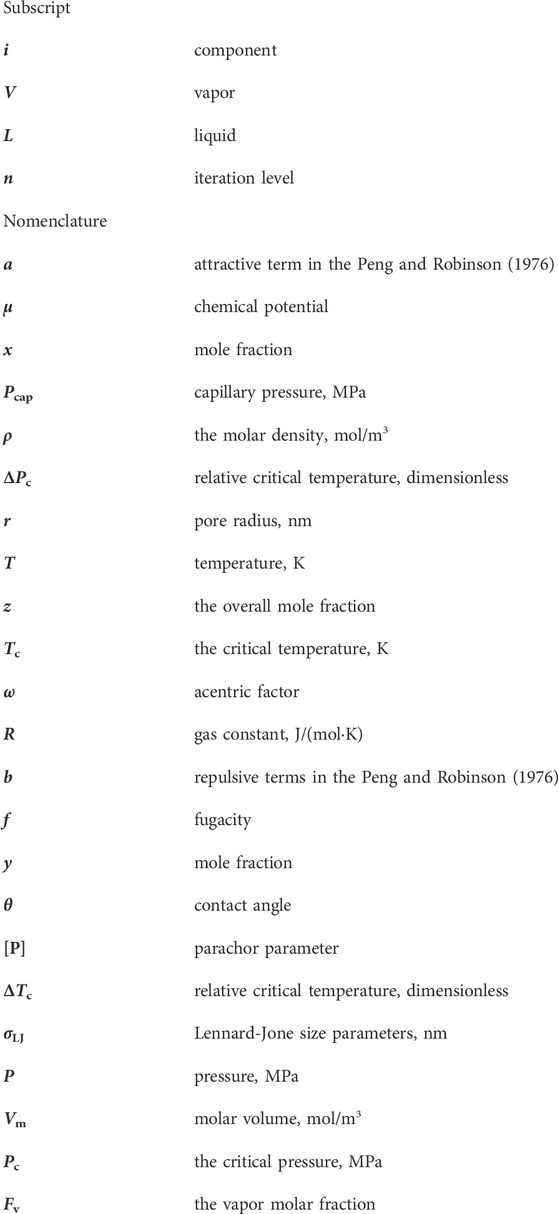
Nomenclature
Keywords: shale oil reservoir, nano-confinement effect, vapor-liquid equilibrium calculation, phase behavior, production performance, CO2-EOR
Citation: Wang Y, Cao R, Jia Z, Huang T, Jia P, Cheng L, Duan W and Sun Z (2023) Phase behavior and hydrocarbons distribution in shale oil during EOR with nano-confinement effect. Front. Energy Res. 11:1237254. doi: 10.3389/fenrg.2023.1237254
Received: 09 June 2023; Accepted: 07 August 2023;
Published: 23 August 2023.
Edited by:
Liwu Jiang, University of Regina, CanadaReviewed by:
Zhilin Cheng, Xi’an Shiyou University, ChinaShansi Tian, Northeast Petroleum University, China
Copyright © 2023 Wang, Cao, Jia, Huang, Jia, Cheng, Duan and Sun. This is an open-access article distributed under the terms of the Creative Commons Attribution License (CC BY). The use, distribution or reproduction in other forums is permitted, provided the original author(s) and the copyright owner(s) are credited and that the original publication in this journal is cited, in accordance with accepted academic practice. No use, distribution or reproduction is permitted which does not comply with these terms.
*Correspondence: Renyi Cao, Y2FvcmVueWlAMTI2LmNvbQ==
†These authors share first authorship