 Yangyang Ke
 Qingshu Wang1*
- 1School of Electrical and Electronic Engineering, Hubei University of Technology, Wuhan, China
- 2School of Power and Machinery, Wuhan University, Wuhan, China
The health state of hydroelectric power generation units is of great significance to ensure the stability and economy of safe operation of the power grid. In order to address the challenges in existing assessment methods of the insufficient reliability of the evaluation of multi-complex systems and the inability to reflect anomalies of a single index. A state evaluation model based on combination weighting and improved fuzzy comprehensive evaluation method is accordingly proposed. First, a hierarchical analysis system is constructed based on actual monitoring indicator data from the hydropower unit. Optimal comprehensive and indicator weights are subsequently obtained for each indicator level using a combination of the improved hierarchical analysis and CRICIT method through game theory. Next, the industry guidelines and regulations are difficult to effectively determine the limit values of each index of the unit, and they do not fully take into account the actual situation of the unit itself and the huge amount of accumulated historical health data. To address this issue. The Gaussian threshold method was proposed to determine the limit values of the monitoring data for each indicator, which more accurately determines the indicator thresholds as well as their standard values. The degradation degree of the hydroelectric unit can be calculated by comparing the real-time monitoring data with these limits. Finally, the combined weights of dynamic change and the fuzzy evaluation matrix are used to obtain the state evaluation matrix reflecting the condition of the turbine. The proposed approach is validated using the actual monitoring data and operating conditions for case study hydroelectric station, The results show that the improved evaluation method has an optimal evaluation effect.
1 Introduction
Hydroelectric power generation is the most common renewable energy source and a critical means to reduce CO2 emission (Awan et al., 2023). With the adjustment of China’s energy structure, hydropower generation has become an indispensable method for generating power, due to its excellent stability. Therefore, it is critical to fully utilize the power generation functionality of hydraulic turbine sets to ensure the safe and stable operation of the power grid. This requires highly reliable hydroelectric generator sets, which can be ensured by evaluating the health state of hydropower units through monitoring and analyzing their parameters to assess whether there is any anomaly or potential risk of unit failure. This allows unit faults to be discovered in a timely manner and appropriate repair and maintenance procedures to be implemented, improving dependability and stability while extending service life. Thus, the steady operation of the power system and the quality of the power supply can be ensured (Zeng et al., 2023).
The main elements of the comprehensive condition assessment of hydropower units combine the structural system of the equipment with the distribution of measurement points, Extracting and constructing correlation indicators that reflect the operational health state, and integrating the performance indicators to make a holistic and global evaluation of the system health state. In recent years, as the concept of condition maintenance continues to advance, The power industry has successively established comprehensive condition detection systems, A wealth of measurement point information provides data support for the overall evaluation of the health state of the equipment, Condition assessment theory and techniques have also developed considerably, Commonly used condition evaluation methods include hierarchical analysis (Ge et al., 2020), cluster analysis (Hu et al., 2019), fuzzy comprehensive evaluation (Fang et al., 2016), grey system theory (Huang et al., 2022), etc.
In terms of calculating the weights, hierarchical analysis, as a classic system analysis method, is widely used in risk assessment, resource allocation, equipment evaluation and other fields due to its clear structure, hierarchical nature and adaptability to complex systems (Zhang H. et al., 2020; Liu et al., 2022; Cai et al., 2023; Zhu et al., 2023). Yucesan and Kahraman (2019) use hierarchical analysis for risk assessment of hydropower plants to help ensure grid security and prevent economic losses. Zeng et al. (2023) used hierarchical analysis and fuzzy integrated evaluation method to assess water resources pollution and proposed risk level evaluation, A hierarchical analysis is a traditional analysis method comprising a simple hierarchical structure (Ma et al., 2020). However, this method has several drawbacks: 1) It is extremely difficult to test the consistency of judgement matrices 2) the assignment of indicators relies too much on the experience of experts and is not objective enough. The fuzzy hierarchical analysis method (Doz et al., 2023) used in this paper not only retains the advantages of hierarchical analysis, but also adds a fuzzy consistency matrix, which ensures the consistency of the judgement matrix and solves the problem of the difficulty of checking whether the judgement matrix is consistent. Also, due to its lack of objectivity, this paper applies the CRITIC method (Krishnan et al., 2021; Wen et al., 2022) to calculate its objective weights through historical health samples. However, subjective weights or objective weights cannot fully represent the weights of the indicator, in order to allocate the rationality of the weights, the method of game theory (Li H. et al., 2022; Li et al., 2023) is introduced to calculate the optimal weights, so as to make its weight allocation more reasonable.
Although fuzzy theory has made many advances in equipment condition evaluation, there are still some limitations in its research and application in the field of hydropower units: 1) It is difficult to determine the indicator limit value, and when using the affiliation function, it is necessary to calculate the indicator degradation degree according to the indicator limit value. 2) It fails to consider the influence of the unit’s own operating conditions well. Hydropower units in different operating conditions, some state parameters such as pendulum, temperature, etc., there will be a big difference, the general use of uniform regulations to calculate the state of deterioration degree lack of reasonableness: 3) indicators of deterioration degree of different intervals and affiliation function of the mapping of the different evaluation state of the relationship between the lack of effective explanation. Geng and Liang (2022) proposed the degradation degree of hydropower units and applied the principle of maximum affiliation to determine the condition of the units, providing scientific guidance for the evaluation of the health of hydropower generators. Li C. et al. (2022) constructed a hierarchical index system for transmission lines and combined it with the triangular-semi-trapezoidal affiliation function in fuzzy theory, Second, the mapping relationship between the different degradation degree intervals and evaluation states of the affiliation function lacks effective and reasonable explanation. Therefore, to evaluate the unit health state more accurately, the Gaussian threshold method (Zhang et al., 2022; Paialung et al., 2023) can be used to determine the indicator limit value. This study accordingly proposed an improved adaptive fuzzy comprehensive evaluation model for hydropower units that combines the Gaussian threshold method with the fuzzy comprehensive evaluation method to achieve a more effective and reliable evaluation of unit status.
To address to the shortcomings of current hydropower unit evaluation research, an adaptive fuzzy evaluation model that integrates the game theory-based combination of assignment with an improved fuzzy comprehensive evaluation is proposed in this paper. Based on the structure of the research object and the distribution of measurement points, the fuzzy hierarchical analysis method is used to construct the unit hierarchy system (Tian et al., 2020; Xia et al., 2020) and calculate the subjective weights for indicator parameters. The objective weights of each indicator are calculated by the CRITIC method based on historical monitoring data, and the corresponding optimal objective and subjective weights are subsequently calculated using game theory. Then, the state affiliation of each indicator is determined according to the improved comprehensive evaluation model to determine the unit state. In the final results, it is found that in the hydropower unit indicator evaluation system, the influence of the weight of the bottom indicator on the overall evaluation results is weakened with the increase of the number of transmission layers, which is similar to the phenomenon of the disappearance of the gradient of the neural network. Therefore, this paper proposes a variable weighting algorithm (Fu et al., 2017) with a penalty factor that can adaptively adjust the weight of the indicator according to the operating state of the indicator, and applies it through the case study and verifies its optimal evaluation effect by comparing the improved method with other methods without improvement.
2 Safety evaluation system for hydropower units
Due to the complex structure of hydropower units, the need to monitor many parts, the need to monitor many parts, and the differences in the types of measurement points between different power plants and unit models, a hydropower unit evaluation system can be constructed using division by components or division according to monitoring signals. The latter approach was applied in this study. The monitoring signals for a hydraulic turbine system can be divided into pendulum, vibration type, pressure pulsation, and temperature type signals. In order to reflect the real operation of the unit and determine the reliability of the evaluation method, this study constructed a hierarchical analysis system according to the type of monitoring signals (Zhang et al., 2023), taking Unit 4 of a power plant as an example. This hydropower unit was divided into the three layers shown in Figure 1.
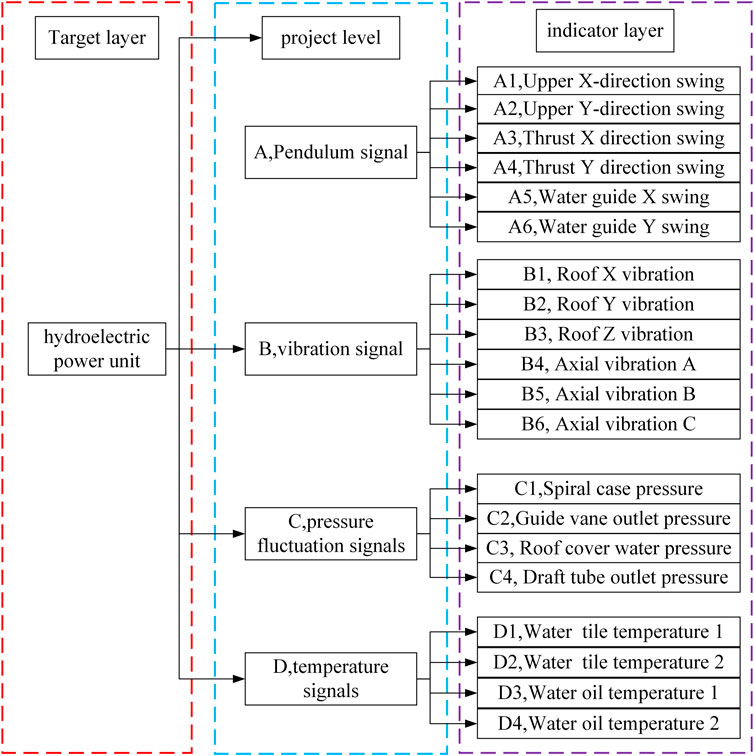
FIGURE 1. Hydraulic turbine system hierarchy system.
A goal layer, project layer, and indicator layer. The project layer consists of the four monitoring signal types: pendulum, vibration, pressure pulsation, and temperature. The indicator layer comprises the different measurement points under each of the four signals, comprehensively reflecting the operation status of the hydropower unit.
3 Combinatorial empowerment via game theory
How to scientifically and reasonably determine the weights of indicators for the evaluation of hydropower units has a significant impact on the evaluation structure. Currently, the commonly used evaluation methods include subjective and fuzzy methods. If the calculation process is complicated and inaccurate, no traditional evaluation method will lead to acceptable solution. In such cases, need for improvement of the capacity of the single assessment methodology to address practical problems. Therefore, this study combined a game theory weight determination method with the subjective weights of the fuzzy hierarchical analysis method and the objective weights of the CRITIC method to obtain the two optimal weight vectors through game aggregation.
3.1 Fuzzy hierarchical analysis method
The fuzzy hierarchical analysis method has been widely used as a basis for quantifying evaluation indicators and selecting an optimal solution. It combines a fuzzy consistency matrix with a hierarchical analysis, retaining the advantages of the latter while overcoming its fuzziness in the judgment matrix to ensure consistency and functionality more to imitate the human decision-making.
The fuzzy complementary matrix of hydropower unit evaluation indicators can be established by comparing the evaluation indicators
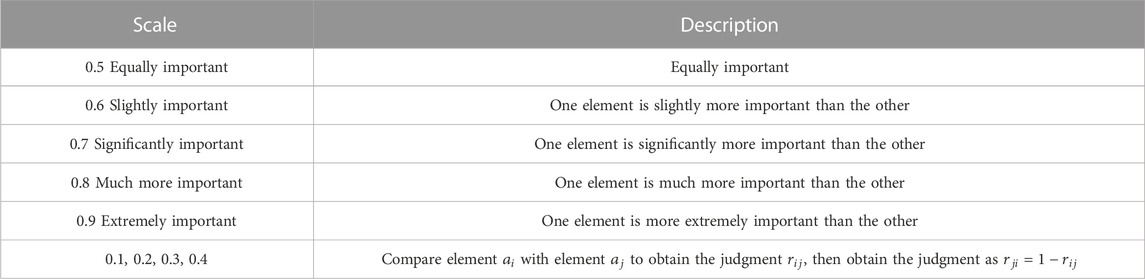
TABLE 1. Meaning of affiliation values used to compare indicators on a scale of 0.1–0.9.
As shown in Table 1,
The matrix transformation conducted according to Eq. 1 yields the fuzzy judgment matrix E =
where
3.2 CRITIC method
The CRITIC method is an objective weighting method that uses the quantity of information for each indicator to calculate the value of its weight. This represents a superior method compared to entropy weighting or the coefficient of variation when the information describing each indicator to be evaluated is provided by varying intensities and conflicts with that describing other indicators. Indeed, the CRITIC method determines the weights not only by taking the variability of the indicator information as a premise, but also by combining the correlation between indicators, thereby preventing subjective factors from having an outsized effect and causing the results to deviate from objective reality.
Indicator dissimilarity is generally expressed as a standard value that represents the volatility of the indicator; the greater the volatility, the greater the indicator dissimilarity. Conflict between two different indicators is expressed in terms of correlation; the greater the conflict, the smaller the correlation.
Generally, CRITIC method modeling is conducted using the following steps.
(1) Dimensionless processing
Considering the inconsistency in the scale of the data for each indicator, dimensionless processing is first conducted on each indicator to remove the influence of such inconsistency on the evaluation results. When there are many objects to be evaluated, standardization can be used for this task as follows:
where
(2) Calculate indicator dissimilarity
The CRITIC method uses the standard deviation to express the variability between indicators as follows:
where
(3) Calculate indicator conflict
Indicator conflict is expressed in terms of the correlation coefficient as follows:
where
(4) Calculate quantity of information
The quantity of information is determined by:
(5) Calculate the objective weights
The objective weight of the
and
3.3 Portfolio empowerment based on game theory
Game theory provide a mathematical method for investigating how to make decisions and maximize benefits when there are multiple struggling or competing individuals in a group. When used in subjective–objective combination weight calculations, game theory can apply weighting to the combinations between indictors and determine weights that deviate the least from each basic value, thereby ensuring that the calculated values match the actual situation. This “portfolio empowerment” method is conducted as follows.
(1) Employ the game theory concept of outlier minimization to find the optimal weights
where
(2) Normalize the obtained
(3) Assign a combination of weights to obtain the combined weight of the evaluation indicators as
and the combined weight vector is
4 Improved fuzzy comprehensive evaluation method
The indicator monitoring volume limits determined using regulation guidelines are not clear and do not consider the actual operating conditions of the hydropower unit. However, the indicator thresholds obtained from historical indicator monitoring data can accurately reflect the unit status. Therefore, to evaluate the health state of the hydropower unit more accurately, the indicator limits are determined from these data using the Gaussian threshold method.
4.1 Determination of the indicator limits using Gaussian thresholds
The indicator data from a hydropower unit include random measurement errors and exhibit obvious normal distribution characteristics (Zheng et al., 2017; Zhang S. et al., 2020), as shown in Figure 2. For normally distributed unit monitoring indicators
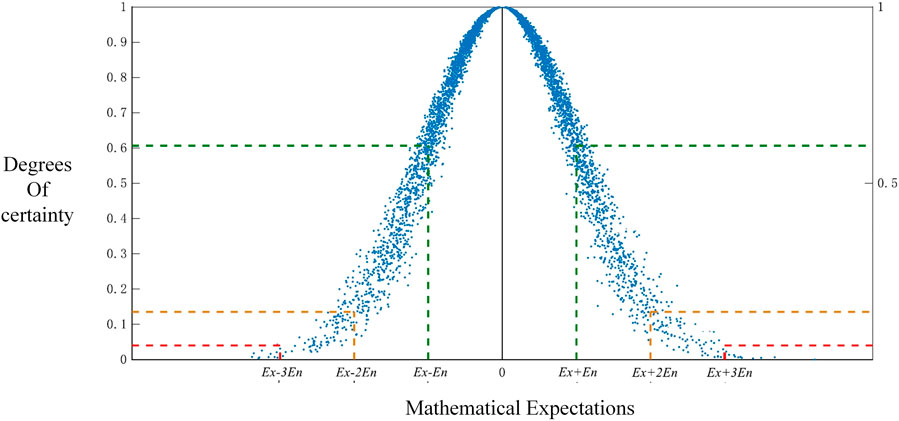
FIGURE 2. Normal distribution chart.
4.2 Determination of degradation
The degradation degree when using indicators for which larger values are better is expressed as:
where
The degradation degree when using indicators for which smaller values are better is given by:
where
4.3 Improved fuzzy comprehensive evaluation method
When establishing the safety evaluation model for a hydropower unit in use, most of the risk evaluation indicators have randomness, fuzziness, and other uncertainties. The fuzzy comprehensive evaluation method has unique advantages for solving such problems. Fuzzy comprehensive evaluation is based on fuzzy mathematics and uses fuzzy relationship synthesis to quantify factors with unknown boundaries that are not easy to quantify, then comprehensively evaluate the system considering multiple factors. This approach is based on correlation theory, which converts a qualitative evaluation into a quantitative evaluation. This study accordingly adopted the fuzzy comprehensive evaluation method to evaluate and analyze the state of hydropower units.
The triangular/semi-trapezoidal membership function has been widely used in fuzzy comprehensive assessments due to its simple distribution, and it provides results comparable to other more complex membership functions used in risk assessments and equipment evaluations. However, as the degradation values used in the traditional triangular/semi-trapezoidal affiliation function for equipment evaluation depend on expert experience, and the correspondence among different levels lacks explanation. To explain the rationality of the relationships corresponding to different evaluation levels, an improved triangular/semi-trapezoidal affiliation function was proposed for use in this study as shown in the diagram in Figure 3.
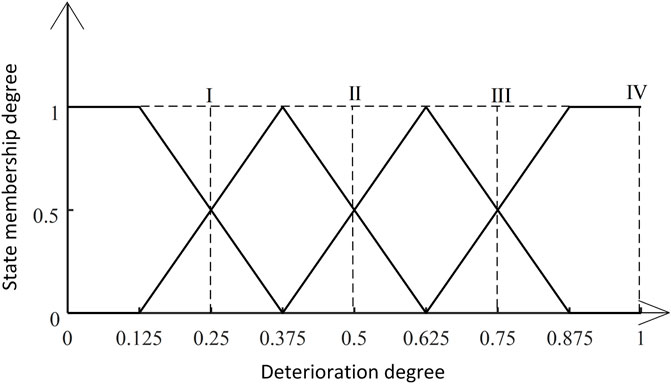
FIGURE 3. Improved triangle-semi-trapezoid affiliation function graph.
The diagram shows that the hydropower unit can be classified into four states:
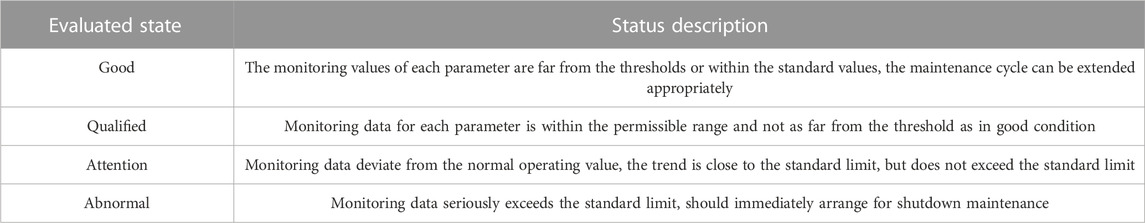
TABLE 2. Hydroelectric unit condition evaluation table.
Since the hydropower unit indicators exhibit normal distribution characteristics, as shown in Figure 2, the hydropower unit states in Table 2 were defined using the four indicator value intervals shown in Table 3. These intervals are defined as
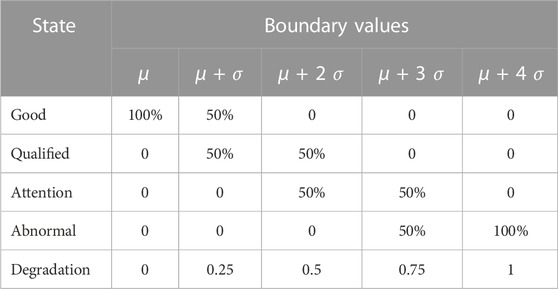
TABLE 3. Correspondence between indicator boundary values and unit states.
According to the intervals defined in Table 3 and based on the triangular/semi-trapezoidal affiliation function in Figure 3, the expressions for the affiliation function were constructed as follows:
5 Case study example
5.1 Hydropower unit health assessment process
The following sequence was used to conduct the hydropower unit case study in this example (a flow chart of this process is provided in Figure 4).
1) According to the actual situation of the case study hydropower plant unit structure and the arrangement of measurement points, a hierarchical analysis system was constructed by dividing the unit into a target layer, project layer, and indicator layer. Historical health data describing the oscillation, vibration, pressure, and temperature indicators—included in the project layer—were obtained under the same working conditions used in the example calculation.
2) Next, a fuzzy hierarchical analysis was employed to determine the subjective weights of the items in the project and indicator layers. The historical health data were inserted into the CRITIC method to determine the objective weights for the items in the indicator layer, and the optimal comprehensive weights were determined based on game theory principle by combining the subjective and objective weights.
3) The upper limit, lower limit, and benchmark value for each indicator were obtained using the Gaussian threshold method and the corresponding historical data based on the indicator operating limits and real-time monitoring values.
4) Using the improved adaptive fuzzy comprehensive evaluation method as the health evaluation model, the indicators were divided into four intervals corresponding to good, qualified, attention, and abnormal states. The degradation degree for each indicator was substituted into Eqs 17–20 to obtain the state affiliation for each indicator corresponding to the oscillation, vibration, pressure, and temperature, thereby obtaining the indicator layer fuzzy evaluation matrix.
5) The variable weight theory was subsequently applied to adjust the weight for each indicator, and the fuzzy evaluation matrix was weighted and calculated to obtain the fuzzy evaluation matrix for the project level of the hierarchy structure.
6) The fuzzy evaluation matrix for the entire hydropower unit system was derived using variable weight theory, and the final hydropower unit evaluation result was obtained according to the principle of maximum subordination.
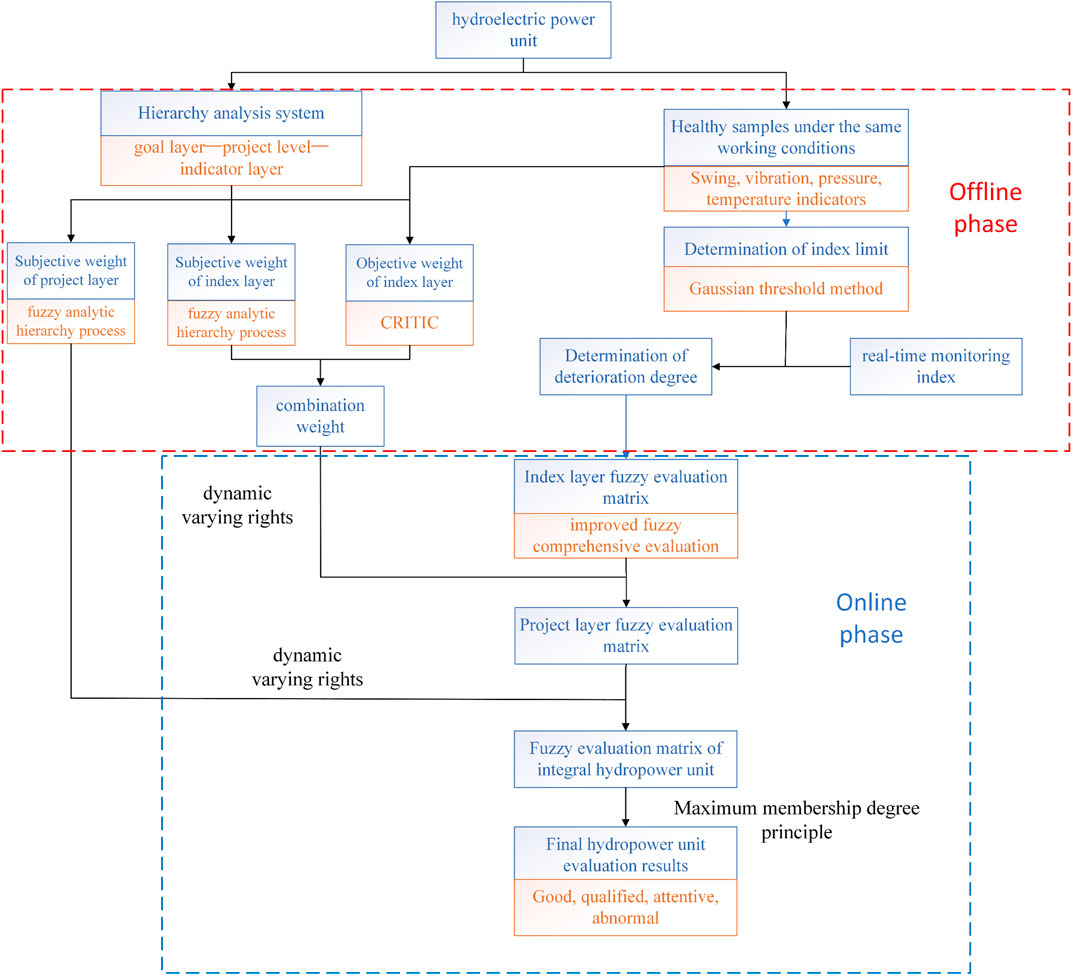
FIGURE 4. Flowchart of the health model algorithm for hydropower units.
5.2 Calculation of portfolio weights
The subjective project level weights included vibration, oscillation, pressure pulsation, and temperature indicators. The hierarchical analysis method was used to determine the weight of each indicator type. As the vibration, oscillation, and pressure pulsation indicators changed faster and were more sensitive to the state of the unit, the indictor importance was defined as vibration fault = oscillation fault > pressure pulsation fault > temperature fault. According to the 0.1–0.9 scale, the fuzzy judgment matrix for the project level was determined as follows:
And the fuzzy consistency matrix was obtained as
and subjective weights at the project level were (0.3, 0.3, 0.233, 0.167).
The objective and subjective weights at the indicator level and the combination weights were subsequently obtained as shown in Table 4.
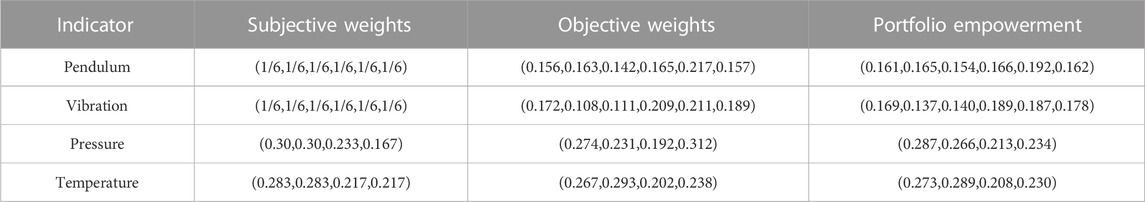
TABLE 4. Project layer weighting table.
5.3 Determination of indicator limits
According to the case study unit model and its parameters, including operating head and rated speed, and other parameters, the oscillation, vibration, pressure pulsation, and temperature indicator limits were obtained by consulting international industry regulations, as well as power station regulations and guidelines. Then, the historical health indicator data and Gaussian threshold method has been applied to obtain the final weights of the oscillation, vibration, and pressure pulsation, and temperature indicators as shown in Figure 5.
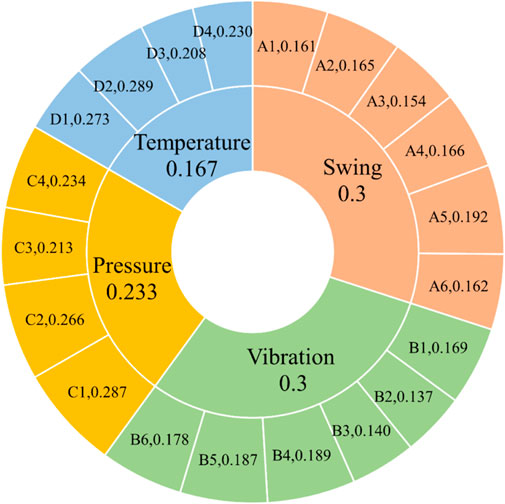
FIGURE 5. Combined weight assignment diagram.
5.4 Determination of degradation degree
As shown in Table 5, the axial vibration class indicators exhibited the largest variation. Therefore, the axial vibration class degradation graph was obtained as shown in Figure 6, which identifies five moments representing the degradation trend over time. Note that all monitoring indicators considered in this example were minimum optimal (smaller is better) type indicators.
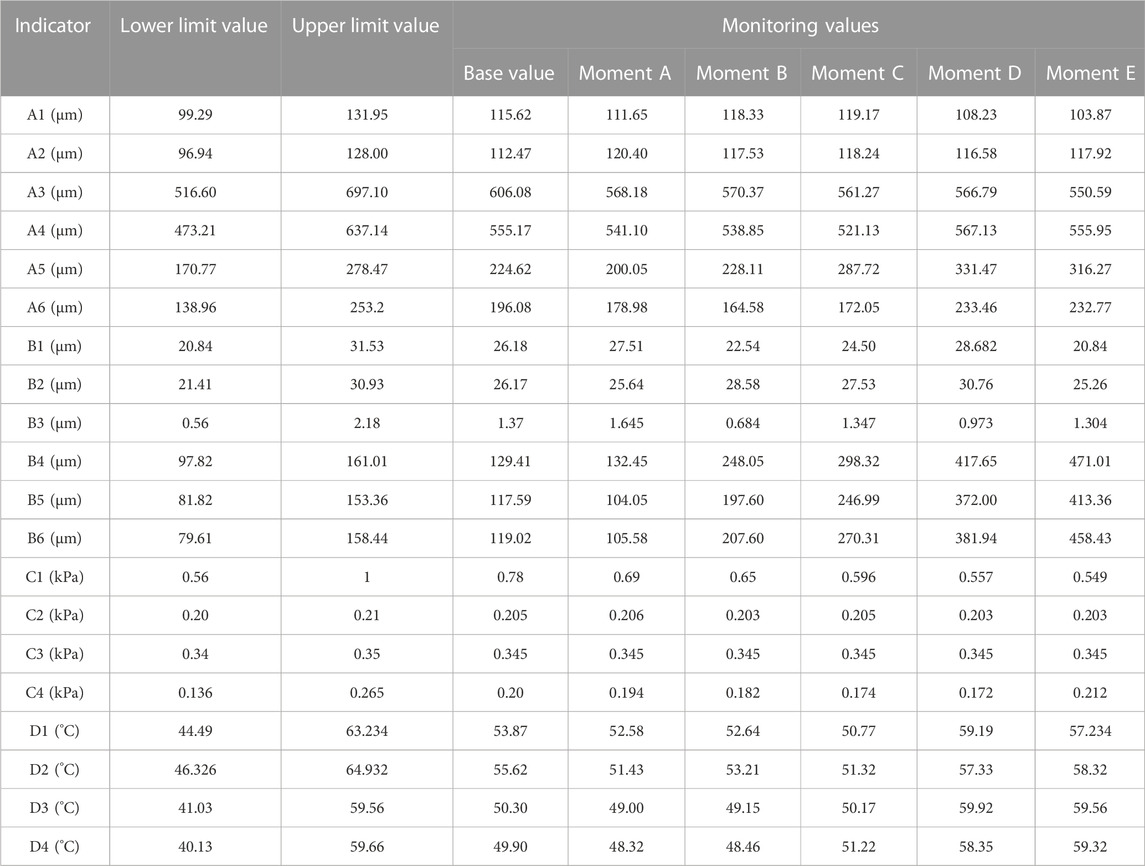
TABLE 5. Indicator limits and monitoring values at considered moments.
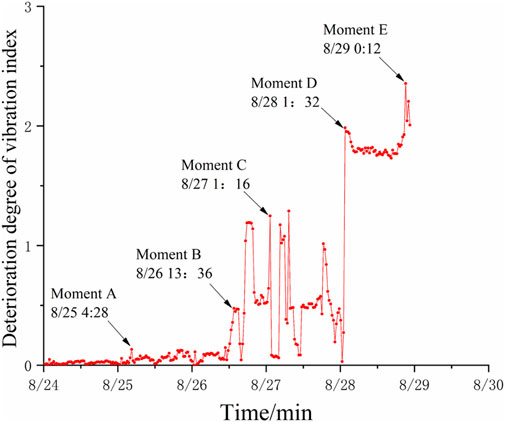
FIGURE 6. Trend of deterioration in axial vibration indicator.
5.5 Unit condition assessment
During the evaluation of hydropower units, the serious deviation of a certain indicator or indicator type from its normal value often means that the feature of this indicator is abnormal and must be paid careful attention, or the system should be shut down for maintenance (Xu et al., 2016; Lin et al., 2020). However, as the weight value of a problematic indicator could be quite small in practice, the state of the response may not be reflected in the results for the entire hydropower unit. Therefore, an adaptive penalty factor algorithm was introduced to adjust the weight of each indicator according to its operating state as follows:
where
The values of the indicators in Table 5 were substituted into Eq. 16 to obtain the deterioration degree for each indicator. These deterioration degrees were substituted into Eqs 17–20 to obtain the fuzzy evaluation matrix for each item level indicator as follows:
As shown above, the weight of each indicator was reallocated using the variable weight theory. According to the principle of maximum subordination, the top vibrations in the X- and Y-directions are in state 1 (corresponding to penalty factor
The vibration class fuzzy evaluation matrix was subsequently obtained based on the new vibration indicator weight vector as follows:
The fuzzy evaluation matrices for the other indicator types have been obtained similarly, then the project level fuzzy evaluation matrix has been determined as follows:
The new project layer weight vector has been obtained after the subjective weights of the project layer were weighted as
According to the calculated fuzzy evaluation matrix, the weights of each indicator were reallocated using variable weight theory, giving the results shown in Table 6.
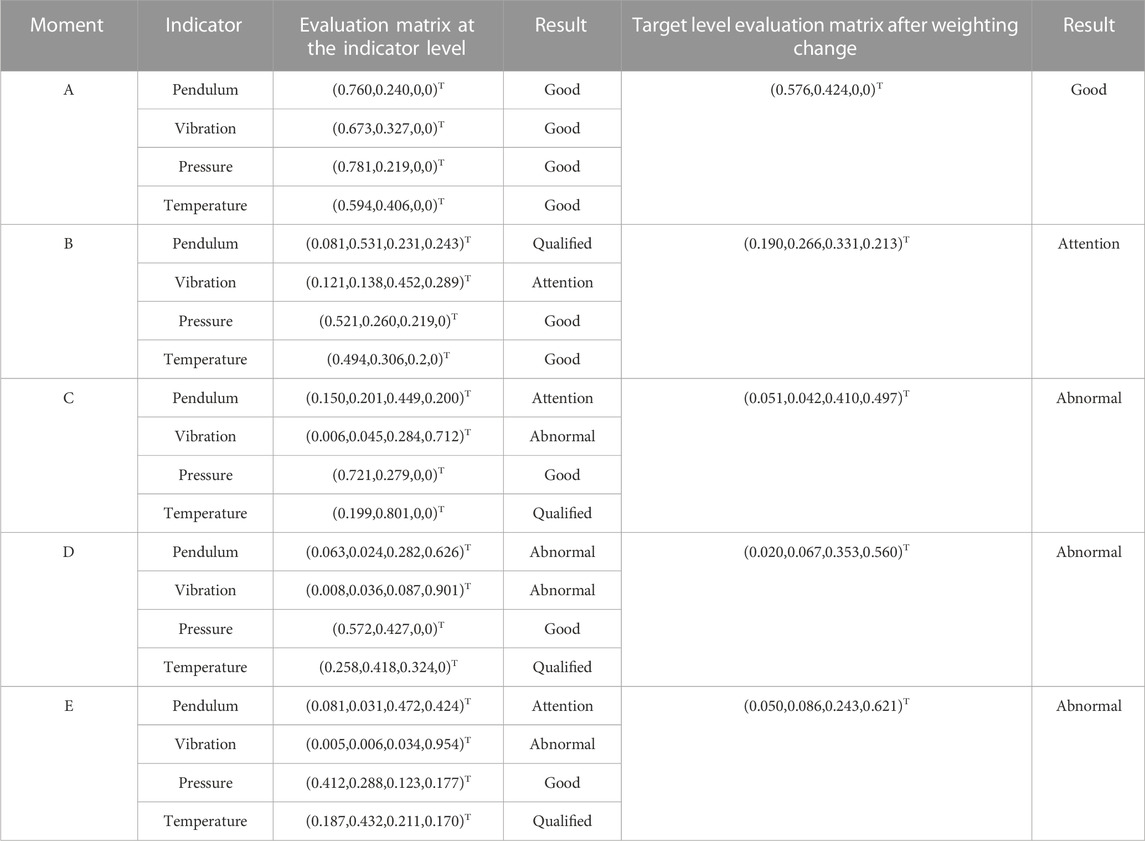
TABLE 6. Fuzzy evaluation matrix of hydropower station system at each moment.
Furthermore, the comprehensive deterioration degree of the hydropower unit is plotted in Figure 7, which shows that the deterioration of the hydroelectric unit increased obviously from August 26, with abnormalities at C, D, and E. At the end of August, the vibration of the case study unit was reported to have been quite violent. After an accident probe of the site personnel, it was determined that the runner chamber steel plate fell off during this time period, leading to a hydraulic imbalance that would obviously change the vibration pendulum signal. Thus, the calculated deterioration degree is consistent with the reported reality.
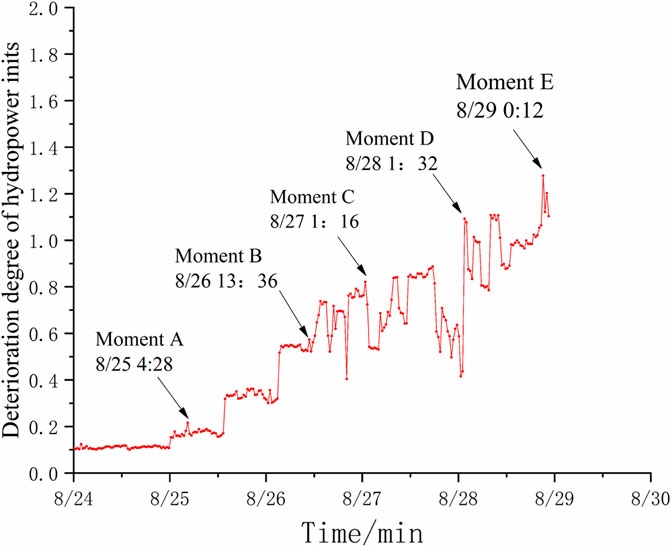
FIGURE 7. Comprehensive deterioration trend for the case study hydropower unit.
6 Comparison of methods
In order to further validate the advantages of the proposed method for the health assessment of hydropower units, two sets of controlled experiments are designed in this section: fuzzy assessment based on traditional monitoring quantities and regulatory guidelines, fuzzy assessment based on constant-weighted Gaussian thresholds (You et al., 2022).
6.1 Comparison with traditional guideline protocol-fuzzy evaluation methods
This method is compared with the fuzzy evaluation method for hydropower units, which is based on traditional monitoring quantities and regulations. According to the unit type, working head, rated speed and other parameters, the upper and lower limit values of each measurement point of the hydraulic turbine system under steady state operation are determined by consulting the national standards and regulations and the guidelines of power plant regulations, as shown in Table 7.
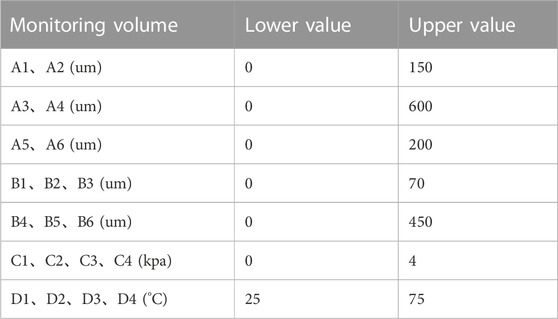
TABLE 7. Turbine system monitoring limits.
It can be seen that all the monitored quantities are of the smaller and better type, therefore the degree of deterioration is calculated according to Eq. 16, as shown in the traditional plot of the membership function in Figure 8:
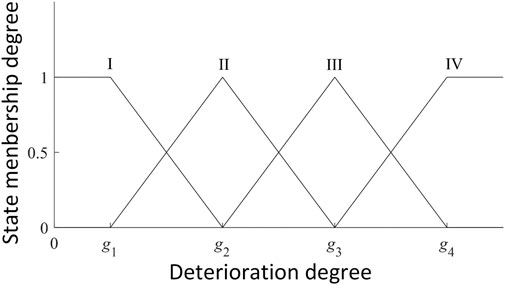
FIGURE 8. Distribution of traditional affiliation functions.
Where g1,g2,g3,g4, correspond to (0.2, 0.4, 0.6, 0.8), respectively, as a comparison to evaluate the operating status of the turbine system A-E at each moment, corresponding to the actual monitoring values shown in Table 5, According to Table 5, the final state evaluation table under the traditional fuzzy evaluation method can be obtained as shown in Table 8:

TABLE 8. Evaluation results of the state of each moment based on the traditional fuzzy evaluation method.
Table 8 shows that the turbine system status and vibration indexes at C, D, and E time are still assessed as qualified or attention, but at this time, through the comprehensive deterioration diagram of the unit, it is obvious to see that there are abnormalities in the unit, and the evaluation results obviously cannot reflect the real state of the unit, in contrast, the evaluation results based on the combination of the assignment and the Gaussian threshold method of the state of the unit are more in line with the actual situation, and can be more real and effective. Reflecting the actual operating status of the unit.
6.2 Comparison with unweighted methods
According to the real-time evaluation status of each component in the unit hierarchical analysis system, the penalty factor is introduced to dynamically adjust the original weights of each component, so as to propose an adaptive variable weighting method. Compare it with the evaluation method using fixed constant weights to verify the advantages of introducing the variable weight theory. When using constant weights, the penalty factors in Eq. 21 are all 1, and the results are shown in Table 9.
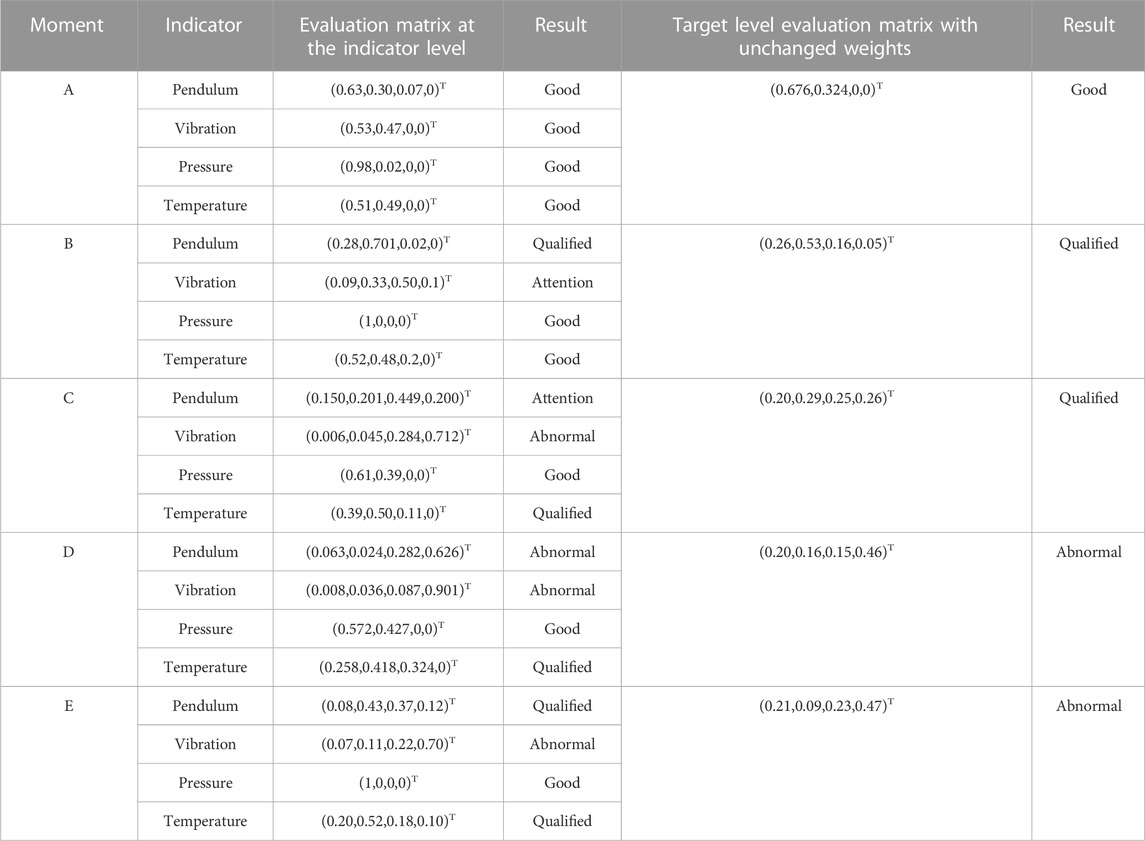
TABLE 9. Evaluation results of the state of each moment under constant weights.
Under the constant weighting mode, the evaluation status of the turbine system of the unit is qualified at two moments B and C. At this time, as shown in Figure 5, the vibration deterioration increases significantly and the evaluation results of vibration indexes at the two moments in Table 7 are attention and abnormality, respectively. In the case of a single category of indicators abnormal, but still the overall evaluation of the system as a qualified obviously does not match the actual situation. Figure 9 shows the difference between the evaluation results of the two methods more intuitively, and it can be seen that, Compared with the fixed constant weights, and conventional weights can not objectively reflect the serious deviation of indicators from the normal situation, so the introduction of variable weights theory can be based on the actual state of the unit to dynamically change the ratio of each component, highlighting the hidden equipment, variable weights mode of the unit’s condition assessment results and the actual operating state of the unit is more in line with the actual operating state of the unit.
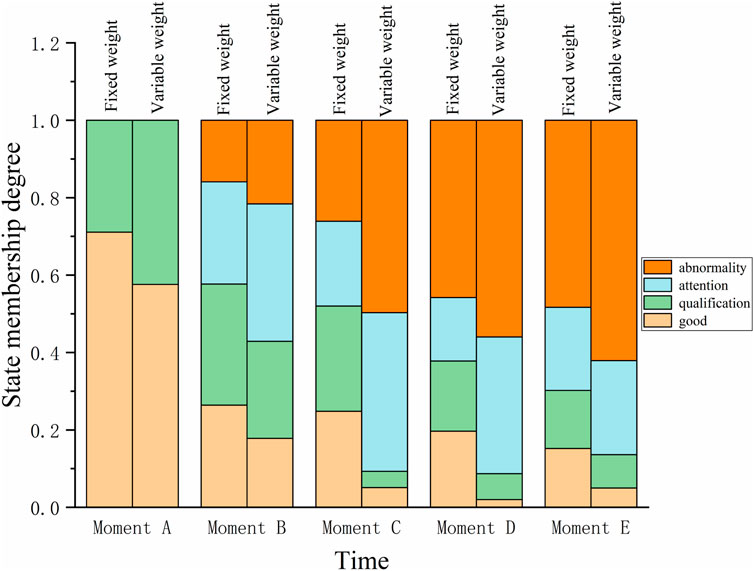
FIGURE 9. Comparison of the unit’s operational condition assessment using variable and fixed weights.
7 Conclusion
This study proposed a fuzzy comprehensive evaluation model using a combination of game theory assignment and the Gaussian threshold method to address difficulties associated with determining the indicator limits, the lack of reasonable correspondence between the degradation degree and the affiliation function, and the fact that indicator abnormality cannot be effectively reflected in the overall condition of the hydropower unit. The proposed model was confirmed to effectively and accurately reflect the operation of the case study example of unit 4 of a power station. The following conclusions were obtained by this study.
(1) The use of fuzzy comprehensive hierarchical analysis overcomes the lack of consistency in the traditional fuzzy hierarchical analysis by using historical health monitoring data to determine the objective weights via the CRITIC method. This results in more reasonable objective weights that can be analyzed using game theory to obtain the optimal values.
(2) Analysis of historical and real-time monitoring health indicator data can determine indicator limits using the Gaussian threshold method. When combined with the fuzzy comprehensive evaluation method, this results in a more accurate evaluation of the overall hydropower unit.
(3) Since the indicator weights for the bottom layer of the hierarchy will continue to decay in the overall evaluation results as the number of transmission layers increases, the serious deviation of a certain indicator from its normal value may go unnoticed as it accounts for a relatively small portion of the overall unit state. The use of a variable weight algorithm effectively solves the problem of individual indicator anomalies.
Data availability statement
The raw data supporting the conclusion of this article will be made available by the authors, without undue reservation.
Author contributions
YK: Conceptualization, Methodology, Software, Writing-Original Draft, Writing-Review and Editing, Investigation QW: Revision and viewing of papers HX: Discontinuation of data supply has been thesis revision ZL: Assisted completion JL: Check the papers. All authors contributed to the article and approved the submitted version.
Conflict of interest
The authors declare that the research was conducted in the absence of any commercial or financial relationships that could be construed as a potential conflict of interest.
Publisher’s note
All claims expressed in this article are solely those of the authors and do not necessarily represent those of their affiliated organizations, or those of the publisher, the editors and the reviewers. Any product that may be evaluated in this article, or claim that may be made by its manufacturer, is not guaranteed or endorsed by the publisher.
References
Awan, A., Kocoglu, M., Bandyopadhyay, A., Rej, S., and Altuntaş, M. (2023). Household fuel choices and consumption intensity in Pakistan: evidence from HIES data 2001-2019. Environ. Model. Assess., 2023, 1–16. doi:10.1007/s11356-023-27227-3
Cai, F., Hu, Z., Jiang, B., Ruan, W., Cai, S., and Zou, H. (2023). Ecological health assessment with the combination weight method for the river reach after the retirement and renovation of small hydropower stations. . Water 15 (2), 355. doi:10.3390/w15020355
Doz, D., Felda, D., and Cotič, M. (2023). Demographic factors affecting fuzzy grading: a hierarchical linear regression analysis. Mathematics 11 (6), 1488. doi:10.3390/math11061488
Edelmann, D., Móri, T. F., and Székely, G. J. (2021). On relationships between the Pearson and the distance correlation coefficients. Statistics Probab. Lett. 169, 108960. doi:10.1016/j.spl.2020.108960
Fang, R., Wu, M., and Jiang, S. (2016). On-line status assessment of wind turbines based on improved fuzzy comprehensive evaluation method. J. Intelligent Fuzzy Syst. 31 (6), 2813–2819. doi:10.3233/jifs-169163
Fu, L., Wei, Y., Fang, S., Zhou, X., and Lou, J. (2017). Condition monitoring for roller bearings of wind turbines based on health evaluation under variable operating states. Energies 10 (10), 1564. doi:10.3390/en10101564
Ge, L., Li, Y., Zhu, X., Zhou, Y., Wang, T., and Yan, J. (2020). An evaluation system for HVDC protection systems by a novel indicator framework and a self-learning combination method. IEEE Access 8, 152053–152070. doi:10.1109/access.2020.3017502
Geng, Q., and Liang, C. (2022). Turbine health evaluation based on degradation degree. Energy Rep. 8, 435–444. doi:10.1016/j.egyr.2022.01.214
Hu, A., Xie, N., and Zheng, M. (2019). Air quality evaluation based on grey clustering method: a case study of 74 cities in China. J. Grey Syst. 31 (2).
Huang, X., Wang, Z., and Liu, S. (2022). Health status evaluation method of CNC machine tools based on grey clustering analysis and fuzzy comprehensive evaluation. J. Intelligent Fuzzy Syst. 42 (4), 4065–4082. doi:10.3233/jifs-212406
Krishnan, A. R., Kasim, M. M., Hamid, R., and Ghazali, M. F. (2021). A modified CRITIC method to estimate the objective weights of decision criteria. Symmetry 13 (6), 973. doi:10.3390/sym13060973
Li, C., Chen, X., Li, Z., Zhang, Y., Yue, K., Ma, J., et al. (2022b). Comprehensive evaluation method of transmission line operating status based on improved combination weighting evaluation model. Energy Rep. 8, 387–397. doi:10.1016/j.egyr.2022.01.207
Li, H., Chen, L., Tian, F., Zhao, L., and Tian, S. (2022a). Comprehensive evaluation model of coal mine safety under the combination of game theory and TOPSIS. Math. Problems Eng. 2022, 1–15. doi:10.1155/2022/5623282
Li, X., Wang, J., and Sun, C. (2023). Safety evaluation of steel temporary beam service status based on the combination weighting-fuzzy model of game theory. Math. Problems Eng. 2023. doi:10.1155/2023/6271946
Lin, K., Chen, H., Xu, C. Y., Yan, P., Lan, T., Liu, Z., et al. (2020). Assessment of flash flood risk based on improved analytic hierarchy process method and integrated maximum likelihood clustering algorithm. J. Hydrology 584, 124696. doi:10.1016/j.jhydrol.2020.124696
Liu, G., Zhang, C., Zhu, Z., and Wang, X. (2022). Power quality assessment based on rough AHP and extension analysis. Energy Eng. 119 (3), 929–946. doi:10.32604/ee.2022.014816
Ma, Y., Wei, J., Li, C., Liang, C., and Liu, G. (2020). Fuzzy comprehensive performance evaluation method of rolling linear guide based on improved analytic hierarchy process. J. Mech. Sci. Technol. 34, 2923–2932. doi:10.1007/s12206-020-0624-3
Paialunga, P., and Corcoran, J. (2023). Damage detection in guided wave structural health monitoring using Gaussian process regression. Struct. Health Monit., 1, 147592172311593. doi:10.1177/14759217231159399
Tian, D., Wang, Y., and Yu, T. (2020). Fuzzy risk assessment based on interval numbers and assessment distributions. Int. J. Fuzzy Syst. 22, 1142–1157. doi:10.1007/s40815-020-00837-6
Wen, X., Nie, Y., Du, Z., and Huang, L. (2022). Operational safety assessment of straddle-type monorail vehicle system based on cloud model and improved CRITIC method. Eng. Fail. Anal. 139, 106463. doi:10.1016/j.engfailanal.2022.106463
Xia, P., Hu, X., Wu, S., Ying, C., and Liu, C. (2020). Slope stability analysis based on group decision theory and fuzzy comprehensive evaluation. J. Earth Sci. 31, 1121–1132. doi:10.1007/s12583-020-1101-8
Xu, X., Niu, D., Qiu, J., Wu, M., Wang, P., Qian, W., et al. (2016). Comprehensive evaluation of coordination development for regional power grid and renewable energy power supply based on improved matter element extension and TOPSIS method for sustainability. Sustainability 8 (2), 143. doi:10.3390/su8020143
You, P., Liu, S., and Guo, S. (2022). A hybrid novel fuzzy MCDM method for comprehensive performance evaluation of pumped storage power station in China. Mathematics 10 (1), 71. doi:10.3390/math10010071
Yucesan, M., and Kahraman, G. (2019). Risk evaluation and prevention in hydropower plant operations: a model based on Pythagorean fuzzy AHP. . Energy policy 126, 343–351. doi:10.1016/j.enpol.2018.11.039
Zeng, B., He, C., Mao, C., and Wu, Y. (2023). Forecasting China's hydropower generation capacity using a novel grey combination optimization model. Energy 262, 125341. doi:10.1016/j.energy.2022.125341
Zhang, B., Yan, X., Liu, G., and Fan, K. (2022). Multi-source fault diagnosis of chiller plant sensors based on an improved ensemble empirical mode decomposition Gaussian mixture model. Energy Rep. 8, 2831–2842. doi:10.1016/j.egyr.2022.01.179
Zhang, H., Li, W., Miao, P., Sun, B., and Kong, F. (2020a). Risk grade assessment of sudden water pollution based on analytic hierarchy process and fuzzy comprehensive evaluation. Environ. Sci. Pollut. Res. 27, 469–481. doi:10.1007/s11356-019-06517-9
Zhang, H., Xiu, B., Jiang, D., Zhuang, G., Zhang, Y., and Li, B. (2023). An evaluation method of health condition for wind turbine based on asymmetric proximity. Front. Energy Res. 11, 1111355. doi:10.3389/fenrg.2023.1111355
Zhang, S., Xiang, M., Xu, Z., Wang, L., and Zhang, C. (2020b). Evaluation of water cycle health status based on a cloud model. J. Clean. Prod. 245, 118850. doi:10.1016/j.jclepro.2019.118850
Zheng, K., Han, L., Guo, S., Wang, Z., Zhang, X., and Dong, X. (2017). Fuzzy synthetic condition assessment of wind turbine based on combination weighting and cloud model. J. Intelligent Fuzzy Syst. 32 (6), 4563–4572. doi:10.3233/jifs-169220
Keywords: health assessment, hydropower unit, game theory, fuzzy hierarchical analysis, combination weighting, CRITIC method, theory of variation
Citation: Ke Y, Wang Q, Xiao H, Luo Z and Li J (2023) Hydropower unit health assessment based on a combination weighting and improved fuzzy comprehensive evaluation method. Front. Energy Res. 11:1242968. doi: 10.3389/fenrg.2023.1242968
Received: 20 June 2023; Accepted: 02 October 2023;
Published: 16 October 2023.
Edited by:
Yaser Qudaih, Higher Colleges of Technology, United Arab EmiratesReviewed by:
Abdrabbi Bourezg, Higher Colleges of Technology, United Arab EmiratesHassan Migdadi, Higher Colleges of Technology, United Arab Emirates
Copyright © 2023 Ke, Wang, Xiao, Luo and Li. This is an open-access article distributed under the terms of the Creative Commons Attribution License (CC BY). The use, distribution or reproduction in other forums is permitted, provided the original author(s) and the copyright owner(s) are credited and that the original publication in this journal is cited, in accordance with accepted academic practice. No use, distribution or reproduction is permitted which does not comply with these terms.
*Correspondence: Qingshu Wang, MTUxNzIwODIxMjZAMTYzLmNvbQ==