 P. Priyanka1
 B. Nalini
 P. Christopher Selvin
- 1Department of Physics, Avinashilingam Institute for Home Science and Higher Education for Women, Coimbatore, India
- 2Department of Physics, Government Arts and Science College, Sathyamangalam, India
- 3Luminescence and Solid State Ionics Laboratory, Department of Physics, Bharathiar University, Coimbatore, India
- 4Chemistry Division, Bhabha Atomic Research Centre, Mumbai, India
- 5Homi Bhabha National Institute, Mumbai, India
Metal sulfides and alloy anodes are a good choice for sodium-ion batteries (SIBs) since they have many benefitting advantages such as higher specific capacity, good cyclic stability, and higher rate capability. Tin antimony (Sn2Sb3), as an anode, exhibits a remarkable theoretical capacity of 753 mAhg−1 that has not been realized so far for reaching the theoretical capacity; pulverization of sulfide-based material [copper sulfide (CuS)] along with tin antimonide would be a better option for obtaining a high-performance anode for SIBs. Hence, an attempt is made to study the pulverisation effects of these two materials when employed as an anode for SIBs. The pulverised compound CuS: Sn2Sb3 delivers an initial discharge capacity of 659 mAhg−1 at 0.1 Ag−1 vs. Na/Na+ with high stability retaining up to 100% efficiency over 100 cycles. The present work highlights the structural changes upon pulverisation and its impact on delivering higher capacity.
1 Introduction
The current Li-ion battery technology satisfies the massive energy demand, but their high cost, uneven distribution, lack of a Li source, and serious issues with dendrite growth that result in short circuits in existing batteries (Wu et al., 2019) call for consideration of battery alternatives. The failure of the Li-ion battery mostly lies in the fact that the thermal runaway is encountered at temperatures above 80°C (Minakshi, 2012). In this way, sodium-ion batteries (SIBs) are the promising candidates since sodium resources are rich with the technology analogous to LIBs and can be made available at a low cost (Hwang et al., 2017). The recent arena is to identify a suitable anode material for SIBs since the capacity is limited and shows unstable performance which hampers the commercial aspect of SIBs (Zhang et al., 2023). There are different types of anode materials viz., alloy, oxide, carbon, sulfide, and titanium-based materials employed for SIB applications. Majorly in the commercial application of LIBs, graphite anodes are employed since it delivers a laudable theoretical capacity of 372 mAhg−1 appended with good electrochemical performance and longer cycle life (Zhang et al., 2023). However, in the context of SIBs, graphite does not have good alloying properties with Na+, which is thermodynamically unfavourable, and it delivers a low coulombic efficiency during charge–discharge cycling (Veeraraghavan et al., 2002; Wang et al., 2014). Other than graphite, hard carbon is widely employed as an anode material for SIB applications due its highly stable nature of cycling (Wang et al., 2014). Still, hard carbon possesses a very low theoretical capacity of 300 mAhg−1.
Subsequently, metal sulfide-based anode materials are suitable candidates having excellent redox reversibility and relatively high capacity (Xiao et al., 2016; Zhao et al., 2023). Copper sulfide (CuS) is chosen as an anode material among all the other sulfide materials since the toxic levels are obviously lesser and attracts more attention. Owing to its wide range of properties, it has been employed in the fields of rechargeable lithium-ion batteries (Jache et al., 2014), LEDs (Liu et al., 2017), biosensors (Shi et al., 2015), photovoltaics (Dhasade et al., 2013), supercapacitors (Xu et al., 2016), photocatalysis (Li et al., 2010), and many other applications.
CuS has a good alloying reaction with sodium ions (Li et al., 2020).The intercalation and conversion reaction of CuS with sodium ions take place, as explained by Eqs 1, 2 as follows (Kim et al., 2017):
Different methods of preparation of CuS such as hydrothermal, microwave-assisted, co-precipitation, and solid-state reaction methods (Zhou et al., 2005; Nafees et al., 2011; Auyoong et al., 2013; Pejjai et al., 2019) have been adapted by various researchers. Although several scientists have reported better performance for the hydrothermal method (Auyoong et al., 2013) due to their hierarchical structures for preparation of CuS, the shortfall with the methodology in large-scale preparation cannot be ignored. On the other hand, the solid-state reaction method does not demand any solvent system and 90% of the yield is achieved with better feasibility for the scaling up process. There are no much reports to the best of the knowledge of the authors, available for the preparation of CuS using the solid-state reaction method for the application in SIBs.
The solid-state reaction method is advantageous because of its low cost, reduced pollution, and simplicity in processing and handling, which are the present day necessities of industries for large-scale production (Bekri-Abbes and, Srasra, 2010). Hence, in the present work, a higher yield (90%) of the CuS material is achieved by the one step solid-state reaction method at a low temperature of 250°C. CuS prepared by the co-precipitation method is already reported by Priyanka et al. (2018). Hence, CuS prepared by two methods, viz., the co-precipitation and solid-state reaction method, are compared with their performances in this work.
In addition, an attempt is extended to study the role or synergy of the promising metal alloy anode, i.e., tin antimony (Sn2Sb3). The alloy-based anodes are used in SIBs due to their high gravimetric and volumetric specific capacities (Zheng et al., 2020). Sn2Sb3-based alloy anodes are studied and found beneficial due to their high rate capability of 440 mAhg−1 (Ma and, Prieto, 2019). However, tin antimony suffers from severe volume expansion (Liu et al., 2013; Wu et al., 2014) when alloying with sodium. Hence, an effort is made to pulverise the sulfide and alloy-based material (CuS: Sn2Sb3) to increase the specific capacity and evaluated as an anode in SIBs. The objective of the work is to evaluate the suitability of CuS prepared with a method feasible for large-scale production at a low temperature of synthesis and also to increase the specific capacity of CuS by pulverising Sn2Sb3 with it. The prepared samples are tested in an aqueous and non-aqueous electrolyte, and the electrochemical performances are studied. An initial discharge capacity of 480 mAhg−1 with 90% efficiency is achieved for 2,000 number of cycles in an aqueous NaOH system, whereas in the case of the non-aqueous system with respect to Na/Na+, an initial discharge capacity of 659 mAhg−1 with 100% efficiency is achieved for 100 cycles, which has not yet been reported so far in this method. To the best of our knowledge, no reports are available in this line of analysis and hence reported here.
2 Materials and methods
2.1 Synthesis procedure
CuS and Sn2Sb3 are prepared by the co-precipitation method and pulverised in a 1:1 ratio, as reported previously in our work (Priyanka et al., 2018). CuS prepered by the co-precipitation (CP) method is named as CuS (CP), CuS (CP) and Sn2Sb3 pulverised in a 1:1 ratio is named as P1-CuS hereafter.
In a typical procedure of synthesis of CuS using the solid-state reaction (SSR) method, appropriate amounts of CuCl2.2H2O (Merck) and CH4N2S (Merck) are weighed and ground for an hour using a mortar and pestle. A green powder is obtained, which is heated at 250°C for 1 h in a muffle furnace. Then, the product is washed several times using distilled water and centrifuged. Finally, the black product is dried at 80°C for 3 h. This sample is taken as CuS (SSR) and is pulverized with Sn2Sb3 in the ratio of 1:1 and named as P2-CuS.
2.2 Characterisation techniques
2.2.1 Material characterisation
The structural characterisation is carried out using the PANalytical X’Pert Pro instrument under the instrumental conditions of 45 kV and 30 mA with Cu-Kα radiation. Raman analysis is conducted using Horiba LabRAM with an excitation wavelength of 532 nm. FESEM analysis is conducted using the TESCAN Mira instrument, and the AC impedance study is carried out using a two-electrode system at a frequency range of 100 Hz to 1 MHz at room temperature in the Biologic SP-150 instrument. For the impedance measurement, the powder is made into a 12-mm pellet at a pressure of 200 MPa without any binder. The pellet is coated with carbon paste on both the sides for conductivity, and the measurements are made.
2.2.2 Electrochemical characterization
2.2.2.1 Three-electrode aqueous system
Electrochemical studies are performed to analyse the electrochemical properties by cyclic voltammetry (CV) using the conventional three-electrode system. A platinum wire and Ag/AgCl are used as a counter and reference electrode, respectively. The working electrode preparation involves 85% of active material, 10% carbon black, and 5% sodium carboxyl methyl cellulose (binder), which is made into a slurry by the addition of N-methyl-2-pyrrolidone. Then, the slurry is coated on a copper current collector and dried at 80°C until complete evaporation of the solvent. The CV studies and galvanostatic charge–discharge (GCD) studies at 0.1 C, 0.2 C, 0.5 C, and 1 C rate are carried out using 1 M NaOH electrolyte for all the samples in the Biologic SP-150 instrument.
2.2.2.2 Two-electrode aqueous system
A two-electrode cell is assembled to find the performance of the prepared best performing P2-CuS anode with commercial activated carbon (AC) (SRL) and PVA-NaOH gel polymer electrolyte. The electrode materials are assembled with the PVA-NaOH gel electrolyte without a separator, and the typical electrode mass loading of P2-CuS and AC are 6.8 mg/cm2 and 4.6 mg/cm2, respectively.
2.2.2.3 Two-electrode coin cell in the non-aqueous system
The best performing samples are subjected to GCD analysis with respect to sodium metal (Na/Na+). The non-aqueous electrolyte used is 1 M NaClO4 in a 50: 50 (v/v) mixture of propylene carbonate (PC) and ethylene carbonate (EC) with 5 wt% fluoroethylene carbonate (FEC). The half-cell is assembled in an argon-filled glove box (Mbraun, Unilab, Germany) with the corresponding anode, and a Whatman glass microfibre filter paper (GF/D) with a Na foil as a counter/reference electrode. The GCD analysis is carried out using the instrument Neware battery test system from Shenzhen Neware Electronic Co., China, at room temperature with a voltage window of 0.1–2.7 V at a current density of 0.1 Ag−1.
3 Results and discussion
3.1 Structural analysis
3.1.1 X-ray diffraction (XRD) analysis
The phase identification of the prepared samples is conducted using the XRD technique. The XRD pattern of CuS (SSR) is shown in Figure 1A. The entire observed peaks match well with JCPDS #06-0464 card. Furthermore, to gain more insights, a Rietveld refinement is performed using GSAS software and is shown in Figure 1A. The values obtained from the fit are comparable with the reported data prepared by the SSR method (Wang et al., 2006); the prepared sample possesses a hexagonal structure with a space group of P63/mmc. The Rietveld refinement shows a good match with the experimental data where all the peaks are fitted (goodness of fit GOF = 1.3), and it is evident that there is no secondary phase formed or parental impurities left in the prepared CuS. Due to the perfect match of Rietveld refined parameters of the prepared sample with the theoretical CIF values, it is understood that no strain prevails in the prepared structures due to mismatch or any other crystalline defect in the structure.
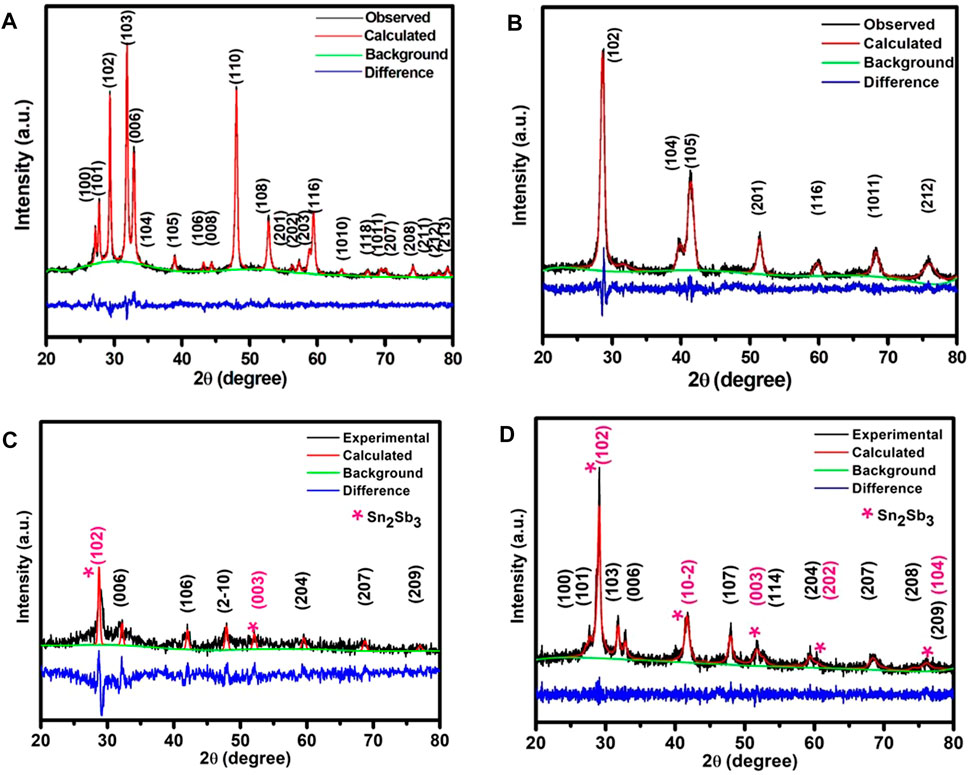
FIGURE 1. Rietveld refined X-ray diffractograms of (A) CuS (SSR), (B) Sn2Sb3, (C) P1-CuS, and (D) P2-CuS.
Similarly, the XRD pattern is observed for the sample Sn2Sb3, P1-CuS, and P2-CuS, and the Rietveld refined results are shown in Figures 1B–D. The major peak is observed at 28° corresponding to the hkl plane of (102) of the Sn2Sb3 phase. Other peaks are also indexed with the corresponding hkl planes. The exact weight fractions of each phase present in the case of P1-CuS and P2-CuS are shown in Table 1, and moreover, there is an evident alteration of the lattice parameter values during pulverisation, which is shown in Table 1. The Rietveld refined data are visualized using VESTA software, and their structural aspects are correlated with the responses observed due to the effect of pulverisation in the samples P1-CuS and P2-CuS.
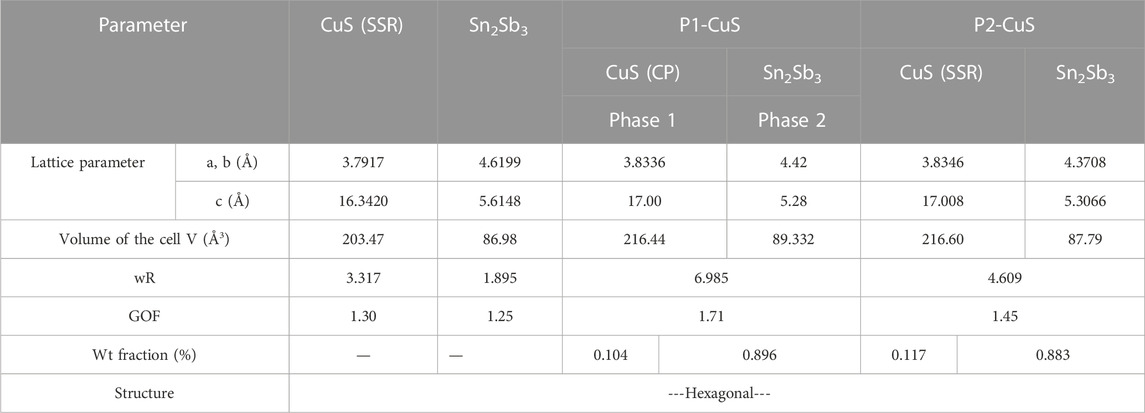
TABLE 1. Fitting parameters from GSAS.
The average crystallite size calculated using the Debye– Scherrer formula (Riyaz et al., 2016) is 22.65 nm for the CuS (SSR) sample, which is comparably smaller than the values reported elsewhere,
CuS has a simple, straightforward formula but a complex structure made up of layers that alternate between CuS3 triangles and CuS4 tetrahedrons with S–S bonds (Morales-Garcia et al., 2014). Pulverisation leads to the alteration of Cu and S sites. In both the pulverised samples P1-CuS and P2-CuS, it is evident that CuS and Sn2Sb3 have a miscible structure. The site-specific rearrangement that occurs due to pulverisation and the clustering effect of P1-CuS and P2-CuS (Supplementary Figure S1) are given in detail in Supplementary Section.
From the structures obtained for the samples P1-CuS and P2-CuS, it is observed that P1-CuS (Figure 2C) does not show any tetrahedral bond formation and P2-CuS shows tetrahedral bond formation, which is skewed in nature. The Sn2Sb3 structure in P1-CuS shows a layer formation upon the CuS system, and it is highly disordered. In sample P2-CuS (Figures 3A–C), the interatomic bonding between Cu0 with S6 and S9 is exceeding and proximity brought them stronger, creating a larger void responsible for higher feasibility of intercalation. Hence, a larger channel and strong bond is observed for the sample P2-CuS. The fact of tetrahedral skew and a half-sited structure in the sample P2-CuS clearly indicates that when CuS and Sn2Sb3 are pulverised, it does not form a single structure but forms a solid solution.
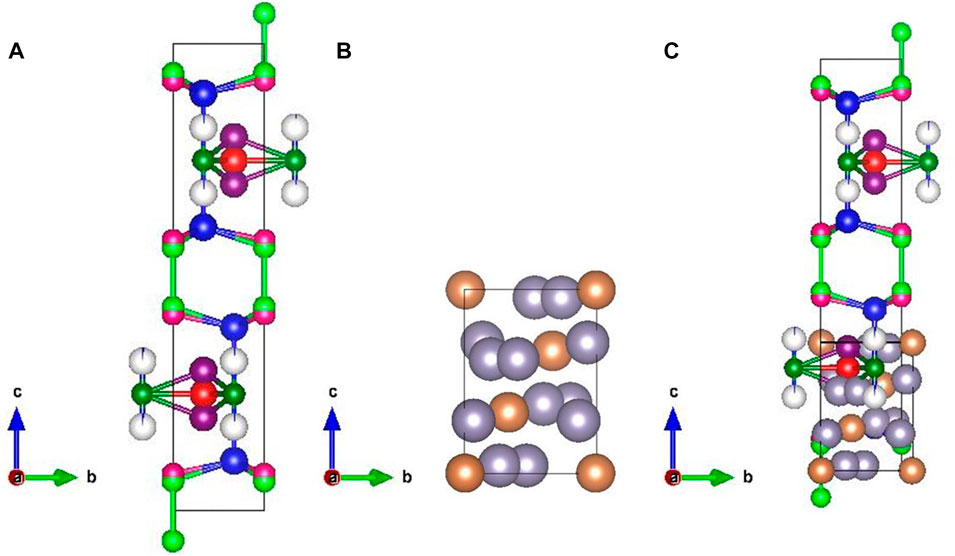
FIGURE 2. Structure of (A) CuS (CP) from the Rietveld refinement drawn using VESTA software (the atoms of the colours blue indicate the Cu0 site; violet, the Cu1 site; grey, the Cu2 site; dark blue, the Cu3 site; red, the Cu4 site; light green, the S6 site; pink, the S9 site; and dark green, the S10 site), (B) structure of Sn2Sb3 (the atoms of the colour grey indicate the Sn site and those in brown indicate the Sb site), and (C) structure of pulverised CuS: Sn2Sb3 (P1-CuS).
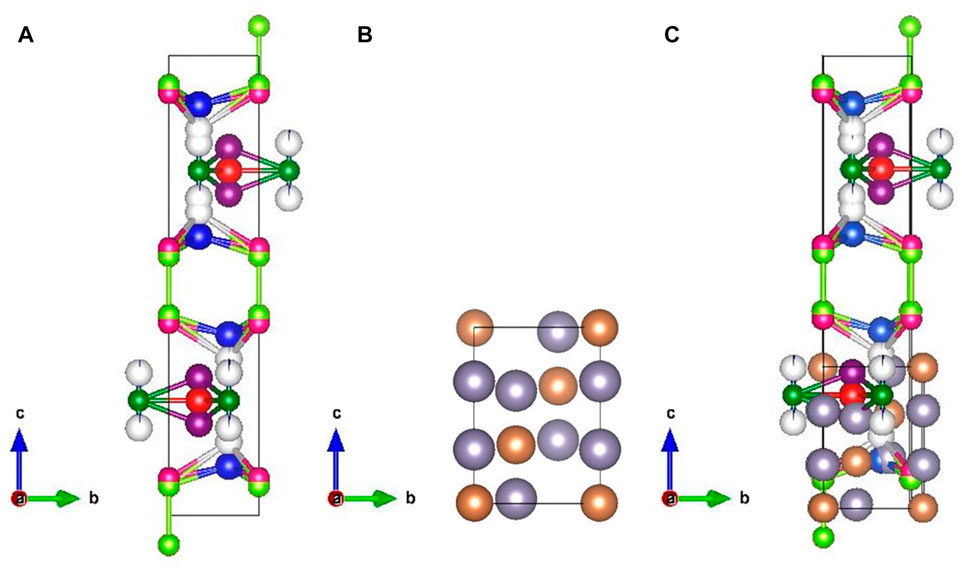
FIGURE 3. Structure of (A) CuS (SSR) from the Rietveld refinement drawn using VESTA software (the atoms of the colours blue indicate the Cu0 site; violet, the Cu1 site; grey, Cu2 site; dark blue, the Cu3 site; red, the Cu4 site; light green, the S6 site; pink, the S9 site; dark green, the S10 site), (B) structure of Sn2Sb3 (the atoms of the colour grey indicate the Sn site and those in brown indicate the Sb site), and (C) structure of pulverised CuS: Sn2Sb3 (P2-CuS).
3.1.2 Raman analysis
Due to the changes predicted in bond formation using the Rietveld analysis, it becomes essential to confirm the changes. Hence, Raman analysis is made and analysed further. A Raman analysis for the comparison of CuS is used to study the structure and bond formation of the prepared samples. The comparison of CuS prepared through the CP and SSR methods with Sn2Sb3 is shown in Figures 4A, B. The sharp characteristic peak at 468 cm−1 is attributed to the S–S stretching mode of S2 ions at the 4e sites in the CuS system (Al-Jawad et al., 2019), and the peak lies at 470 cm−1 in the case of CuS (SSR), as shown in Figure 4B. The peak at 262 cm−1 (CuS (CP) and 260 cm−1 [CuS (SSR)] attributes to the A1g transverse optic mode (TO) of CuS. These vibrational modes at the low-frequency regions 117 cm−1 and 135 cm−1 show the crystalline nature of the nanoparticles, which is seen in the CuS (CP) sample. It is essential to exclude oxide formation that the SSR method of preparation is performed in an open atmosphere, and hence, there may be oxide formation in the final compound of CuS. Although no such peaks arise in XRD, Raman analysis is more sensitive to reveal such bonds, if any.
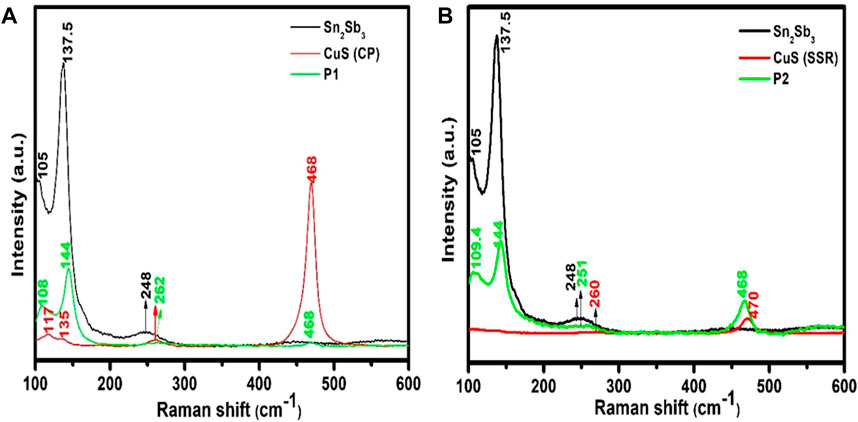
FIGURE 4. Raman spectrum of (A) comparison of CuS (CP), Sn2Sb3, and (P1-CuS), and (B) CuS (SSR), Sn2Sb3, and (P2-CuS).
A higher order shift is obtained in the region of Sn2Sb3 in the case of P1-CuS and P2-CuS. The peaks corresponding to CuS remain at the same position in P1-CuS, and a shift from 260 cm−1 to 251 cm−1 and 470 cm−1 to 468 cm−1 in P2-CuS is assigned to the tetrahedral bond formation between Cu and S atoms, as seen from the Rietveld analysis, and the structures are shown in Figure 3C. Thus, the structural alteration of CuS when pulverised with Sn2Sb3 is confirmed by the Raman analysis.
3.2 Morphological analysis
The difference in morphology of the prepared samples is analysed using FESEM micrographs. The prepared CuS (SSR) sample shows a mixed nanoflake and nanofibre-like morphologies, which is shown in Figure 5A. The particle size observed for nanoflake morphology is approximately of 162 nm diameter and 379 nm length (average), as estimated using ImageJ software. The present work also resulted in nanofibres of 87 nm of the CuS (SSR) sample. The inset in Figure 5A shows a local micrograph with a higher population of nanofibres.
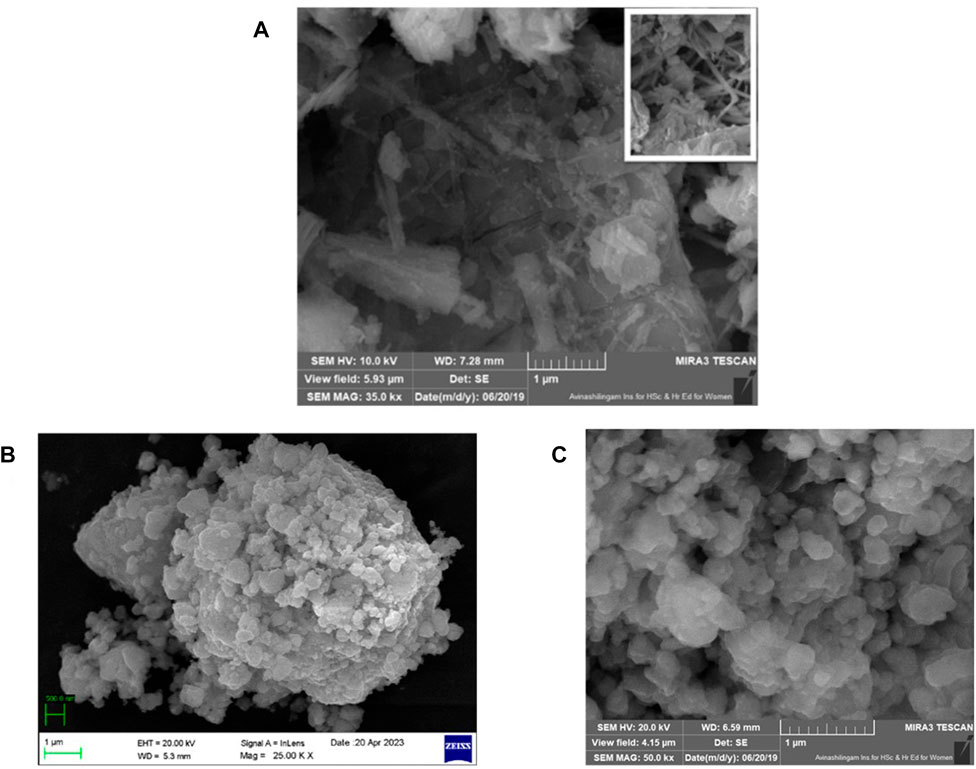
FIGURE 5. FESEM micrographs of (A) CuS (SSR), (B) P1-CuS, and (C) P2-CuS.
The CuS nanoflakes prepared by the hydrothermal method from Li et al. (2017) showed lower grain size values ≈100–150 nm long and 5–10 nm in diameter. A similar morphology is obtained in our case, where the particle size is higher in the case of nanoflakes and smaller in the case of nanofibres (87 nm). It is noteworthy that the morphology is random over the sample. The FESEM micrographs of P1-CuS and P2-CuS samples are shown in Figures 5B, C.
The pulverised sample P2-CuS shows a spherical morphology which seems to be uniformly distributed over the sample, and the particle size ranges from 68 nm to 205 nm. The particle size is comparatively lower when two samples are pulverised (P2-CuS), which stands as a good criteria for better conduction and improved surface wetting, leading to better electrochemical performance. The elemental composition is analysed using EDX, and the patterns of CuS (SSR), P1-CuS, and P2-CuS are given in Supplementary Figure S2. The presence of Cu and S in the CuS sample is confirmed. From the XRD refinement of two phases, the weight fraction is exactly found and the domination of the Sn2Sb3 phase is seen in both the samples. All the spectra show absence of oxides, which is good news for achieving the complete participation of compounds in the electrochemical reversibility.
3.3 Conductivity measurements
The internal resistance of any electrochemical cell is contributed by the resistance of electrodes and electrolyte majorly. Hence, the AC impedance measurements are carried out to find the bulk electrical conductivity of the sample. The AC impedance comparison spectra of CuS (CP), CuS (SSR), and P1-CuS, P2-CuS are shown in Figures 6A, B, where the solid squares represent the experimental data and the line represents the fitted data with a semicircle region. The corresponding equivalent circuit is given in Figure 6C. All the plots are fitted using EC-lab software, and the fit values are listed in Table 2.
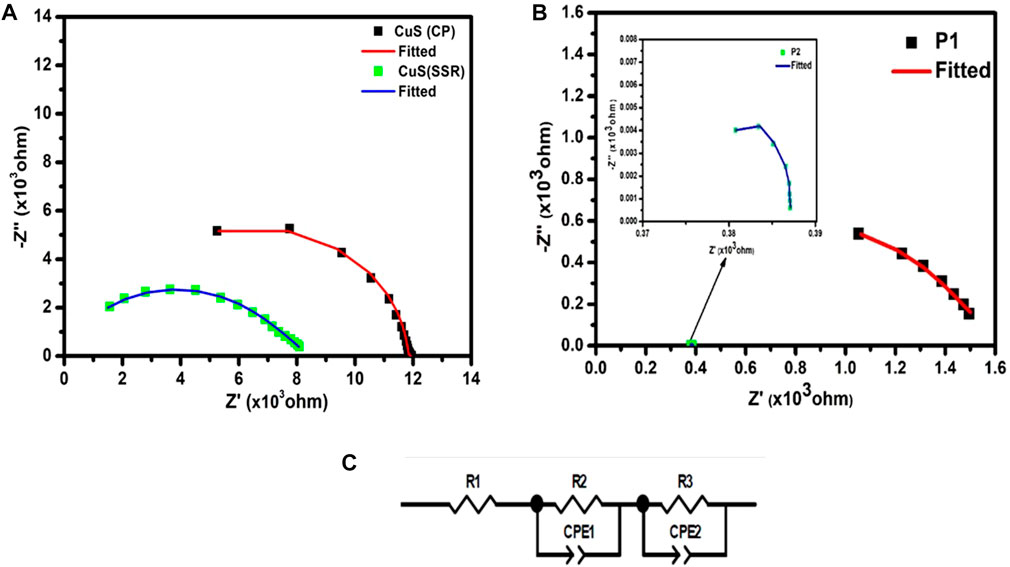
FIGURE 6. Nyquist plot of comparison of (A) CuS (CP) and CuS (SSR), and (B) P1-CuS and P2-CuS, (C) Fitted Equivalent circuit.
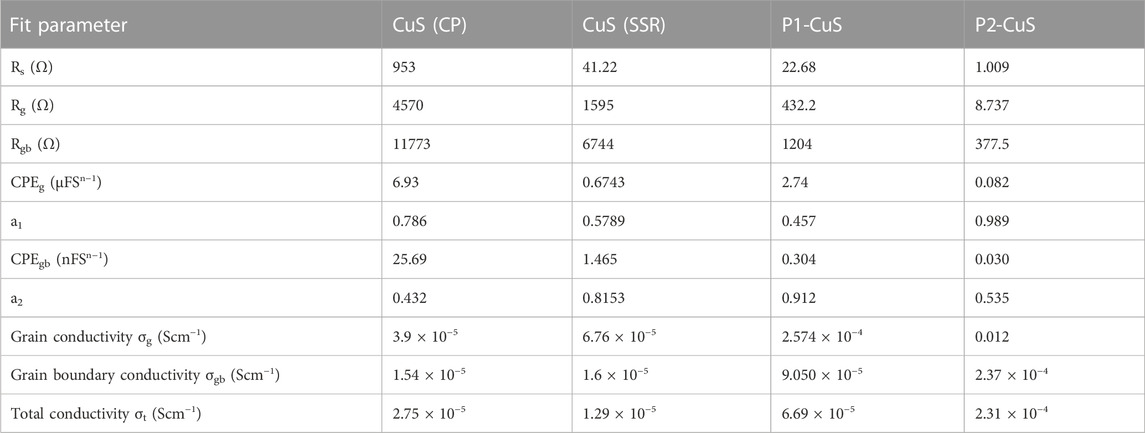
TABLE 2. Fitted parameters and calculated conductivity values from AC impedance.
The CuS (CP) sample shows a resistance value of 953 Ω whereas CuS (SSR) shows a comparatively very low resistance of 41.22 Ω. The grain resistance is also lower in the case of the CuS (SSR) sample, which improves the conductivity of the material. The grain resistance is the major contributor to the total conductivity. Since smaller grains contribute to the increase in grain boundary regions, the higher grain boundary resistance is obtained in CuS (CP) (11.7 kΩ). In the case of CuS (SSR), the electrical conductivity observed (1.29 × 10⁻⁵ Scm−1) is comparatively higher to the other work reported (0.25 × 10⁻⁵ Scm−1) (Freeda et al., 2011). The sample P2-CuS shows a very low resistance, and hence, a high conductivity is achieved (2.31 × 10⁻⁴ Scm−1). It is also evident from the FESEM analysis that the spherical grains are smaller in size and are uniformly distributed compared to P1-CuS. A strong tetrahedral bond formation leaving larger void for immigration in the sample P2-CuS may be the reason for higher electrical conductivity. The reduced resistance of the pulverised samples can favour the reduction of internal resistance of a constructed cell; thus, an improved electrochemical performance is expected.
3.4 Electrochemical analysis
3.4.1 Cyclic voltammetry (CV)
3.4.1.1 Three-electrode aqueous system
The electrochemical properties are studied using CV analysis, which is conducted using the three-electrode configuration in aqueous 1 M NaOH electrolyte, shown in Figures 7A, B, with the potential ranges from −0.4 V to 0.1 V in the case of CuS (CP) and −0.32 V to +0.02 V in the case of CuS (SSR). The potential window for pristine Sn2Sb3 is −0.4 V to +0.15 V (Figure 7C).
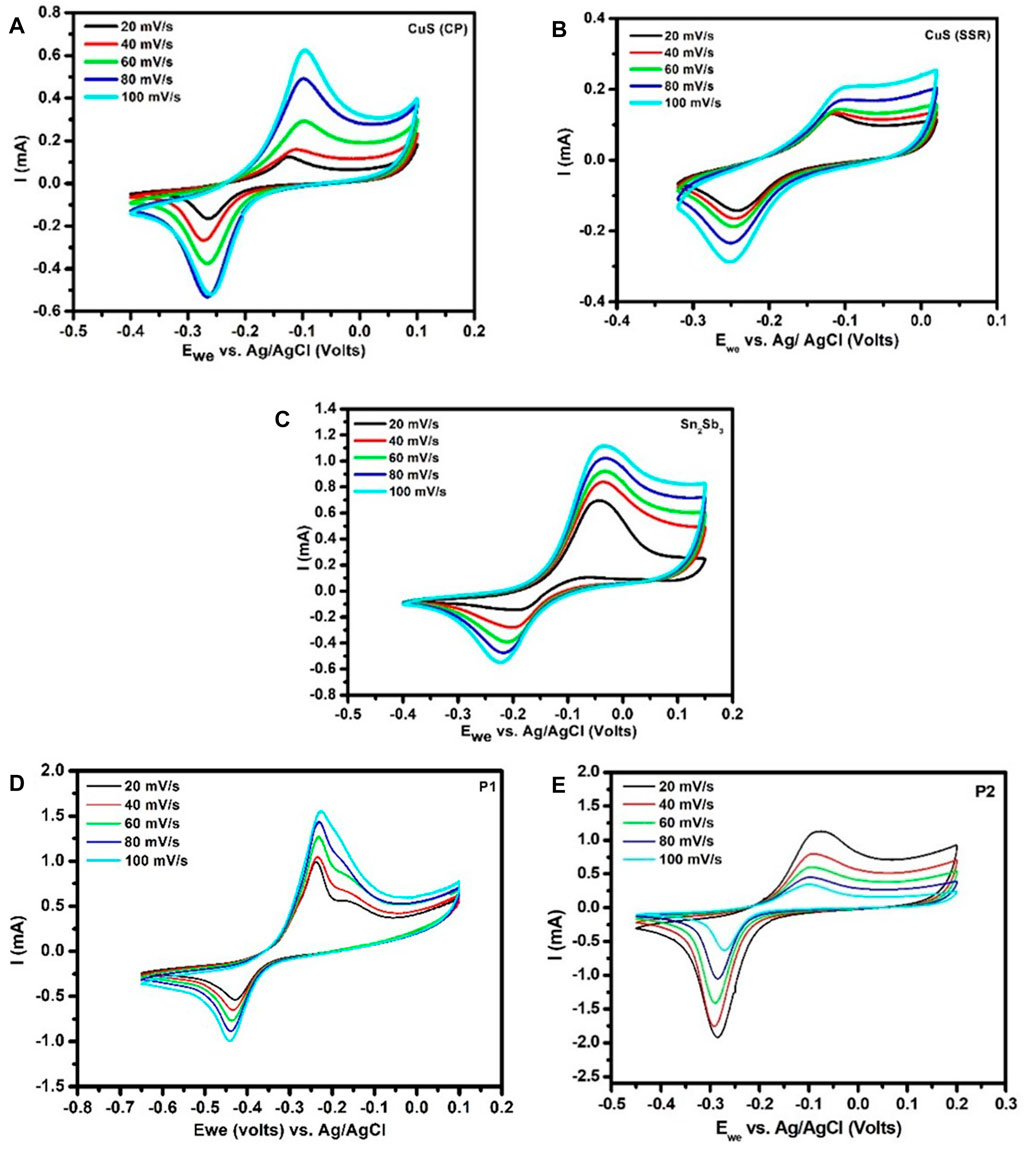
FIGURE 7. CV curves of (A) CuS (CP), (B) CuS (SSR), (C) Sn2Sb3, (D) P1-CuS, and (E) P2-CuS in the aqueous system.
In the case of the pulverised sample P1-CuS, the potential window is −0.65 V to +0.1 V and it has been reduced to −0.45 V to +0.2 V in P2-CuS. In the sample P1-CuS, there were two mobile species at lower kinetics and one got subdued at higher kinetics. All the CV curves show a well-resolved redox peaks. The CV potentials are thoroughly analysed using the half-reactions and are compared with necessary corrections for Ag/AgCl potentials.
The oxidation and reduction potential obtained for both CuS (CP) and CuS (SSR) corresponds to the half-reaction of Cu and S. From Figure 7D of the P1-CuS sample, it is understood that there are two oxidation reactions happening on the oxidation side, one due to the formation of Na3Sb (0.22 V) and the second one due to the formation of Na3.75Sn (0.15 V). The corresponding half-reactions are given as follows:
The reaction of Sb with Sn is represented as follows:
and an intermediate alloy of Cu2Sb3 is evident due to the reduction reaction in P1-CuS.
It has been clearly understood that the sample P1-CuS shows a disordered structure of Sn2Sb3 after pulverisation (Figure 3C) and smaller void for ion transportation, as observed from the Rietveld analysis which is also evident from the CV studies.
P2-CuS (Figure 7E) exhibits potentials similar to those of CuS (SSR). The copper and sulphur complexes purely participate in the pulverised sample without any secondary alloying with tin and antimony. In addition, this is evident from the Rietveld analysis that the sample P2-CuS is well-ordered and provides a larger cavity for ion transportation. Other sulfide phases such as SnS, Sb2S3, SnS2, and CuSbS2 are not formed, hence improving the electrochemical performance of P2-CuS, as evident from the GCD analysis, which is discussed further.
The perfect match of the CV potentials are noted, and the diffusion process is analysed using the Randles–Sevcik equation, as shown in Eq. 3:
where
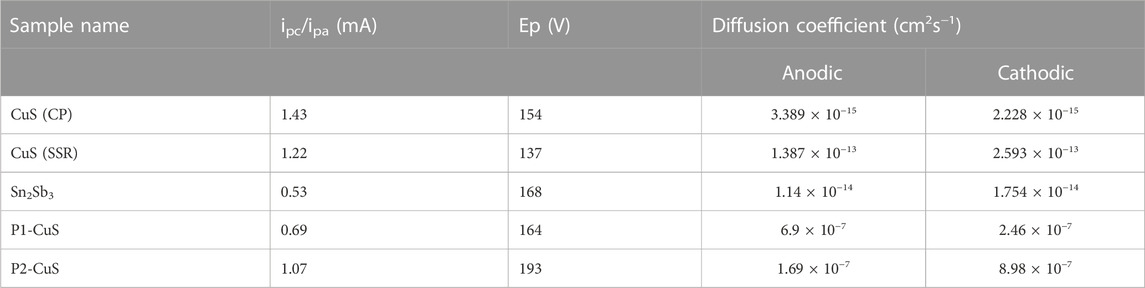
TABLE 3. Electrochemical parameters calculated from CV.
3.4.2 Galvanostatic charge/discharge (GCD) analysis
3.4.2.1 Three-electrode aqueous system
The GCD analysis is carried out to study the charge/discharge properties, cyclic stability, and rate capability of the prepared samples upon cycling, which is conducted using the three-electrode configuration in aqueous 1 M NaOH electrolyte. From the GCD analysis of CuS (CP), a stable specific capacity of 10 mAhg−1 is obtained with a coulombic efficiency of 98%, which did not fade even after 2000 number of cycles (Supplementary Figure S3A). The lower value of specific capacity of CuS (CP) may be due to different alloy formation such as Na3Sb, Na3.75Sn, and Cu3Sb2, as discussed in the half-cell reactions of the CV analysis.
A higher value of specific capacitance is obtained for the CuS (SSR) sample (29.65 mAhg−1) at 0.5°C rate over 2000 cycles (Supplementary Figure S3B). It is interesting to note that, there is no capacity fading up to 2000 cycles, where the capacity retention is 99.8% for 2000 cycles. A reasonable value of coulombic efficiency (90%) is obtained, which also reveals that there is no dissolution of active material. The reported literature shows CuS prepared by the low-temperature solution casting method, which showed nanoplate-like morphology with a specific capacitance of 72 Fg−1 for 100 cycles in an aqueous-based electrolyte (Justin Raj et al., 2014), and in this present case of CuS (SSR), a higher capacitance of 106.68 Fg−1 (29.65 mAhg−1) is obtained with the capacity retention value of 99.8% and is noteworthy in aqueous-based electrolyte systems. Since aqueous-based electrolyte is used in our case, the results could not be directly compared with half-cells assembled with sodium (Na/Na+). However, the achieved values are promising and resolute in its kind.
Tin antimonide, as an anode for SIBs, exhibits superior electrochemical performance and rate capability (Ma et al., 2018). In our case of pristine Sn2Sb3 (Supplementary Figure S3C), the initial discharge capacity is 280 mAhg−1 and fades upon cycling to 80 mAhg−1 after 2000 cycles, and the coulombic efficiency almost reaches 100%, although the capacity retention is only 71.4%. A similar behaviour of reduction in the capacity retention is observed in the reported literature (Ma and Prieto, 2019). However, the reason stated for the decrease in capacity retention is connected to the continuous volume expansion, which results in isolation of active material and growth of the SEI layer. A slower kinetics could be observed due to the growth of the SEI layer. However, in the present case, there is no evidence of dissolution of active material into the electrolytic solution over the cycling performance of 2000 number of cycles.
Figures 8A, B shows the charge–discharge curves of P1-CuS and P2-CuS. A very low initial discharge capacity of 109 mAhg−1 is attained at 0.1°C rate. However, a larger initial discharge and charge capacities of 480 mAhg−1 and 687 mAhg−1, respectively, have been identified. When compared to P1-CuS, P2-CuS has a bigger void in the crystal structure and offers a suitable channel for sodium-ion migration, which reflects promptly from the GCD analysis with a higher capacity. Additionally, P2-CuS reveals a higher electrical conductivity value of 2.31 × 10⁻⁴ Scm−1 and the CV analysis further stands as a proof for P2-CuS on non-creation of intermediate alloys.
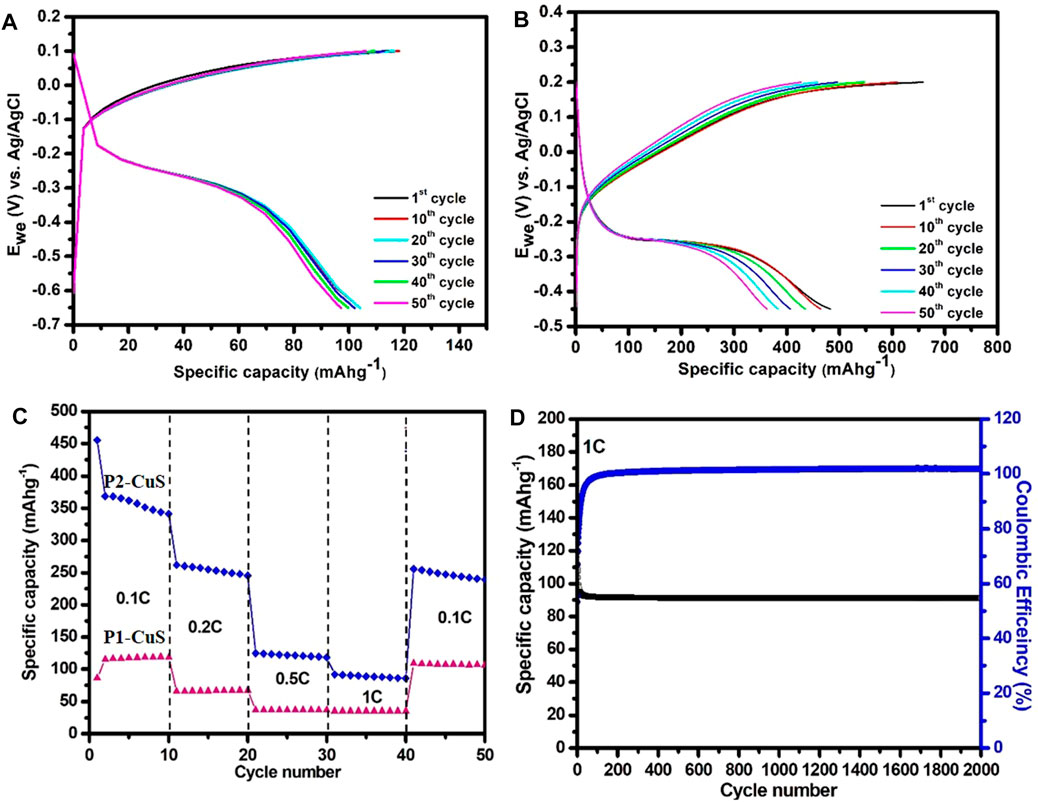
FIGURE 8. (A, B) Charge–discharge profile of P1-CuS and P2-CuS at the 0.1 C rate. (C) Comparison of the rate capability with a specific discharge capacity at 0.1 C, 0.2 C, 0.5 C, and 1 C rates. (D) Cyclic stability of P2-CuS at the 1 C rate for 2000 cycles in the aqueous system.
In Figure 8C, the rate capability for various C-rates is compared. Since P2-CuS shows a higher value of capacitance at 1 C rate, the sample is cycled over 2,000 cycles to establish the cyclic stability, as shown in Figure 8D. The capacity retention of 90% over 2000 cycles stands as a testimony for a favourable performance. However, the 10% of capacity loss encountered may be due to the formation of the SEI layer which can be confirmed using EIS analysis, discussed in the following section.
3.4.2.2 Two-electrode aqueous system with AC as the counter electrode
The best performing P2-CuS is constructed as a cell with commercial AC as a counter electrode employing PVA-NaOH gel as an electrolyte, and the results are analysed here. Such full cells can shed a limelight on the performance of the electrodes of evaluation (Rowden and Garcia-Arraez, 2021; Schulze and Neale, 2021).
The difference in chemical potential of both the electrodes is expressed as the open-circuit voltage (OCV). The OCV, in turn, is an indicator of the close proximity of chemical potential. When OCV is small or negative, the candidature of the electrodes as the anode or cathode is quite comparable. The OCV of AC and P2-CuS cells constructed versus platinum individually are −320 mV and −150 mV, respectively. It is evident that the chemical potential of P2-CuS is below AC. In addition, the OCV value of the constructed P2-CuS//activated carbon is −175 mV, indicating that P2-CuS is well qualified as an anode and can replace activated carbon in sodium-ion cells.
The oxidation peaks are observed at 0.025 V and a slight hump at −0.25 V whereas the reduction peak is obtained at 0.072 V and a slight peak at −0.5 V. The potential window of the activated carbon is from −0.5 V to 0 V, that of CuS (SSR) is −0.32 V to +0.05 V, and for P2-CuS from −0.45 V to 0.2 V. It is noteworthy that the operating potential window of P2-CuS overlaps with AC with a mild extension which is favourable for better suitability with a variety of electrodes where carbon is not a prospective candidate.
The GCD curves of P2-CuS//AC at different rates are shown in Supplementary Figure S4B, and the cycling performance at 0.1 C rate shows a stable specific capacity over 2000 cycles and the coulombic efficiency reaches 100% at 2000 cycles (Supplementary Figure S4C). The specific capacity of the assembled cell shows 27 mAhg−1. The observed specific capacity is low and is acceptable as the cell has closer chemical potential as discussed previously. Hence, the salient feature of P2-CuS toward sodium batteries is analysed and ensured to be a valid competent anode.
3.4.2.3 Two-electrode non-aqueous system vs. sodium (Na/Na+)
The prepared sample P2-CuS derived from pulverisation of CuS (SSR) and Sn2Sb3 shows good activity from all the analysis, and this point remains as a background for subjecting these samples for half-cell analysis with respect to sodium (Na/Na+). Hence, the cyclic stability graph is attached herewith for the samples CuS (SSR) (Figures 9A, B), Sn2Sb3 (Figures 9C, D), and P2-CuS (Figures 10A, B). A same potential window of 0.1 V–2.7 V is fixed for all the samples for cycling.
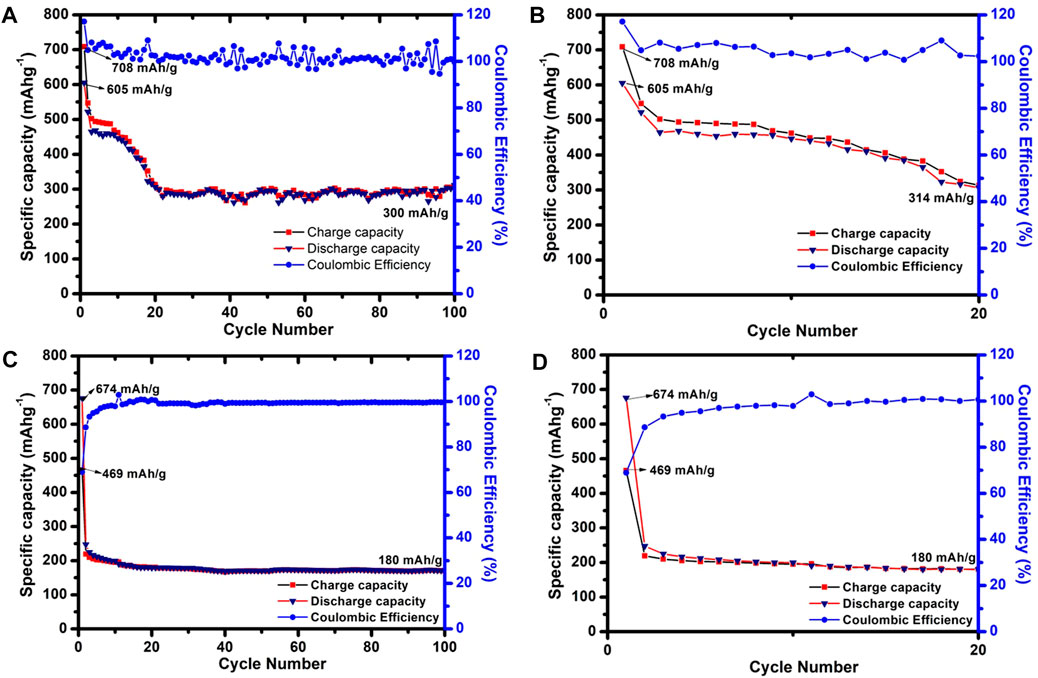
FIGURE 9. Cyclic stability vs. Na/Na+ of (A) CuS (SSR) at 100 cycles, (B) CuS (SSR) at 20 cycles, (C) Sn2Sb3 at 100 cycles, and (D) Sn2Sb3 at 20 cycles.
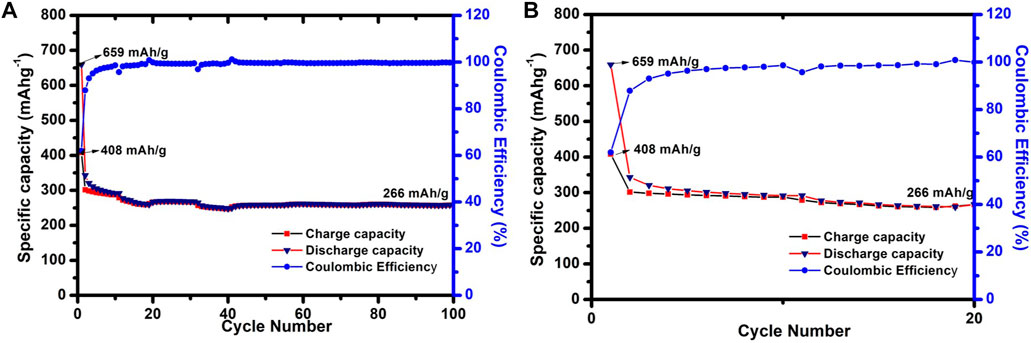
FIGURE 10. Cyclic stability vs. Na/Na+ of (A) CuS (SSR) at 100 cycles and (B) CuS (SSR) at 20 cycles.
Figures 9A, B show the cyclic stability of CuS (SSR) where the initial discharge capacity is 605 mAhg−1, and the capacity has dropped until 20 cycles (Figure 9B), remains stable, and maintains as 300 mAhg−1 at 100 cycles. The coulombic efficiency is almost fluctuating above 100%, which may be due to the side reactions or creation of a more number of active sites upon cycling (Dimple et al., 2022). Although a specific capacity 300 mAhg−1 is obtained, which is almost 53% of theoretical capacity, the capacity retention is 49.5% for 100 cycles. In Li et al. (2010), CuS prepared by the microwave method shows a specific capacity of 300 mAhg−1 over 50 cycles at 0.1 Ag−1 in the NaFS/DGM electrolyte, which is comparably the value obtained in our work. Yu et al. has compared CuS with irregular morphology and pine needle-like (PNL) uniform morphology of CuS as an anode, where CuS prepared showing irregular morphology exhibited 366 mAhg−1 at 0.1 Ag−1 for 100 cycles. Dimple et al. has demonstrated the effect of addition of C3N5 with CuS, where the pristine CuS shows a specific capacity of 212 mAhg−1 at 2 Ag−1. Other reports by Zhao et al., 2020 showed CuS nanowires with a specific capacity of 400 mAhg−1 at 0.2 Ag−1 over 100 cycles, and this sample when wrapped in N-doped carbon (CuS NWs @NC) shows a specific capacity of 216.7 mAhg−1 at 20 A g−1 over 10,000 cycles. Hence, it is evident that some specific composites of carbon-based compounds or morphological tuning provides a remarkable and improved performance in pure CuS samples. Hence, the specific capacity of 300 mAhg−1 for the prepared sample CuS (SSR) is remarkable.
In the case of pristine Sn2Sb3 (Figure 10C), the initial discharge capacity, which is 687 mAhg−1, is obtained and fades upon cycling to 180 mAhg−1 at 100 cycles, and the coulombic efficiency almost reaches 100%. Although the specific capacity is only 180 mAhg−1, a stable behaviour is observed, which was not evident in the case of CuS (SSR). However, when P2-CuS is considered, an initial discharge capacity of 659 mAhg−1 is obtained which decreased to 266 mAhg−1 at 0.1 Ag−1 for 100 cycles. The coulombic efficiency almost reaches 100% at 100 cycles.
3.4.3 Electrochemical impedance analysis (EIS) for the aqueous system
The EIS analysis is carried out to study the charge transfer mechanisms before and after cycling, the plotted EIS graphs of the electrodes are shown in Supplementary Figure S3, and the values are given in Table 4. The internal cell resistance (R1) is smaller in all the samples before cycling and increases after cycling due to the SEI layer formation, as expected from cycling behaviour.

TABLE 4. EIS fitted values before and after cycling.
In the case of CuS (SSR), the internal cell resistance and charge transfer resistance slightly increase after cycling. Since CuS (SSR) has a higher total conductivity than CuS (CP), it cannot be concluded to be the effect of pulverisation when P2-CuS, the pulverised sample of CuS (SSR), shows higher conductivity.
4 Conclusion
CuS is synthesized using two methods and analysed, and the pulverised samples with Sn2Sb3 (P1-CuS and P2-CuS) are also evaluated for electrochemical performance. The structural aspects of pulverisation in the sample P2-CuS indicate a tetrahedral skewed matrix of CuS (SSR) with a layered structure and a larger void, creating more space for facilitated Na-ion insertion and removal mechanism. The tetrahedral bond formed in P2-CuS due to the intervention of Sn2Sb3 in CuS (SSR) is the key factor for the enhanced electrochemical performance. The performance of P2-CuS is quite competent for sodium-ion batteries. The electrochemical performance of P2-CuS in both aqueous and non-aqueous electrolytes is conducted where the aqueous system shows a notable initial discharge capacity of 480 mAhg−1, and in the non-aqueous system with Na/Na+, an initial discharge capacity of 659 mAhg−1 at a current density of 0.1 Ag−1 is obtained. It also reveals an excellent cyclic stability for 100 cycles and with a stable specific capacity of 266 mAhg−1. These results shed light on the effect of the pulverization process upon cycling performance in CuS electrodes.
Data availability statement
The original contributions presented in the study are included in the article/Supplementary Material; further inquiries can be directed to the corresponding author.
Author contributions
PP: formal analysis, methodology, visualization, and writing–original draft. BN: formal analysis, conceptualization, supervision, validation, and writing–review and editing. GS: writing–review and editing. PC: writing–review and editing. DD: Investigation.
Funding
The authors declare that no financial support was received for the research, authorship, and/or publication of this article.
Acknowledgments
One of the authors PP kindly acknowledges DST-INSPIRE fellowship (IF180415) for the financial support.
Conflict of interest
The authors declare that the research was conducted in the absence of any commercial or financial relationships that could be construed as a potential conflict of interest.
Publisher’s note
All claims expressed in this article are solely those of the authors and do not necessarily represent those of their affiliated organizations, or those of the publisher, the editors, and the reviewers. Any product that may be evaluated in this article, or claim that may be made by its manufacturer, is not guaranteed or endorsed by the publisher.
Supplementary material
The Supplementary Material for this article can be found online at: https://www.frontiersin.org/articles/10.3389/fenrg.2023.1266653/full#supplementary-material
References
Al-Jawad, S. M. H., Taha, A. A., and Redha, A. M. (2019). Studying the structural, morphological, and optical properties of CuS:Ni nanostructure prepared by a hydrothermal method for biological activity. J. Solgel Sci. Technol. 91, 310–323. doi:10.1007/s10971-019-05023-1
Auyoong, Y. L., Yap, P. L., Huang, X., and Abd Hamid, S. B. (2013). Optimization of reaction parameters in hydrothermal synthesis: A strategy towards the formation of CuS hexagonal plates. Chem. Cent. J. 7 (1), 67. doi:10.1186/1752-153x-7-67
Bekri-Abbes, I., and Srasra, E. (2010). Investigation of structure and conductivity properties of polyaniline synthesized by solid–solid reaction. J. Polym. Res. 18 (4), 659–665. doi:10.1007/s10965-010-9461-x
Dhasade, S. S., Patil, J. S., Han, S. H., Rath, M. C., and Fulari, V. J. (2013). Copper sulfide nanorods grown at room temperature for photovoltaic application. Mat. Lett. 90, 138–141. doi:10.1016/j.matlet.2012.09.013
Dimple, P. D., Dipa, D. P., Sebin, A., and Balaji, R. R. (2022). An insight into the sodium-ion and lithium-ion storage properties of CuS/graphitic carbon nitride nanocomposite. RSC Adv. 12, 12383–12395. doi:10.1039/d2ra02014a
Freeda, A., Mahadevan, C. K., and Ramalingom, S. (2011). Optical and electrical properties of CuS nanorods. Arch. Phy. Res. 2 (3), 175–179.
Hao, J., Wu, W., Wang, Q., Yan, D., Liu, G., and Peng, S. (2020). Effect of grain size on electrochemical performance and kinetics of Co3O4 electrode material. J. Mat. Chem. A 8, 7192–7196. doi:10.1039/d0ta02032j
Hwang, J.-Y., Myung, S.-T., and Sun, Y.-K. (2017). Sodium-ion batteries: present and future. Chem. Soc. Rev. 46 (12), 3529–3614. doi:10.1039/c6cs00776g
Jache, B., Mogwitz, B., Klein, F., and Adelhelm, P. (2014). Copper sulfides for rechargeable lithium batteries: linking cycling stability to electrolyte composition. J. Power Sources 247, 703–711. doi:10.1016/j.jpowsour.2013.08.136
Jing, M., Li, F., Chen, M., Zhang, J., Long, F., Jing, L., et al. (2018). Facile synthetic strategy to uniform Cu 9 S 5 embedded into carbon: A novel anode for sodium-ion batteries. J. Alloys Compd. 762, 473–479. doi:10.1016/j.jallcom.2018.05.224
Justin Raj, C., Kim, B. C., Cho, W.-J., Lee, W.-G., Seo, Y., and Yu, K. H. (2014). Electrochemical capacitor behavior of copper sulfide (CuS) nanoplatelets. Alloys Compd. 586, 191–196. doi:10.1016/j.jallcom.2013.10.056
Kim, N. R., Choi, J., Yoon, H. J., Lee, M. E., Son, S. U., Jin, H.-J., et al. (2017). Conversion reaction of copper sulfide based nanohybrids for sodium-ion batteries. ACS Sustain. Chem. Eng. 5 (11), 9802–9808. doi:10.1021/acssuschemeng.7b01692
Li, F., Wu, J., Qin, Q., Li, Z., and Huang, X. (2010). Controllable synthesis, optical and photocatalytic properties of CuS nanomaterials with hierarchical structures. Powder Technol. 198 (2), 267–274. doi:10.1016/j.powtec.2009.11.018
Li, H., Wang, Y., Jiang, J., Zhang, Y., Peng, Y., and Zhao, J. (2017). CuS microspheres as high-performance anode material for Na-ion batteries. Electrochim. Acta 247, 851–859. doi:10.1016/j.electacta.2017.07.018
Li, J., Yan, D., Lu, T., Qin, W., Yao, Y., and Pan, L. (2017). Significantly improved sodium-ion storage performance of CuS nanosheets anchored into reduced graphene oxide with ether-based electrolyte. ACS Appl. Mat. Interfaces 9 (3), 2309–2316. doi:10.1021/acsami.6b12529
Liu, Y., Liu, M., and Swihart, M. T. (2017). Plasmonic copper sulfide-based materials: A brief introduction to their synthesis, doping, alloying, and applications. J. Phys. Chem. C 121 (25), 13435–13447. doi:10.1021/acs.jpcc.7b00894
Liu, Y., Xu, Y., Zhu, Y., Culver, J. N., Lundgren, C. A., Xu, K., et al. (2013). Tin-coated viral nanoforests as sodium-ion battery anodes. ACS Nano 7 (4), 3627–3634. doi:10.1021/nn400601y
Ma, J., and Prieto, A. L. (2019). Electrodeposition of pure phase SnSb exhibiting high stability as a sodium-ion battery anode. Chem. Commun. 55, 6938–6941. doi:10.1039/c9cc00001a
Ma, W., Yin, K., Gao, H., Niu, J., Peng, Z., and Zhang, Z. (2018). Alloying boosting superior sodium storage performance in nanoporous tin-antimony alloy anode for sodium ion batteries. Nano Energy 54, 349–359. doi:10.1016/j.nanoen.2018.10.027
Minakshi, M. (2020). Looking beyond lithium-ion technology – aqueous NaOH battery. Mat. Sci. Eng. B 177 (20), 1788–1792. doi:10.1016/j.mseb.2012.09.003
Morales-García, A., Soares, A. L., Dos Santos, E. C., de Abreu, H. A., and Duarte, H. A. (2014). First-principles calculations and electron density topological analysis of covellite (CuS). J.Phys Chem. A 118 (31), 5823–5831. doi:10.1021/jp4114706
Nafees, M., Ali, S., Rasheed, K., and Idrees, S. (2011). The novel and economical way to synthesize CuS nanomaterial of different morphologies by aqueous medium employing microwaves irradiation. Appl. Nanosci. 2 (2), 157–162. doi:10.1007/s13204-011-0050-z
Nithya, C., and Thiyagaraj, G. (2020). Morphology oriented CuS nanostructures: superior K-ion storage using surface enhanced pseudocapacitive effects. Sustain. Energy Fuels 4, 3574–3587. doi:10.1039/d0se00469c
Park, J. Y., Kim, S. J., Yim, K., Dae, K. S., Lee, Y., Dao, K. P., et al. (2019). Pulverization-tolerance and capacity recovery of copper sulfide for high-performance sodium storage. Adv. Sci. 6, 1900264. doi:10.1002/advs.201900264
Pejjai, B., Reddivari, M., and Kotte, T. R. R. (2019). Phase controllable synthesis of CuS nanoparticles by chemical co-precipitation method: effect of copper precursors on the properties of CuS. Mat. Chem. Phys. 239, 122030. doi:10.1016/j.matchemphys.2019.122030
Priyanka, P., Nalini, B., Lakshmi, D., and Chandra Bose, A. (2018). A novel method for generating tricolor emission for white LED application. J. Mat. Sci. Mat. Electron. 29 (14), 12288–12299. doi:10.1007/s10854-018-9342-3
Riyaz, S., Parveen, A., and Azam, A. (2016). Microstructural and optical properties of CuS nanoparticles prepared by sol–gel route. Perspect. Sci. 8, 632–635. doi:10.1016/j.pisc.2016.06.041
Rowden, B., and Garcia-Araez, N. (2021). Estimating lithium-ion battery behavior from half-cell data. Energy Rep. 7, 97–103. doi:10.1016/j.egyr.2021.02.048
Sandford, C., Edwards, M. A., Klunder, K., Hickey, D. P., Li, M., Barman, K., et al. (2019). A synthetic chemist’s guide to electroanalytical tools for studying reaction mechanisms. Chem. Sci. 10, 6404–6422. doi:10.1039/c9sc01545k
Schulze, M. C., and Neale, N. R. (2021). Half-cell cumulative efficiency forecasts full-cell capacity retention in lithium-ion batteries. ACS Energy Lett. 6 (3), 1082–1086. doi:10.1021/acsenergylett.1c00173
Shi, F., Zheng, W., Wang, W., Hou, F., Lei, B., Sun, Z., et al. (2015). Application of graphene–copper sulfide nanocomposite modified electrode for electrochemistry and electrocatalysis of hemoglobin. Biosens. Bioelectron. 64, 131–137. doi:10.1016/j.bios.2014.08.064
Veeraraghavan, B., Paul, J., Haran, B., and Popov, B. (2002). Study of polypyrrole graphite composite as anode material for secondary lithium-ion batteries. J. Power Sources 109 (2), 377–387. doi:10.1016/s0378-7753(02)00105-2
Wang, X., Xu, C., and Zhang, Z. (2006). Synthesis of CuS nanorods by one-step reaction. Mat. Lett. 60 (3), 345–348. doi:10.1016/j.matlet.2005.08.048
Wang, Z., Selbach, S. M., and Grande, T. (2014). Van der Waals density functional study of the energetics of alkali metal intercalation in graphite. RSC Adv. 4 (8), 3973–3983. doi:10.1039/c3ra47187j
Wu, L., Hu, X., Qian, J., Pei, F., Wu, F., Mao, R., et al. (2014). Sb–C nanofibers with long cycle life as an anode material for high-performance sodium-ion batteries. Energy Environ. Sci. 7 (1), 323–328. doi:10.1039/c3ee42944j
Wu, X., Song, K., Zhang, X., Hu, N., Li, L., Li, W., et al. (2019). Safety issues in lithium ion batteries: materials and cell design. Front. Energy Res. 7. doi:10.3389/fenrg.2019.00065
Xiao, Y., Lee, S. H., and Sun, Y.-K. (2016). The application of metal sulfides in sodium ion batteries. Adv. Energy Mater. 7 (3), 1601329. doi:10.1002/aenm.201601329
Xu, W., Liang, Y., Su, Y., Zhu, S., Cui, Z., Yang, X., et al. (2016). Synthesis and properties of morphology controllable copper sulphide nanosheets for supercapacitor application. Electrochim. Acta 211, 891–899. doi:10.1016/j.electacta.2016.06.118
Yu, D., Li, M., Yu, T., Wang, C., Zeng, Y., Hu, X., et al. (2019). Nanotube-assembled pine-needle-like CuS as an effective energy booster for sodium-ion storage. J. Mat. Chem. A 7 (17), 10619–10628. doi:10.1039/c8ta12474d
Zhang, B., Gao, X.-W., Wang, J.-Z., Chou, S.-L., Konstantinov, K., and Liu, H.-K. (2013). CuS nanoflakes, microspheres, microflowers, and nanowires: synthesis and lithium storage properties. J. Nanosci. Nanotechnol. 13 (2), 1309–1316. doi:10.1166/jnn.2013.5987
Zhang, W., Zhang, F., Ming, F., and Alshareef, H. N. (2019). Sodium-ion battery anodes: status and future trends. EnergyChem 1, 100012. doi:10.1016/j.enchem.2019.100012
Zhao, D., Yin, M., Feng, C., Zhan, K., Jiao, Q., Li, H., et al. (2020). Rational design of N-doped CuS@C nanowires toward high-performance half/full sodium-ion batteries. ACS Sustain. Chem. Eng. 9, 11317–11327. doi:10.1021/acssuschemeng.0c03273
Zhao, F., Xue, J. S., Yu, Wei., Huang, W., and Xiao, J. (2023). Toward high-sulfur-content, high-performance lithium-sulfur batteries: review of materials and technologies. J.Energy Chem. 80, 625–657. doi:10.1016/j.jechem.2023.02.009
Zheng, S.-M., Tian, Y.-R., Liu, Y.-X., Wang, S., Hu, C.-Q., Wang, B., et al. (2020). Alloy anodes for sodium-ion batteries. Rare Met. 40, 272–289. doi:10.1007/s12598-020-01605-z
Zhou, J., Jia, D. D., and Liu, L. (2005). Optical properties and synthesis of copper sulfide nanorods by solid-state reaction at low heating temperature. Chem. J. Chin. Univ. 26, 620–622.
Keywords: copper sulfide, tin antimonide, pulverisation, anode, electrochemical performance, sodium-ion batteries
Citation: Priyanka P, Nalini B, Soundarya GG, Christopher Selvin P and Dutta DP (2023) Effect of pulverisation on sulfide and tin antimonide anodes for sodium-ion batteries. Front. Energy Res. 11:1266653. doi: 10.3389/fenrg.2023.1266653
Received: 25 July 2023; Accepted: 11 September 2023;
Published: 17 October 2023.
Edited by:
Manickam Minakshi, Murdoch University, AustraliaReviewed by:
Fulai Zhao, Tianjin University, ChinaRasu Muruganantham, Chung Yuan Christian University, Taiwan
Ramanathan Thillaiyan, Teledyne Scientific Company, United States
Copyright © 2023 Priyanka, Nalini, Soundarya, Christopher Selvin and Dutta. This is an open-access article distributed under the terms of the Creative Commons Attribution License (CC BY). The use, distribution or reproduction in other forums is permitted, provided the original author(s) and the copyright owner(s) are credited and that the original publication in this journal is cited, in accordance with accepted academic practice. No use, distribution or reproduction is permitted which does not comply with these terms.
*Correspondence: B. Nalini, anlvdGhzbmFsYWxpbjk5QGdtYWlsLmNvbQ==
†ORCID ID: B. Nalini, orcid.org/0000-0002-7615-0529; P. Christopher Selvin, orcid.org/0000-0002-3354-5790; Dimple P. Dutta, orcid.org/0000-0001-8955-9166