 Qing Yang
 Ziyi Yang1
 Wanyang Zhao
 Delu Wang
- 1School of Management, Xi’an University of Science and Technology, Xi’an, China
- 2Energy Economy and Management Research Center, Xi’an University of Science and Technology, Xi’an, China
- 3School of Economics and Management, China University of Mining and Technology, Xuzhou, China
The identification of factors that drive enterprise carbon efficiency and the assessment of current emission reduction policies from the perspective of enterprise heterogeneity are essential for designing more effective emission reduction policies that optimize the allocation of inter-enterprise resources. Using a panel of 602,470 observations of Chinese industrial enterprises over multiple years, we quantified the factors driving carbon efficiency and their contributions. We also examined the heterogeneity of these effects at the industry and regional levels. This was done by constructing multiple fixed effect models and the Shapley value decomposition model. Additionally, we evaluated carbon reduction policies related to the key driving factors, taking into account the heterogeneity of the enterprise. The study discovered significant variations in inter-enterprise carbon efficiency, with a trend of local leadership and overall trailing. Based on the results of Shapley value decomposition, industry differences, enterprise scale, and regional differences are the most critical factors affecting enterprise carbon efficiency. Based on the results of the t-test and robustness test, enterprise scale has a significant inverted “U”-shaped impact on that. The degree of impact is greater in the eastern region and related industries in China with higher levels of market development, environmental regulation, and carbon market penetration. Previous policies have overlooked the heterogeneity of carbon efficiency among enterprises, resulting in firms and regions with large production scales and high carbon efficiency shouldering a greater burden of emission reduction tasks. It is likely to encourage the flow of output away from enterprises or areas with high carbon efficiency and towards those with low carbon emissions, which hinders the improvement of overall carbon efficiency. The conclusions have valuable policy implications. These include the recommendation to reduce direct control of total emission reduction targets in carbon reduction policies. Instead, based on the inter-enterprise heterogeneity of carbon efficiency, the policies should focus on strengthening economic measures and developing specific carbon emission reduction policies at the provincial, industry, and enterprise levels.
1 Introduction
There is a growing environmental issue due to the rapid growth of the global economy. By the end of 2021, 136 countries around the world had already set a goal of achieving “zero carbon” or “carbon neutral” status, encompassing 85% of the world’s population, 90% of GDP, and 88% of carbon emissions (Dai et al., 2022). The Chinese government has made a solemn commitment to achieve carbon peaking goals by 2030 and carbon neutrality goals by 2060, commonly referred to as the “double carbon” goal. This commitment allows China to expedite the process of reducing carbon emissions (Xi, 2022). Furthermore, China’s industrialization and urbanization are still ongoing. At the end of 2022, the China’s urbanization rate was 65.22% (National Bureau of Statistics of China, 2023). China is expected to achieve socialist modernization by 2035 (Xie et al., 2023b). Therefore, the Chinese government has explicitly proposed reducing carbon dioxide emissions per unit of GDP by 18% in 2025 compared to 2020. Therefore, a key concern is how to improve economic output per unit of carbon dioxide emissions, or carbon efficiency.
At the national and provincial levels, scholars have revealed the driving mechanisms behind carbon efficiency. They have discovered that energy efficiency, technical progress, industrial structure, economic development, and production factors all play important roles in determining carbon efficiency (Riti et al. 2017; Huang J., 2018; Wu et al., 2012; Zhang et al., 2020; Chuai and Feng, 2019; Sheng et al., 2020; wang and Jiang, 2020). At the enterprise level, some researchers have insight into the enormous differences in inter-enterprise environmental efficiency and energy efficiency even within the same province or industry (Yin et al., 2014; Wei and Zheng, 2017; Chen Z. and Chen Q., 2019). Inter-enterprise carbon efficiency in China also shows the similar features, shown in Figure 1. However, there are few studies on inter-enterprise heterogeneity and the driving factors of carbon efficiency from the perspective of enterprise heterogeneity. Thus, the current emission reduction policy design tends to ignore the inter-enterprise differences. Guan et al. (2018) and Zhou et al. (2019) attempt to drive factors of carbon efficiency at the enterprise level, but the samples of Guan et al. (2018) and Zhou et al. (2019) only include all of the Chinese A-share listed companies and 500 listed companies in the United States, respectively. These enterprises often have a good management team and are of a significant scale (Kong, 2021). It is therefore challenging to give a scientific basis for the policy design of carbon efficiency development on more non-A-share enterprises or non-listed enterprises in China due to the driver elements of carbon efficiency disclosed based on those samples, particularly the policy relating to the enterprise scale. It might even cause a flow in output from enterprises with high carbon efficiency to those with poor carbon efficiency, which would prevent China from increasing its carbon efficiency.
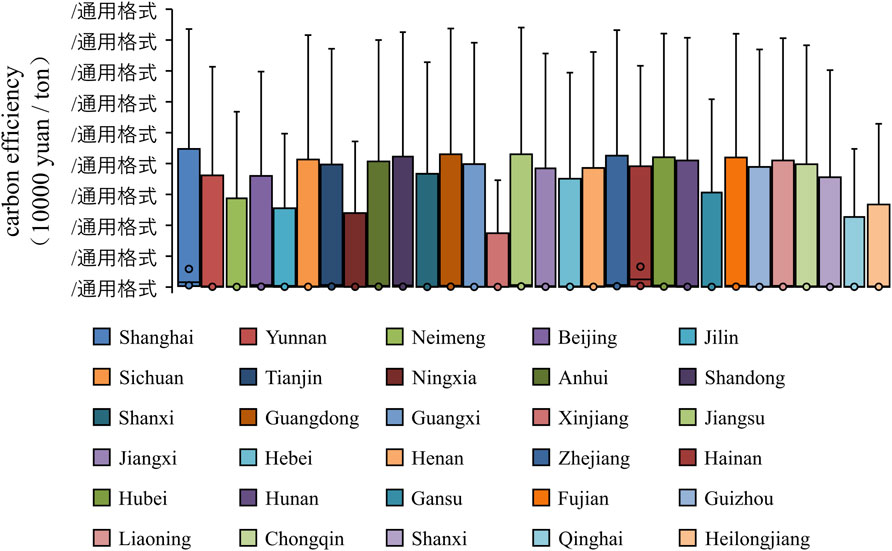
FIGURE 1. Heterogeneity of inter-enterprise carbon efficiency within the same province.
The primary objective of this research is to investigate the variations in carbon efficiency and its determinants among different enterprises and to evaluate the effectiveness of China’s emission reduction policies from the perspective of enterprise heterogeneity. This study aims to enhance the understanding of carbon efficiency characteristics at the enterprise level in China and provide a foundation for the development of more effective carbon emission reduction policies. This will be achieved by following the “measurement - drivers - policy evaluation” approaches of carbon efficiency from a perspective on enterprise heterogeneity. We will use fixed effects models and the Shapley value decomposition method, using a panel of 602,470 enterprise-year observations from Chinese industrial enterprises. The research framework is depicted in Figure 2.
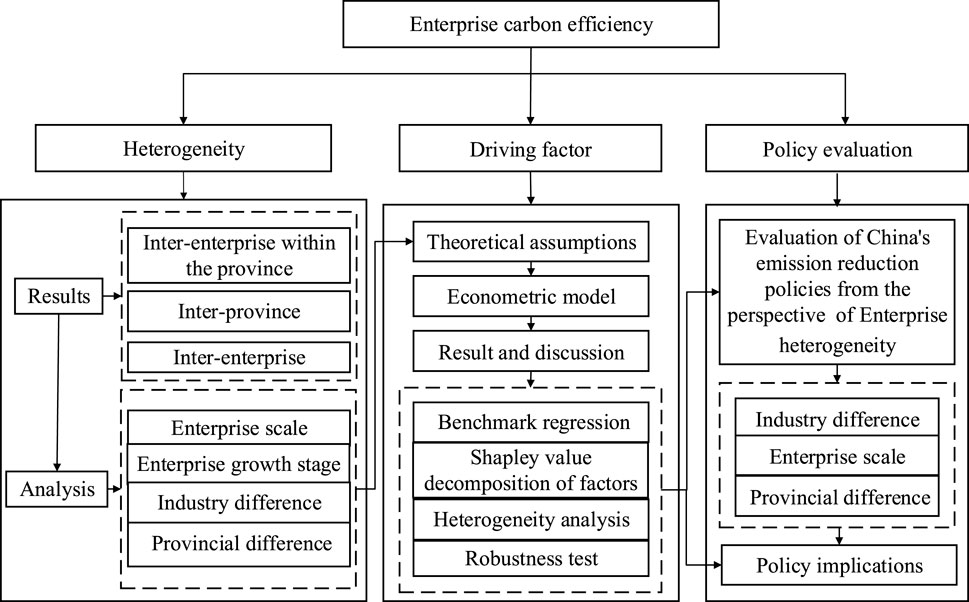
FIGURE 2. Research framework.
Its marginal contribution can be described as follows. 1) In contrast to previous studies conducted at the regional and A-share listed company levels, this study assesses the carbon efficiency of almost all industrial enterprises in China. The data used in this study is sourced from the China Pollution Enterprise Database, which covers 85% of the country’s pollutant emissions. This comprehensive approach provides a deeper understanding of the characteristics of enterprise carbon efficiency in China (Zhi et al., 2022; Li et al., 2023; Zhu et al., 2023). 2) This paper differs from previous studies at a macro level. It reveals the driving factors at micro levels and quantifies the contributions of these factors based on the Shapley value decomposition method. It provides an effective foundation for designing differentiation policies related to these important factors, with a focus on optimizing the allocation of resources between enterprises. 3) Unlike previous national-level policy evaluations, this paper specifically examines the impact of varying levels of implementation intensity of emission reduction policies based on enterprise scale, industry differences, and regional disparities. The aim is to optimize the allocation of inter-enterprises resources, which can contribute to the development of more effective carbon emission reduction policies.
2 Literature review
2.1 Driving factors of carbon efficiency
(1) Driving factors of carbon efficiency at national and provincial levels
Previous researches on driver factors of carbon efficiency mainly focus on the provincial level with fewer studies at the enterprise level. These researches are listed in Table 1 including research object, time span, method, explanatory variable, driver factor and result. At the national and provincial levels, communication technology, carbon emission technology, and green technology can directly improve carbon efficiency (Wu et al., 2012; Long et al., 2016; Huang X., 2018; Lin et al., 2022) and also directly increase carbon emissions through the rebound effect (Cheng et al., 2018). Carbon efficiency is improved by increasing energy efficiency (Mohammadi et al., 2014; Özbuğday and Erbas, 2015; Zhou et al., 2018). Carbon efficiency can be considerably improved by updating industrial buildings (Shao et al., 2014; Chuai and Feng, 2019; Zhang et al., 2020). There is conflicting evidence regarding how economic growth affects carbon efficiency. Economic growth would reduce carbon efficiency, according to Liang and Yang (2019), Riti et al. (2017) and Fujii and Managi (2013). According to Raza and Lin (2022), Raza and Lin, (2023), Azam (2016), Antonakakis et al. (2017), and Dong et al. (2018), economic growth would increase carbon efficiency. According to Sheng et al. (2020), there is a U-shaped correlation between economic growth and carbon efficiency. Production factor inputs, according to Wang and Jiang (2020), can reduce the negative effects of economic growth on carbon efficiency.
(2) Driving factors of carbon efficiency at enterprise levels

TABLE 1. Related research on driver factors of carbon efficiency.
At the enterprise level, there are few studies on inter-enterprise heterogeneity and the driving factors of carbon efficiency from the perspective of enterprise heterogeneity. By measuring the energy and environmental efficiency of 2,937 enterprises in the iron and steel sector between 2001 and 2005, Yin et al. (2014) noticed that there are significant regional, enterprise-scale, enterprise-ownership, production product category, enterprise-age, and capital-labor ratio influences on the efficiency. The energy intensity of China’s super-large enterprises has also increased to a level that is outstanding in the world, but the industry’s average energy intensity clearly lags behind (Wei and Zheng, 2017; Chen Z. and Chen Q., 2019) looked more closely at the stark variations in energy efficiency among enterprises within the various industries and provinces. The huge gap in enterprise energy efficiency suggests that enterprise carbon efficiency also differs significantly. Therefore, there is significant difference in inter-enterprise environmental efficiency and energy efficiency even within the same province or industry. As for the driving factors of carbon efficiency at enterprise levels, Zhou et al. (2019) revealed the positive effects of enterprise value and enterprise scale on enterprise carbon efficiency and the inhibitory effect of the institutional environment on that, which provided a richer basis for the design of emission reduction policies. According to Guan et al. (2018), state-owned enterprises performed better than private enterprises in terms of reducing carbon emissions, and the type of property rights that exist within enterprises are positively connected with their level of low-carbon performance.
2.2 Evaluation of emission reduction policy
Existing studies have primarily utilized econometric methods, computable general equilibrium methods, system dynamics methods, and other approaches to assess the impact of a specific policy or a combination of policies on carbon emission reduction. The evaluated policies often consist of nationally uniform policies, specific policies for particular industries or regions. Little attention has been paid to the impact of variations in implementation intensity among industries, regions, and enterprises under the same emission reduction policy on the overall carbon emission reduction effect. For the evaluation of national-level policies, Huang J., 2018 utilized a double-difference model to demonstrate that carbon trading in China can effectively promote reductions in carbon emissions and improvements in total factor productivity in pilot regions. Jiang and Raza (2023) estimated the impact of China’s renewable energy policies on the dual carbon goals by developing a framework based on the analysis of text content and discourse function dimensions. Zhao and Tang, (2018) conducted a quantitative evaluation of carbon trading, carbon tax, and command-and-control instruments by developing a Policy Modeling Consistency (PMC) index model and applying a text mining method. The results indicated that the carbon trading policy was the most effective, followed by the carbon tax, while the command-and-control instrument was the least effective. In a similar vein, Zhang et al. (2019) utilized the input-output approach to assess the impact of carbon tax on GDP and its role in promoting carbon emission reduction. Their findings suggested that carbon tax has a small negative impact on GDP but significantly contributes to reducing carbon emissions. For the assessment of regional policies, Zhang et al. (2016) employed a system dynamics model to evaluate the impact of the Beijing-Tianjin-Hebei carbon trading policy. The study found that the policy has a slight negative effect on the economy but can facilitate carbon emission reduction. Gao and Wang (2019) developed an evaluation index system for sewage rights policy, focusing on the policy’s quality, the policy’s target, and the main body responsible for policy implementation. They assessed the impact of the sewage rights policy in Gansu Province. Chen et al. (2016) developed a comprehensive evaluation model that includes indicators for carbon emissions, low-carbon industries, and energy consumption. They then conducted a thorough assessment of low-carbon economic policies in Anhui Province. For the assessment of industry-level policies, Wei (2017) compared the effects of carbon trading and capacity reduction on emission reductions in the iron and steel industry using the LEAP model. The results indicated that carbon trading had a more significant impact on emission reduction.
2.3 Brief comments
There is a wealth of research on the drivers of carbon efficiency and the evaluation of emission reduction policies, but further expansion is needed in the following aspects. First, research on drivers of carbon efficiency mainly focuses on macro-level factors, with little attention paid to the heterogeneity of carbon efficiency between enterprises and the factors that drive it. Macro-level studies implicitly assume that enterprises in the same region are homogenized. However, there are significant variations in carbon efficiency among enterprises (Wei and Zheng, 2017; Chen Z. and Chen Q., 2019). Previous relevant studies, assuming enterprise homogenization, have struggled to uncover the micro-mechanisms behind the phenomenon of enterprise output flowing to regions with low carbon efficiency. Designing targeted corrective policies has proven to be even more challenging. Second, the data used in the study of carbon efficiency drivers at the enterprise level are limited to large enterprises, which overlook the diversity in driving mechanisms among enterprises of different production scales. The study has not yet considered the applicability of its conclusions to small and medium-sized enterprises, thus limiting the scope of its application. Thirdly, previous policy evaluation studies have often focused on evaluating national unified policies or specific policies for a particular industry or region, with little attention paid to the impact of variations in the intensity of policy implementation for the same emission reduction policy among industries, regions, and enterprises. This oversight ignores the potential impact of resource allocation effects between enterprises, provinces, and industries that may be triggered by carbon emission reduction policies on the overall carbon emission reduction effect.
3 Theoretical assumptions
What are the factors that cause such heterogeneity in inter-enterprise carbon efficiency? We aim to analyze the variations in carbon efficiency among enterprises across four dimensions: enterprise size, growth stage, industry, and province.
3.1 Enterprise scale
According to the industrial standards outlined in the “Notice on the Issuance of Small and Medium-sized Enterprises Classification Standards,” enterprises are categorized as large-sized, medium-sized, small-sized, or micro-sized based on their operational income. According to Figure 3A, micro-sized enterprises have the lowest carbon efficiency, while small-sized and medium-sized businesses have the highest. Large-sized enterprises have a lower overall carbon efficiency level compared to medium-sized enterprises. However, they make up a relatively significant proportion of the most efficient enterprises in terms of carbon efficiency.
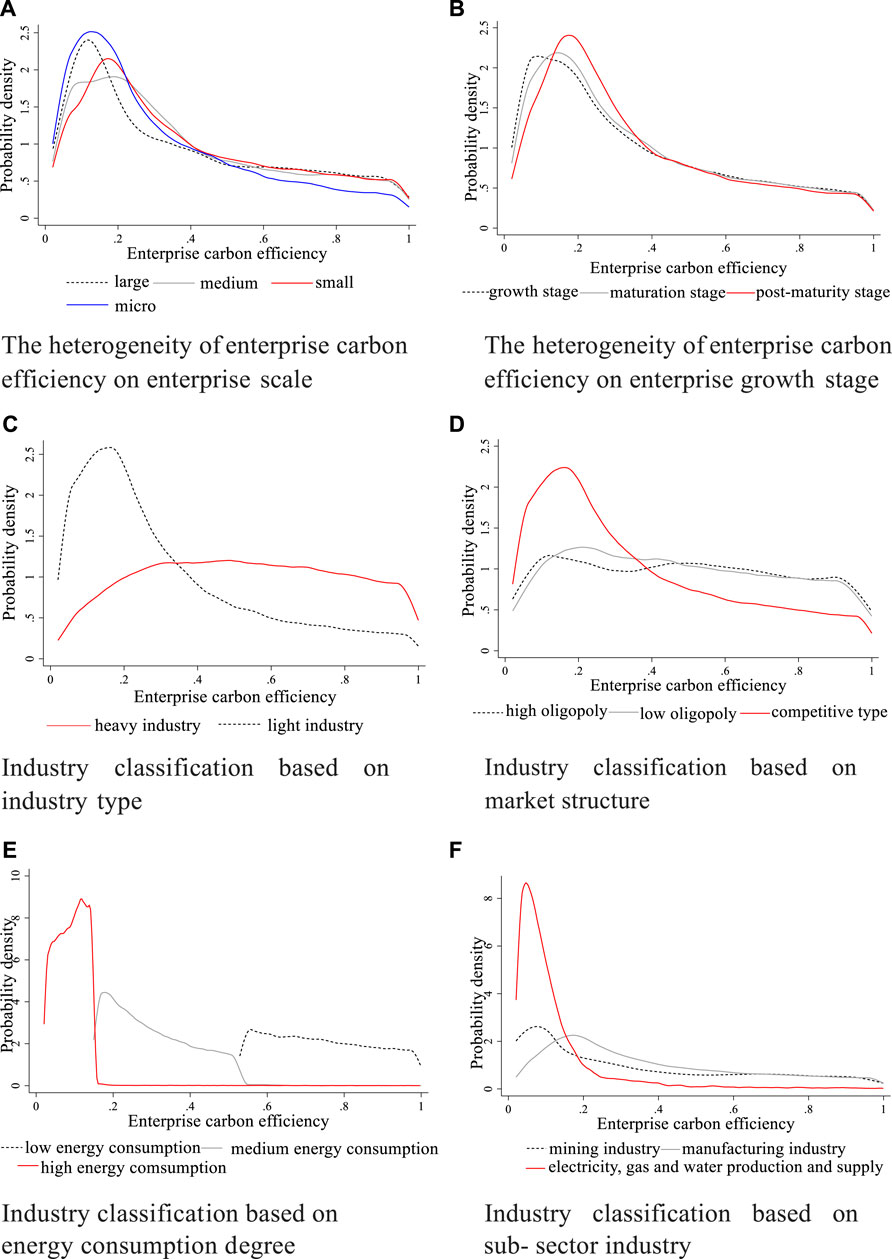
FIGURE 3. The heterogeneity of enterprise carbon efficiency: (A). The heterogeneity of enterprise carbon efficiency on enterprise scale (B). The heterogeneity of enterprise carbon efficiency on enterprise growth stage (C). Industry classification based on industry type (D). Industry classification based on market structure (E). Industry classification based on energy consumption degree (F). Industry classification based on sub-sector industry.
It can be shown that as the scale of enterprise increases, carbon efficiency initially increases and eventually decreases, as indicated by the theory of economies of scale. Medium-sized enterprises have greater capital accumulation compared to micro- and small-sized enterprises. This enables them to invest in advanced energy-saving and emission reduction equipment, which often comes with high fixed costs. Additionally, medium-sized enterprises are more willing to update their emission reduction equipment to reduce carbon costs, achieve long-term profitability, and cultivate a green enterprise image through economies of scale (Chen et al., 2019; Wang X. and Wang Q., 2023). With increased production scale, the internal management of enterprises becomes more challenging due to diseconomies of scale. These include poorer supervision of carbon emission standards, slower updates of advanced energy-saving and emission-reduction equipment, and excessive investment in energy factors that can reduce enterprise carbon efficiency (Chen and Hu, 2015; Wu and Ai, 2022). Of course, there are still some large-sized enterprises with exceptional abilities in enterprise management and resource allocation that can overcome the aforementioned risks, which can lead to diseconomies of scale. As a result, their enterprise carbon efficiency is higher than that of medium-sized enterprises. Therefore, our hypothesis is as follows.
H1. The scale of the enterprise has a significant effect of “first increase, then decrease” on enterprise carbon efficiency.
3.2 Enterprise growth stage
The enterprise’s growth stage is classified into three stages based on the 25% and 75% quantiles of its age: growth, maturation, and post-maturity. Figure 3B shows that the carbon efficiency of enterprises during the growth, maturation, and post-maturity stages is concentrated at 0.12, 0.18, and 0.2, respectively. This demonstrates that as an enterprise’s age increases, so does its carbon efficiency. In the expansion stage, enterprises have accumulated less technology, resources, and skills, and inefficient enterprises have not yet experienced market survival of the fittest. As a result, the stage’s carbon efficiency is quite poor (Dong and Yuan, 2014; Zheng et al., 2022). Therefore, our hypothesis is as follows.
H2. The enterprise growth stage has a significantly effect of “first increase, then decrease” on enterprise carbon efficiency.
3.3 Industry difference
Figure 1C shows substantial heterogeneity in the carbon efficiency of enterprises across different industrial categories, market structures, and energy consumption levels. According to Figure 1C, enterprises in heavy industry have higher carbon efficiency than those in light industry, and there is greater variation in carbon efficiency. When analyzing different market structures using the Herfindahl-Hirschman Index, it is found that low-oligopoly industries have the highest carbon efficiency, followed by competitive industries, and high-oligopoly industries have the lowest carbon efficiency (Wang and Li, 2012; Xie, 2020). Furthermore, the study observes inter-industry heterogeneity in carbon efficiency across various energy-consuming industries. Furthermore, the heterogeneity of carbon efficiency among different energy-consuming industries is more pronounced than in other industry classifications. This suggests that the level of energy consumption plays a significant role in determining the carbon efficiency of industries to some extent.
3.4 Provincial difference
The carbon efficiency of Chinese provinces is categorized into five levels, ranging from low to high: light-green area, medium-green area, deep-green area, blue-green area, and deep-blue area. These levels are illustrated in Figure 2. There are significant differences in carbon efficiency among the provinces in China. The eastern area is much larger than the central and western regions in terms of economic size. The deep-blue region, which also includes Hubei, Jiangsu, Shanghai, Zhejiang, Fujian, Guangdong, Hainan, and other areas, is primarily located in eastern China. While the western region is mostly represented by light and medium green areas, the central region is primarily represented by the medium green, dark green, and green-black areas.
Furthermore, the provincial carbon efficiency is relatively high in Xinjiang, Shanxi, and other regions with abundant energy resources, especially in areas with significant coal reserves. It demonstrates an excessive dependence on coal resources in areas abundant in coal, along with a high coal consumption per unit of output, leading to significant environmental harm and reduced carbon efficiency (Sun, 2021; Zhang, 2022).
4 Methodology
4.1 Measurement of inter-enterprise heterogeneity of carbon efficiency
The heterogeneity of enterprise carbon efficiency is systematically measured using multiple indicators, including the 90%–10% quantile, 75%–25% quantile, and coefficient of variation. This measurement is done from various perspectives, such as inter-enterprise, intra-province, intra-industry, inter-province, and inter-industry enterprises within the province.
4.2 Econometric model
Based on the identification results of the driving factors affecting the heterogeneity of enterprise scale, it is likely that the key factors are the enterprise growth stage, industry differences, and regional differences. Additionally, the enterprise scale and enterprise growth stage tend to have a positive or inverted “U” type effect on enterprise carbon efficiency. Accordingly, the measurement model for driving factors of enterprise carbon efficiency is constructed and shown in Eq. 1.
Among them, represents the carbon efficiency of enterprise i in year t;
In order to reduce parameter estimation errors caused by heteroscedasticity and sequence correlation, the parameters in the econometric model are estimated using the generalized least squares method. The F-test and t-test are employed to determine whether all independent variables can collectively explain the evolution of carbon efficiency, and whether each independent variable has a significant impact on carbon efficiency, respectively. In addition, the study will replace the data processing method for carbon efficiency, the measurement method for enterprise growth stage, and the model estimation method in order to test the robustness of the results.
4.3 Shapley’s value decomposition model
The Shapley value decomposition approach is introduced to reveal the relative importance of the above-mentioned factor on carbon efficiency. This study introduces a novel approach to decomposing the inequality index using a regression equation. This method allows for quantifying the contribution of each regression variable to the level of inequality in the dependent variable. One advantage of this approach over the traditional decomposition method is its ability to decompose any function form and any inequality index. and it has the features of complete breakdown and minimal limiting constraints. The model is used in many fields of economics and many countries, such as China, the United Kingdom, to help disentangle and quantify the impact of various causal factors. (Shorrocks, 2012; Wang and Yang, 2014; Chen and Chen, 2019).
The record
The contribution of the set containing all subsets of the explanatory variable i to the set of all explanatory variables should be weighted as shown in Eq. 3.
Finally, the product of the weight coefficient and the marginal contribution represents the contribution of the set that includes all subsets of the explanatory variable i to carbon efficiency, as demonstrated in Eq. 4.
5 Variable and data
The sample period is from 2001 to 2011, and it includes 174,036 research companies from 30 provinces and 38 industries. In total, there are 602,470 observations in the sample. As for the carbon efficiency of enterprises, Wei (2017), Pan et al. (2017), and Lin et al. (2021) argue that single-factor carbon efficiency aligns with the statistical standards of governments and institutions, such as the United Nations Climate Change Convention and various energy conservation and emission reduction assessment targets. Consequently, the results are more comparable and carry specific policy implications. Therefore, we use a single-factor carbon efficiency, which is calculated by dividing enterprise carbon emissions by the enterprise’s output. The carbon emissions of the enterprise are calculated by multiplying the consumption of coal, fuel oil, and natural gas by their respective carbon emission factors. The data on carbon emission factors is from the Intergovernmental Panel on Climate Change. The data on coal, fuel oil, and natural gas consumption, enterprise output, enterprise scale, enterprise growth stage, industry, and province are sourced from the China Industrial Enterprise Pollution Emission Database. This database is considered the most comprehensive and reliable source of micro-environmental data in China (Lin et al., 2021). The data on coal prices, population, and energy consumption are sourced from the “China Energy Statistics Yearbook,” the National Bureau of Statistics, and the China Energy Statistics Yearbook. The descriptive statistical analysis results of each variable are shown in Table 2.
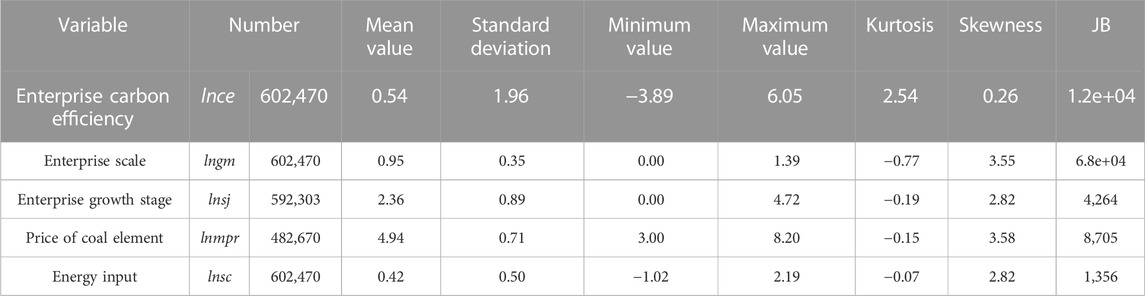
TABLE 2. Data description and descriptive statistical analysis.
6 Result and discussion
6.1 Heterogeneity of inter-enterprise carbon efficiency
The heterogeneity of enterprise carbon efficiency is systematically measured using multiple indicators, such as the 90%–10% quantile, 75%–25% quantile, and coefficient of variation. This measurement is done from various perspectives, including inter-enterprise, intra-province, intra-industry, inter-province, and inter-industry comparisons within the province. Table 3 presents the measurement findings.
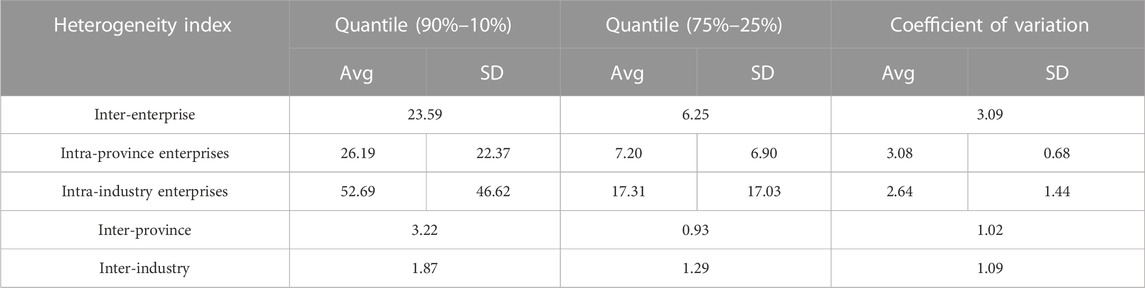
TABLE 3. Results of the heterogeneity of enterprise carbon efficiency.
There is significant heterogeneity in carbon efficiency among enterprises within provinces and industries, as well as among provinces and industries. The difference in carbon efficiency between enterprises within an industry and a province, as measured by the 90%–10% quantile, 75%–25% quantile, or coefficient of variation, is greater than the difference among provinces and industries. For carbon emissions per ton of standard coal, among 39 industries in China, enterprises in the 90% percentile of carbon efficiency experience an average output increase of 526.9 thousand yuan compared to those in the 25% percentile. Similarly, industrial enterprises in the 75% percentile of carbon efficiency see an average output increase of 173.1 thousand yuan compared to those in the 25% percentile. Among the 30 provinces studied in China, those in the 90% percentile of carbon efficiency have an average output increase of 261.9 thousand yuan compared to those in the 10% percentile, while those in the 75% percentile experience an average output increase of 72 thousand yuan compared to those in the 25% percentile. Due to variations in energy consumption influenced by industry and province characteristics, such as economic development level, industrial agglomeration level, and factor price level, the heterogeneity of inter-enterprise carbon efficiency within the industry and province is not primarily driven by these factors. Instead, the inter-enterprise gap is mainly influenced by disparities in energy-saving and emission reduction technology and equipment, as well as variations in green management practices. In various sectors and regions, there are world-class enterprises that demonstrate exceptional carbon efficiency. The optimization of resource allocation among enterprises requires those with poor carbon efficiency in the industry and provinces to upgrade their energy-saving and emission-reduction equipment. Otherwise, they may be forced to shut down.
Various industries and provinces exhibit different levels of heterogeneity in inter-enterprise carbon efficiency. Table 4 shows that, for the six major high-energy-consuming industries in China, the gaps in carbon efficiency between the 90% and 10% quantiles, as well as the gap between the 75% and 25% quantiles are lower than the industry average. However, the overall gap is higher than the industry average, as indicated by the coefficient of variation. This indicates that the primary approach to improving their carbon efficiency is to allocate output towards enterprises with high carbon efficiency in energy-consuming sectors. As noted in Table 5, the six key industries with high energy consumption exhibit similar characteristics in the major energy-producing regions of Xinjiang, Gansu, and Heilongjiang in China. In contrast, the interquartile range of inter-enterprise carbon efficiency is larger than the industry average in eastern provinces, including Shanghai, Guangdong, Beijing, and Tianjin. However, the coefficient of variation is lower than that. This indicates that these localities have significantly higher enterprise carbon efficiency ratings than the provincial average at the 90% and 75% quantiles, respectively. In other words, the top 25% of enterprises are primarily responsible for the high levels of carbon efficiency in these provinces. On the other hand, the carbon efficiency levels of the remaining 75% of enterprises are often low, which demonstrates the traditional phenomenon of “partial leading, overall lagging.” This phenomenon may be attributed to the “whip the fast ox” policy, which will be further examined in Section 4 of the article. The burden of energy conservation and emission reduction in China primarily falls on enterprises within the industry and provinces that have higher carbon efficiency. This situation hampers the efficient allocation of resources among enterprises and does not contribute to improving overall carbon efficiency.
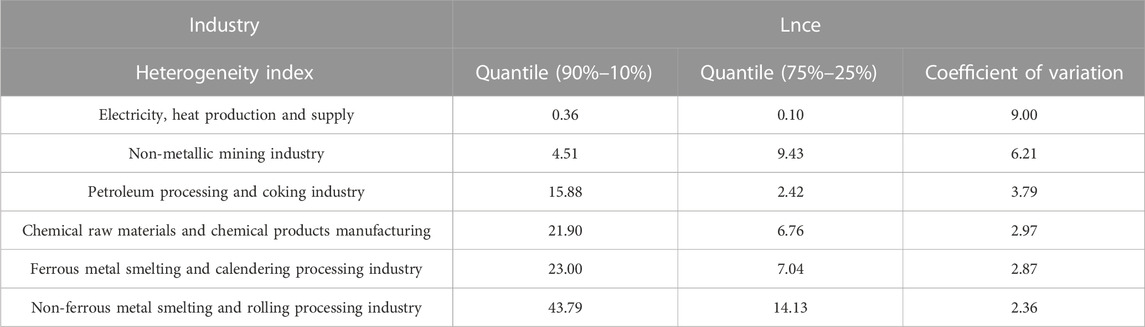
TABLE 4. Result of the heterogeneity of intra-industry enterprises carbon efficiency in the six major high-energy-consuming industries in China.
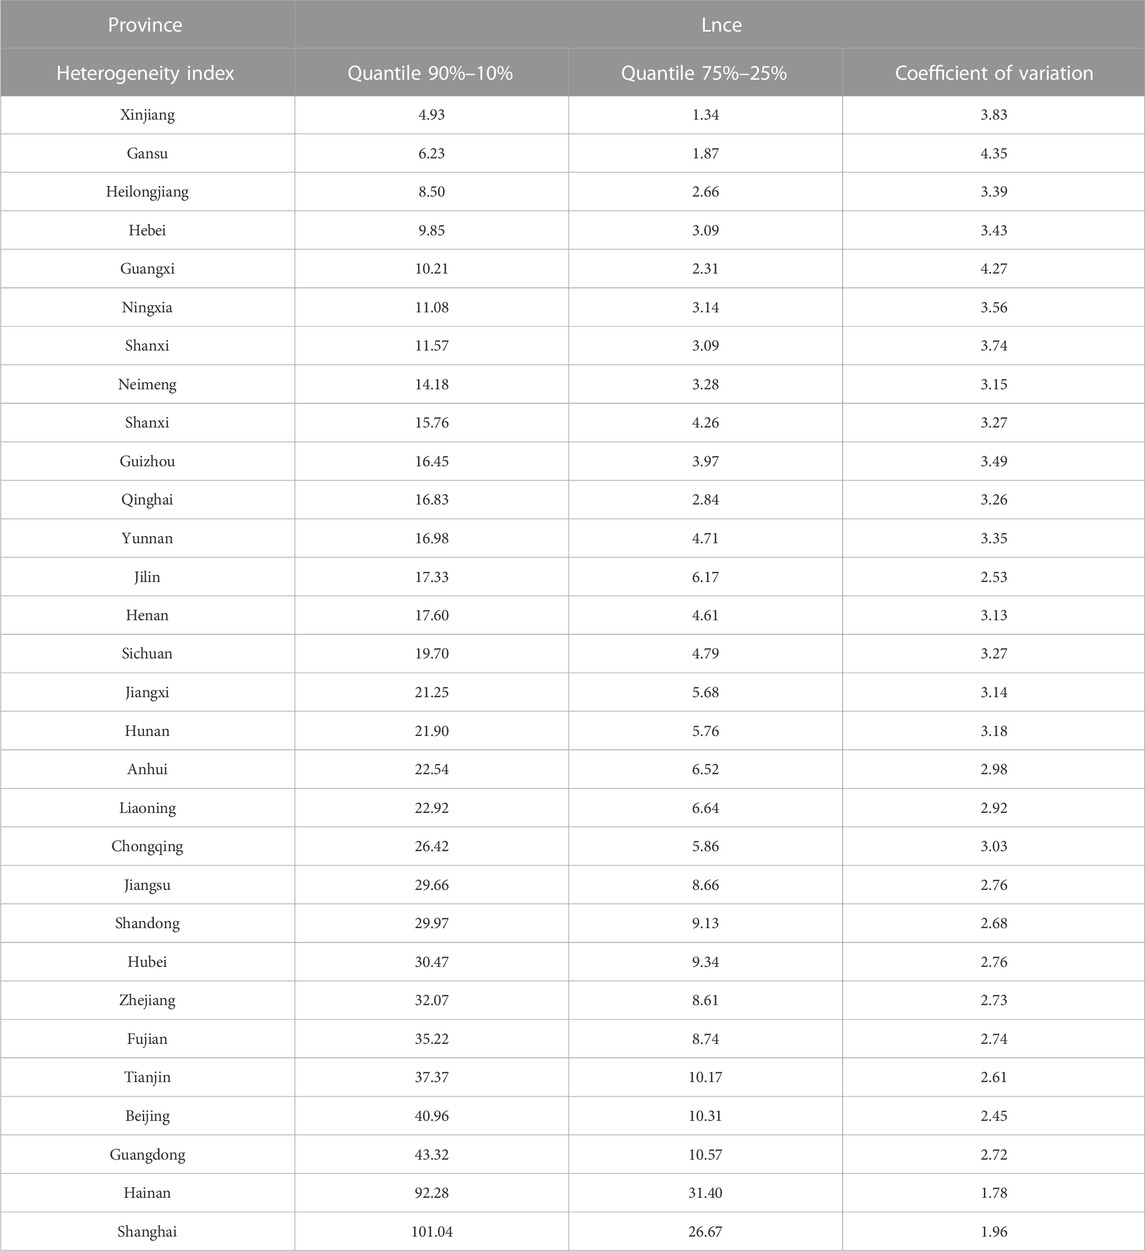
TABLE 5. Result of the heterogeneity of intra-province enterprises carbon efficiency in China.
Furthermore, there is significant heterogeneity in carbon efficiency among provinces and industries, as observed by Xie et al. (2023a). The carbon efficiency of nonferrous metal smelting and rolling processing enterprises is 15.77 times higher than that of the electricity, thermal production, and supply industry. In comparison, Shanghai’s carbon efficiency is 12.47 times higher than that of Xinjiang. This suggests that greening the industrial structure and optimizing inter-provincial resource allocation can significantly contribute to improving China’s carbon efficiency.
6.2 Driving factors of carbon efficiency: From a perspective of the heterogeneity of enterprise
6.2.1 Benchmark regression
In order to evaluate the robustness of the model, we constructed several fixed effect models for time, industry, province, and interaction. Eq. 1 was expanded to Models 1 through 5 using the stepwise regression method. Table 6 displays the results of the parameter estimation. The F-values of these five models are all greater than 10, and they all passed the F-test at the 1% level of significance. This indicates that factors such as enterprise scale, enterprise growth stage, industry difference, and provincial difference have a significant impact on carbon efficiency. These factors can explain the heterogeneity in carbon efficiency among different enterprises. These driving factors have passed the t-test at the 5% significance level in models 1-5, and the coefficient symbols for the same factor in models 1-5 are consistent. It shows that these factors have a significant impact on enterprise carbon efficiency, and the estimation results are robust and reliable. In addition, the measurement results of the contribution of each factor to carbon efficiency are shown in Figure 4.
(1) Inter-industry differences are the most significant factor contributing to heterogeneity in inter-enterprise carbon efficiency, accounting for 25%–35% of the variability in inter-enterprise carbon efficiency. The contribution rate has remained at 35% from 2001 to 2006, as depicted in Figure 4, establishing it as the most significant contributor among all influencing factors. Since 2007, its contribution has decreased to approximately 30%. When combined with the results of heterogeneity research and compared to various industrial types and market structures, the carbon efficiency gap is most significant among industries with different energy consumption levels. This demonstrates that the key factor in achieving carbon neutrality is to prioritize energy savings and emission reduction in enterprises. Furthermore, carbon efficiency is highest in industries with low oligopoly, second lowest in competitive industries, and lowest in industries with high oligopoly. This suggests that both excessively high and excessively low levels of market competition are not conducive to motivating enterprises to improve carbon efficiency. Only a moderately competitive market environment is more likely to drive enterprises to enhance their carbon efficiency.
(2) Enterprise scale has a significant impact on enterprise carbon efficiency, and the two have an inverted “U”-shaped relationship. This supports hypothesis H1. It is second only to industry dummy variables in terms of carbon efficiency. As illustrated in Figure 4, the level of explanation for enterprise scale steadily increased from 10% in 2001 to 15% in 2010. As shown in Table 6, both the primary and quadratic coefficients for enterprise scale are negative and pass the t-test at the 1% significance level. Different from the linear relationship between enterprise scale and carbon efficiency (Wang et al., 2023; Liu et al., 2022; Li et al., 2016; Ji et al., 2023), the results demonstrate that enterprise scale has a “first increase and then decrease” effect on carbon efficiency, which is consistent with the theory of economies of scale. Advanced energy efficiency and emission reduction equipment is expensive, making it affordable only for large and medium-sized enterprises. For small enterprises, the reduction in energy input costs and carbon costs caused by emission reduction technology is insufficient to cover the fixed costs associated with their lower output (Chen and Zhan, 2019; Chen, et al., 2020). Within a given enterprise scale, larger enterprises are more willing and able to implement modern energy-saving and emission-reducing technology in order to improve carbon efficiency. As the scale of the enterprise grows beyond the optimal level, internal management becomes more challenging for various reasons. This can potentially result in inadequate regulation of carbon emission standards, delayed updates of advanced energy-saving and emission reduction equipment, and excessive investment in energy factors, which in turn reduces carbon efficiency (Liu, et al., 2017; Ji, et al., 2023). As can be observed, the size of enterprises only plays a facilitating role in carbon efficiency within a certain range. However, when the optimal size is exceeded, it instead inhibits improvements in carbon efficiency. It is possible that, due to favorable policies in certain high-energy-consuming industries, many firms may indiscriminately increase their production scale, thereby reducing their carbon efficiency. Accordingly, when developing future programs, governments should be cautious of the risks.
(3) The contribution of inter-provincial differences to variations in carbon efficiency ranks third, following industry differences and enterprise scale. Furthermore, its contribution has been increasing year by year. Carbon efficiency is highest in the eastern region, followed by the central region, and lowest in the western region, according to Figure 5 and Table 3. This finding is consistent with the studies conducted by Gao et al. (2023), Wang et al. (2023), Lin and Du (2015), and Jiang et al. (2021). There are significant differences in enterprise carbon efficiency among provinces, which can be explained by factors such as energy input, energy prices, and other provincial characteristics. Table 2 shows that coal prices and energy input have a significant negative impact on enterprise carbon efficiency. In conjunction with the “resource curse” theory, the comparatively low cost of coal in central and western provinces like Shanxi and Xinjiang leads to excessive dependence on energy resources by enterprises and a lack of motivation to conserve energy. Consequently, this results in relatively low carbon efficiency (Song and Yang, 2019; Jiang and Lu, 2023). In addition, enterprises with low carbon efficiency tend to establish locations in central and western regions with abundant resource reserves and low energy prices in order to reduce their energy input costs. However, this decision further decreases the carbon efficiency of these regions (Wang and Liu, 2009; Liu, et al., 2015; Kong and Li, 2017).
(4) The enterprise growth stage has a significantly inverted U-shaped effect on enterprise carbon efficiency, and its contribution to carbon efficiency is rather moderate. It supports H2 and is consistent with Wang et al. (2023) to some extent. On the one hand, as enterprises mature, they accumulate more capital and develop a stronger inclination to adopt energy-saving and emission-reduction equipment. This is done to minimize energy and carbon expenses, as well as to cultivate a sustainable and environmentally-friendly corporate image. Consequently, carbon efficiency is consistently being advanced. On the other hand, as the opening times of enterprises increase, the market can gradually eliminate those with lower carbon efficiency (Chen Z. and Chen Q., 2019; Ma and Sun, 2023). However, as enterprises age, under strict environmental regulations and an ideal carbon trading market, the remaining enterprises tend to have relatively high carbon efficiency. Conversely, in a different scenario, enterprises with low carbon efficiency may even collude with the government to evade environmental regulations, resulting in lower carbon efficiency. Based on the significant inverted “U” shape effect of enterprise growth stage on carbon efficiency, it is likely that China’s current environmental regulation and supervision are inadequate. Additionally, the carbon trading market is not yet perfect, and local governments continue to improperly intervene. These issues may be mechanisms that impede China’s improvement in carbon efficiency.
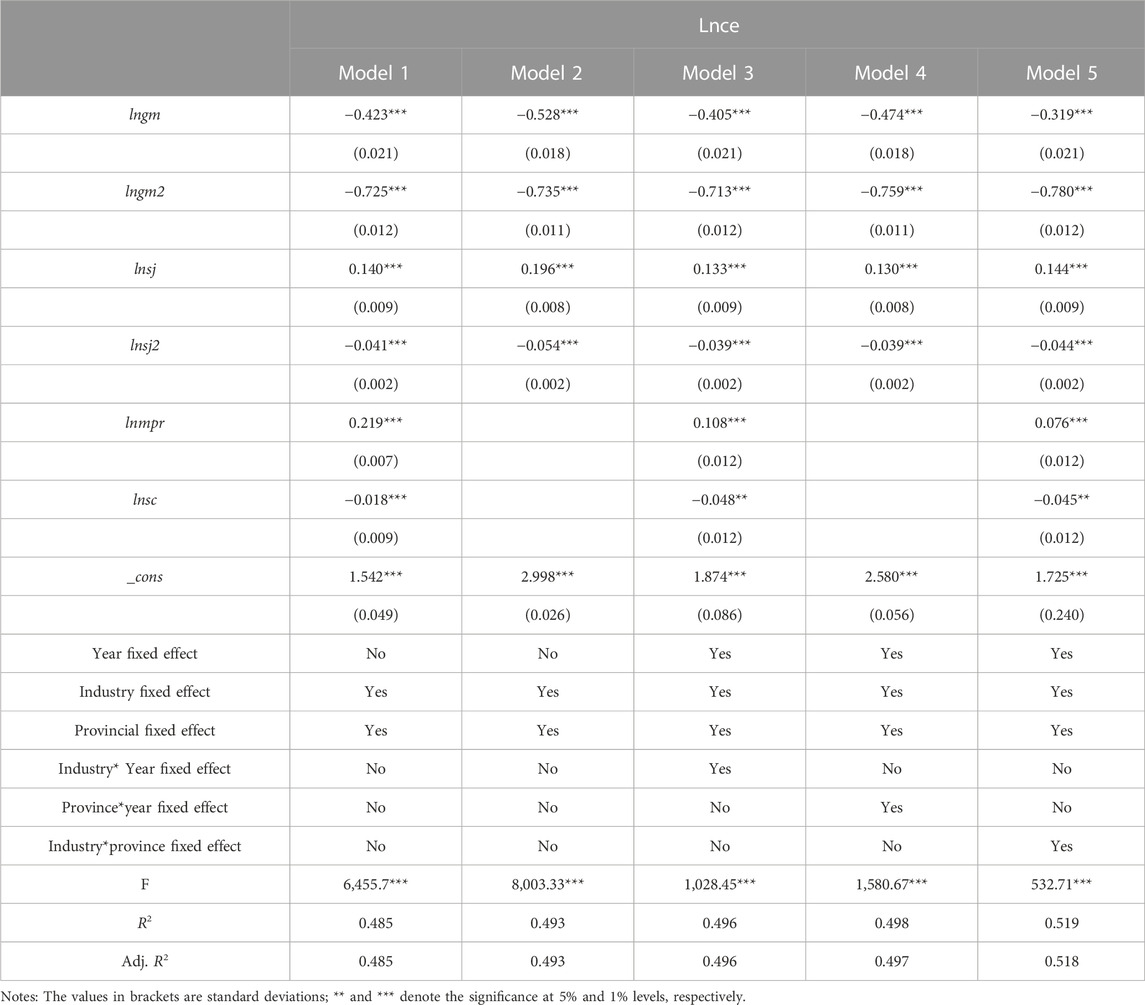
TABLE 6. Parameter estimation results.
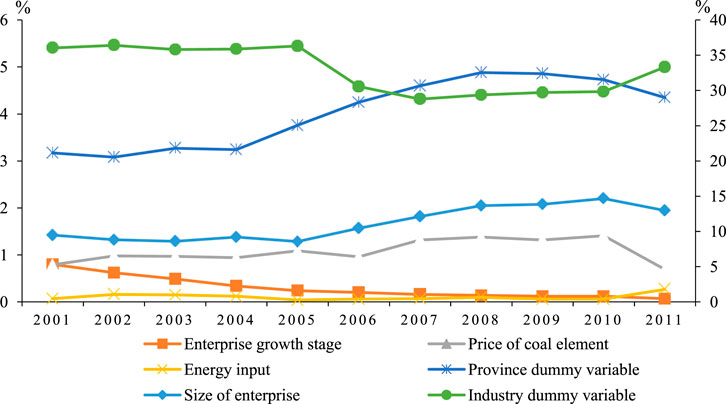
FIGURE 4. Contribution of drivers of carbon efficiency. Note: Industry dummy variables and enterprise scale use the secondary axis, while other factors use the primary axis.
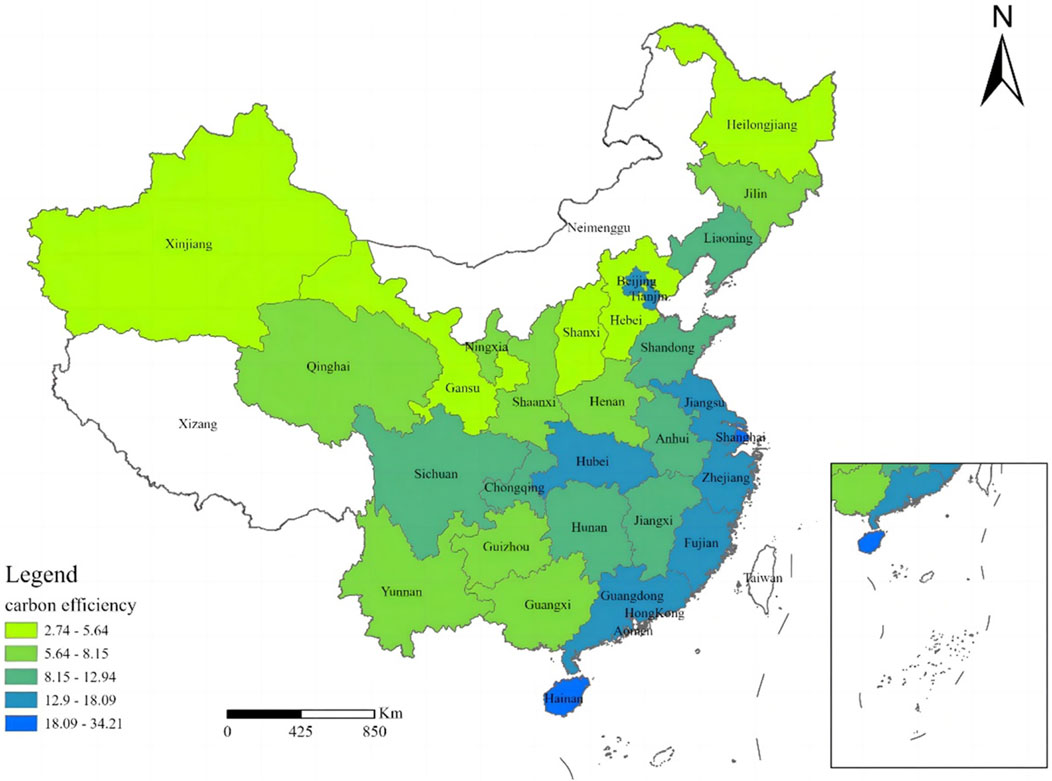
FIGURE 5. Inter-provincial heterogeneity of enterprise carbon efficiency.
6.2.2 Further regression analysis: Heterogeneity analysis
(1) Analysis of industry heterogeneity
We conducted empirical tests to examine the heterogeneity of the driving mechanisms behind enterprise carbon efficiency in different industries (Tables 7–9), Our analysis revealed that the carbon efficiency of enterprises varies across different energy consumption industries, market structure industries, and business types, as shown in Figure 3C Additionally, we found that the scale and growth stage of an enterprise have a significant inverted “U” effect on carbon efficiency, particularly in industries outside of oligopoly markets. These findings are consistent with the results obtained from the full sample analysis. The degree of influence primarily reflects the industry heterogeneity caused by these factors.
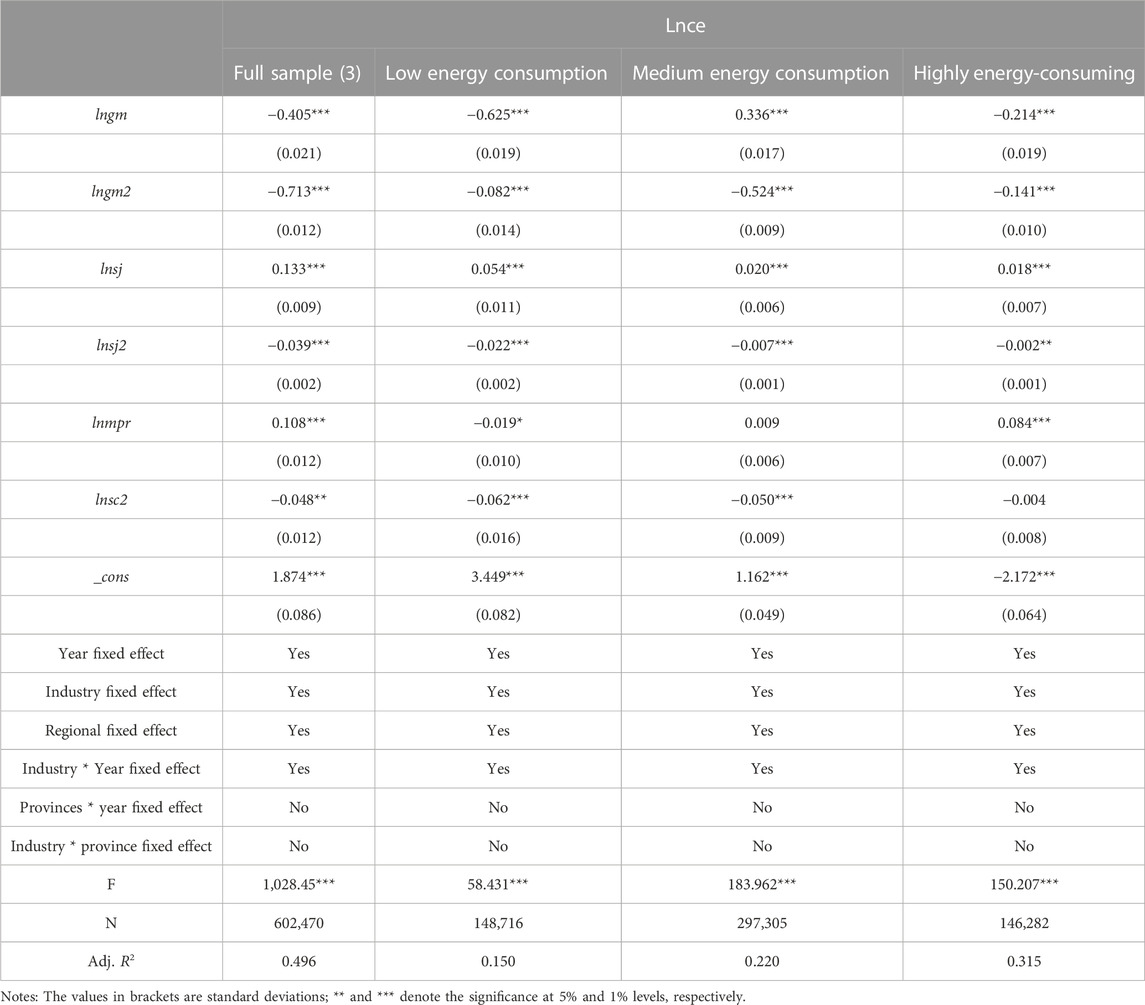
TABLE 7. Heterogeneous regression result among industries grouped by energy consumption.
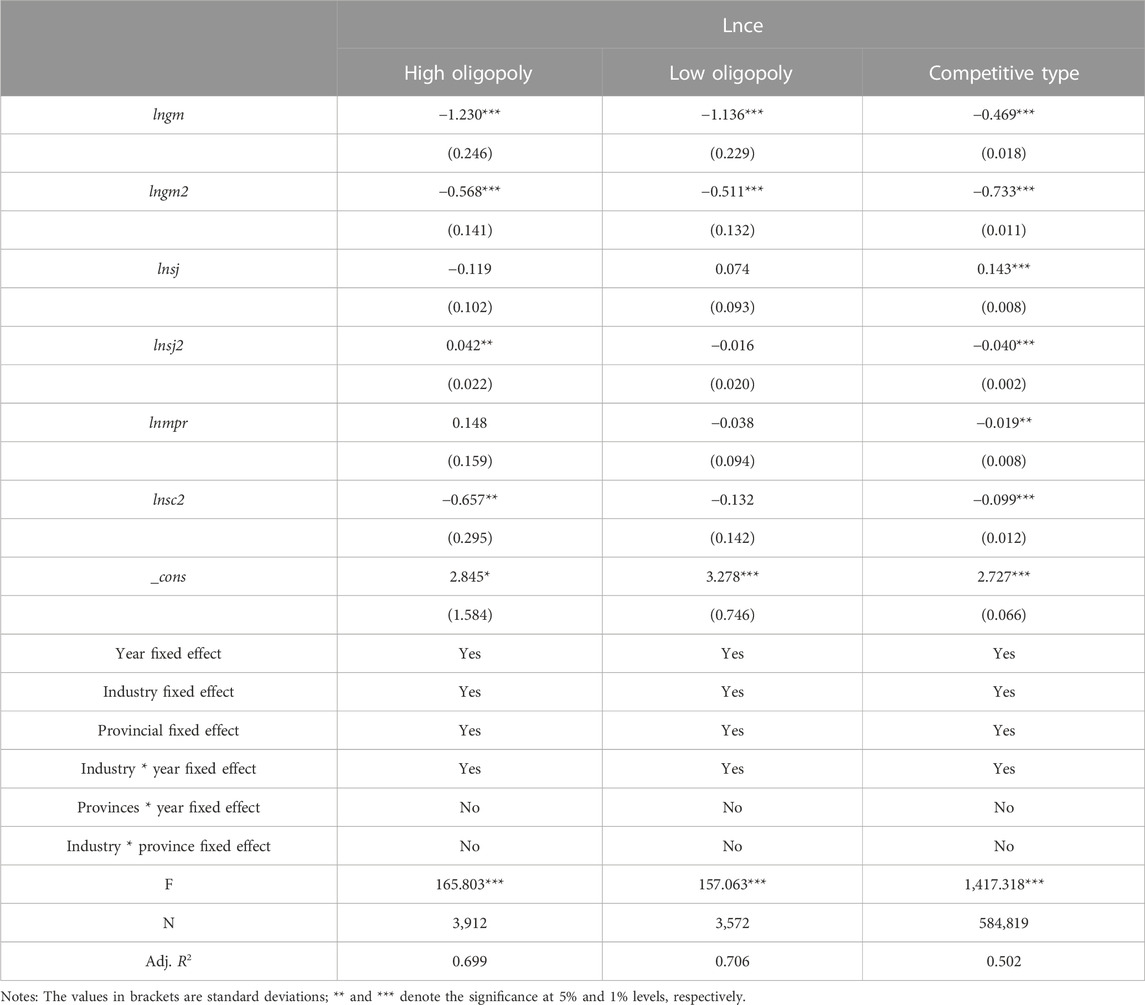
TABLE 8. Heterogeneous regression result among industries grouped by market structure.
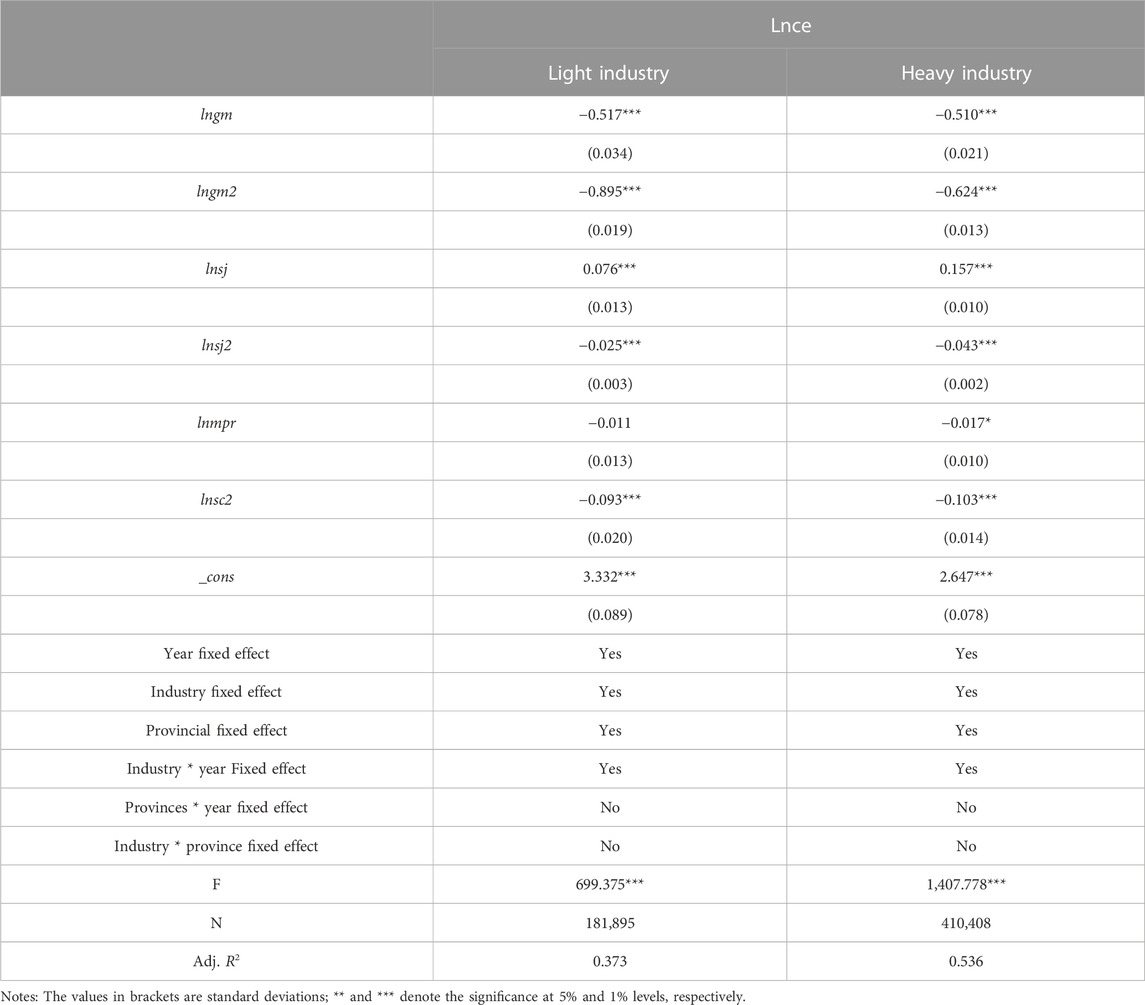
TABLE 9. Heterogeneous regression results among industries grouped by business type.
From Table 7 to Table 10, it can be observed that when the size of enterprises has not yet reached or exceeded the optimal scale, the impact of enterprise scale on carbon efficiency can be either positive or negative, depending on the industry. The degree of influence primarily reflects the heterogeneity of the industry. The carbon efficiency of the medium energy-consuming industry is most sensitive to the scale of the enterprise in terms of energy consumption level. When the optimal scale has not yet been reached, the medium energy-consuming industry will experience a high scale economy effect, whereas the low energy-consuming industry would experience the opposite result. In terms of market structures, the influence of enterprise scale on the carbon efficiency of competitive industries is greater than that of oligopoly industries. This implies that the economies of scale effect is more substantial in a more competitive market. Enterprises in a more competitive market are more willing to increase the adoption and upgrading of energy-saving and emission-reduction equipment in order to reduce carbon emissions and energy costs. In terms of business types, the impact of enterprise size on carbon efficiency is greater in heavy industry than in light industry. It implies that policies aimed at eliminating small-scale mines, steelworks, and coal-fired power plants can significantly improve the industry’s carbon efficiency. At the same time, we must be aware of the negative impact that excessive growth in enterprise size can have on carbon efficiency. Consequently, carbon emission reduction policies at the enterprise level will have a greater impact on industries that consume medium amounts of energy, industries that are competitive, and light industries. These policies should not only encourage inter-enterprise mergers and reorganizations to fully leverage the significant economies of scale of large enterprises, but also consider the potential diseconomies of scale that can arise from excessive expansion.
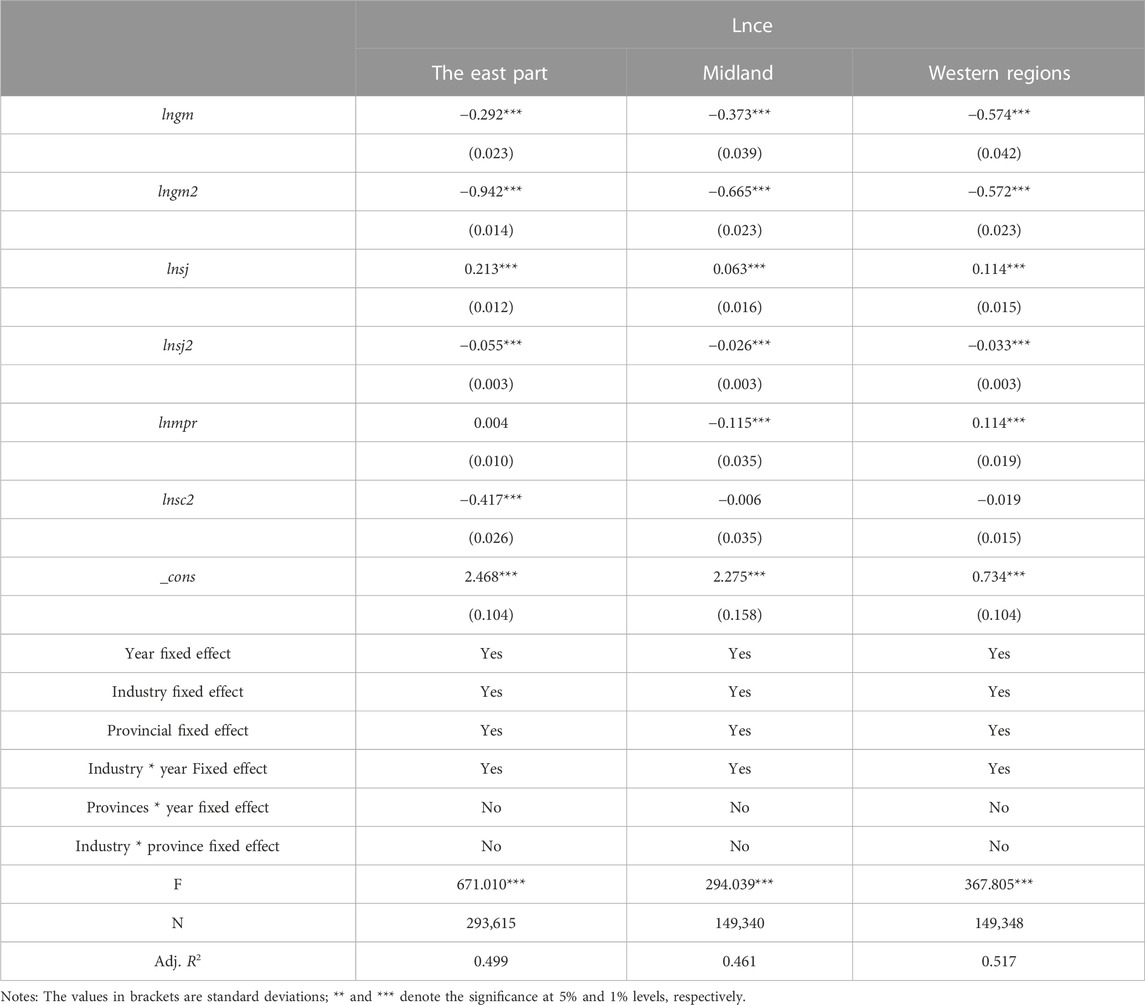
TABLE 10. Heterogeneous regression results at the regional level.
Furthermore, the growth stage of enterprises exhibits significant inter-industry heterogeneity, characterized by varying market structures. In contrast to other industry classifications, the growth stage of enterprises has a significant “U”-shaped impact, a non-significant impact, and a significant inverted “U”-shaped impact on carbon efficiency in high oligopoly, low oligopoly, and competitive industries, respectively. This demonstrates the significance of the market competition environment in exerting influence, particularly for mature and post-mature enterprises. In terms of energy consumption levels, the impact of enterprise growth stage on enterprise carbon efficiency is smaller in industries with higher levels of energy consumption. This means that emission reduction management in high-energy-consuming enterprises does not need to consider the heterogeneity of individual enterprises.
(2) Analysis of regional heterogeneity
The results of the heterogeneous driving mechanism of enterprise carbon efficiency at the regional level are shown in Table 10. Whether in the eastern, central, or western regions, the scale and growth stage of enterprises have a significant inverted “U”-type effect on carbon efficiency. The impact is greater in the eastern region compared to the central and western regions.
For the regional heterogeneity of the driving influence of enterprise scale, the eastern region exhibits a higher degree of market development, a higher level of environmental regulation, and a deeper penetration of the carbon market. As a result, various pressures, such as stringent environmental regulations, high carbon costs, and intense competition in the green sector, will compel enterprises to expedite the adoption of advanced energy-saving and emission-reduction equipment. This, in turn, will enhance the emission efficiency of enterprises before they reach their optimal scale. When an enterprise’s scale exceeds a reasonable level, it loses its cost advantage in areas with intense market competition and lacks the capacity to upgrade to innovative energy-saving and emission-reduction equipment. However, due to greater local intervention, limited marketization, and less stringent environmental regulations in the central and western regions, enterprises in these areas tend to allocate more funds towards expanding reproduction rather than investing in advanced energy-saving and emission-reducing equipment. As a result, the scale economy effect on carbon efficiency improvement is weaker in these regions compared to the eastern region.
Moreover, the driving effect of the enterprise growth stage varies across regions due to regional heterogeneity. Specifically, the eastern region, which has a higher market development level compared to the central and western regions, experiences more intense market competition for older enterprises. In the eastern region, the age of the enterprise has a greater impact on carbon efficiency.
6.2.3 Robustness test
To test the robustness of the study’s results, we have replaced the data processing method for carbon efficiency, the measurement method for enterprise growth stage, and the model estimation method. The carbon efficiency data is processed by reducing the tail by 1% in the original regression model. The enterprise growth stage is divided into three stages: growth stage, maturation stage, and post-maturity stage, based on the 25% and 75% percentiles of the enterprise age. The model is estimated using the LSDV method. From Table 11, it can be observed that the enterprise carbon efficiency exhibited a two-sided tail-down at the 1% and 5% levels, as well as a two-sided truncation at the 5% level. After modifying the division basis to 30%–70% and 33%–66%, and changing the estimation method of the model to Fixed Effects Generalized Least Squares (FEGLS), all the models successfully passed the F test at the 0.01 significant level. Additionally, the coefficients of the first and second terms, representing the enterprise scale and the enterprise growth stage, respectively, passed the t-test at the 0.01 significant level. Additionally, it has been found that, in line with the findings of the original model, the size and growth stage of the enterprise have a significant inverted “U”-shaped effect on the carbon efficiency of the enterprise. Therefore, the results of this study are reliable and credible.
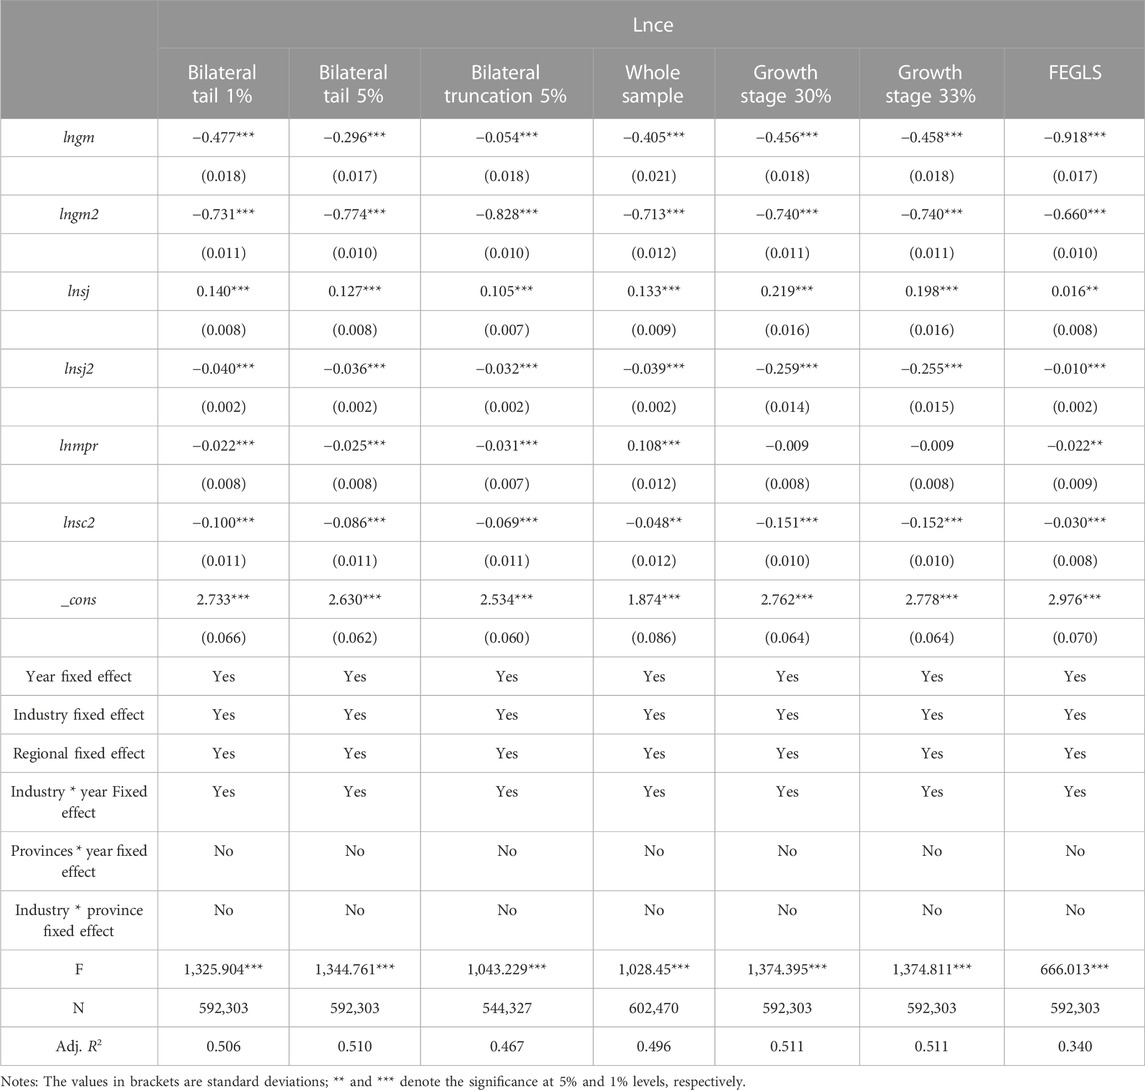
TABLE 11. Robustness test.
6.3 Evaluation of China’s emission reduction policies from the perspective of enterprise heterogeneity
According to the results of the Shapley value decomposition, the three primary factors contributing to inter-enterprise heterogeneity are differences in industry, enterprise scale, and province. Therefore, the Chinese emission reduction policies related to enterprise scale, industry differences, and provincial differences are assessed from the viewpoint of the heterogeneity of enterprise carbon efficiency.
6.3.1 Emission reduction policies related to industry difference
“Issuance of a Comprehensive Work Program for Energy Conservation and Emission Reduction During the ‘14th Five-Year Plan’ Period” states that it aims to promote energy-saving transformations in key industries such as iron and steel, nonferrous metals, building materials, petrochemicals, and chemicals. The program sets a target of completing ultra-low emission transformations for 530 million tons of iron and steel production capacity by 2025. Additionally, it aims for the proportion of production capacity that meets energy efficiency benchmark levels to exceed 30% in key industries such as iron and steel, electrolytic aluminum, cement, flat glass, oil refining, ethylene, synthetic ammonia, and calcium carbide by 2025 (The State Council, 2022). It also corrects the capitalization of industry names and adds clarity to the targets set by the program. “The Implementation Plan for Synergistic Efficiency Reduction and Carbon Reduction” emphasizes the importance of expediting the advancement of industrial structures and production methods that promote pollution and carbon reduction. It also strictly prohibits the expansion of production capacity in key areas of air pollution prevention and control, such as steel, coking, oil refining, electrolytic aluminum, cement, and flat glass (excluding photovoltaic glass) (Ministry of Ecology and Environment, 2022). Furthermore, the “Notice of the Action Plan for Carbon Peaking by 2030” proposes that energy-intensive industries above a certain threshold should closely monitor and replace their capacity, while also taking strict measures to prevent the addition of new capacity (The State Council, 2021).
According to the aforementioned policies, China’s efforts to reduce carbon emissions primarily focus on industries with high energy consumption, including iron and steel, nonferrous metals, building materials, petrochemicals, and chemicals. These industries are known for their significant carbon emissions and high carbon intensity. Carbon reduction actions for these industries will promote emissions reduction in high-energy-consuming industries and trigger a shift in output to low-energy-consuming industries. This shift is beneficial for China’s industrial structure’s sustainable development and the improvement of national carbon efficiency.
However, during the implementation of the policy, it was observed that some tasks of carbon reduction only focused on the proportion of production capacity that reaches energy efficiency benchmark levels, which should exceed 30% in key industries. As a result, the actual enterprises responsible for carbon reduction were primarily those in the top 30% of carbon efficiency within the industry. Meanwhile, the enterprises with lower carbon efficiency and larger carbon emissions reductions were not given as much attention. It causes a phenomenon known as “whipping the fast ox,” which is detrimental to the overall improvement of carbon efficiency in these industries.
6.3.2 Emission reduction policies related to the enterprise scale
The “Comprehensive Work Program for Energy Conservation and Emission Reduction” implemented “Hundred million” actions for key energy-consuming enterprises (The State Council, 2017). The objective of responsibility evaluation and assessment is used by the state, provinces, and municipalities to evaluate the goal responsibility of “100,” “1,000,” and “10,000” key energy-using enterprises based on overall emission reduction targets. The “Notice on the Action Plan to Achieve Carbon Peak by 2030” proposes that projects currently under construction, which have energy efficiency levels lower than the industry’s energy consumption limit, may be halted for rectification in accordance with relevant regulations (The State Council, 2021).
These policies highlight that major energy-consuming, large-scale, and high-total-carbon-emission enterprises should be subjected to strict carbon emission control. On the other hand, other enterprises are only restricted by energy consumption limit access values for projects under construction. According to the findings of this study, the carbon efficiency of large and medium-sized enterprises tends to be higher than that of small and micro-sized enterprises. As a result of these policies, large- and medium-sized enterprises with high carbon efficiency are reducing their production scale in order to meet carbon reduction targets. On the other hand, small and micro-sized enterprises with low carbon efficiency are expanding their production scale since they are not directly constrained by responsibility evaluation and assessment of carbon emission reduction targets. Eventually, output flows from large- and medium-sized enterprises with high carbon efficiency to small- and micro-sized enterprises with low carbon efficiency, which lowers China’s overall carbon efficiency. This is in contrast to the initial objective of the policy.
Furthermore, during the actual implementation of the policy, enterprises are evaluated for their responsibility based on their achievement of overall carbon emission reduction targets and their progress in reducing cumulative carbon emissions. This simply evaluates the total carbon emissions of enterprises, without considering the heterogeneity of their actual potential for reducing emissions (Price et al., 2010; Zhao and Wu, 2016). As a result, certain enterprises with advanced emission reduction technology but limited potential for further reduction are burdened with unreasonable emission reduction targets. This forces these enterprises to fulfill their emission reduction responsibilities, even if it means reducing the size of their operations. It transfers output to smaller-scale enterprises with lower carbon emissions. This is likely to lower China’s overall carbon efficiency, which is inconsistent with China’s “double carbon” goal.
6.3.3 Emission reduction policies related to provincial difference
“Work plan of controlling greenhouse gas emissions during ‘13th Five-Year Plan’ period” adopted provincial target decomposition to allocate carbon emission reduction tasks during 2016–2020 period: the carbon emission intensity of Beijing, Tianjin, Hebei, Shanghai, Jiangsu, Zhejiang, Shandong, and Guangdong should be decreased by 20.5%, respectively, Fujian, Jiangxi, Henan, Hubei, Chongqing, and Sichuan should be decreased by 19.5%, respectively, and Shanxi, Liaoning, Jilin, Anhui, Hunan, Guizhou, Yunan, Shaanxi should be decreased by 18%, Inner Mongolia, Heilongjiang, Guangxi, Gansu, Ningxia decreased by 17%, respectively, Hainan, Tibet, Qinghai, and Xinjiang decreased by 12%, respectively (The State Council, 2016). According to the “Issuance of the Comprehensive Work Plan for Energy Conservation and Emission Reduction During the ‘14th Five-Year Plan’ Period” (The State Council, 2022), the aforementioned task of reducing carbon emissions will continue from 2021 to 2025. The provincial carbon emission control target is established based on the development stage, resource endowment, strategic positioning, and ecological and environmental aspects of each province. Each province also carried out goal decomposition at the local level, in addition to the provincial level decomposition. Henan Province, for instance, has set goals for controlling carbon emission intensity for cities and counties during the period of 2021–2025. The goals include a 20% reduction in carbon intensity for the following cities: Zhengzhou, Gongyi, Luoyang, Pingdingshan, Anyang, Hebi, Jiaozuo, and Sanmenxia. Additionally, there are goals of reducing carbon intensity by 19% for Kaifeng City, Ruzhou City, Xinxiang City, and Puyang City, and by 18% for Lankao City, Sli County, and Luohe City, respectively (Development of Ecology and Environment of Henan of China, 2023).
In terms of tasks to reduce carbon intensity, the developed eastern region has a higher intensity, while the underdeveloped western regions such as Tibet, Qinghai, and Xinjiang have a lower intensity. This could lead to the westward migration of eastern enterprises as well as carbon leakage from developed to underdeveloped regions (Wang and Chen, 2019). According to the findings of this study, the carbon efficiency of the western region is lower than that of the eastern region. From a sub-regional perspective, the westward migration of eastern enterprises can have multiple benefits. It can not only help fulfill emission reduction obligations in the east but also potentially improve carbon efficiency in the west. On a national level, however, these eastern enterprises have not increased their carbon efficiency by deploying advanced emission reduction equipment or developing energy-saving technologies. Instead, they have only managed to meet the regional carbon intensity reduction target through regional migration. The national carbon efficiency has not been improved, and it has actually increased the social and economic costs associated with enterprise migration.
7 Conclusion and policy implications
7.1 Conclusion
To provide a foundation for designing carbon peaking and neutral policies in China, we conducted a study to measure the carbon efficiency and heterogeneity of Chinese industrial enterprises. We analyzed a panel of 602,470 enterprise-year observations and identified the driving factors that contribute to the heterogeneity of enterprise carbon efficiency. These factors include enterprise scale, enterprise growth stage, industry differences, and regional differences. We empirically tested the effects of these factors on enterprise carbon efficiency and its heterogeneity at both industry and regional levels by constructing multiple fixed effect models. Additionally, we quantified the degree of contribution of each factor to carbon efficiency using the Shapley value decomposition method. Finally, we evaluated China’s emission reduction policies from the perspective of enterprise carbon efficiency heterogeneity. The following are the key conclusions.
(1) There are significant differences in inter-enterprise carbon efficiency, with a partial leading trend and an overall lagging trend. The variance in inter-enterprise carbon efficiency within China’s six major high-energy-consumption industries and major energy provinces is higher than the industry and province averages. The top 25% of enterprises in eastern Chinese provinces are primarily responsible for the provinces’ high levels of carbon efficiency, while the remaining 75% of enterprises exhibit generally low levels of carbon efficiency, thus demonstrating the traditional “partial leading, overall lagging” phenomenon. For the purpose of improving carbon efficiency, it is crucial to either eliminate low-carbon inefficient enterprises from the market to optimize resource allocation among businesses or to encourage them to upgrade their energy-saving and emission-reducing technology. Furthermore, the transition to a greener industrial structure and the optimization of resource distribution across provinces can significantly improve China’s carbon efficiency.
(2) The most significant factors influencing differences in inter-enterprise carbon efficiency are industry variations, enterprise scale, and regional disparities. Enterprise scale has a significant inverted “U” shape effect on enterprise carbon efficiency, with industry and regional heterogeneity determining the extent of the effect. Industry differences, enterprise scale, and regional variations each contribute, on average, 28%, 12%, and 4% respectively to an enterprise’s carbon efficiency. The key to achieving peak carbon neutrality is not only to increase the level of emission reduction in enterprises but also to focus on energy savings. This is because, when considering industry differences, variations in carbon efficiency among industries are primarily influenced by differences in energy consumption per unit in different sectors. A moderately competitive market environment, rather than high or low levels of market competition, is more conducive to driving enterprises to improve carbon efficiency. This is based on the heterogeneity of industries with different market structures. The scale of an enterprise has a significant impact on its effectiveness in reducing carbon emissions. Moreover, this effect has a greater impact in the eastern region due to its relatively higher market development, higher degree of environmental regulation, and deeper penetration of the carbon market. However, when production scale increases beyond the optimum level, improvements in carbon efficiency will be hindered. The differences in levels of economic development, production factor endowment, and energy prices among provinces are the key factors behind variations in enterprise carbon efficiency (Kong and Li, 2017; Jiang and Lu, 2023).
(3) Current carbon reduction policies typically use approaches that involve setting carbon emissions reduction targets. As a result, large-scale enterprises and regions with high carbon efficiency often bear the responsibility of achieving greater carbon emission reductions. This can lead to a transfer of output from high-carbon efficiency enterprises or regions to low-carbon ones. At the enterprise level, current emission reduction policies impose stricter constraints on energy intensity and carbon intensity for enterprises with large production scales and high total carbon emissions. At the industry level, industries that consume high amounts of energy, such as iron and steel, nonferrous metals, building materials, petrochemicals, and chemicals, are primarily undertaken by enterprises in the top 30% of enterprise carbon efficiency. At the provincial level, compared to provinces in the western region, Jiangsu, Zhejiang, Guangdong, and other eastern provinces have a larger responsibility for emission reduction tasks. Carbon efficiency heterogeneity across production scales, regions, and drivers indicates that regions and enterprises with higher carbon efficiency should undertake more emission reduction tasks. To accomplish the carbon reduction goals, the output will be shifted from large enterprises with high carbon efficiency to small enterprises with low carbon efficiency, leading to the “westward migration” of high energy consumption enterprises. It can reduce national carbon efficiency and impede China’s goal of achieving carbon neutrality.
7.2 Policy implications
According to the study’s conclusions, the government should consider the potential impact of variations in enterprise carbon efficiency when formulating future carbon neutral policies for carbon peaking. This is especially important in policy formulation related to production scale, regional trends, and industry trends. The specific suggestions to consider include the following three aspects.
(1) Increase the utilization of economic regulatory tools while reducing direct control over overall emission reduction targets. The regions and enterprises that undertook more emission reduction tasks were precisely the more carbon-efficient regions and enterprises in the past. This was because emission reduction policies frequently included direct control of overall emission reduction targets and the decomposition of targets at provincial, municipal, and enterprise levels. It suggests that production can be transferred from large, high-carbon-efficiency firms to small, low-carbon-efficiency ones. Additionally, high-energy-consumption enterprises can relocate to China’s western regions. This reflects that the government lacks the necessary knowledge to ensure that the results of target decomposition are compatible with those based on carbon efficiency levels, which highlights the challenges of current programs. Therefore, future emission reduction policies should focus on enhancing the use of economic regulation mechanisms, reducing reliance on direct aggregate goal control, and avoiding artificial target decomposition at all levels. We will address the external costs of carbon emissions by ensuring that enterprises with low carbon efficiency bear additional costs. We will also guide the allocation of output towards enterprises and regions with high carbon efficiency through enhancements to the national unified market for energy factors. This will involve improving the carbon trading market, implementing carbon and resource taxes in a suitable manner, and developing favorable tax and credit policies to encourage the purchase of energy-saving and emission-reducing equipment. We can enhance China’s overall carbon efficiency by utilizing the power of the market to direct the allocation of resources towards enterprises and regions with high carbon efficiency. Additionally, this would save on expenses and potential dangers associated with regulating and setting targets.
(2) Differentiated carbon emission reduction policies should be developed at the provincial, industry, and enterprise levels in response to the heterogeneity of enterprise carbon efficiency and the impact of production scale heterogeneity. If it is not feasible to avoid establishing carbon emission reduction targets when formulating carbon emission reduction policies at the provincial, industry, and enterprise levels, it should be permissible for provinces, industries, and enterprises with lower carbon efficiency to assume greater carbon emission reduction responsibilities. This would compel enterprises and regions with low carbon efficiency to decrease their market shares and encourage the transfer of output to enterprises, regions, and industries with higher carbon efficiency. In addition, since the impact of carbon reduction policies varies significantly across industries and regions (as shown in Table 7; Table 9), the primary focus should be on promoting enterprise consolidation and restructuring in energy-consuming industries, competitive industries, and heavy industries, particularly in eastern regions. This approach will maximize the benefits of scale economies and carbon efficiency enhancements, while also ensuring inclusivity.
(3) Improve the national market exit mechanism, particularly by developing a nationwide uniform standard for enterprises’ carbon intensity. China’s market exit system is currently not ideal. While some regions have developed varying standards for market exit based on carbon intensity, others have not yet established their own. These differences create the necessary conditions for carbon-inefficient enterprises to relocate to areas with lower carbon efficiency. Therefore, in order to encourage the exit of low carbon efficiency enterprises from the market and facilitate the merger and reorganization of high carbon efficiency enterprises towards low carbon efficiency, the government should further improve the market exit mechanism by developing a nationwide uniform standard for carbon intensity of enterprises.
Data availability statement
The original contributions presented in the study are included in the article/Supplementary Material, further inquiries can be directed to the corresponding author.
Author contributions
QY: Writing–original draft, Writing–review and editing. ZY: Writing–original draft, Writing–review and editing. WZ: Writing–original draft. SZ: Conceptualization, Funding acquisition, Resources, Writing–review and editing. DW: Conceptualization, Project administration, Resources, Writing–review and editing. RM: Writing–review and editing.
Funding
The author(s) declare financial support was received for the research, authorship, and/or publication of this article. This research was funded by Natural Science Foundation of China (No. 72004181; 72374196; 71874187; 72074210), Humanities and Social Science Fund of Ministry of Education of China (No. 20YJC630190), Philosophy and Social Science Research Project of Shaanxi in 2023 (No. 2023ZD1047), Innovation Capability Support Program of Shaanxi (No. 2021KRM009), and National Social Science Foundation of China (No. 19BGL183).
Acknowledgments
We thank all the participants and all the researchers and collaborators who participated in this study.
Conflict of interest
The authors declare that the research was conducted in the absence of any commercial or financial relationships that could be construed as a potential conflict of interest.
The author(s) declared that they were an editorial board member of Frontiers, at the time of submission. This had no impact on the peer review process and the final decision.
Publisher’s note
All claims expressed in this article are solely those of the authors and do not necessarily represent those of their affiliated organizations, or those of the publisher, the editors and the reviewers. Any product that may be evaluated in this article, or claim that may be made by its manufacturer, is not guaranteed or endorsed by the publisher.
References
Antonakakis, N., Chatziantoniou, I., and Filis, G. (2017). Energy consumption, CO 2 emissions, and economic growth: an ethical dilemma. Renew. Sustain. Energy Rev. 68, 808–824. doi:10.1016/j.rser.2016.09.105
Azam, M. (2016). Does environmental degradation shackle economic growth? A panel data investigation on 11 Asian countries. Elsevier: Renewable and Sustainable Energy Reviews, 175–182. [online] 65. doi:10.1016/j.rser.2016.06.087
Chen, K., and Zhan, Z. (2019). Economies of scale, agglomeration effect and changes of total factor productivity in high-tech industries. Mod. Econ. doi:10.13891/j.cnki.mer.2019.12.014
Chen, L., and Hu, C. (2015). A study on economies of scale in Listed retail enterprises in China: an empirical analysis based on translog-cost function. Finance Res. 26. doi:10.19337/j.cnki.34-1093/f.2015.06.009
Chen, L., Xiao, Q., and Niu, Z. (2020). Enterprise cost function model considering environmental governance cost and its application. J. Quant. Tech. Econ. 37, 139–156. doi:10.13653/j.cnki.jqte.2020.11.008
Chen, L., Zhai, Y., Zhou, L., and Cheng, A. (2019). Scale efficiency of M&A behavior of listed companies: from the perspective of financial system reform and serving real economy efficiency. Res. Financial Econ. 34.
Chen, S., Xu, J., and Zhang, R. (2016). Evaluation of the implementation effect of low-carbon policies in Anhui Province. Urban J. 37, 56–60. doi:10.3969/j.issn.2096-059X.2016.03.012
Chen, Z., and Chen, Q. (2019). Energy use efficiency of Chinese firms: heterogeneity, influencing factors and policy implications. China's industrial economy. doi:10.19581/j.cnki.ciejournal.2019.12.005
Cheng, Z., Li, L., and Liu, J. (2018). Industrial structure, technical progress and carbon intensity in China’s provinces. Renew. Sustain. Energy Rev. 81, 2935–2946. doi:10.1016/j.rser.2017.06.103
Chuai, X., and Feng, J. (2019). High resolution carbon emissions simulation and spatial heterogeneity analysis based on big data in Nanjing City, China. Sci. Total Environ. 686, 828–837. doi:10.1016/j.scitotenv.2019.05.138
Dai, H., Su, Yi., Liu, J., Gu, D., Kuang, L., and Zou, C. (2022). Strategic thinking on China's energy development under the goal of carbon neutrality. Pet. Technol. Forum 41.
Development of Ecology and Environment of Henan of China (2023). The goal carbon dioxide emissions per unit of GDP during the “14th Five-Year”. https://sthjt.henan.gov.cn/2023/01-04/2666713.html (Accessed January 28, 2023).
Dong, K., Sun, R., Jiang, H., and Zeng, X. (2018). CO2 emissions, economic growth, and the environmental Kuznets curve in China: what roles can nuclear energy and renewable energy play? J. Clean. Prod. 196, 51–63. doi:10.1016/j.jclepro.2018.05.271
Dong, X., and Yuan, Y. (2014). Firm innovation, life cycle and agglomeration economies. China Econ. Q. 13, 767–792. doi:10.13821/j.cnki.ceq.2014.02.014
Fujii, H., and Managi, S. (2013). Which industry is greener? An empirical study of nine industries in OECD countries. Energy Policy 57, 381–388. doi:10.1016/j.enpol.2013.02.011
Gao, H., and Wang, J. 2019. Evaluation of sewage right policy based on hierarchical analysis and fuzzy comprehensive evaluation--Taking Gansu Province as an example. Gansu fusion, (10):58–63.
Gao, Z., Li, L., and Hao, Y. (2023). Dynamic evolution and driving forces of carbon emission efficiency in China: new evidence based on the RBM-ML model. Gondwana Res. 116, 25–39. doi:10.1016/j.gr.2022.12.013
Guan, Y., Li, P., and Jiao, Yu. (2018). Property rights nature, haze pollution level and low carbon performance level of enterprises. Jiangsu Soc. Sci. 296 (01), 85–94. doi:10.13858/j.cnki.cn32-1312/c.2018.01.012
Huang, J. (2018). Investigating the driving forces of China’s carbon intensity based on a dynamic spatial model. Environ. Sci. Pollut. Res. 25 (22), 21833–21843. doi:10.1007/s11356-018-2307-5
Huang, X. (2018). Assessment of environmental and economic effects of carbon trading in China[D]. Xiamen: Xiamen University.
Ji, T., Deng, H., and Zhang, T. (2023). Impact of producer services agglomeration on carbon emission efficiency: an analysis based on the data of enterprises in 108 cities of the Yangtze River Economic Belt. Resour. Sci. 45 (1), 31–47. doi:10.18402/resci.2023.01.03
Jiang, B., and Raza, M. Y. (2023). Research on China's renewable energy policies under the dual carbon goals: a political discourse analysis. Energy Strategy Rev. 48, 101118. doi:10.1016/j.esr.2023.101118
Jiang, S., and Lu, C. (2023). Study on the multi-path and threshold model of environmental regulation on carbon efficiency. Tech. Econ. 42.
Jiang, Y., Luo, T., Wu, Z., and Xue, X. (2021). The driving factors in the corporate proactivity of carbon emissions abatement: empirical evidence from China. J. Clean. Prod. 288, 125549. doi:10.1016/j.jclepro.2020.125549
Kong, L., and Li, H. (2017). Characteristics of regional pollution industry transfer under environmental regulation. Contemp. Econ. Manag. 39. doi:10.13253/j.cnki.ddjjgl.2017.05.011
Kong, Y. (2021). A comparative study of industrial competitiveness between China and the United States based on firm heterogeneity. Macroecon. Res. doi:10.16304/j.cnki.11-3952/f.2021.09.014
Li, G., Jin, Y., and Gao, X. (2023). Digital transformation and pollution emission of enterprises: evidence from China’s micro-enterprises. Energy Rep. 9, 552–567. doi:10.1016/j.egyr.2022.11.169
Li, H., Liu, L., and Wang, R. (2016). Regional enterprise heterogeneity characteristics, energy saving and emission reduction and carbon emission intensity - a study based on panel data of Chinese provincial and municipal industrial enterprises[J]. Nanjing: Journal of Nanjing Audit University 13 (04), 43–51.
Liang, W., and Yang, M. (2019). Urbanization, economic growth and environmental pollution: evidence from China. Sustain. Comput. Inf. Syst. 21, 1–9. [online] 21. doi:10.1016/j.suscom.2018.11.007
Lin, B., and Du, K. (2015). Modeling the dynamics of carbon emission performance in China: a parametric Malmquist index approach. Energy Econ. 49, 550–557. doi:10.1016/j.eneco.2015.03.028
Lin, B., Wang, X., and Du, Z. (2021). The impact of environmental regulation on China's industrial energy efficiency: an empirical study based on microenterprise data[J]. J. Xiamen Univ. (Philosophy Soc. Sci.,(04):30–42.
Lin, B., Zhu, R., and Raza, M. Y. (2022). Fuel substitution and environmental sustainability in India: perspectives of technical progress. Energy 261, 125309. doi:10.1016/j.energy.2022.125309
Liu, J., Wei, D., Wu, L., Yang, H., and Song, X. (2022). Synergy and heterogeneity of driving factors of carbon emissions in China's energy-intensive industries. Ecol. Indic. 142, 109161. doi:10.1016/j.ecolind.2022.109161
Liu, Y., Huang, C., and Chao, A. (2017). Empirical study on estimating the Chinese steel industry's market power and its scale economy-based on the perspective of Imperfect labor market[J]. Contemp. Econ. Sci.,39(01):43–54+125-126.
Liu, Y., Zeng, X., and Liu, J. (2015). Polluted industries transfer, regional environmental damage and management policy design. Econ. Geogr.,35(06):87–95. doi:10.15957/j.cnki.jjdl.2015.06.012
Long, R., Shao, T., and Chen, H. (2016). Spatial econometric analysis of China’s province-level industrial carbon productivity and its influencing factors. Appl. Energy 166, 210–219. doi:10.1016/j.apenergy.2015.09.100
Ma, D., and Sun, H. (2023). Low-carbon city pilot policy and strategic emerging enterprise growth: based on the empirical research of a-share listed companies. East China Econ. Manag. 37, 84–94. doi:10.19629/j.cnki.34-1014/f.220213004
Ministry of Ecology and Environment (2022). Development and reform commission, Ministry of industry and information technology, Ministry of housing and urban-rural development, Ministry of Transport, Ministry of agriculture and rural Affairs, energy Bureau, Notice on printing and distributing the implementation plan for pollution reduction and carbon reduction synergy, environmental general. No. 42 Available at: https://www.gov.cn/zhengce/zhengceku/2022-06/17/content_5696364.htm.
Mohammadi, A., Rafiee, S., Jafari, A., Keyhani, A., Mousavi-Avval, S. H., and Nonhebel, S. (2014). Energy use efficiency and greenhouse gas emissions of farming systems in north Iran. Renew. Sustain. Energy Rev. 30, 724–733. doi:10.1016/j.rser.2013.11.012
Özbuğday, F. C., and Erbas, B. C. (2015). How effective are energy efficiency and renewable energy in curbing CO2 emissions in the long run? A heterogeneous panel data analysis. Energy 82, 734–745. doi:10.1016/j.energy.2015.01.084
Pan, X., Peng, X., and Li, B. (2017). Market distortion, technological progress and energy efficiency: policy choices based on interprovincial heterogeneity. World Econ., 40(01):91–115. doi:10.19985/j.cnki.cassjwe.2017.01.006
Price, L., Wang, X., and Yun, J. (2010). The challenge of reducing energy consumption of the Top-1000 largest industrial enterprises in China. Energy Policy 38 (11), 6485–6498. doi:10.1016/j.enpol.2009.02.036
Raza, M. Y., and Lin, B. (2022). Energy efficiency and factor productivity in Pakistan: policy perspectives. Energy 247, 123461. doi:10.1016/j.energy.2022.123461
Raza, M. Y., and Lin, B. (2023). Future outlook and influencing factors analysis of natural gas consumption in Bangladesh: an economic and policy perspectives. Energy Policy 173, 113379. doi:10.1016/j.enpol.2022.113379
Riti, J. S., Song, D., Shu, Y., and Kamah, M. (2017). Decoupling CO2 emission and economic growth in China: is there consistency in estimation results in analyzing environmental Kuznets curve? J. Clean. Prod. 166, 1448–1461. doi:10.1016/j.jclepro.2017.08.117
Shao, C., Guan, Y., Wan, Z., Chu, C., and Ju, M. (2014). Performance analysis of CO2 emissions and energy efficiency of metal industries in China. J. Environ. Manag. 134, 30–38. doi:10.1016/j.jenvman.2013.12.025
Sheng, P., Li, J., Zhai, M., and Huang, S. (2020). Coupling of economic growth and reduction in carbon emissions at the efficiency level: evidence from China. Energy 213, 118747. doi:10.1016/j.energy.2020.118747
Shorrocks, A. F. (2012). Decomposition procedures for distributional analysis: a unified framework based on the Shapley value. J. Econ. Inequal. 11 (1), 99–126. doi:10.1007/s10888-011-9214-z
Song, D., and Yang, Q. (2019). Does environmental regulation break the resource curse: an empirical analysis based on transnational panel data[J]. China Population-Resources Environ.,29(10):61–69.
Sun, Y. (2021). Study on the effect of "resource curse" and its transmission mechanism on economic growth. Statistics Decis. Mak. 37 (16), 145–148. doi:10.13546/j.cnki.tjyjc.2021.16.033
Guo Fa [2016] No. 61, November 04 The State Council (2016). Notice of the state Council on printing and distributing the work plan for the control of greenhouse gas emissions in the 13th five-year plan. Available at: https://www.gov.cn/zhengce/content/2016-11/04/content_5128619.htm.
Guo Fa [2016] No. 74 The State Council (2017). Notice of the state Council on printing and distributing the "thirteenth five-year plan" comprehensive work plan for energy conservation and emission reduction. Available at: https://www.gov.cn/zhengce/zhengceku/2017-01/05/content_5156789.htm.
Guo Fa [2021] No. 23, October 26 The State Council (2021). Notice of the state Council on printing. Available at: https://www.gov.cn/zhengce/content/2021-10/26/content_5644984.htm?skinTheme=0.2.htm.
Guo Fa [2021] No. 33, January 24 The State Council (2022). Notice of the state Council on printing and distributing the comprehensive work plan for energy conservation and emission reduction of the 14th five-year plan. Available at: https://www.gov.cn/zhengce/content/2022-01/24/content_5670202.htm.
National Bureau of Statistics of China (2023). [online] Available at: http://www.stats.gov.cn/xxgk/jd/sjjd2020/202301/t20230118_1892285.html.
Wang, B., and Li, W. 2012. Measurement and judgment of concentration of Chinese coal industry[J]. Logist. Technol., 31(07):45–47. doi:10.3969/j.issn.1005-152X.2012.04.016
Wang, J., and Yang, J. (2014). Study on the causes of regional carbon emission intensity differences in China - based on the Shapley value decomposition method[J]. Resour. Sci., 36(03):557–566.
Wang, Q., and Jiang, R. (2020). Is carbon emission growth decoupled from economic growth in emerging countries? New insights from labor and investment effects. J. Clean. Prod. 248, 119188. doi:10.1016/j.jclepro.2019.119188
Wang, W., and Chen, Z. (2019). Research on the initial carbon quota allocation scheme of China's provincial-level regions - based on the perspectives of responsibility and target, equity and efficiency. Manag. World, 35 (03): 81–98. doi:10.19744/j.cnki.11-1235/f.2019.0036
Wang, X., and Liu, H. (2009). The practical Considerations of "pollution Refuge hypothesis" in the undeveloped western areas-taking Gansu province as an example. J. Graduate Sch. Chin. Acad. Soc. Sci., No.174(06):52–62.
Wang, X., and Wang, Q. (2023). The impact of industrial synergy on regional economic growth: from the perspective of scale effect and congestion effect. Econ. Rev. doi:10.19361/j.er.2023.02.04
Wang, X., Wang, S., and Zhang, X. (2023). Heterogeneity and influence factors of carbon productivity: Evidence from Chinese manufacturing enterprises. J. Clean. Prod. 404, 136938. doi:10.1016/j.jclepro.2023.136938
Wei, C., and Zheng, X. Y. (2017). A new perspective on energy efficiency Enhancement: a test based on market segmentation. Soc. Sci. China 10, 90–111+206.
Wei, P. (2017). Research on energy saving and emission reduction policies in China's iron and steel industry [D]. Beijing: North China Electric Power University.
Wu, F., Fan, L. W., Zhou, P., and Zhou, D. Q. (2012). Industrial energy efficiency with CO2 emissions in China: a nonparametric analysis. Elsevier: Energy Policy, 164–172. [online] 49. doi:10.1016/j.enpol.2012.05.035
Wu, X., and Ai, X. (2022). Decision-making and Coordination of low-carbon supply chain under producer Diseconomies of scale. Sci. Technol. Manag. Res. 42.
Xie, F. (2020). Influencing factors of enterprise Soft Budget constraints. Res. Finance Econ. 437 (04), 93–101. doi:10.19654/j.cnki.cjwtyj.2020.04.011
Xie, P., Gong, N., Sun, F., Li, P., and Pan, X. (2023a). What factors contribute to the extent of decoupling economic growth and energy carbon emissions in China? Energy Policy 173, 113416. doi:10.1016/j.enpol.2023.113416
Xie, Q., Ma, D., Raza, M. Y., Tang, S., and Bai, D. (2023b). Toward carbon peaking and neutralization: the heterogeneous stochastic convergence of CO2 emissions and the role of digital inclusive finance. Energy Econ. 125, 106841. doi:10.1016/j.eneco.2023.106841
Yin, Z., Lei, M., and Yu, X. (2014). Energyand environment efficiency of China's iron and steel industry: based on the enterprise-level data. China Manag. Sci. 22 (S1), 691–697. doi:10.16381/j.cnki.issn1003-207x.2014.s1.006
Zhang, F., Deng, X., Phillips, F., Fang, C., and Wang, C. (2020). Impacts of industrial structure and technical progress on carbon emission intensity: evidence from 281 cities in China. Technol. Forecast. Soc. Change 154, 119949. doi:10.1016/j.techfore.2020.119949
Zhang, H. (2022). Resource curse, factor mobility and coordinated economic development[J]. Statistics Decis. Mak.,38(24):93–96. doi:10.13546/j.cnki.tjyjc.2022.24.018
Zhang, H., Hewings, G. J. D., and Zheng, X. (2019). The effects of carbon taxation in China: an analysis based on energy input-output model in hybrid units. Energy Policy 128, 223–234. doi:10.1016/j.enpol.2018.12.045
Zhang, J., Wang, Z., Tang, L., and Yu, L. (2016). Research on the impact of Beijing-Tianjin-Hebei carbon emissions trading policy based on system dynamics [J]. China Manag. Sci. 24(03), 1–8. doi:10.16381/j.cnki.issn1003-207x.2016.03.001
Zhao, L., and Tang, J. (2018). Quantitative evaluation of China's carbon emission reduction policies[J]. Beijing: China Science and Technology Forum, 116–122. doi:10.13580/j.cnki.fstc.2018.01.016
Zhao, X., and Wu, L. (2016). Interpreting the evolution of the energy-saving target allocation system in China (2006–13): a view of policy learning. World Dev. 82, 83–94. doi:10.1016/j.worlddev.2016.01.014
Zheng, D., Zhou, Q., and Yang, W. 2022. Technological innovation capability and Export trade along the “belt and Road”: influence of market development capability and enterprise age[J]. Manag. Rev., 34(2): 154–165. doi:10.14120/j.cnki.cn11-5057/f.2022.02.008
Zhi, H., Ni, L., and Zhu, D. (2022). The impact of emission trading system on clean energy consumption of enterprises: evidence from a quasi-natural experiment in China. J. Environ. Manag. 318 (0301-4797), 115613. doi:10.1016/j.jenvman.2022.115613
Zhou, N., Khanna, N., Feng, W., Ke, J., and Levine, M. (2018). Scenarios of energy efficiency and CO2 emissions reduction potential in the buildings sector in China to year 2050. Nat. Energy 3 (11), 978–984. doi:10.1038/s41560-018-0253-6
Zhou, Z., Dong, Z., Zeng, H., and Xiao, Y. (2019). Differences of enterprise carbon efficiency and its influencing factors: evidence from companies listed S&P500[J]. Manag. Rev.,31(03):27–38. doi:10.14120/j.cnki.cn11-5057/f.2019.03.003
Keywords: carbon efficiency, enterprise heterogeneity, driving factor, policy evaluation, Shapley value decomposition
Citation: Yang Q, Yang Z, Zhao W, Zou S, Wang D and Ma R (2023) The driving factors and policy evaluation of China’s carbon efficiency from the perspective of the enterprise heterogeneity. Front. Energy Res. 11:1276831. doi: 10.3389/fenrg.2023.1276831
Received: 13 August 2023; Accepted: 15 November 2023;
Published: 30 November 2023.
Edited by:
Maria Cristina Piccirilli, University of Florence, ItalyReviewed by:
Ibrahim Cutcu, Hasan Kalyoncu University, TürkiyeMuhammad Yousaf Raza, Shandong Institute of Business and Technology, China
Copyright © 2023 Yang, Yang, Zhao, Zou, Wang and Ma. This is an open-access article distributed under the terms of the Creative Commons Attribution License (CC BY). The use, distribution or reproduction in other forums is permitted, provided the original author(s) and the copyright owner(s) are credited and that the original publication in this journal is cited, in accordance with accepted academic practice. No use, distribution or reproduction is permitted which does not comply with these terms.
*Correspondence: Qing Yang, MTg3NjE0MjE2MDZAMTYzLmNvbQ==