 Dou An
 Yuquan Li2*
 Xixiang Lin
 Shiyang Teng
- 1Faculty of Electronics and Information Engineering, Xi’an Jiaotong University, Xi’an, China
- 2Key Laboratory of Thermo-Fluid Science and Engineering of Ministry of Education, School of Energy and Power Engineering, Xi’an Jiaotong University, Xi’an, China
- 3School of Future Technology, Xi’an Jiaotong University, Xi’an, China
Compressed Air Energy Storage (CAES) technology has risen as a promising approach to effectively store renewable energy. Optimizing the efficient cascading utilization of multi-grade heat can greatly improve the efficiency and overall system performance. Particularly, the number of compressor and expander stages is a critical factor in determining the system’s performance. In this study, we focused on the Advanced Adiabatic Compressed Air Energy Storage system with Combined Heat and Power (AA-CAES -CHP). Both economic and thermodynamic models were established for the AA-CAES-CHP system. To systematically study the effects of compression and expansion stages, the influence of 3 different compressor stages and expander stages was comprehensively analyzed under 4 operating conditions. Key findings reveal that the count of compressor and expander stages have a notable impact on the exergy losses of the AA-CAES-CHP system. As for the investment cost, the proportion of investment cost for expanders decreases when the stage numbers of compressors and expanders are the same. Furthermore, both thermodynamic and economic characteristics allow us to optimize the AA-CAES-CHP system’s performance. One of our cases demonstrates that doubling the air mass flow rate results in a doubled total energy output with a relatively modest increase (41.1%–65.1%) in the total investment cost.
1 Introduction
The continuous development of society and the economy heavily relies on the fossil energy. However, the crude exploitation and use of fossil fuel s have led to various issues. The maturity of renewable energy industry has accelerated the installed capacity of wind and solar energy. However, renewable energy production still faces multiple drawbacks such as intermittency and fluctuations. The substantial influx of unstable energy into the grid can lead to power fluctuations and potential safety hazards. Efficient energy storage technology has now become a crucial solution for the power grid to accommodate renewable energy. Energy storage facilities are crucial for peak-load management and grid stability. Energy storage has evolved into a crucial element of the energy infrastructure and promotes renewable energy in turn. Overall, the accommodation of renewable energy through efficient energy storage technology gives a significant boost to the power industry.
Energy storage technology can be categorized into the following five main methods: mechanical, electrochemical, electrical, thermal, and chemical energy storage (Akinyele and Rayudu, 2014). Among these methods, mechanical energy storage comprises pumped storage, compressed air energy storage (CAES), and flywheel energy storage, offering distinct advantages. Compared with others, CAES systems have several benefits: When contrasted with pumped storage, the CAES system offers greater scalability, locational flexibility and capacity for centralized storage. Compared with electrochemical energy storage, CAES can provide longer and safer service and achieve higher energy storage density. Moreover, compared with chemical energy storage, CAES is suitable for multiple applications. Currently, several megawatt-level new CAES projects have been conducted and completed (Wang et al., 2016).
CAES systems can be categorized into types, notably the traditional CAES, adiabatic CAES (A-CAES), advanced adiabatic CAES (AA-CAES), liquid air energy storage, and supercritical CAES. The Huntorf power facility stands as the first A-CAES power station and marked a significant milestone in the CAES technology. The high-pressure air flows into the combustion chamber and subsequently drives the turbine, obtaining an operational efficiency of 42% (Tong et al., 2021). However, traditional CAES with combustion chambers face significant energy loss and environmental harm due to the essence of thermal power. To address these issues, the AA-CAES system has emerged. This system introduces inter-stage heat exchange during multi-stage compression, reducing the loads and energy consumption of the compressors. Moreover, it can efficiently collect heat effectively during compression and leverages this heat to preheat the air before expansion. In summary, AA-CAES offers notable advantages, including high energy conversion efficiency, relatively low cost, and significant development potential compared to traditional CAES systems.
Studies on AA-CAES systems primarily focus on enhancing cycle efficiency and energy storage density. First, because of its scalability, studies have combined CAES with a variety of renewable energy sources, such as solar and wind power, biomass energy and chemical energy. Han et al. (2020) proposed an AA-CAES system with concentrating solar power (CSP). The AA-CAES-CSP system achieved a 9% increase in storage efficiency and a nearly 2% increase in coupled storage efficiency. The design of both the solar heating subsystem and regenerative subsystem affected system performance. (Li et al. (2021) introduced a cogeneration system model that integrates AA-CAES with solar auxiliary heating, presenting five different heat distribution configurations (100%, 75%, 50%, 25%, 0%). The study found that smaller heat distribution ratios lead to higher exergy efficiency, while larger ratios increase energy storage density. Bu et al. (2022) designed an AA-CAES-SAH-ORC system for cascade energy utilization, rearranging the solar auxiliary heat (SAH), and using exhaust air as the organic Rankine cycle (ORC). Heat source. Optimal operating parameters are studied, achieving maximum energy efficiency of 64.71% and exergy efficiency of 71.88%. Fu et al. (2023) proposed a 3-stage expansion, 2-stage high-temperature reheat photothermal-assisted AA-CAES system. Optimal performance was achieved at 10 MPa and 4 MPa pressures. When the solar irradiance is below 690, 660, and 600 W/m2, the output power, exergy efficiency, and energy storage density are improved by 44.3 kWh, 2.03%, and 0.15 kWh/m3. Diyoke and Wu (2020) presented a thermodynamic analysis of a hybrid power system coupled with A-CAES and biomass gasification energy storage for simultaneous electricity and heat production. The system achieved the energy efficiency of approximately 38%, electrical efficiency of 30%, and exergy efficiency of 29%.
Second, in the studies of advanced AA-CAES power cycle, sub-cycles such as ORC, Kalina cycle (KC) and absorption heat pump have been extensively studied. Wang et al. (2020) proposed a novel CH-CAES system integrated with ORC to enhance system capacity. The charge capacity increased by 21.3% and the unit energy density increased by 10.2%. Fu et al. (2021) introduced an innovative AA-CAES system using an ORC with an adjustable pressure ratio. The efficiency is increased up to 70.53%. Compression power consumption is reduced by 12.45% and expander output power is increased by 37.29%. Li et al. (2018) proposed A-CAES coupled with KC for heat recovery. Optimum design achieved 47.17% exergy efficiency. Piri et al. (2023) introduced an innovative A-CAES system with multiple KC, improving power production by 3.38% and round trip exergy (RTE) efficiency by 3.12%, offering a significant enhancement in system performance. Li et al. (2023) introduced an innovative CAES system that utilizes a KC to effectively utilize pre-compression heat, achieving a 2.7% improvement in electrical efficiency. Han et al. (2021) proposed an Integrated Energy System (IES) combining AA-CAES, ORC, and ICE for peak-load regulation and improved performance. The system achieves cascade energy utilization and diversified energy demand, optimizing operation cost, CO2 emissions, and energy consumption by 14.84%, 13.06%, and 11.69%. Bai et al. (2023) introduced a system that combines AA-CAES with a double-effect compression-absorption refrigeration process. Sensitivity analyses are conducted to optimize key parameters, achieving at least 14.97% higher energy efficiency than traditional AA-CAES. Third, in the study of cogeneration CAES systems, Jiajun et al. (2023) proposed three AA-CAES refrigeration systems that can provide cooling, heat, and electricity output, achieving a static payback period of 11.88 years. (Li et al., 2022). established a trigenerative system based on AA-CAES, exploring four modes with different working mediums. Case with air and water has the highest exergy efficiency and energy density. Influences of ambient temperature, cold tank temperature, and heat transfer coefficient on performance are revealed. Optimal exergy efficiency ranged from 42.59% to 53.51%. Bai et al. (2022) proposed a solar-coupled A-CAES system with ejector refrigeration cycles. Analysis and optimization results show significant improvement, including 35.87% RTE, 33.23% exergy efficiency, and a 7.72-year payback period. Cai et al. (2018) proposed integrating a lithium bromide absorption chiller with CAES to improve the performance. Results show that efficiency is influenced by adiabatic efficiency of compressors and refrigerating water temperature difference. Liu et al. (2021) proposed a trigeneration system based on A-CAES with an absorption heat pump, Through the increasing of storage pressure and optimizing thermal oil allocation, the system achieved improved RTE and exergy efficiency by 20.57%–31.69% and 23.64%–30.62%, respectively. Yan and Gao (2022) integrate an A-CAES system with an ejector refrigeration cycle to generate power and cooling. Through comprehensive analyses, the proposed system achieves 35.55% RTE, 33.21% exergy efficiency, and 8.55 years’ payback period. In summary, previous researches have focused on improvement of system performance, such as cycle efficiency and energy storage density of CAES systems, with little research specifically optimizing the efficient cascading utilization of multi-grade heat in the system. In the AA-CAES system, even after heating the high-pressure air, a portion of the compression heat remains underutilized. A large amount of heat in the energy storage system has not been fully utilized.
Studies on AA-CAES also focus on analyzing the effect of components of the CAES system, such as compressors, air storage units, thermal storage units, expanders, etc. Compressors and expanders, as the core components, have been extensively studied. Hartmann et al. (2012) established thermodynamic models for four types of AA-CAES systems and analyzed the compressor in the system. They concluded that employing a two-stage compression leads to higher energy conversion efficiency. Kemble et al. (2012) introduced an AA-CAES system with seven compression stages and six expansion stages. They performed parameter sensitivity analysis and conducted a techno-economic assessment of the system. Wang et al. (2019) introduce the concept of Combined Heat CAES (CH-CAES) to enhance energy storage efficiency. By coupling an electric heater with conventional CAES system, the system partially relies on electrical heating during charging and uses stored heat to boost turbine inlet temperature during discharging. In AA-CAES research, some scholars have explored the impact of the system operating under non-design conditions on its overall performance. Liu et al. (2019) compared the three generations of CAES systems under the same condition. Results reveal that AA-CAES with mediums of oil and water achieves the highest efficiency (63.17% and 58.71%). Han et al. (2020) introduced three operation modes of AA-CAES—sliding pressure, constant sliding, and constant pressure. These three modes achieve the highest energy storage efficiency of 51.48%, the highest thermal efficiency of 94.99%, and the highest energy storage density of 17.60 MJ/m³, respectively. Huang et al. (2021) introduced a novel CAES system, the optimized heat storage medium and exhaust temperature reduced the exhaust energy loss. The design achieved better heat utilization and efficiency compared to conventional constant-pressure ratio designs. Courtois et al. (2021) presented a reformulated cycle efficiency equation for the A-CAES system, clarifying the effect of compressor pressure ratio and discharge temperature on efficiency. Numerical models and external studies have shown strong reliability in the initial sizing of multi-stage A-CAES systems with a discrepancy between −4.1% and +1.0%. Cao et al. (2022) introduced an A-CAES system featuring an ejector integrated into the last-stage compressor to alleviate choke problems during sliding-pressure operations. The backpressure variation is reduced by 39.87%. The proposed system has improved RTE and exergy efficiency compared to constant-pressure operation, with maximum efficiencies reaching 57.94% and 58.32%. Chen et al. (2022) propose a re-compressed A-CAES system with a compressor in the discharging process to raise the operating pressure of the expansion train, resulting in a higher RTE of 69.89% compared to 65.23% for conventional A-CAES. Zhang et al. (2021) introduced an A-CAES system incorporating an inverter-driven compressor, which effectively decreased throttling losses and enhanced the RTE by 1.8%–2.7%. The system also lowers the levelized cost of electricity by 0.57–0.85 cents/kWh. Lv et al. (2022) proposed a isobaric A-CAES with a single-stage compressor and dual-usage expander. The system achieved a RTE of 66.6% and a theoretical energy storage density of 16.5 kWh.m-3 under specific conditions. Jiang et al. (2021) proposed an AA-CAES system that can operate as either a cogeneration or trigeneration system. The optimal design for a cogeneration system with two compression/expansion stages and a trigeneration system with three compression and one expansion stages achieved exergy efficiency of 0.68 and 0.555. Ran et al. (2022) introduced a steam injection A-CAES system, increasing turbine power by 6.63MW, RTE by 3.7%, compression heat utilization efficiency by 9.3%, and exergy RTE by 2.1%. Song et al. (2020) introduced a multi-stage compression and heat recovery system for A-CAES. Results demonstrated a noteworthy enhancement in energy storage efficiency and density through the utilization of constant pressure air storage, with the highest efficiency exceeding 70% using adiabatic design. In summary, researches on compressors and expanders mainly focus on the parameter sensitivity analysis of these components in the system. However, there has been relatively limited research focusing comprehensively on the impact of varying the number of compressor and expander stages on the performance and cost-effectiveness of a system, as well as the influence of different scales on the thermodynamic and economic performance of the system. Particularly, the number of compressor and expander stages is a critical factor in determining both the thermodynamic and economic performance of the system, when viewed from the perspectives of thermodynamics and economics.
Drawing from the aforementioned researches, to systematically study the effects of compression and expansion stages, this study presents an integrated AA-CAES-Combined Heat and Power (AA-CAES-CHP) system, aiming to attain enhanced and comprehensive energy utilization within the AA-CAES framework. Thermodynamic and economic models for the AA-CAES-CHP system are established. The correlation between the quantity of compression and expansion stages in terms of cost and efficacy is examined. The impact of different compressor and expander stages on system is analyzed from both thermodynamic and economic standpoints. This analysis contributes to a deeper comprehension of the interconnected traits of energy conversion concerning the number of compressor and expander stages. The characteristics of energy conversion and economics of the system under different scales and designs are revealed.
2 System design
The AA-CAES-CHP system primarily comprises components including compressors, expanders, heat exchangers (HXs), thermal storage tanks, air storage equipment, cold storage tanks, motors, and generators. The system’s operation involves distinct processes for energy storage and energy release. Figure 1 illustrates the structure of the AA-CAES-CHP system, featuring three-stage compression and expansion. The system operates between three modes: energy storage, energy release, and system halt. During the halt, only the air storage equipment dissipates heat. Therefore, in the analysis of the proposed AA-CAES-CHP system, only the charging and discharging modes are considered. The air storage equipment of this system is based on the previous study (Zhao et al., 2015).
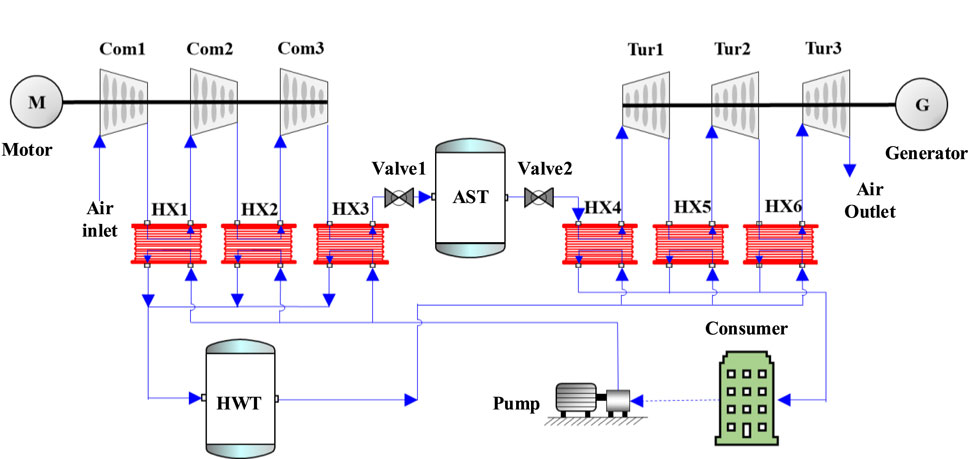
FIGURE 1. Schematic diagram of AA-CAES combined heat and power system.
The energy storage process includes three compressors (Com1, Com2, Com3), intercoolers and aftercooler (HX1, HX2, HX3), an air storage tank (AST), a hot water storage tank (HWT), and pumps. The air enters the compressors and undergoes a three-stage compression. To ensure an optimal design with maximum compression efficiency and minimal power consumption, all three compressors adopt the same compression ratio. Intercoolers are employed to recover the compression heat, thereby reducing energy dissipation and isentropic losses. Water serves as the heat transfer medium to absorb the generated heat. During the energy storage process, extra electricity generated during low-demand periods drives the compressors, transforming some of the electricity into high-pressure air. The heat generated in this process is captured by the water and stored in the HWT. The cooled high-pressure air is then stored in the AST. Overall, in the energy storage stage, surplus electricity is effectively converted into high-pressure air and stored in the AST, while the hot water is stored in the HWT.
The primary objective of the system is to discharge the accumulated electricity and heat during periods of peak demand. This energy discharge process involves the utilization of valves, turbines (Tur1, Tur2, Tur3), and heat exchangers (HX4, HX5, HX6). During the process, the compressed air stored is released from the AST. It then enters HX4 and undergoes heat exchange with hot water, raising its temperature to a specific level. The heated compressed air then enters Tur1 for expansion, followed by sequential paths through HX5, Tur2, HX6, and Tur3, undergoing multiple heating and expansion processes. Ultimately, when the air drops to near-ambient pressure, it is discharged into the environment. Overall, during the discharging phase, the compressed air is heated by the stored heat, and is subsequently utilized to drive the expander for power generation. The hot water then provides heat to the end-users, thus achieving a combined heat and power generation approach.
3 System model
A comprehensive analysis of components in the AA-CAES-CHP system is conducted, including HXs, compressors, expanders, valves, and so on. Mass, energy, and exergy balance analyses are presented. Enthalpy and exergy are calculated at each point. The economic efficiency and characteristics of each component and the whole system are also analyzed.
To simplify the mathematical model and enhance its clarity, the following assumptions are proposed before conducting system performance calculations (Teng and Xi, 2022): 1) The system reaches a steady state in operating. 2) Evaluation is carried out under constant operating conditions, and the time of energy storage and release processes are equal. 3) Heat dissipation and pressure loss in the heat exchangers and pipelines are neglected. 4) No heat transfer between the components or between the system and environment. 5) Phase and state changes in the AST and HWT are neglected.
Table 1 presents the parameters of the system and Table 2 shows the energy balance equations of the components. A regulating valve is utilized to maintain a constant pressure before the expander, ensuring stable and efficient discharging. The simulations in this paper assume the conventional constant-pressure discharging that is employed in existing CAES power plants. As a result, the pressure variations in the AST during the energy release phase are not taken into account (Chen et al., 2022).

TABLE 1. Designed parameters of the system.
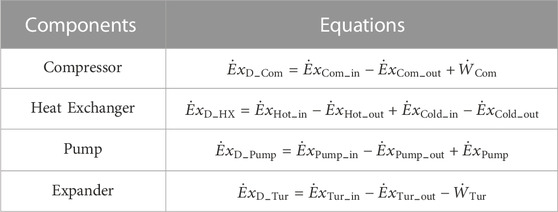
TABLE 2. Exergy balance equations of components.
3.1 Energy model
3.1.1 Compressor
The compressor is one of the key components in the AA-CAES system, and its compression process is considered adiabatic under ideal conditions. The inlet temperature of the
where
The input power of the
where
Therefore, the summed input power is given by:
3.1.2 Heat exchanger
During the energy storage stage, the outlet air temperature of the
where
During the energy release process, the outlet air temperature of the
where
Furthermore, considering the pressure loss when fluid passes through the HX, the pressure loss coefficient is denoted as (Saravanamuttoo et al., 2001):
where
3.1.3 Expander
During the energy release, passing through the inter-stage heat exchanger of the
where
The outlet temperature of the
The summed output power of the energy release process is:
3.1.4 Compressed air storage and hot water tank
Assuming isothermal and isobaric conditions for the AST and HWT, any changes in the state of the storage tank during the energy storage and release processes are not taken into account. As a result, the compressed air must follow the equations (Cao et al., 2022):
where
The water in HWT should satisfy the following equation (Teng and Xi, 2022):
where
3.1.5 Regulating valve
A regulating valve is used to discharge air at a certain pressure. The mass and energy balance equations can be expressed as (Teng and Xi, 2022):
where
3.2 Exergy model
Exergy analysis, based on the principles of the Second Law of Thermodynamics, constitutes a vital analytical approach for enhancing system efficiency. This methodology elucidates both irreversibility and exergy losses intrinsic to system components. Through quantifying exergy losses, main components that accountable for exergy losses can be found, thus establishing the foundation for optimizing system design and operation.
The exergy balance equation of the system can be expressed as:
where
For the exergy of the mass flow in the system, it can be expressed as:
where
3.3 Economic model
Economic efficiency plays a vital role in evaluating the CAES system’s overall effectiveness. The Module Costing Technique (MCT) serves as a common method for calculating investment costs and conducting economic analysis. Costs of each component can be calculated as follows (Xi et al., 2021):
where
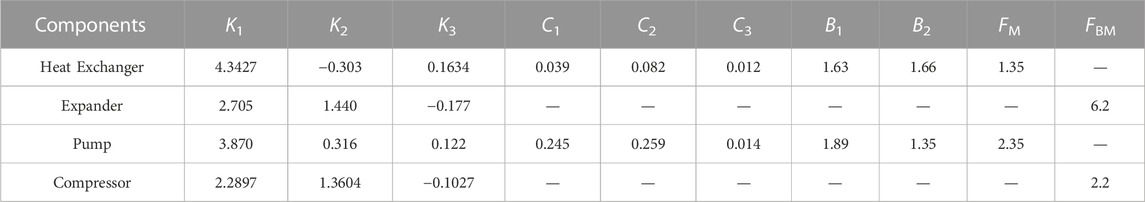
TABLE 3. Coefficients used for cost calculation (Zhang et al., 2018; Xi et al., 2021).
For the HXs, the heat transfer area holds the most crucial parameter to calculate the cost, and can be represented by:
where
where
The overall heat transfer coefficient can be calculated by (Cao et al., 2018):
where
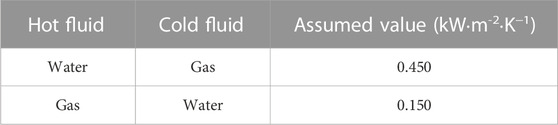
TABLE 4. Assumed values of overall heat transfer coefficients (Ludwig, 1997; Cao et al., 2018).
The cost of the compressor is (Couper et al., 2009):
where
The cost of the expander is (Couper et al., 2009):
where
The Chemical Engineering Plant Cost Index (CEPCI) is used to convert costs into current costs (Yang et al., 2017), and it is calculated by:
where
The total investment cost can be obtained (Xi et al., 2021):
In this paper, the cost of water is considered to be zero. The net annual income (NAI) of the system is calculated by (Xi et al., 2021):
where
moreover,
where
where
where
3.4 Evaluation metrics
The comprehensive evaluation of the system should take the overall thermal characteristics into account. Therefore, cycle (round-trip) efficiency, thermal efficiency, and exergy efficiency are adopted as metrics for the AA-CAES-CHP system. According to the assumptions above, the energy storage time
1) Cycle Efficiency: The efficiency of thermodynamic processes is defined as the ratio of the output useful power to the input. The cyclic efficiency (Courtois et al., 2021; Fu et al., 2021) of a system denotes the ability of the system to generate power by storing and consuming power and the ratio between the generated power and the consumed power over a complete cycle. It demonstrates the system’s capability to produce power for external use. It is computed using the following equation:
where
where
2) Exergy Efficiency: The metric based on the first law of thermodynamics cannot reflect the grade of energy utilization, so the exergy efficiency (Chen et al., 2021; Tian et al., 2023) is defined for analyzing system performance to provide a more detailed and applicable evaluation. The ratio of the exergy output to the exergy input of the system. It is calculated by:
where
3) Dynamic Payback Period (DPP) and Simple Payback Period (SPB): DPP and SPB describe the economics of the system in terms of cost recovery, and can be calculated by (Xi et al., 2021):
where
4 Results and analysis
4.1 Model validation
The proposed model’s validation incorporated publicly available data from simulation cases (Teng and Xi, 2022) and experimental cases (Wang et al., 2016). In this section, the initial parameters used were set to be the same as those provided in the previous studies. By comparing simulation results, differences between the proposed model and the model from the previous studies were analyzed to validate the accuracy. Table 5 presents the model validation results.
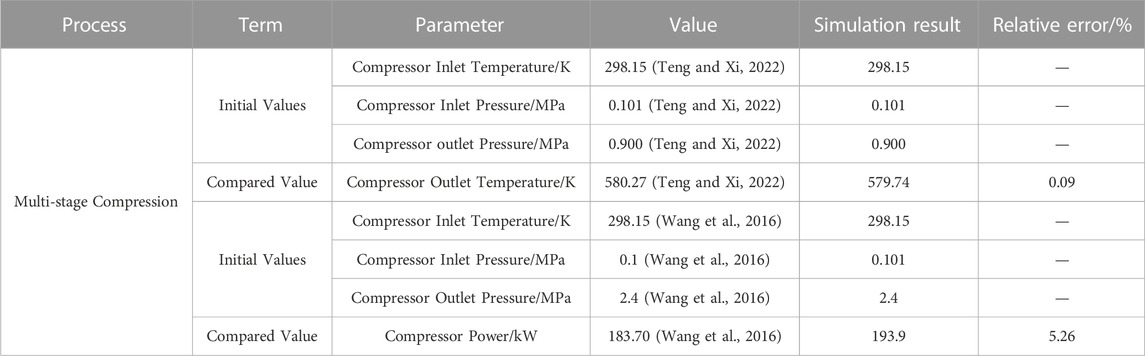
TABLE 5. Comparison between key simulation parameters and literature values.
In comparison with the previous study (Teng and Xi, 2022), the relative error for the compressor outlet temperature compared to the published data is 0.09%. In comparison with study (Wang et al., 2016), the relative error for the compressor power compared to the published data is 5.26%. Thus, the key parameters have relatively small relative errors, indicating the reliability of this model.
4.2 Analysis of compression/expansion stages
The effect of compression/expansion stages on the performance of AA-CAES-CHP systems varies with different scales. Based on the design parameters (Alirahmi et al., 2021), this section investigates the effect of compression/expansion stages with different scales and designs. Four operating conditions are shown in Table 6.
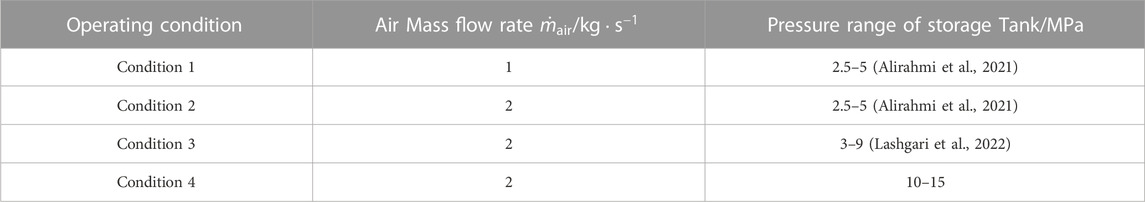
TABLE 6. Operating conditions of different scales in the AA-CAES-CHP system.
MATLAB software is utilized to model the process of the AA-CAES system. In the process of computation, acquiring the thermodynamic characteristics of fluid at a specific point becomes imperative. Hence, the subroutine REFPROP 9.0 is utilized to evaluate the thermodynamic states of each substance.
4.2.1 Condition 1
4.2.1.1 Thermodynamic performance
Figure 2A illustrates the effect of compression and expansion stages (M and N) on exergy losses under Condition 1. The figure demonstrates that when the M remains the same, exergy losses in the compressors and HX of compressors remain constant, regardless of the change in N. This arises from the constant compression ratio of a single-stage compressor, which maintains a stable inlet air to the compressor unit. The compression ratio is determined by the designed range of the pressure in storage tank and the rate of airflow. Consequently, the number of N does not influence the components significantly. The exergy losses in the HX of expanders are highest when N = 3 and decrease as N increases. This trend is a result of the decreasing expansion ratio, leading to higher air temperature at the expander outlet. As a result, except for the first-stage HX, the exergy losses in the HXs decrease, resulting in a gradual reduction of the exergy losses in the HXs of expanders. Moreover, a larger N results in a reduction in the expansion ratio of a single-stage expander, thus resulting in lower exergy losses within the expanders. Additionally, the impact of exergy losses caused by pumps on the system is minimal.
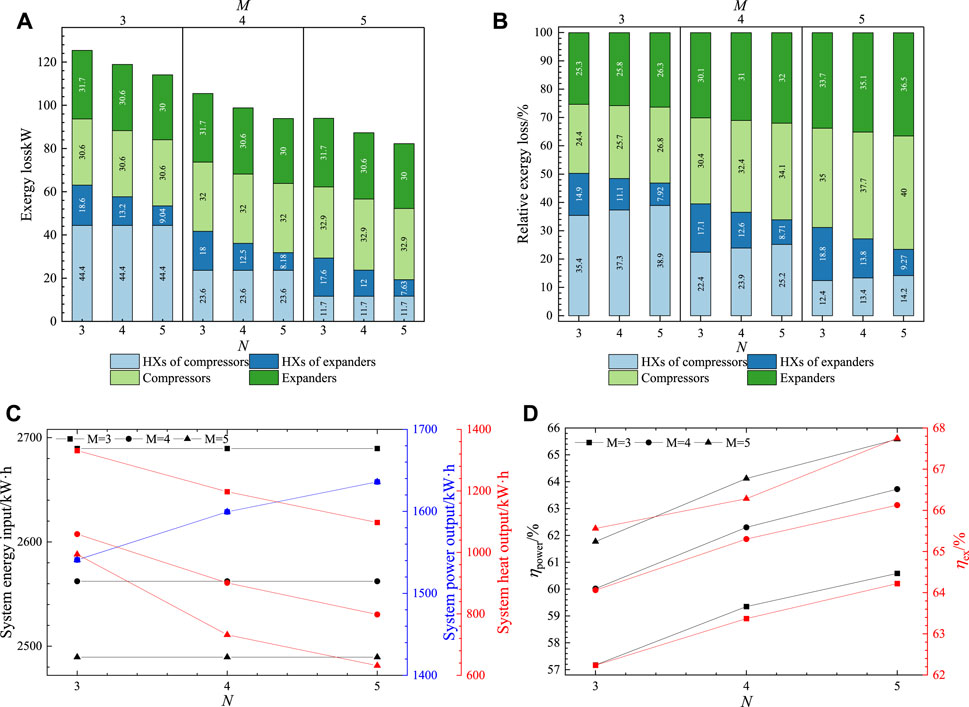
FIGURE 2. Effect of compression/expansion stages under Condition 1 on (A) exergy Losses; (B) relative exergy losses; (C) input and output energy; (D) efficiency.
For the overall system, the exergy losses are highest when N = 3, primarily due to the exergy losses in the HX of expanders. However, by increasing N to 5, the system’s exergy losses are minimized. As M increases from 3 to 5, the exergy losses gradually decrease, primarily due to the reduction in exergy losses in the HXs of compressors. This decrease is due to the reduction in compression ratio as M increases. Consequently, the outlet air temperature drops, which in turn decreases the temperature difference between the inlet and outlet of the HX. This ultimately leads to the decrease in exergy losses of HXs.
As M increases, there is a slight rise in the compressor exergy losses, while the expanders remain consistent. Additionally, the exergy losses in the HX of the expanders exhibit a slight reduction because of larger M. This leads to a reduction in the air temperature at the compressor outlet, subsequently resulting in a decrease in the mass flow rate of water. Consequently, the exergy losses in the heat exchanger of the expanders experience a minor decrease.
In conclusion, increasing M effectively reduces the exergy losses in the AA-CAES-CHP system, but this effect gradually diminishes as M increases. On the other hand, increasing N can slightly mitigate the system’s exergy losses. The decrease in exergy losses becomes noticeable when M is greater.
Figure 2B illustrates how the M and N effect the exergy losses under Condition 1. When M is small, the HX of compressors is the primary source of exergy losses. However, as M increases, the proportion of the HX of compressors decreases, while the proportion the compressors and the expanders increase. This is primarily due to the reduction in exergy losses in the HX of compressors.
Figure 2C illustrates the effect of M and N on the input and output energy of the system under Condition 1. During the energy storage process, an increase of M leads to a decrease in the energy consumed by the compressor unit. This reduction is because, according to Eq. 2, with an increase of M, the compression ratio of a single compressor decreases, resulting in lower power consumption. However, during the energy release process, M does not affect the power output of the system, but it does lead to a reduction in the heat output of the system. The decrease in heat output is due to the decrease in the input energy of the system. Meanwhile, the power output remains unchanged regardless of M.
On the other hand, the change of N does not affect the energy consumption of the compressor during the energy storage process. However, during the energy release process, an increase in N results in higher power output of the expanders. This is due to the decrease in the expansion ratio of a single expander as N increases, according to Eq. 7. Furthermore, the increase in N leads to a decrease in heat output. This is due to the constant input energy to the system coupled with the rise in power output, resulting in a reduction in the heat output to the environment.
Figure 2D illustrates the effect of M and N on the efficiency. During the energy storage process, increasing M leads to an improvement in the overall cycle efficiency and exergy efficiency of the system. This improvement is because the power output remains unchanged, while the power input decreases with larger M, increasing the cycle efficiency. The exergy efficiency also increases due to the reduction in exergy losses in the HXs, as mentioned in Figure 2A. However, this increase tends to recede as M continue to increase.
4.2.1.2 Economic performance
Figure 3A illustrates the effect of M and N on the investment cost of components in the system under Condition 1. Varying N does not affect the investment cost of the compressor unit and the HX of compressors when M remains constant. This is because N has no influence on the energy consumption of the compressor during the energy storage process. The energy consumed by the compressor unit remains consistent, determined by the working range of the storage tank and the air mass flow, as shown in Figure 3C, leading to an unchanged investment cost for the compressor unit. Similarly, the outlet air temperature of each compressor remains constant, resulting in a constant heat exchange rate and logarithmic mean temperature difference for the HX of compressors, thus keeping its investment cost unaffected, according to Eqs 18–21.
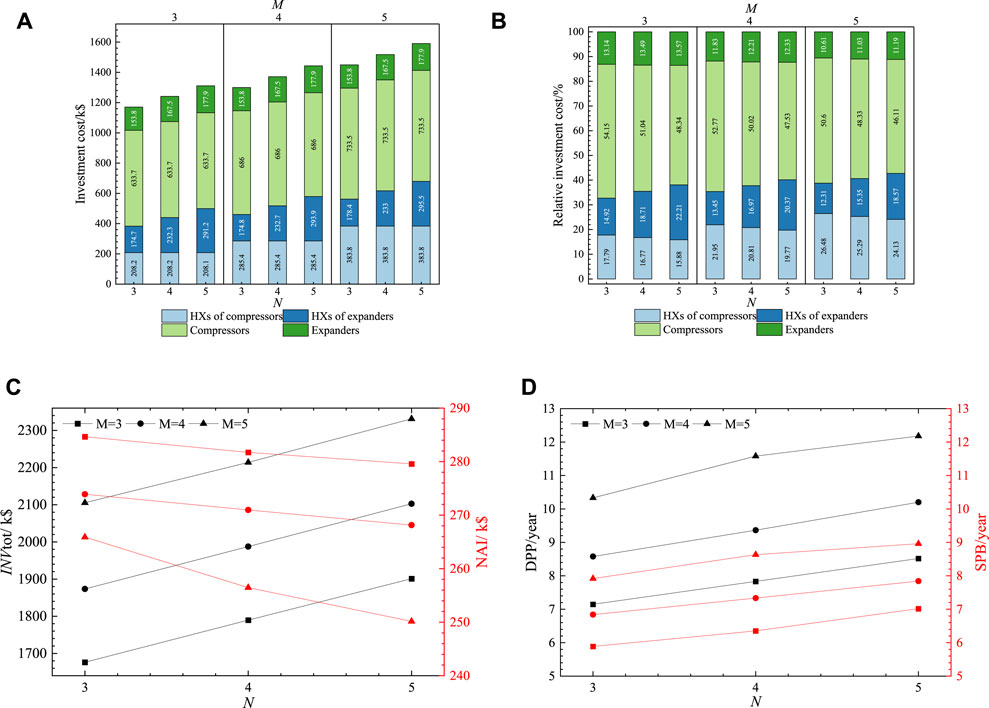
FIGURE 3. Effect of compression/expansion stages under Condition 1 on (A) investment cost; (B) relative investment cost; (C) system investment and profit; (D) DPP and SPB.
However, during the energy release process, the investment cost of HXs of expanders gradually increases. This is primarily due to the increase in the number of HXs. For the HXs after the first stage, an increase in N leads to a slight increase in their investment cost. This is because the larger N causes an increase in the inlet pressure, resulting in higher investment costs. Moreover, the investment cost of the expander unit, contributing to the most significant cost in the system, also increases with an increase in N. This is mainly due to the additional expanders required for larger N. However, for a single-stage expander, an increase in N results in a decrease in its investment cost. The reason is that the rise in N reduces the expansion ratio of the single-stage expander, thereby decreasing its output power and consequently reducing its investment cost. On the other hand, M has no effect on the components during the energy release process.
Figure 3B illustrates the effect of M and N on the investment cost of components under Condition 1. The cost of the compressor unit is most significant, accounting for 46.1%–54.2% of the total system cost. The next is the HX of compressors, accounting for 15.9%–26.5% of the total system cost.
Figure 3C illustrates the effect of M and N on the total investment cost and annual profit. The overall investment cost increases with the increase of M and N, aligning with the trend shown in Figure 3A. As M and N increase, the annual profit gradually decreases. This reduction is due to the increased operational costs as the number of components rises, leading to a decrease in the annual profit.
Figure 3D illustrates the effect of M and N on the DPP and SPB. As the number of M and N increases, the system’s investment cost rises, and the annual profit decreases. Therefore, both the DPP and SPB increase.
4.2.2 Condition 2
4.2.2.1 Thermodynamic performance
Figure 4A illustrates the effect of the number of M and N on the exergy losses of components in the system under Condition 2. It is evident that increasing M effectively reduces the overall exergy loss in the system. This reduction primarily results from the decrease in exergy losses of the HXs of compressors. Consequently, the proportion of exergy loss decreases, while the exergy losses of M and N become the main contributors. Increasing M proves to be an effective way to lower the exergy loss.
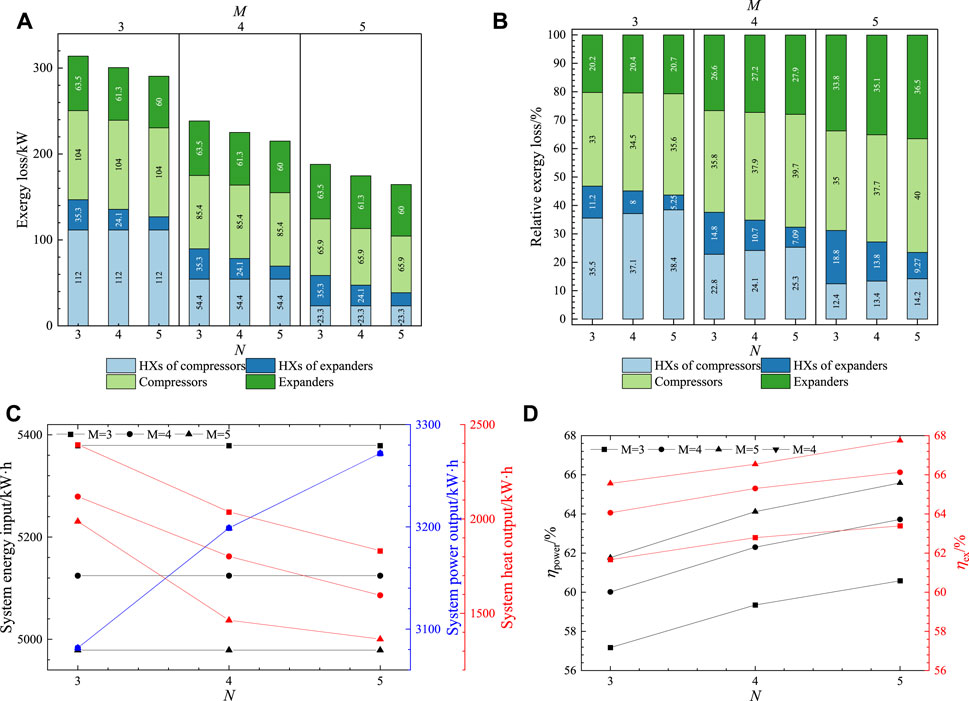
FIGURE 4. Effect of compression/expansion stages under Condition 2 on (A) exergy Losses; (B) relative exergy losses; (C) input and output energy; (D) efficiency.
Considering that the air mass flow rate in Condition 2 is twice that of Condition 1, a comparison with Figure 3A reveals that the trends of exergy loss for components in both operating conditions are similar. Moreover, the overall exergy loss in Condition 2 is twice that of Condition 1. By comparing Figure 4B with Figure 3B, it is evident that changing the inlet air flow rate does not affect the proportion of exergy loss for components or the efficiency.
Similarly, a comparison with Figure 3C and Figure 4C reveals that the input and output energy in Condition 2 are both twice that of Condition 1, and their trends are similar. This is expected given the doubled increase in the air mass flow rate in Condition 2. However, it is important to note that the influence of M and N on the efficiency remains unchanged under Condition 2. As displayed in Figure 4D, changing the inlet air flow rate does not affect the overall cycle efficiency and exergy efficiency.
4.2.2.2 Economic performance
Figure 5A illustrates the effect of M and N on the investment costs of components in the system under Condition 2. The trend of the influence of M and N on the investment costs of components remains consistent with that observed in operating conditions 1. However, comparing Figure 3A with Figure 5A, the investment cost of the compressors in Condition 2 increases by 73%, and the investment cost of the HXs between compressors increases by 80%. Consequently, the proportion of investment in the HXs between compressors in the system increases.
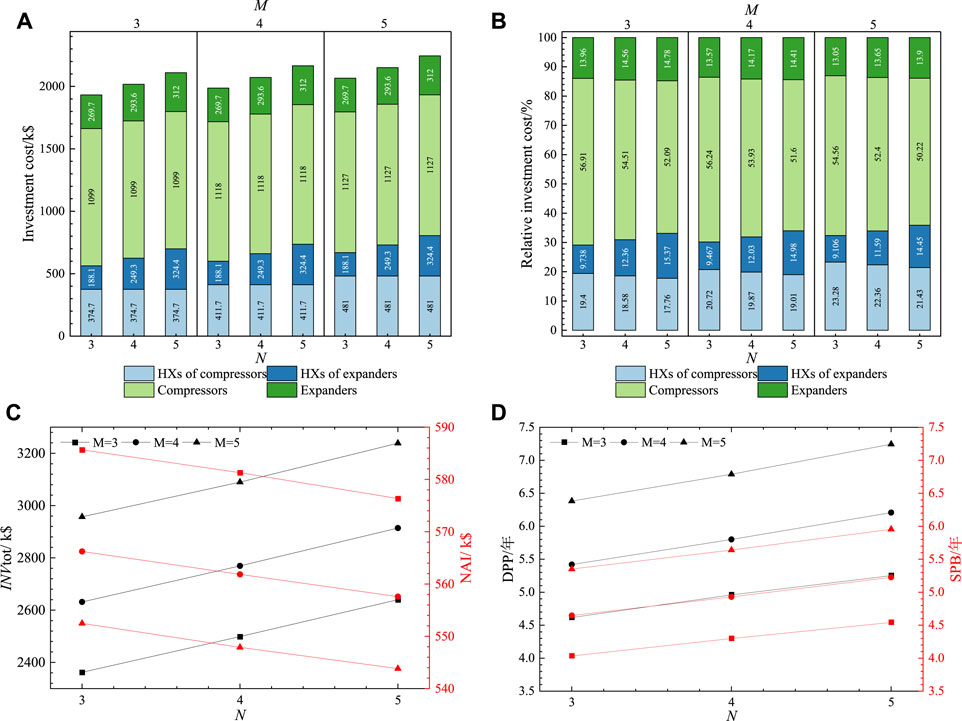
FIGURE 5. Effect of compression/expansion stages under Condition 2 on (A) investment cost; (B) relative investment cost; (C) system investment and profit; (D) DPP and SPB.
Figure 5B illustrates the relative investment costs of components in the AA-CAES-CHP system under Condition 2. Comparing Figure 3B with Figure 5B, the overall trends in the relative investment costs of components are similar for both Conditions 1 and 2. However, in Condition 2, the investment cost of the compressors and the HX of compressors are higher than in Condition 1.
Figure 5C illustrates the effect of M and N on the total investment cost and annual income under Condition 2. Comparing Figure 5C with Figure 3C shows that the trend of the change in the overall investment cost in Condition 2 is similar to that observed in Condition 1. However, as N increases, the annual income first increases and then decreases. This is because the increase in the total investment cost with an increase in N leads to a significant rise in operating costs, which subsequently reduces the annual income of the system. Compared to Condition 1, the total investment cost in Condition 2 increased by 41.1%–65.1%.
Figure 5D illustrates the effect of M and N on the DPP and SPB. The investment payback period in Condition 2 follows the same trend as that in Condition 1. Moreover, for the same M and N, the investment payback period in Condition 2 is shorter than that in Condition 1. This indicates that the system has a faster return on investment in Condition 2 due to its higher annual income despite the increased investment cost.
4.2.3 Condition 3
4.2.3.1 Thermodynamic performance
Figures 6A, B illustrate the effect of M and N on the exergy loss (irreversible losses) of components in the AA-CAES-CHP system under Condition 3. Comparing Figure 6A with Figure 3A reveals that the trend of the exergy loss of components in the system is the same for operating conditions 3 and 1. Under Condition 3, the air mass flow rate is 2 kg·s−1, and the working range of the storage tank is 3–9 MPa.
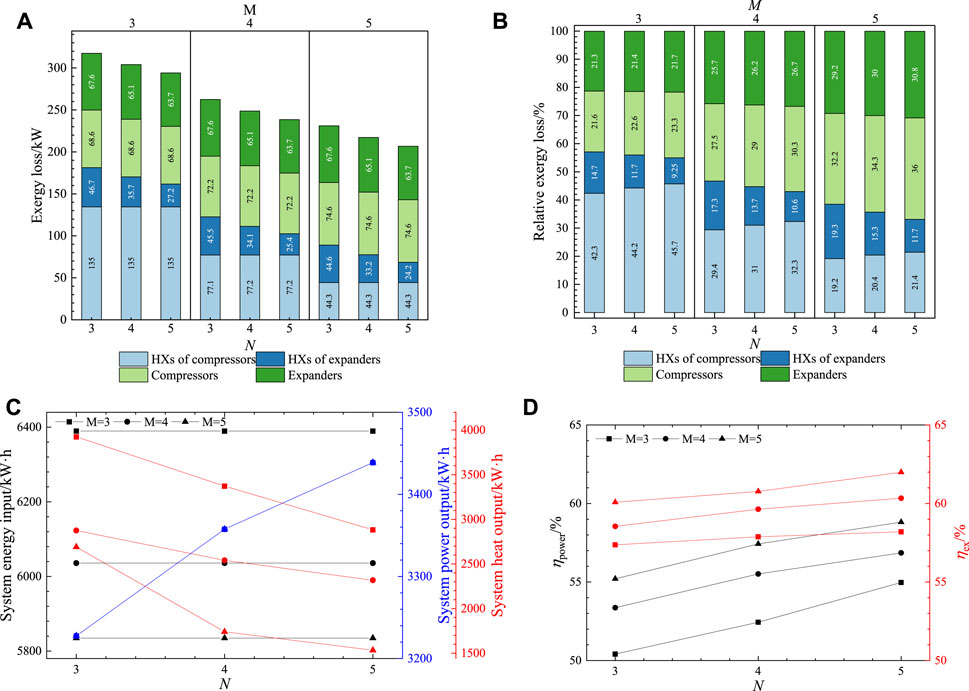
FIGURE 6. Effect of compression/expansion stages under Condition 3 on (A) exergy Losses; (B) relative exergy losses; (C) input and output energy; (D) efficiency.
By comparing Figure 6B with Figure 4B, the proportion of exergy loss attributed to the HXs between compressors is higher in Condition 3. This is because of the higher outlet pressure of the compressors, which increases the compression ratio of the compressors, raises the air temperature at the outlet of the compressors, and enlarges the temperature difference at the inlet and outlet of the HXs, resulting in a higher relative exergy loss of the HXs between compressors.
Figures 6C, D respectively illustrate the effect of M and N on the input and output energy and the efficiency under Condition 3. The cycle efficiency and exergy efficiency are lower compared to Condition 1. This is due to the higher compression ratio, which increases the compression heat, resulting in a greater increase in output heat than output electricity, causing the system’s energy output to be more concentrated in heat output. The increase in the compression ratio leads to an increase in both the compressor exergy loss and the temperature difference at the inlet and outlet of the HXs between compressors, resulting in higher exergy loss of the HXs and a decrease in the exergy efficiency.
4.2.3.2 Economic performance
Figures 7A, B respectively illustrate the effect of M and N on the investment costs and relative costs of components under Condition 3.
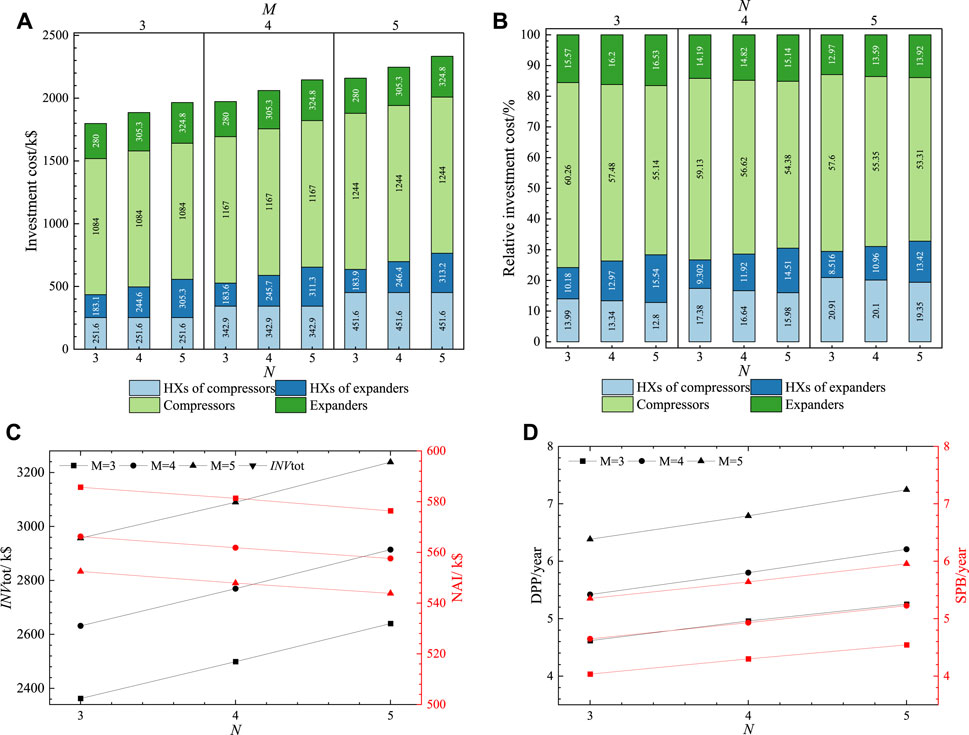
FIGURE 7. Effect of compression/expansion stages under Condition 3 on (A) investment cost; (B) relative investment cost; (C) system investment and profit; (D) DPP and SPB.
As shown in Figure 7A, when M increases from 3 to 5, the total investment cost increases from 1,973 k$ to 2,333 k$, with the compressor investment cost increasing by 160 k$ and the compressor HX cost increasing by 200 k$. When N increases from 3 to 5, the total investment cost increases from 1,973 k$ to 2,146 k$, with the expansion machine investment cost increasing by 45 k$ and the expander HX cost increasing by 128 k$. Compared to Condition 2, with the same M and N, the proportion of the investment cost of the expansion unit during the discharging process decreases by 3.68%.
Figure 7C illustrates the effect of M and N on the total investment cost and annual income under Condition 3. The overall investment cost increases with the increase of N, consistent with the trend in Figure 7A. The annual income decreases with the increase of N, as the overall investment cost increases, resulting in higher operational costs and, in turn, a decrease in annual income.
Figure 7D illustrates the effect of M and N on the DPP and SPB. The investment payback period increases with the increase in M and N. Compared to operating conditions 1 and 2, Condition 3 has a shorter investment payback period, indicating a faster return on investment.
4.2.4 Condition 4
4.2.4.1 Thermodynamic performance
Figures 8A, B illustrate the effects of M and N on the exergy losses of components under Condition 4. The trend of exergy losses in components follows a similar pattern as observed in Condition 1. By comparing Conditions 1, 2, 3, and 4, with the increase in system scale, the proportion of exergy loss in the HXs gradually rises. This indicates that the performance of HXs has a greater effect on the overall system performance. When the compressor stage number is 3, HXs account for the majority of system exergy losses. However, when the compressor stage number is greater than 3, the main contributors to exergy losses become the expanders and the compressors.
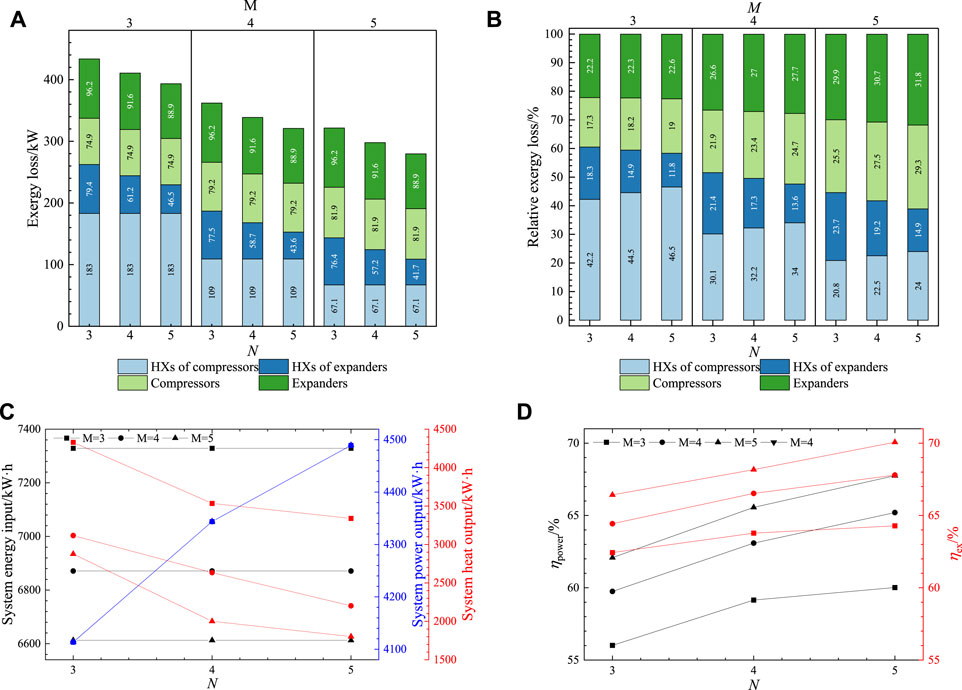
FIGURE 8. Effect of compression/expansion stages under Condition 4 on (A) exergy Losses; (B) relative exergy losses; (C) input and output energy; (D) efficiency.
The effects of M and N on the input and output energy are shown in Figure 8C. By comparing Figure 8C with Figure 3C, the trends of input and output energy follow a similar trend of Condition 1. The efficiency also follows the same trend with the varying M and N.
The effect of the M and N on efficiency in Condition 4 is illustrated in Figure 8D. Compared to Condition 2, the cycle efficiency and exergy efficiency are lower in Condition 4. This is due to the higher compression ratio, resulting in increased compression heat, where the increase in heat output is larger than the increase in power output, causing the overall energy to be more concentrated in thermal energy. The increased compression ratio leads to higher compressor exergy losses and a greater temperature difference of the compressor HXs, resulting in increased exergy losses in the HXs. Moreover, the system’s output energy is more concentrated in thermal energy, reducing the exergy output and consequently leading to a decrease in the exergy efficiency.
4.2.4.2 Economic performance
Figure 9A illustrates the effect of M and N on the investment cost of components under Condition 4. Comparing Figure 7A with Figure 9A, the investment cost of components under Condition 4 follows a similar trend as observed in Condition 3.
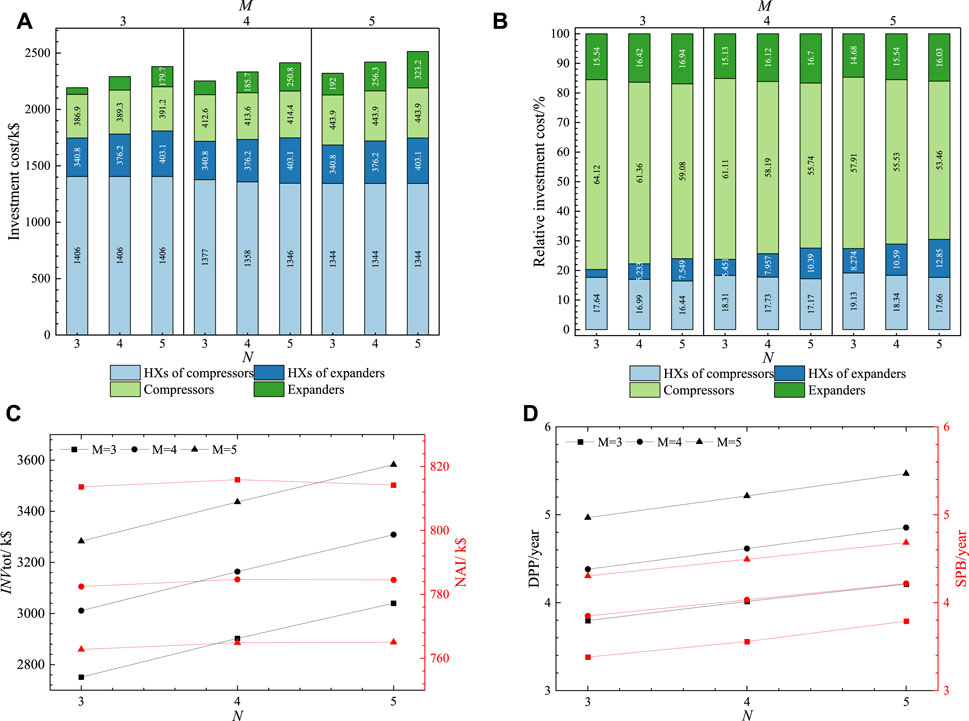
FIGURE 9. Effect of compression/expansion stages under Condition 4 on (A) investment cost; (B) relative investment cost; (C) system investment and profit; (D) DPP and SPB.
Figure 9B illustrates the effect of M and N on the investment cost of components in the system. The investment cost of the expanders and the compressors account for 14.7%–16.9% and 53.5%–64.1% of the total investment cost, respectively. The compressors are the main contributor to the system’s investment cost. Compared to Condition 3, the higher compressor outlet pressure leads to a higher proportion of investment cost in the compressors and the compressor HXs.
Figure 9C illustrates the effect of M and N on the total investment cost and annual profit under Condition 4. From Figure 9C, the overall investment cost increases with the increase in the number of expander and compressor stages, following a similar trend as shown in Figure 9A. The system’s annual profit increases with the increase in the number of expander stages (N), as the efficiency increases, resulting in higher output energy and greater income.
Figure 9D illustrates the effect of M and N on the DPP and SPB. The investment payback period increases with the increase in the number of compressor and expander stages. Compared to Conditions 1, 2, and 3, Condition 4 has a shorter investment payback period, which suggests better economic performance in Condition 4 despite the higher investment costs.
The performance of the system under the four operational conditions, along with a comparison to relevant studies, is presented in Table 7. The system’s performance across these four conditions follows a consistent trend: A higher upper limit of AST pressure leads to improved overall system performance, while the increasing compression and expansion stages result in increased efficiency but decreased economic efficiency.
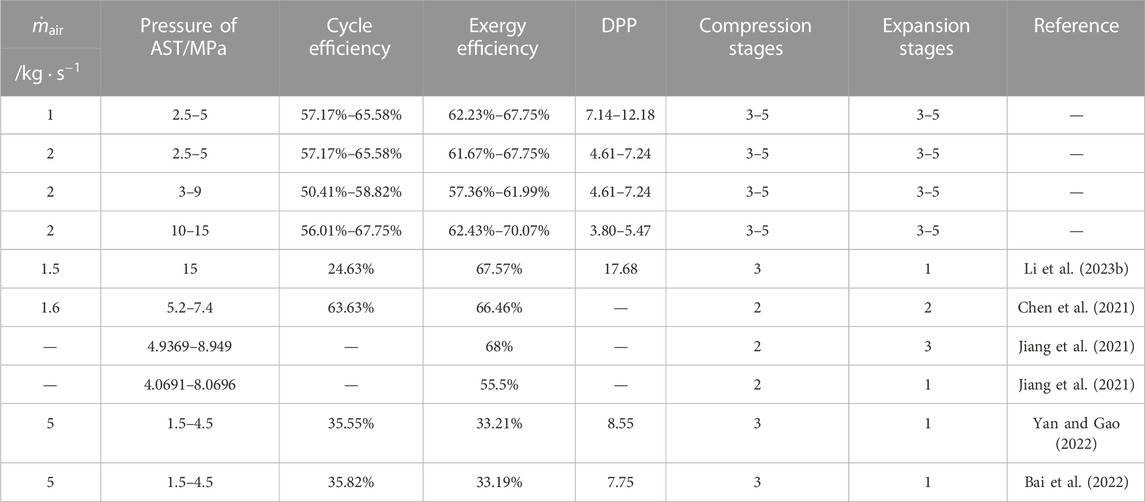
TABLE 7. Simulation results and comparison of performance.
The cycle efficiency obtained is relatively higher than that in the references. This disparity is due to variations in the distribution of thermal and electrical energy during the combined heat and power generation. In terms of exergy efficiency, this study’s results align closely with the efficiency levels in the references. Additionally, it is worth noting that the relatively lower exergy efficiencies in (Yan and Gao, 2022; Bai et al., 2022) stem from the integration of solar energy.
Comparison with other studies highlights that this study has amassed extensive simulation results considering the range of AST pressure, compression stages, and expansion stages. This offers a comprehensive reference for further design and optimization of the AA-CAES-CHP system, thereby providing valuable insights and directions for the advancement of CAES technology.
Conclusion
This study focused on the AA-CAES-CHP system, and the thermodynamic and economic models were established. Optimizing the efficient energy-cascading utilization of the AA-CAES-CHP system can greatly improve the efficiency and overall system performance. Particularly, the number of compressor and expander stages is a critical factor in determining the system’s performance. The researchers have proved that the number of compressor and expander stages is a critical factor in the system’s performance. The effects of different compressor and expander stage numbers on system characteristics were analyzed to better guide the possible optimization of the AA-CAES-CHP system.
The main findings are summarized as follows:
(1) The exergy loss of the system is influenced by the number of compressor and expander stages. When the compressor stage number is 3, the HXs contribute significantly to the exergy loss (46.8%–50.3%). However, when the compressor stage number is 4 or 5, the expanders and compressors become the main sources of exergy loss (60.5%–76.5%).
(2) Increasing the compressor stage number from 3 to 5 increases the total investment cost from 1973 k$ to 2,333 k$. The compressor investment cost rises by 160 k$, and the cost of compressor HXs increases by 200 k$. On the other hand, increasing the expander stage number from 3 to 5 results in an 18.2% increase in the total investment cost, from 1973 k$ to 2,146 k$. The expander investment cost increases by 45 k$, and the cost of expander HXs cost increases by 128 k$. However, despite these increases, the proportion of investment cost for the energy release unit decreases by 3.68%.
(3) Considering both thermodynamic and economic characteristics helps in improving the performance of the AA-CAES-CHP system. For instance, Condition 2, which doubles the air mass flow rate while maintaining the system’s exergy loss, results in a doubled total energy output. However, the total investment cost increases by only 41.1%–65.1% compared to Condition 1.
In conclusion, optimizing the compressor and expander stage numbers can significantly influence the performance and economics of the AA-CAES-CHP system, thereby contributing to the development and implementation of efficient energy storage.
Data availability statement
The original contributions presented in the study are included in the article/supplementary material, further inquiries can be directed to the corresponding authors.
Author contributions
DA: Writing–original draft, Writing–review and editing. YL: Writing–review and editing. XL: Writing–original draft. ST: Writing–review and editing.
Funding
The author(s) declare financial support was received for the research, authorship, and/or publication of this article. This work was supported in part by the National Natural Science Foundation of China under Grant 62173268, Grant 61803295, Grant 61973247, and Grant 61673315; in part by the Major Research Plan of the National Natural Science Foundation of China under Grant 61833015.
Conflict of interest
The authors declare that the research was conducted in the absence of any commercial or financial relationships that could be construed as a potential conflict of interest.
Publisher’s note
All claims expressed in this article are solely those of the authors and do not necessarily represent those of their affiliated organizations, or those of the publisher, the editors and the reviewers. Any product that may be evaluated in this article, or claim that may be made by its manufacturer, is not guaranteed or endorsed by the publisher.
References
Akinyele, D. O., and Rayudu, R. K. (2014). Review of energy storage technologies for sustainable power networks. Sustain. energy Technol. assessments 8, 74–91. doi:10.1016/j.seta.2014.07.004
Alirahmi, S. M., Razmi, A. R., and Arabkoohsar, A. (2021). Comprehensive assessment and multi-objective optimization of a green concept based on a combination of hydrogen and compressed air energy storage (CAES) systems. Renew. Sustain. Energy Rev. 142, 110850. doi:10.1016/j.rser.2021.110850
Bai, H., Luo, S. H., Zhao, X. J., Zhao, G., and Gao, Y. (2022). Comprehensive assessment of a green cogeneration system based on compressed air energy storage (CAES) and zeotropic mixtures. Energy 254, 124190. doi:10.1016/j.energy.2022.124190
Bai, J., Chen, W., Xie, N., Ma, L., Wang, Y., Zhang, T., et al. (2023). Dynamic characteristics and optimizations of the proposed combined cold and power system with integrated advanced adiabatic compressed air energy storage and double-effect compression-absorption refrigeration. Energy 283, 128474. doi:10.1016/j.energy.2023.128474
Bu, S., Yang, X., Sun, Y., Li, W., Su, C., Wang, X., et al. (2022). Thermodynamic performances analyses and process optimization of a novel AA-CAES system coupled with solar auxiliary heat and organic Rankine cycle. Energy Rep. 8, 12799–12808. doi:10.1016/j.egyr.2022.09.133
Cai, Y., Li, J., Liu, H., and He, Q. (2018). Exergy analysis of compressed air energy storage system combined with absorption chiller. Proc. Chin. Soc. Electr. Eng. 38, 186–194. doi:10.13334/j.0258-8013.pcsee.161749
Cao, L., Wang, J., Chen, L., and Dai, Y. (2018). Comprehensive analysis and optimization of Kalina-Flash cycles for low-grade heat source. Appl. Therm. Eng. 131, 540–552. doi:10.1016/j.applthermaleng.2017.12.036
Cao, Z., Zhou, S. H., Xu, Y. J., Chen, H. S., and Deng, J. Q. (2022). Numerical study on adiabatic compressed air energy storage system with only one ejector alongside final stage compression. Appl. Therm. Eng. 216, 119071. doi:10.1016/j.applthermaleng.2022.119071
Chen, L., Wang, Y., Xie, M., Ye, K., and Mohtaram, S. (2021). Energy and exergy analysis of two modified adiabatic compressed air energy storage (A-CAES) system for cogeneration of power and cooling on the base of volatile fluid. J. Energy Storage 42, 103009. doi:10.1016/j.est.2021.103009
Chen, L. X., Zhang, L. G., Yang, H. P., Xie, M. N., and Ye, K. (2022). Dynamic simulation of a Re-compressed adiabatic compressed air energy storage (RA-CAES) system. Energy 261, 125351. doi:10.1016/j.energy.2022.125351
Couper, J. R., Penney, W. R., James, R., and Fair, P. (2009). Chemical process equipment revised 2E. New York, NY: Elsevier Science Inc.
Courtois, N., Najafiyazdi, M., Lotfalian, R., Boudreault, R., and Picard, M. (2021). Analytical expression for the evaluation of multi-stage adiabatic-compressed air energy storage (A-CAES) systems cycle efficiency. Appl. Energy 288, 116592. doi:10.1016/j.apenergy.2021.116592
Diyoke, C., and Wu, C. F. (2020). Thermodynamic analysis of hybrid adiabatic compressed air energy storage system and biomass gasification storage (A-CAES + BMGS) power system. Fuel 271, 117572. doi:10.1016/j.fuel.2020.117572
Fu, H., Hua, Q., Shi, J., and Sun, L. (2023). Photothermal-assisted scheme design and thermodynamic analysis of advanced adiabatic compressed air energy storage system. Renew. Energy 215, 118927. doi:10.1016/j.renene.2023.118927
Fu, H. L., He, Q., Song, J. T., Shi, X. P., Hao, Y. P., Du, D. M., et al. (2021). Thermodynamic of a novel advanced adiabatic compressed air energy storage system with variable pressure ratio coupled organic rankine cycle. Energy 227, 120411. doi:10.1016/j.energy.2021.120411
Han, Z., An, P., Guo, S., and Jiang, K. (2020a). Thermodynamic performance analysis of advanced adiabatic compressed air energy storage system based on solar auxiliary heating. Acta Energiae Solaris Sin. 41, 243–250.
Han, Z. H., Sun, Y., and Li, P. (2020b). Research on energy storage operation modes in a cooling, heating and power system based on advanced adiabatic compressed air energy storage. Energy Convers. Manag., 208. doi:10.1016/j.enconman.2020.112573
Han, Z., Ma, F., Wu, D., Zhang, H., Dong, F., Li, P., et al. (2021). Collaborative optimization method and operation performances for a novel integrated energy system containing adiabatic compressed air energy storage and organic Rankine cycle. J. Energy Storage 41, 102942. doi:10.1016/j.est.2021.102942
Hartmann, N., Vöhringer, O., Kruck, C., and Eltrop, L. (2012). Simulation and analysis of different adiabatic compressed air energy storage plant configurations. Appl. energy 93, 541–548. doi:10.1016/j.apenergy.2011.12.007
Huang, E., Song, C., Jin, Q., Yao, L., and Yang, J. (2021). Optimal design of adiabatic compressed air energy storage system based on heat storage medium and exhaust temperature. Therm. Power Gener. 50, 39–46.
Jiajun, L., Hang, L., Zheng, C., and Jianqiang, D. (2023). Study of the independent cooling performance of adiabatic compressed air energy storage system: Étude des performances de refroidissement indépendantes du système de stockage d'énergie d'air comprimé adiabatique. Int. J. Refrig. doi:10.1016/j.ijrefrig.2023.05.006
Jiang, R., Cai, Z., Peng, K., and Yang, M. (2021). Thermo-economic analysis and multi-objective optimization of polygeneration system based on advanced adiabatic compressed air energy storage system. Energy Convers. Manag. 229, 113724. doi:10.1016/j.enconman.2020.113724
Kemble, S., Manfrida, G., Milazzo, A., Buffa, F., Kemble, S., and Buffa, F. (2012). “Thermoeconomics of a ground-based CAES plant for peak-load energy production system,” in 25th international conference on efficiency, cost, optimization, simulation and environmental impact of energy systems (ECOS 2012) (Perugia, Italy: ECOS), 26–29.
Lashgari, F., Babaei, S. M., Pedram, M. Z., and Arabkoohsar, A. (2022). Comprehensive analysis of a novel integration of a biomass-driven combined heat and power plant with a compressed air energy storage (CAES). Energy Convers. Manag. 255, 115333. doi:10.1016/j.enconman.2022.115333
Li, P., Hu, Q., Han, Z., Wang, C., Wang, R., Han, X., et al. (2022). Thermodynamic analysis and multi-objective optimization of a trigenerative system based on compressed air energy storage under different working media and heating storage media. Energy 239, 122252. doi:10.1016/j.energy.2021.122252
Li, P., Hu, Q. Y., Sun, Y., and Han, Z. H. (2021). Thermodynamic and economic performance analysis of heat and power cogeneration system based on advanced adiabatic compressed air energy storage coupled with solar auxiliary heat. J. Energy Storage 42, 103089. doi:10.1016/j.est.2021.103089
Li, R. X., Tao, R., Feng, X. J., Yao, E. R., Zhang, H. R., Ling, L. N., et al. (2023a). Energy distributing and thermodynamic characteristics of a coupling near-isothermal compressed air energy storage system. J. Energy Storage 58, 106314. doi:10.1016/j.est.2022.106314
Li, R. X., Wang, H. R., and Tu, Q. S. (2018). Thermo-economic analysis and optimization of adiabatic compressed air energy storage (A-CAES) system coupled with a Kalina cycle. Energy Technol. 6, 1011–1025. doi:10.1002/ente.201700600
Li, Y., Teng, S., and Xi, H. (2023b). 3E analyses of a cogeneration system based on compressed air energy storage system, solar collector and organic Rankine cycle. Case Stud. Therm. Eng. 42, 102753. doi:10.1016/j.csite.2023.102753
Liu, M. Y., Zhu, Y., Cao, C. Z., Cao, X., Zhu, L. J., and Zheng, J. T. (2019). Performance analysis of compressed air energy storage system. Adv. Technol. Electr. Eng. Energy (China) 38, 67–72. doi:10.1016/j.enconman.2020.113446
Liu, Z., Yang, X. Q., Liu, X., Wang, W. B., and Yang, X. H. (2021). Evaluation of a trigeneration system based on adiabatic compressed air energy storage and absorption heat pump: thermodynamic analysis. Appl. Energy 300, 117356. doi:10.1016/j.apenergy.2021.117356
Ludwig, E. E. (1997). Applied process design for chemical and petrochemical plants: Volume 2. Houston, TX: Gulf professional publishing Inc.
Lv, H. N., Chen, Y. P., Wu, J. F., and Zhu, Z. L. (2022). Performance of isobaric adiabatic compressed humid air energy storage system with shared equipment and road-return scheme. Appl. Therm. Eng. 211, 118440. doi:10.1016/j.applthermaleng.2022.118440
Mousavi, S. B., Ahmadi, P., Pourahmadiyan, A., and Hanafizadeh, P. (2021). A comprehensive techno-economic assessment of a novel compressed air energy storage (CAES) integrated with geothermal and solar energy. Sustain. Energy Technol. Assessments 47, 101418. doi:10.1016/j.seta.2021.101418
Piri, A., Aghanajafi, C., and Sohani, A. (2023). Enhancing efficiency of a renewable energy assisted system with adiabatic compressed-air energy storage by application of multiple Kalina recovery cycles. J. Energy Storage 61, 106712. doi:10.1016/j.est.2023.106712
Ran, P., Zhang, H., Qiao, Y., Wang, J., Li, Z., and Wang, Y. (2022). Thermodynamic analysis for a novel steam injection adiabatic compressed air energy storage hybrid system. J. Energy Storage 55, 105424. doi:10.1016/j.est.2022.105424
Saravanamuttoo, H. I., Rogers, G. F. C., and Cohen, H. (2001). Gas turbine theory. New Jersey: Pearson Education Inc.
Shi, K., and Asgari, A. (2022). Energy, exergy, and exergoeconomic analyses and optimization of a novel thermal and compressed air energy storage integrated with a dual-pressure organic Rankine cycle and ejector refrigeration cycle. J. Energy Storage 47, 103610. doi:10.1016/j.est.2021.103610
Song, J., Peng, X. D., Fang, X. J., Han, Y., Deng, Z. F., Xu, G. Z., et al. (2020). Thermodynamic analysis and algorithm optimisation of a multi-stage compression adiabatic compressed air energy storage system. Therm. Sci. Eng. Prog. 19, 100598. doi:10.1016/j.tsep.2020.100598
Teng, S., and Xi, H. (2022). Experimental evaluation of vortex tube and its application in a novel trigenerative compressed air energy storage system. Energy Convers. Manag. 268, 115972. doi:10.1016/j.enconman.2022.115972
Tian, Y., Zhang, T., Xie, N., Dong, Z., Yu, Z., Lyu, M., et al. (2023). Conventional and advanced exergy analysis of large-scale adiabatic compressed air energy storage system. J. Energy Storage 57, 106165. doi:10.1016/j.est.2022.106165
Tong, Z., Cheng, Z., and Tong, S. (2021). A review on the development of compressed air energy storage in China: technical and economic challenges to commercialization. Renew. Sustain. Energy Rev. 135, 110178. doi:10.1016/j.rser.2020.110178
Wang, P. Z., Zhao, P., Lai, Y. Q., Wang, J. F., and Dai, Y. P. (2019). Performance comparison of different combined heat and compressed air energy storage systems integrated with organic Rankine cycle. Int. J. Energy Res. 43, 8410–8425. doi:10.1002/er.4839
Wang, P. Z., Zhao, P., Wang, J. F., and Dai, Y. P. (2020). Performance evaluation of a combined heat and compressed air energy storage system integrated with ORC for scaling up storage capacity purpose. Energy 190, 116405. doi:10.1016/j.energy.2019.116405
Wang, S., Zhang, X., Yang, L., Zhou, Y., and Wang, J. (2016). Experimental study of compressed air energy storage system with thermal energy storage. Energy 103, 182–191. doi:10.1016/j.energy.2016.02.125
Xi, H., Li, M., Huang, Z., and Wang, M. (2021). Energy, exergy and economic analyses and performance assessment of a trigeneration system for power, freshwater and heat based on supercritical water oxidation and organic Rankine cycle. Energy Convers. Manag. 243, 114395. doi:10.1016/j.enconman.2021.114395
Yan, L. Q., and Gao, Y. (2022). Economic and exergoeconomic analyses of a cogeneration based on adiabatic compressed air energy storage and zeotropic mixtures. J. Energy Storage 51, 104413. doi:10.1016/j.est.2022.104413
Yang, M. H., Yeh, R. H., and Hung, T. C. (2017). Thermo-economic analysis of the transcritical organic Rankine cycle using R1234yf/R32 mixtures as the working fluids for lower-grade waste heat recovery. Energy 140, 818–836. doi:10.1016/j.energy.2017.08.059
Zhang, F., Chen, J., Su, C., and Ma, C. (2018). Energy consumption and economic analyses of a supercritical water oxidation system with oxygen recovery. Processes 6, 224. doi:10.3390/pr6110224
Zhang, F., Shen, B., Su, C., Xu, C., Ma, J., Xiong, Y., et al. (2017). Energy consumption and exergy analyses of a supercritical water oxidation system with a transpiring wall reactor. Energy Convers. Manag. 145, 82–92. doi:10.1016/j.enconman.2017.04.082
Zhang, L., Liu, L. X., Zhang, C., He, X. B., Zhang, Y. P., and Yang, T. (2021). Performance analysis of an adiabatic compressed air energy storage system with a pressure regulation inverter-driven compressor. J. Energy Storage 43, 103197. doi:10.1016/j.est.2021.103197
Zhao, P., Wang, J., and Dai, Y. (2015). Thermodynamic analysis of an integrated energy system based on compressed air energy storage (CAES) system and Kalina cycle. Energy Convers. Manag. 98, 161–172. doi:10.1016/j.enconman.2015.03.094
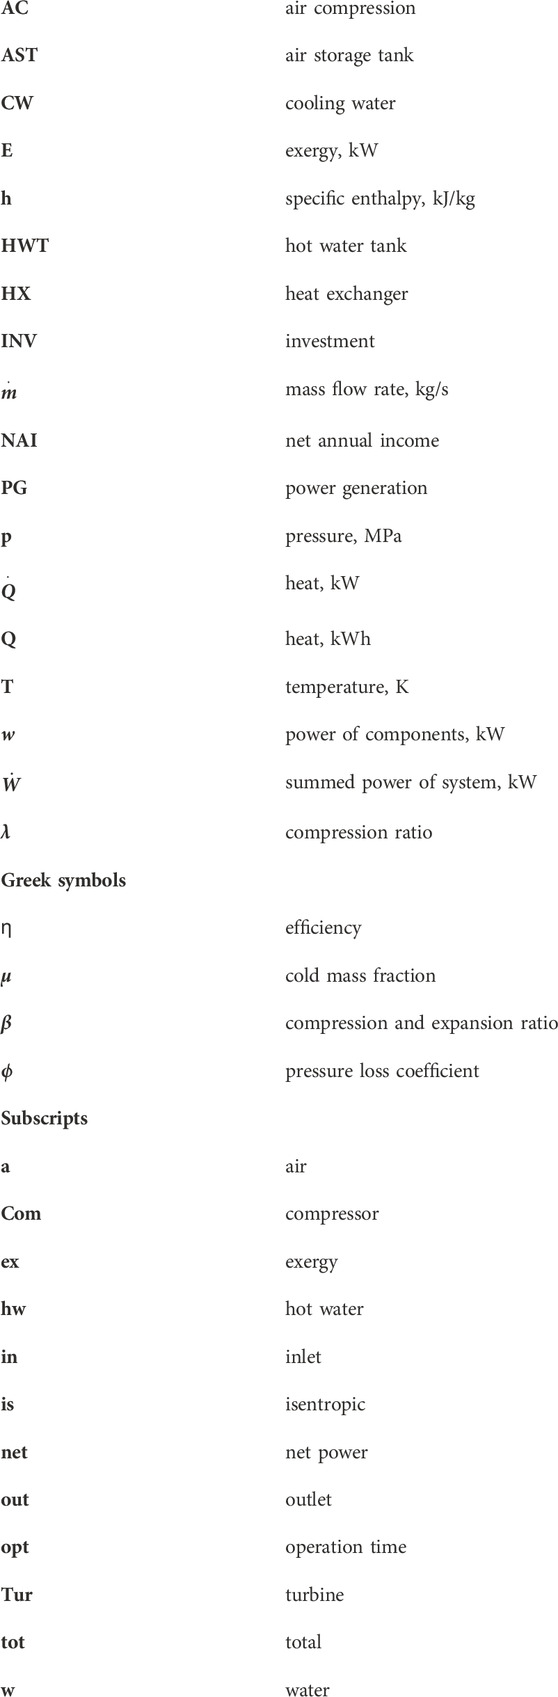
Nomenclature
Keywords: combined heating and power system (CHP), compressed air energy storage (CAES), economic analysis, thermodynamic analysis, compressors and expanders stages
Citation: An D, Li Y, Lin X and Teng S (2023) Analysis of compression/expansion stage on compressed air energy storage cogeneration system. Front. Energy Res. 11:1278289. doi: 10.3389/fenrg.2023.1278289
Received: 16 August 2023; Accepted: 08 September 2023;
Published: 19 September 2023.
Edited by:
Xiaoye Dai, Tsinghua University, ChinaReviewed by:
Yu Qiu, Central South University, ChinaYongqiang Feng, Jiangsu University, China
Kun Wang, Hebei University of Technology, China
Copyright © 2023 An, Li, Lin and Teng. This is an open-access article distributed under the terms of the Creative Commons Attribution License (CC BY). The use, distribution or reproduction in other forums is permitted, provided the original author(s) and the copyright owner(s) are credited and that the original publication in this journal is cited, in accordance with accepted academic practice. No use, distribution or reproduction is permitted which does not comply with these terms.
*Correspondence: Yuquan Li, bGl5dXF1YW4xNzJAc3R1LnhqdHUuZWR1LmNu; Shiyang Teng, dHN5MTk5OTExMDFAc3R1LnhqdHUuZWR1LmNu