 Xiu Ji
 Meng Li
 Meiyue Li
 Huanhuan Han
- 1National Local Joint Engineering Research Center for Smart Distribution Grid Measurement and Control with Safety Operation Technology, Changchun Institute of Technology, Changchun, China
- 2Changchun Institute of Technology, Changchun, China
In order to further reduce the carbon emission level of the integrated energy system and improve the system operation economy, a low-carbon economic dispatch strategy for the integrated energy system considering comprehensive demand response is proposed. First, based on the composition and operating characteristics of the integrated energy system, two demand response models, price-based and substitution-based, are established. Secondly, based on the ladder-type carbon trading mechanism and the green certificate trading mechanism, a green certificate-carbon trading mechanism model is designed to construct a ladder-type carbon trading mechanism model. A comprehensive energy system low-carbon economic dispatch model with the lowest system operating cost is composed of carbon transaction costs, energy purchase costs, operation and maintenance costs, green certificate trading income and wind and light abandonment costs. Finally, through simulation experiments, this paper is verified the effectiveness of the proposed model is analyzed, and the impact of demand response sensitivity and ladder-type carbon trading mechanism parameters on system dispatch results is analyzed.
1 Introduction
With the rapid development of China’s economy and society, environmental problems have become increasingly prominent. The continuous growth of energy consumption and carbon emissions has become a major problem restricting social development (Wang, et al., 2021; Lv, et al., 2022). At present, China is the world’s largest energy consumer, ranking first in carbon emissions, and per capita carbon emission levels exceed the world average by 40% (Sheng, et al., 2023). In this context, the promotion and application of the integrated energy systems will be an important measure for China to achieve the goal of “carbon peaking and carbon neutrality” (Wang, et al., 2017; Zang, et al., 2022).
Current research on the IES mainly focuses on economic operation. Compared with traditional power demand response regulation, the integrated demand response (IDR) smoothens the electric load curve, reduces the peak pressure of the power grid, and reduces system operation with the advantage of cost, and demand response can be extended and applied to various energy systems such as electricity, gas, and heat. Through the energy conversion equipment in the system, coupling and complementation between multiple energy sources can be achieved, which has higher optimization and control potential (Song, et al., 2018). Comprehensively, both supply- and demand-side thermal/electrical coupling and electric/heat load demand response are considered, and a joint dispatch optimization model is established through supply- and demand-side electric and thermal conversion (Guo, et al., 2019). The IDR of the power grid and natural gas grid is introduced into the multi-energy system, and it guides users to change their electricity and gas consumption behaviors by constructing price stimulus signals (Wang, et al., 2017). An electricity and gas energy hub framework is proposed that considers IDR, which effectively balances the supply and demand relationship between natural gas and electricity (Guo, et al., 2019). A transferable and reducible load model is introduced, and an IES economic dispatch model based on flexible loads is proposed (Chen, et al., 2018). The coupling characteristics of electricity, heat, and gas loads are combined, and an IES dispatch model is proposed that takes into account comprehensive demand response for electricity, gas, and heat. The aforementioned literature fully utilizes the role of demand-side resources in improving the economy and energy utilization efficiency of the IES. Through flexible adjustment of loads, it relieves the system energy supply pressure and improves the consumption of renewable energy, which is important for realizing the economic and flexible operation of the IES and plays an important role. However, existing research considers a relatively single type of demand response resources, lacks refined modeling of different types of IDR resources, and does not fully utilize the response strength of demand-side resources.
The two major trading policies of the carbon emission trading (CET) mechanism and the green certificate trading (GCT) are important means to achieve the goal of “carbon peaking and carbon neutrality.” It plays an important role in reducing carbon emission and promoting new energy consumption (Wang, et al., 2019; Wei, et al., 2022). The CET mechanism is one of the important means to guide the operation of IES low-carbon economy (Qiu, et al., 2015; Wu, et al., 2023). The CET mechanism is introduced into the IES economic optimization model, the unit output before and after the introduction of the CET mechanism is discussed, and the effectiveness of the CET mechanism in reducing IES carbon emissions is verified (Wang, et al., 2022). The CET mechanism is improved, the unit carbon trading price is segmented according to the interval size of carbon emission, a ladder-type carbon trading price is proposed, and then it is proceeded with the optimization goal of minimizing the sum of the ladder-type carbon trading cost and operating cost. The IES optimizes scheduling (Cui, et al., 2021). An IES low-carbon optimal dispatch strategy based on the ladder-type CET mechanism is proposed from the perspective of source-side centralized dispatch, and the impact of carbon emission range, unit carbon transaction price, and different dispatch models on IES optimization is analyzed. As the penetration rate of high-proportion renewable energy continues to increase, increasing the consumption of renewable energy is an important method to reduce carbon emission. The GCT mechanism provides favorable policy support for improving renewable energy consumption capabilities (Dong and Shi, 2019; Yang, et al., 2019; Chen, et al., 2021; Ma, et al., 2021), and a bilateral transaction model between power distributors and renewable energy generators is established based on the cooperative game theory and GCT mechanism, which improved the consumption capacity of renewable energy. Peng, et al. (2020) allocated green certificate quotas based on the entropy weight method and constructed a provincial day-ahead power market clearing model and an international green certificate trading market clearing model. Based on the GCT mechanism (Song, et al., 2018), an IES operation optimization model is proposed that takes into account the weight of renewable energy consumption responsibilities, which improved the proportion of green power and system economy. The aforementioned literature only considers the impact of the CET mechanism or the GCT mechanism on the optimized operation of IES alone and does not study the impact of CET and GCT on the optimized operation of the IES at the same time. It cannot give full play to the low-carbon operating characteristics of the IES to a greater extent.
In response to the aforementioned problems, this paper proposes an IES low-carbon optimization operation model that takes into account the combination of green certificates and ladder-type carbon trading and comprehensive demand response. The main contributions of this article are as follows:
1. Kalina waste heat power generation is added to the source of the comprehensive energy system, CHP’s “heat-based power generation is decoupled, the CHP output range is expanded, and the problem of insufficient CHP output during peak periods of user electricity consumption is solved.”
2. In order to give full play to the adjustment ability of demand-side resources, a price-based and substitution-based comprehensive demand response model is constructed based on the price elasticity matrix principle.
3. The green certificate trading mechanism and the reward and punishment ladder-type carbon trading mechanism are proposed, the carbon emission reduction mechanism of green certificates is discussed, the green certificate-ladder carbon joint trading mechanism is proposed, and a green certificate trading and ladder carbon trading mechanism is constructed in the IES low-carbon operation model.
4. Comparative analysis of the simulation equipment in different scenarios shows that the proposed model can effectively improve the renewable energy consumption capacity and energy utilization efficiency and give full play to the demand-side resources and the green certificate carbon trading mechanism in improving the system economy, and low-carbon effectiveness.
2 Electric–thermal–gas IES equipment model
The architecture diagram of the electricity–heat–gas IES system established in this paper is shown in Figure 1. The electric load in the system is supplied by combined heat and power (CHP), Karina cycle waste heat power generation (Kalina), and the upper-level power grid. The heat load is supplied by the gas boiler (GB) and heat pump (HP). In the system, part of the natural gas flows into the CHP to output electric power to supply the electric load and, at the same time, output heat power and is divided into two parts, one part flows into the Kalina cycle waste heat power generation and the other part directly supplies heat load. The source-measurement Kalina cycle waste heat power generation realizes CHP flexible response to heat and electricity, and the electricity-gas-heat load on the load side forms an ideal electricity consumption orientation for users through comprehensive IDR. The two constitute electricity-heat-gas IDR.
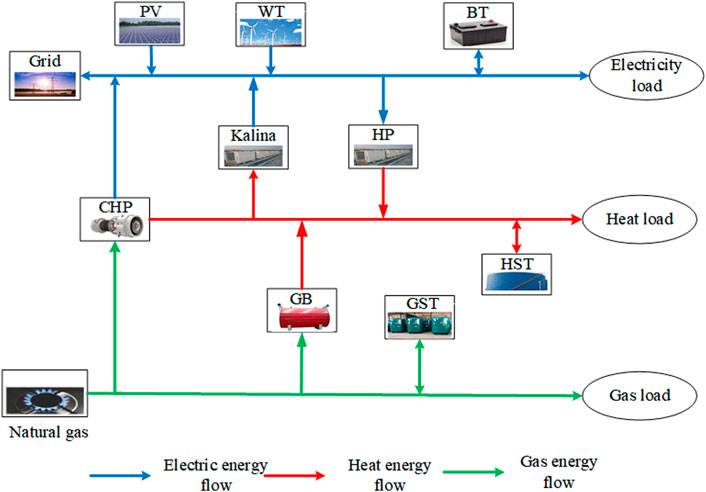
FIGURE 1. IES architecture diagram.
2.1 CHP model
Due to its characteristic of “power determined by heat,” CHP has its operating curve as shown in Figure 2.
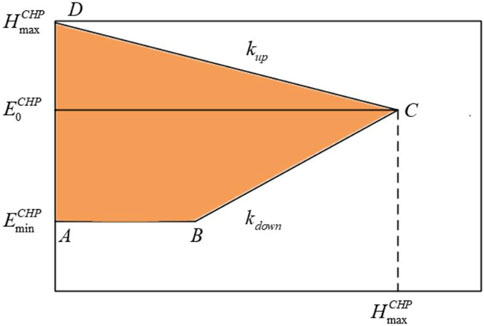
FIGURE 2. CHP thermoelectric coupling output range.
CHP is the main device for power generation and heat generation inside the IES. The block diagram of its thermoelectric coupling output range is shown in Figure 2. The construction model is
In the formula,
2.2 GB model
In the formula,
2.3 HP model
A heat pump is a device that transfers heat energy from a low-level heat source to a high-level heat source. The low-level heat energy in the system can be converted into high-grade heat energy that can be utilized by people through the heat pump. The mathematical model is
In the formula,
2.4 Kalina model
The Karina regenerative power generation system is a system that can use 100°C low-temperature heat energy to generate electricity. Its advantage is that it can convert low-temperature waste heat into electrical energy. The working fluid of the Karina regenerative power generation system is mostly water and ammonia mixture, and no carbide is used in the production process, which is in line with the concept of low-carbon economy. The Kalina model is
In the formula,
2.5 Mathematical model of energy storage equipment
BT, HST, and GST can all be established using similar capacity models, and their operation models can be uniformly expressed as follows. Therefore, this article conducts unified modeling of electric, thermal, and gas energy storage equipment.
In the formula,
3 Electricity–heat–gas IDR
This paper comprehensively considers two types of demand response models, price-based and substitution-based, and constructs a comprehensive demand response model for electricity, heat, and gas loads.
When users on the energy demand side participate in grid interaction, they can change their own energy usage based on energy prices and related incentive mechanisms, thereby optimizing the load curve and improving the operating efficiency of the IES. According to the response characteristics of the load as the basis for division, the load can be divided into basic load, reducible load, transferable load, and replaceable load; among them, the basic load is an uncontrollable load and cannot participate in demand response.
3.1 Price-based demand response
Price-based demand response mainly functions during peak energy consumption periods and aims to influence users’ energy consumption patterns through price factors, that is, users can voluntarily choose whether to reduce energy consumption at this time by comparing prices before and after demand response.
In price-based demand response, the demand price elasticity coefficient is the key coefficient, which describes the sensitivity of the electric load demand participating in the demand response to the adjustment of the system energy price, as shown in the following equation:
In the formula,
In the formula:
According to the electricity price elasticity matrix
In the formula:
Since gas energy has the same commodity attributes as electric energy, gas load can be adjusted based on the published time-of-use gas price. Therefore, the price elasticity matrix method can also be used to model the gas load IDR model. By analogy with the electricity price IDR model, the gas load changes with the time-of-use gas price as shown in Eq. 10, which is expressed as follows:
In the formula:
3.2 Alternative demand response
This article comprehensively considers the mutual substitution among the three loads of electricity, heat, and gas. Users can choose the type of energy that meets their needs for the same energy quality based on the relative price relationship between energy sources. The alternative demand response mathematical model is as follows. When constructing a multi-energy alternative demand response mathematical model, the substitution direction between energy sources needs to be considered. This paper sets the following direction as the positive direction: the electric load is replaced by gas and heat load, and the heat load is replaced by gas load substitution; in addition, the effective value conversion coefficient between energy sources is based on the energy source being replaced.
In the formula,
3.3 Load model considering comprehensive demand response
According to the actual needs of the IES, the allowable load adjustment amount of IDR is constrained; that is, the adjustable load ratio range is given as follows:
In the formula,
4 Ladder carbon trading mechanism model
The CET mechanism is currently the most widely used carbon emission reduction market trading mechanism, which achieves the goal of controlling carbon emissions in the power system through legal trading of carbon emission rights.
The green certificate is the certification of new energy grid electricity by the country, and it is also a certificate for users to consume green electricity. The GCT mechanism is usually combined with the quota system for new energy and electricity, which promotes the consumption and sale of a certain proportion of green electricity by electricity users and power generation enterprises by specifying the minimum proportion of new energy electricity in electricity consumption. Similar to the CET mechanism, the GCT mechanism also plays a guiding role in the market through purchase and sale transactions. When the number of green certificates obtained by the power enterprise exceeds the amount assessed for the weight of consumption responsibility, the excess green certificates can be sold in the green certificate trading market and profits can be obtained. On the contrary, the insufficient green certificates need to be purchased from the green certificate market to meet the assessment requirements. Unlike the CET mechanism, in addition to mandatory participation in the renewable energy quota system as stipulated by policies, GCT also includes the form of partial resource subscription.
Figure 3 shows the analysis of the correlation principle between CET and GCT, with Chinese certified emission reduction (CCER) being the main pathway for the correlation between CET and GCT. From the perspective of emission reduction effects, green certification and CCER can promote carbon reduction through electricity substitution, indicating that they have equivalence and can form a mutual recognition relationship. As described by Wang, et al. (2022), CCER and carbon quotas can be equivalently divided one-to-one. By calculating CCER’s carbon reduction emissions, the green certificate and carbon quota also form a mutual recognition relationship. Therefore, CET and GCT have a certain correlation. After mutual recognition, the cost of purchasing green certificates for traditional power generation enterprises will be significantly reduced, so the enthusiasm for purchasing will also be improved. Although there are certain differences between the CET and GCT markets, both aim to reduce carbon emissions. Therefore, after considering green certification carbon quota certification, the CET and GCT markets have not lost their original significance.
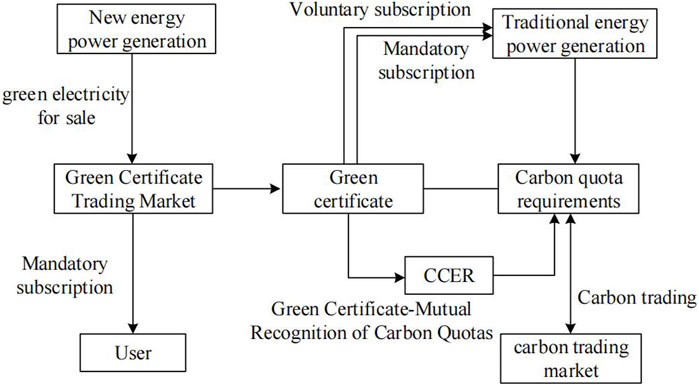
FIGURE 3. Schematic diagram of correlation between CET and GCT.
4.1 Green certificate trading mechanism
Similar to the carbon trading mechanism, the GCT mechanism also utilizes trading to leverage the market’s role in optimizing resource allocation. The calculation formula for the transaction cost of green certificates can be expressed as
In the formula,
This article is based on the Cournot trading model of quantity competition to characterize the green certificate trading price. According to the Cournot model formula, the green certificate trading price model can be expressed as
In the equation,
Among them,
In the formula,
4.2 Carbon emission quota model
The carbon emission sources of the IES are mainly divided into three categories: power purchase from higher authorities, GB, and CHP. At present, the quota method mainly adopted is free quota, and it is believed that the power purchased by the superior comes from the coal-fired unit power generation.
In the formula,
4.3 Actual carbon emission model
Since the coal-fired units, CHP and GB, are not linear in the output process, the actual output model is
In the formula,
We obtain the carbon emission quota and actual carbon emission of the IES and then obtain the carbon emission transaction amount that actually participates in the carbon emission market.
In the formula,
The traditional carbon trading cost is the difference between the actual carbon emissions and the carbon quota allocated without compensation multiplied by the carbon trading price in the market, but its carbon trading price is fixed. Its mathematical model is
In the formula,
4.4 Green certificate carbon trading mechanism
Due to the fact that the carbon reduction of new energy supply can be calculated (Dong and Shi, 2019), green certificate carbon joint trading can be achieved through the green certificate linkage carbon trading mechanism and green certificate trading mechanism. Generally speaking, after considering the green certificate trading mechanism, in the assessment of carbon emission rights, some carbon emissions can be offset by the carbon reduction behind new energy supply, thereby affecting the carbon trading mechanism. At this point, green certificates can participate in both carbon trading and green certificate trading mechanisms and achieve joint interaction between both parties through market guidance on factors such as trading price and demand. The specific steps of the green certificate carbon joint trading mechanism are as follows:
Step 1. Calculating the carbon emissions of the IES: According to Eqs 21–24, we calculate the CO2 emissions of coal-fired and gas-fired units in the IES during use.
Step 2. Analyzing the carbon reduction emissions of the green certificate: Due to the high proportion of coal-fired power generation in China, this article compares the CO2 emissions equivalent generated by coal-fired power generation with new energy power generation to obtain the carbon reduction behind the green certificate. The calculation formula is as follows:
In the formula,
Step 3. Calculating the CET cost after offsetting carbon emissions with new energy. Based on equations Eqs 19–27, since new energy supply offsets a portion of carbon emissions, the actual carbon emissions of the IES can be rewritten as
Compared with the traditional carbon trading pricing mechanism, in order to further limit carbon emissions, this paper uses a stepped carbon trading pricing mechanism. The ladder-type pricing mechanism divides multiple purchase intervals. As more carbon emission rights need to be purchased, the purchase price in the response interval is higher. The step-by-step carbon trading cost is
In the formula,
According to the aforementioned model, the relationship between carbon emissions and carbon trading prices is intuitively expressed in Figure 4.
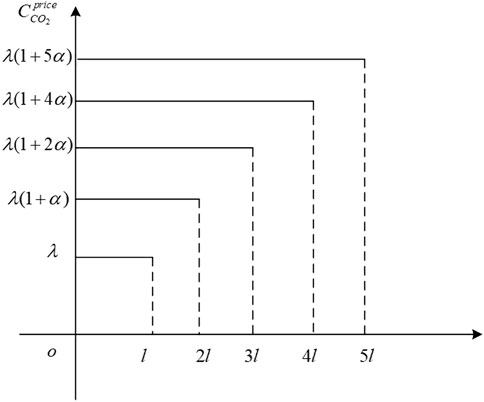
FIGURE 4. Relationship between carbon emissions and ladder carbon trading prices.
5 Electricity–heat–gas IES optimization model
5.1 Objective function
This paper comprehensively considers the energy purchase cost
5.1.1 System energy purchase cost
The energy purchase cost of the IES includes electricity purchase cost and gas purchase cost, which can be expressed as follows:
In the formula,
5.1.2 System operation and maintenance costs
In the formula,
5.1.3 Gas turbine power on and off costs
In order to distinguish the startup cost
After the gas turbine switching action
5.1.4 System penalty for abandoning wind and light
In the formula,
5.1.5 Ladder-type carbon transaction cost shown in (17)
In addition to satisfying the upper and lower limit constraints and climbing rate constraints of each device, the IES also needs to satisfy the power balance constraints.
5.2 Constraint
5.2.1 System electrical power balance
5.2.2 System air power balance
5.2.3 System thermal power balance
5.3 Solution method
The problem addressed in this article is a mixed integer linear programming problem. First, price-based demand response and substitution-based demand response are analyzed to obtain the load curve after demand response. Then, a ladder-type carbon trading mechanism is introduced, and the carbon trading cost under the carbon trading mechanism is as a component of the objective function; finally, under the conditions of satisfying wind power output constraints, energy balance constraints, equipment energy conversion constraints, energy storage equipment constraints, and user satisfaction constraints on electricity consumption, the CPLEX solver is called based on the MATLAB platform to solve the problem. The solution flow chart is shown in Figure 5.
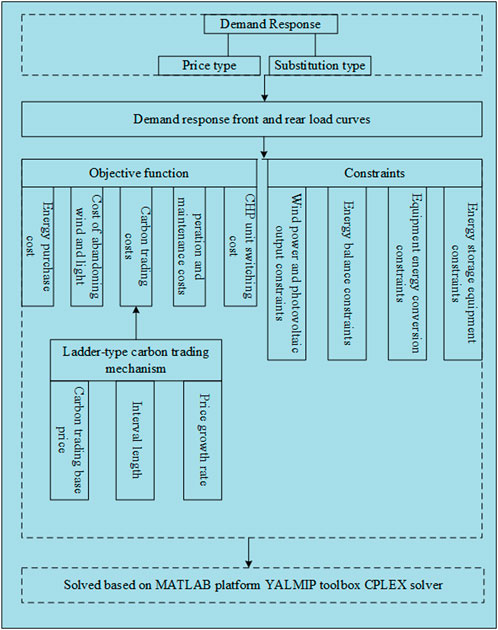
FIGURE 5. Flow chart of the solution.
6 Result analysis
In order to verify the effectiveness of the IES low-carbon economic model proposed in this article in improving system operation economy, reducing carbon emissions, and smoothing the load curve, this article sets 24 h in a single day of the IES as dispatch period
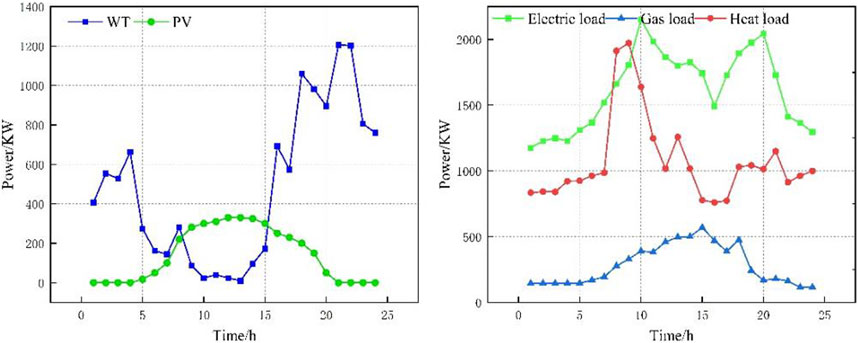
FIGURE 6. Wind and wind forecast value and electrical–heat–gas load forecast value.
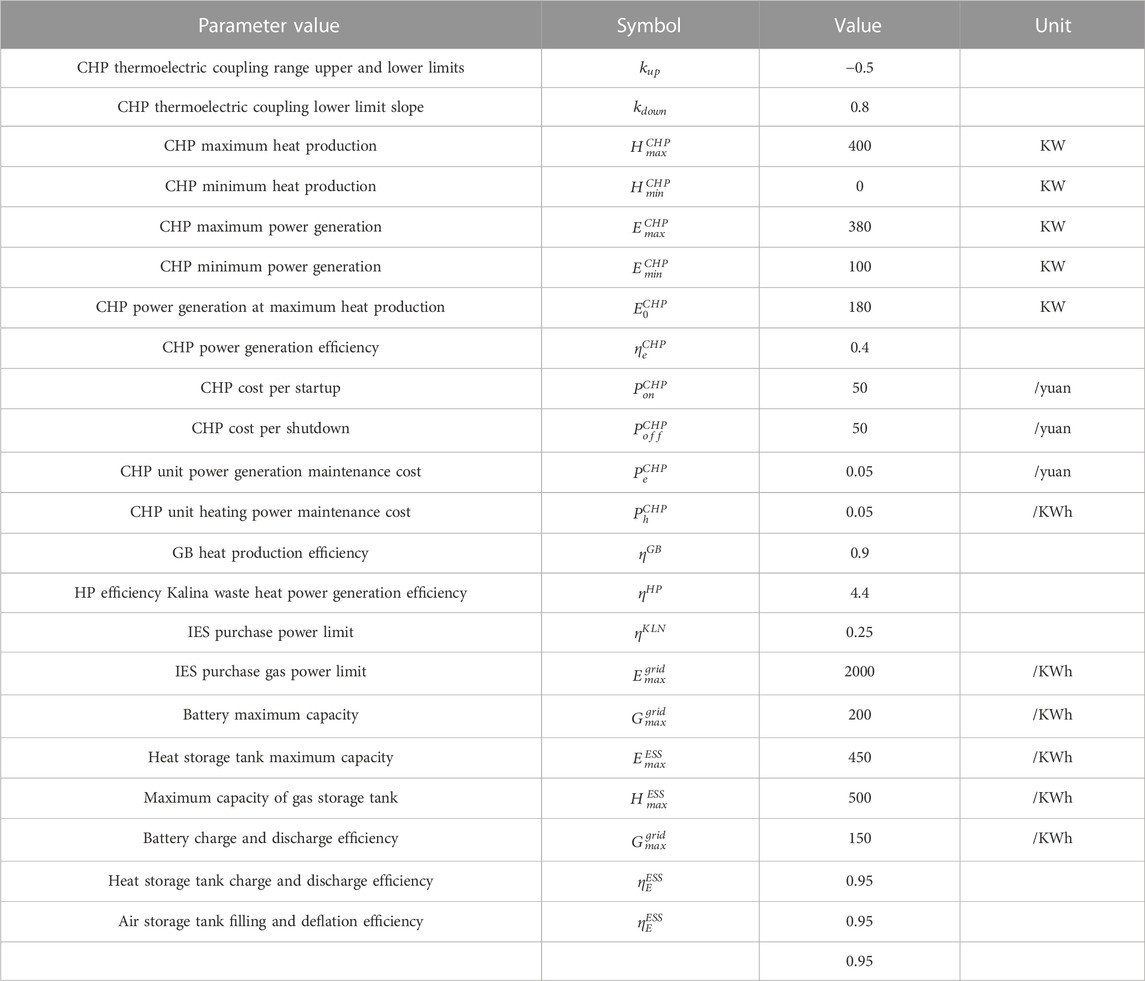
TABLE 1. System parameters.
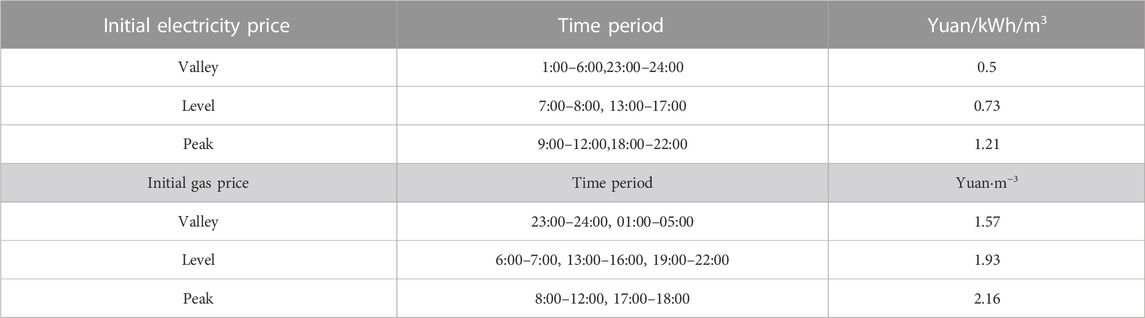
TABLE 2. Initial electricity price and gas price.
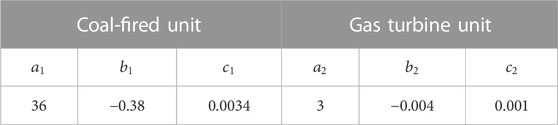
TABLE 3. IES actual carbon emission parameters.
6.1 Benefit analysis of electricity–gas–heat demand response
In order to verify the rationality of the proposed comprehensive IDR model, this paper makes a comparative analysis of the following four scenarios; we set the price-based IDR to account for 15% of the total load and alternative IDR 5% of total load.
Scenario 1: The IES did not introduce a carbon trading mechanism and a demand response mechanism.
Scenario 2: The IES introduces a comprehensive demand response mechanism.
Scenario 3: The IES introduces a comprehensive demand response mechanism and a traditional carbon trading mechanism.
Scenario 4: The IES introduces a comprehensive demand response mechanism and a tiered carbon trading mechanism.
Scenario 5: The IES introduces a comprehensive demand response mechanism and a green certificate carbon trading mechanism.
(1) Comparative analysis of Scenario 1 and Scenario 2
From Table 4, it can be seen that compared to Scenario 2 and Scenario 1, the total cost and carbon emissions of the IES have decreased by 3.8% and 6.9%, respectively. This is because Scenario 1 does not consider demand response strategies, and users cannot adjust their energy consumption load independently. As a result, the IES will bear higher energy purchase costs during periods of high energy consumption, leading to an increase in operating costs. Due to the fact that the load in Scenario 1 has not been transferred or reduced, the carbon emissions in Scenario 1 are also relatively high compared to other scenarios.
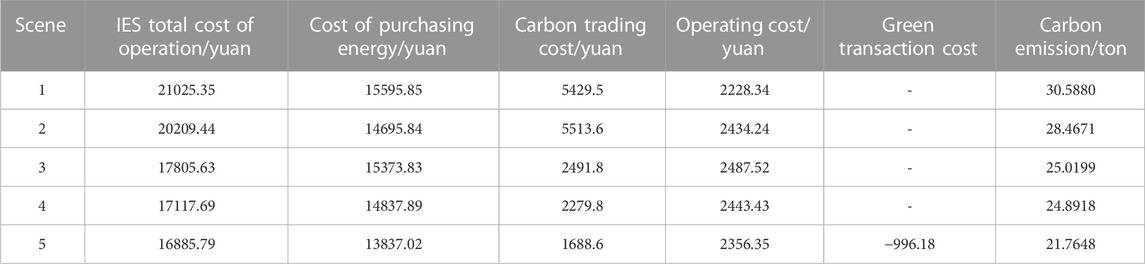
TABLE 4. Cost comparison in different scenarios.
The composition of electricity, heat, and gas loads in Scenario 2 is shown in Figure 7. From Figure 7, it can be seen that compared to the obvious peak valley flat distribution of the original load, the electricity price demand response reduces part of the load during the high electricity price period and transfers part of the load from the high-electricity price period to the low-electricity price period, achieving peak shaving and valley filling of the load, reducing the load during the peak electricity price period, and adding the load during the low electricity price period, making the load curve smoother and increasing the security of the power grid. Alternative demand response can convert some electrical loads into heat or gas loads, while conversely, during peak gas price periods, it can convert electrical or heat loads into gas loads, reducing system operating costs. The combination of price-based demand response and alternative demand response makes the load curve smoother, improves the security of the power grid, and achieves peak shaving and valley filling of the system.
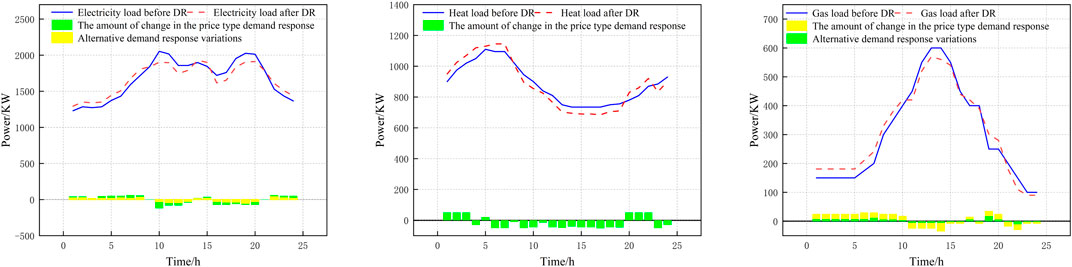
FIGURE 7. Scenario 2 demand response load composition.
The electrical, thermal, and gas outputs of each device in Scenario 2 are shown in Figure 8. From Figure 8, it can be seen that during the low-electricity price period, the system mainly relies on wind power, photovoltaic output, and purchasing electricity from the superior power grid to meet the needs of heat pumps, batteries, and electrical loads, in order to maintain the balance of the system’s electrical power. The system’s thermal load is mainly supplied by heat pumps, gas boilers, and heat storage pipes, achieving the user’s thermal load demand. During the peak electricity price period, the system mainly relies on wind and photovoltaic output, CHP output, and battery discharge to meet user needs, while the heat load is directly obtained by heat storage, heat pump, and CHP. During peak price periods, the system responds to demand by converting a portion of the gas load into electrical or thermal loads, reducing the operating costs of the system.
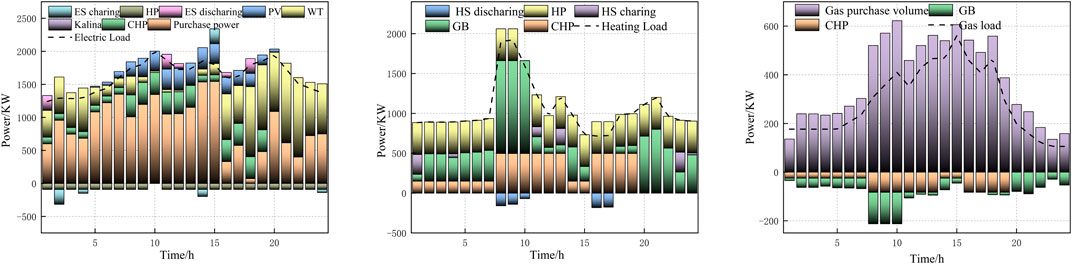
FIGURE 8. Scenario 2 electricity, gas, and heat load balance diagram.
During the low-electricity price period, the operation and maintenance costs of wind power and photovoltaic power are relatively low. The system prioritizes the selection of wind power and photovoltaic output. When wind power and photovoltaic power cannot meet the system’s electricity load demand during this period and the electricity price is low, the cost of purchasing electricity from the superior power grid is lower than the cost of purchasing gas from the superior gas grid. On the other hand, the heating efficiency of heat pumps is higher than that of gas boilers and CHP units, so the system is limited in choosing heat pumps for heating. When the heat pumps cannot meet the system’s heat load demand and the CHP unit output is insufficient, the system uses gas boilers for heating.
During the peak electricity price period, the electricity price is relatively high, and the price of purchasing gas from the superior power grid is more economical than purchasing electricity from the superior power grid. Therefore, at this time, the system mainly meets the system’s electrical and thermal loads through CHP units and gas boilers.
(2) Comparative analysis of scenarios 2, 3, and 4
From Table 4, it can be seen that compared to Scenario 2, the total operating cost of Scenario 3 has decreased by 11.9%, and the carbon emissions have decreased by 12.1%. The specific reason is that Scenario 3 introduces traditional carbon trading costs in the optimization model, and the IES only optimizes the unit output with the goal of maximizing its own interests. The total system cost of Scenario 4 has decreased by 15.3% compared to Scenario 2, and the system carbon emissions have decreased by 12.6%. As shown in Figure 11, during the peak or flat periods of electricity prices from 23:00 to 06:00 and 13:00 to 18:00, the cost of purchasing electricity from the external power grid is lower than that of generating electricity through gas turbines, resulting in a large amount of carbon emissions. For Scenario 4, due to the introduction of carbon trading costs in the optimization model, the IES can sell the surplus carbon quota in the carbon trading market due to its high output of gas turbines. As a result, the IES can obtain certain carbon trading benefits and choose to increase the output power of gas turbines with lower carbon emissions, such as CHP and GB, effectively reducing the total carbon emissions of the system. The system can coordinate the output modes of various units by comparing energy prices at different time periods, thus selecting a more economical and low-carbon operation mode, effectively coordinating the economic and low-carbon operation of the system.
(3) Comparative analysis of Scenario 5 and Scenario 4
Compared to Scenario 4, Scenario 5 further considers the mutual influence between the green certificate trading mechanism and carbon trading; that is, in the assessment of carbon emission rights, carbon emissions can be offset by the carbon reduction behind new energy supply, thereby affecting the carbon trading mechanism. Therefore, it further reduces the carbon emissions of the IES and enhances the enthusiasm of the IES to purchase green certificates, reflecting the low-carbon economy of carbon trading and green certificate joint trading strategies. From the table, it can be seen that compared to Scenario 4, the total cost and carbon emissions of the IES in Scenario 5 have decreased by 1.35% and 12.56%, respectively, verifying the effectiveness of the green certificate carbon joint trading mechanism proposed in this article.
6.2 Demand response sensitivity analysis
The proportion of each type of demand response load affects the implementation effect of system demand response, and the impact of price-based and alternative demand response proportions on system costs is analyzed.
The relationship between the total operating cost and the price-based demand response load ratio is shown in Figure 9.
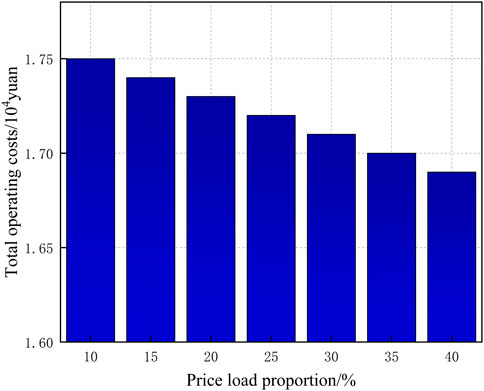
FIGURE 9. Relationship between the total operating cost and the ratio of price-type demand response load.
We set the proportion of price-based demand response to 10%–40% and analyze the impact of price-based demand response on system costs. It can be seen from the figure that as the proportion of price-based demand response increases, the total operating cost of the system decreases; that is, the total operating cost is negatively related to the price-based demand response load. This is because when the total load remains unchanged, increasing the price-based demand response, the proportion of demand response is equivalent to increasing the amount of price-based demand response, which allows users to reduce the load during peak periods of electricity prices and increase the load during trough periods of electricity prices, reducing the system energy purchase cost, thereby reducing the total operating cost of the system.
The relationship between the total operating cost of the system and the proportion of alternative demand response load is shown in Figure 10. It can be seen from the overall figure that when the proportion of price-based demand response is set to 20% and the proportion of substitution-based demand response is increased from 5% to 30%, the total operating cost of the system increases, that is, the total operating cost of the system and the substitution. There is a positive correlation between the load proportion of type demand response, so coordinating the proportion of price-type and substitution-type demand response can help improve operating economy.

FIGURE 10. Relationship between the total operating cost and the ratio of alternative-type demand response load.
6.3 Benefit analysis of the ladder carbon trading mechanism
Different carbon trading mechanism parameters will affect the internal operation of the IES. Most of the existing literature analyzes the impact of different carbon trading base prices on the total system operation cost, and few articles analyze the impact of price growth rate and price range on the total system operation cost. For this reason, we focus on these three parameter pairs the impact of system carbon emissions and total operating costs.
It can be seen from Figure 11 that when the base price of carbon trading is less than 175 yuan/ton, with the increase in the base price of carbon trading, that is, the greater the weight of the cost of the carbon emission objective function, the greater the role of carbon trading costs, the system will reduce the total amount of carbon emissions by more than. This is to reduce the cost of carbon trading, so carbon emissions are reduced; when the base price of carbon trading is greater than 175 yuan/ton, with the increase in the base price of carbon trading, the total amount of carbon emissions will decrease, and the total operating cost of the system will increase. At this time, the output of each piece of equipment in the system tends to be stable, and the base price of carbon trading increases, resulting in an increase in the total cost of the system.
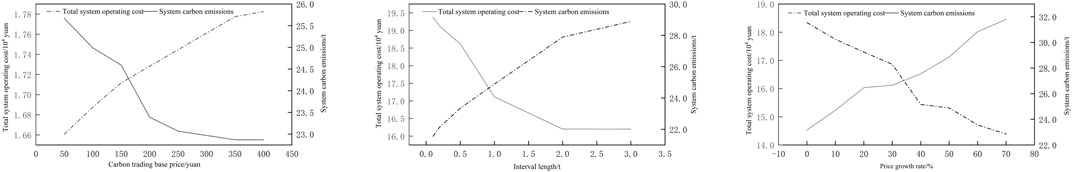
FIGURE 11. Effects of different carbon trading mechanism parameters on the IES.
When the interval length is in the range of (0, 0.75) t, the total operating cost of the system decreases with the increase in the interval length at this time because the system interval length is small at this time, and the carbon transaction cost of the system is very high, so the carbon emission of the system is reduced. When the interval length is greater than 0.75 t, the interval length is relatively large at this time, and the high-order carbon emissions purchased by the system are less, so the carbon transaction cost of the system is smaller. When the carbon trading range is greater than 2.0 t, the carbon trading range has little impact on the carbon emissions of the system, and the carbon emissions tend to be stable. With the increase in the range length, the cost of carbon trading in the system will gradually decrease, and the total cost will stabilize.
When the price growth rate is (0,0.35), at this time, with the increase in the price growth rate, the total carbon emissions of the system will decrease, the carbon trading price will also decrease, and the system will automatically adjust the output of each equipment to reduce carbon emissions, but due to the existence of fixed load in the system, when the price growth rate is (0.35,0.7), the carbon emissions tend to be stable, and the change of carbon emissions also tends to be stable; with the increase in the price growth rate, the carbon transaction cost increases, and the total operating cost of the system increases.
According to the aforementioned analysis, when the base price of carbon trading is 175 yuan/ton, the carbon emission reduction of the IES reaches the minimum. At this time, the price factor will not make the system continue to reduce carbon emissions, but will only increase the total cost of the system. When the interval length is less than or equal to 0.75 t, the carbon emission of the system is the smallest, but when the interval length is greater than 0.75 t, the carbon emission of the system tends to be stable, and the total cost of the system also tends to be stable. Similarly, when the price growth rate is greater than 0.75, the carbon emissions of the system tend to be stable. At this time, increasing the price growth rate will only increase the total operating cost of the system. Therefore, setting appropriate ladder-type carbon trading parameters can reasonably guide the system’s carbon emissions.
7 Conclusion
The low-carbon optimal operation strategy of the electric–gas–thermal IES proposed in this paper considering multi-type IDR verified the effectiveness of the method by setting different scenarios, and the following conclusions can be drawn:
• Considering the price-type and substitution-type IDR, compared with a single type of IDR, it realizes the vertical and horizontal substitution and complementarity of various loads, which has a significant effect on load shifting and valley filling, and reduces the total cost of the IES and carbon emissions.
• Coordinating the ratio between price-based IDR and substitution-based IDR is conducive to improving the economy of system operation.
• Considering that IES participation in the CET mechanism and GCT mechanism can reduce carbon emissions and costs, the introduction of a stepped carbon trading mechanism is more restrictive than the traditional carbon trading mechanism. Setting reasonable carbon trading parameters can guide the effect of system carbon emission reduction.
Data availability statement
The raw data supporting the conclusion of this article will be made available by the authors, without undue reservation.
Author contributions
XJ: methodology, project administration, and writing–review and editing. ML: conceptualization, methodology, and writing–original draft. ML: conceptualization and writing–original draft. HH: formal analysis and writing–review and editing.
Funding
The authors declare financial support was received for the research, authorship, and/or publication of this article. This project was funded by Jilin Province’s “Land Scenery Three Gorges” high-quality development major science and technology project-park-level multi-microgrid system participating in key technology research projects for grid-friendly interaction (Project Number 20230303003SF).
Conflict of interest
The authors declare that the research was conducted in the absence of any commercial or financial relationships that could be construed as a potential conflict of interest.
Publisher’s note
All claims expressed in this article are solely those of the authors and do not necessarily represent those of their affiliated organizations, or those of the publisher, the editors, and the reviewers. Any product that may be evaluated in this article, or claim that may be made by its manufacturer, is not guaranteed or endorsed by the publisher.
References
Chen, C., et al. (2018). Analyzing the carbon mitigation potential of tradable green certificates based on a TGC-FFSRO model: a case study in the Beijing-Tianjin-Hebei region, China. Sci. Total Environ., 630. doi:10.1016/j.scitotenv.2018.02.103
Chen, H., et al. (2021). Low-carbon optimal scheduling of a power system source-load considering coordination based on carbon emission flow theory. Dianli Xit. Baohu yu Kongzhi/Power Syst. Prot. Control 49 (10).
Cui, Y., et al. (2021). Low-carbon economic dispatch of electricity-gas-heat integrated energy system based on ladder-type carbon trading. Dianli Zidonghua Shebei/Electric Power Autom. Equip. 41 (3).
Dong, F., and Shi, L. (2019). Design and simulation of renewable portfolio standard and tradable green certificate mechanism. Dianli Xit. Zidonghua/Automation Electr. Power Syst. 43 (12).
Guo, Z., Li, G., Zhou, M., and Feng, W. (2019). Resilient configuration approach of integrated community energy system considering integrated demand response under uncertainty. IEEE Access 7, 87513–87533. doi:10.1109/access.2019.2924828
Lv, G., Cao, B., Jun, L., Liu, G., Ding, Y., Yu, J., et al. (2022). Optimal scheduling of integrated energy system under the background of carbon neutrality. Energy Rep. 8, 1236–1248. doi:10.1016/j.egyr.2022.02.295
Ma, Y., et al. (2021). Modeling and optimization of combined heat and power with power-to-gas and carbon capture system in integrated energy system. Energy, 236. doi:10.1016/j.energy.2021.121392
Mehrjerdi, H., Saboori, H., and Jadid, S. (2022). Power-to-gas utilization in optimal sizing of hybrid power, water, and hydrogen microgrids with energy and gas storage. J. Energy Storage 45, 103745. doi:10.1016/j.est.2021.103745
Peng, Q., Zhou, X., and Yang, R. (2020). Design of coordination and balance mechanism between national green power certificate trading market and provincial day-ahead power market. Dianwang Jishu/Power Syst. Technol. 44 (7).
Qiu, J., Dong, Z. Y., Zhao, J. H., Meng, K., Zheng, Y., and Hill, D. J. (2015). Low carbon oriented expansion planning of integrated gas and power systems. IEEE Trans. Power Syst. 30 (2), 1035–1046. doi:10.1109/tpwrs.2014.2369011
Sheng, S., et al. (2023). Multi-energy collaborative optimization scheduling of integrated energy system considering integrated demand response. Dianli Zidonghua Shebei/Electric Power Autom. Equip. 43 (6).
Song, Y., Wang, Y., and Yi, J. (2018). Microgrid energy source optimization planning considering demand side response and thermo-electrical coupling. Dianwang Jishu/Power Syst. Technol. 42 (11).
Wang, J., Zhong, H., Ma, Z., Xia, Q., and Kang, C. (2017). Review and prospect of integrated demand response in the multi-energy system. Appl. Energy 202, 772–782. doi:10.1016/j.apenergy.2017.05.150
Wang, L., Dong, H., Lin, J., and Zeng, M. (2022). Multi-objective optimal scheduling model with IGDT method of integrated energy system considering ladder-type carbon trading mechanism. Int. J. Electr. Power Energy Syst. 143, 108386. doi:10.1016/j.ijepes.2022.108386
Wang, W. W., et al. (2021). Current situation and future prospect of carbon emission control in China. Xiandai Huagong/Modern Chem. Ind. 41 (2).
Wang, Y., et al. (2019). Planning and operation method of the regional integrated energy system considering economy and environment. Energy, 171.
Wei, Z., et al. (2022). Optimized operation of integrated energy system considering demand response under carbon trading mechanism. Dianli Jianshe/Electric Power Constr. 43 (1).
Wu, M., Xu, J., Li, Y., Zeng, L., Shi, Z., Liu, Y., et al. (2023). Low carbon economic dispatch of integrated energy systems considering life cycle assessment and risk cost. Int. J. Electr. Power Energy Syst. 153, 109287. doi:10.1016/j.ijepes.2023.109287
Yang, J., Zhang, N., Cheng, Y., Kang, C., and Xia, Q. (2019). Modeling the operation mechanism of combined P2G and gas-fired plant with CO2 recycling. IEEE Trans. Smart Grid 10 (1), 1111–1121. doi:10.1109/tsg.2018.2849619
Keywords: integrated energy system, integrated demand response, green certificate-carbon trading mechanism, demand response sensitivity, ladder carbon trading mechanism parameters
Citation: Ji X, Li M, Li M and Han H (2023) Low-carbon optimal operation of the integrated energy system considering integrated demand response. Front. Energy Res. 11:1283429. doi: 10.3389/fenrg.2023.1283429
Received: 26 August 2023; Accepted: 13 November 2023;
Published: 28 November 2023.
Edited by:
Bidyadhar Subudhi, Indian Institute of Technology Goa, IndiaReviewed by:
Srinvasa Rao Gampa, Seshadri Rao Gudlavalleru Engineering College, IndiaZhengqi Wang, Nanjing Institute of Technology (NJIT), China
Copyright © 2023 Ji, Li, Li and Han. This is an open-access article distributed under the terms of the Creative Commons Attribution License (CC BY). The use, distribution or reproduction in other forums is permitted, provided the original author(s) and the copyright owner(s) are credited and that the original publication in this journal is cited, in accordance with accepted academic practice. No use, distribution or reproduction is permitted which does not comply with these terms.
*Correspondence: Meng Li, MTg1Njk4OTY4MDNAMTYzLmNvbQ==