 Yihua Zhu1,2
 Ren Liu
- 1State Key Laboratory of HVDC, Electric Power Research Institute, China Southern Power Grid, Guangzhou, China
- 2National Energy Power Grid Technology RD Centre, Guangzhou, China
- 3Guangdong Provincial Key Laboratory of Intelligent Operation and Control for New Energy Power System, Guangzhou, China
- 4CSG Key Laboratory for Power System Simulation, Electric Power Research Institute, China Southern Power Grid, Guangzhou, China
Existing False data injection attack (FDIA) detection methods based on measurement similarity testing have difficulty in distinguishing between actual power grid accidents and FDIAs. Therefore, this paper proposes a detection method called the measurement-eigenvalue residual similarity (MERS) test, which can accurately detect FDIAs in AC state estimationof power system and effectively distinguish them from actual power grid accidents. Simulation results on the IEEE 39-bus system demonstrate that the proposed method achieves higher detection rates and lower false alarm rates than traditional methods under various operation conditions.
1 Introduction
State estimationis an important component of supervisory control and data acquisition (SCADA) systems in power systems. It can accurately estimate the true operating conditions of the system based on the real-time operating status information and network topology information collected by remote terminal units (RTUs), providing a foundation for system analysis such as optimal power flow and bad data detection (Ericsson, 2010; Feng et al., 2023).
False data injection attack (FDIA) is a type of network attack on power system state estimation, which was first proposed by Liu et al. (2011). The paper considers two different attack scenarios: one assumes that the attacker has complete knowledge of the system parameters, while the other assumes that the attacker is limited by the resources required to damage certain specific instruments. Subsequently, many scholars have conducted extensive research on FDIA.
In the early stage, to simplify the computational difficulty and improve the accuracy of FDIA detection, scholars usually used FDIA based on the DC power flow model for experiments. However, in practice, the power industry has adopted a nonlinear state estimator with a complete AC power flow model (Abur and Exposito, 2004; Xiahou et al., 2020; Chen et al., 2023), so it cannot be guaranteed that the FDIA detection method based on the DC model has equivalent performance under the nonlinear AC state estimation (Zhao et al., 2018; Tiande et al., 2023). Therefore, to solve the limitations of the DC model, a large number of scholars have started researching on FDIA detection and prevention based on the AC power flow model (Chaojun et al., 2015; He et al., 2017; Zhang Y. et al., 2020). Currently, the research on FDIA detection technology can be roughly divided into three categories: detection methods based on state estimation (Coluccia et al., 2013; Chen et al., 2020; Liu et al., 2022), trajectory prediction (Yang et al., 2019), and artificial intelligence (Jena et al., 2021). FDIA also poses a significant threat to the security of the electricity market, and research has developed detection methods based on the critical load level (CLL) concept to help operators identify risk periods (Zhang Q. et al., 2020). There is also research on the monitoring and response mechanisms in learning-based collaborative FDIA, proposing a real-time FDIA detection method and a re-evaluation mechanism with penalty schemes, which can detect the initiation of learning-based collaborative FDIA (Jiang et al., 2020). In response to the characteristics of power grid systems with large data redundancy, some scholars have proposed a multi-source self-attention data fusion model, which uses time alignment technology to integrate the collected multi-source remote sensing data into the same time dimension. Subsequently, a symmetric hybrid deep network model was established to detect FDIA by symmetrically combining long and short durations (Wu et al., 2023).
However, these methods have limitations. For example, for methods that rely on secure PMUs, the fundamental assumption that a specific set of PMUs is completely invincible may not always hold true (Zhao et al., 2018). In addition, for machine learning-based detection methods, if false data does not significantly deviate from historical trends, the detection performance may not be satisfactory. As for the measurement consistency verification, how to accurately distinguish FDIA from actual power accidents is still an urgent problem to be solved.
In order to deal with the aforementioned problems, this paper proposes a detection method called the measurement-eigenvalue residual similarity (MERS) test. The rest of this paper is structured as follows: Section 2 introduces the construction principles of FDIA and the basis and methods for constructing imperfect FDIA under practical conditions Section 3 elaborates in detail on the FDIA detection method proposed in this article Section 4 conducted simulation verification on the content of Section 2 and Section 3. Section 5 is the conclusion of the paper.
2 FDIA constrction strategies
2.1 Bad data detection module
During the entire process of collection, transmission, and exchange of measurement data, it is impossible to ensure that all data is accurate, but there may be data damage or deviation caused by equipment or network reasons. Therefore, it is necessary to detect and identify measurement data, using a large number of normal redundant measurements and mathematical processing methods to detect defective data. Based on the results of WLS SE, conventional bad data detection methods such as chi-square test, weighted residual (WR) test, and largest normalized residual (LNR) test are commonly used.
The LNR test is a widely used method for detecting bad data. The core is to normalize the measurement residuals.
where zi is the i-th measurement;
For the i-th normalized residual
Compared to the chi-square test, the WR test is not affected by the system size compared to the LNR test. In terms of detection sensitivity, when the redundancy of equivalent measurement is high, both WR test and LNR test have excellent inspection results. Generally, the effectiveness of the LNR test is not inferior to that of the WR test. However, the LNR test requires complex calculations and incurs more computational costs. However, the LNR test method can identify which data is most likely to be bad, laying the foundation for identifying bad data.
The chi-square test, WR test, and LNR test are usually effective for detecting natural defect data, which can cause significant measurement residual disturbances. However, for maliciously designed false data, these methods are often ineffective and only cause small residual disturbances.
2.2 FDIA construction principle
The biggest difference between AC state estimation and DC state estimation is the nonlinearity of the problem. However, based on the AC state estimation model, the conclusion from DC state estimation can still be applied when launching a false data injection attack on a specific state variable-the measurement Jacobian matrix
Therefore, in order to launch a false data injection attack in AC state estimation, the attacker must know the values of other state variables that are related to the target state variable at the current time, in addition to satisfying the two conditions for DC false data injection attacks. This further increases the difficulty of launching AC-based FDIA in practice.
Assuming that the attacker has access to real-time state estimation, network topology, and parameter information, they can launch a perfect FDIA, where the attack vector a is designed as follows
where z is the measurement vector;
Reference (Liu et al., 2011) has shown that in the case where the state, parameter, and network information is completely leaked, the attack vector a constructed according to Eq. 4 can produce the same measurement residual vector as that without the attack. Therefore, false data can evade conventional detection methods such as chi-square, weighted residual, and likelihood ratio tests. However, it is difficult to achieve a perfect attack vector, and the specific reasons will be discussed in detail in the next section. Nevertheless, if the attacker can create an attack vector that is close enough to Eq. 4, such that the perturbation of the residual vector remains below the threshold of bad data detection, there is still a high chance that imperfect FDIA can bypass bad data detection and cause misjudgment and incorrect actions by the control center.
2.3 Imperfect FDIA construction strategy
Based on the analysis of the FDIA attack principle in the previous section, it can be inferred that it is difficult for network attackers to achieve perfect FDIA against AC state estimation. Therefore, this study is based on the assumption that AC-based FDIA is difficult to implement in reality, especially since attackers are unlikely to obtain accurate real-time state estimation and accurate model parameters, particularly real-time state estimation. The specific assumptions are as follows:
(1) Firstly, network parameters and state estimation are stored in the database of the control center, which is relatively well protected. For attackers, it is more difficult to enter the control center than the substation-level network due to communication or technical limitations.
(2) Even if the attacker gains accurate network parameters by invading the control center, it is still difficult to obtain accurate state estimation. Due to the real-time fluctuations of the load, the power flow is time-varying. Therefore, the latest state estimation is necessary for a perfect AC-based FDIA. However, once the FDIA is started, the state estimation of the control center will be biased.
(3) Attackers also need to consider the cost factor when designing the FDIA vector. Generally, the more perfect the FDIA requires modification of data, the greater the difficulty and cost of injecting the attack vector. Under cost constraints, attackers usually consider the minimum number of measurements to be tampered with to ensure that the attack is not detected, as well as how to choose these measurements. This also makes AC-based FDIA still imperfect.
(4) The attacker’s state estimation function should be executed at the same time resolution (every 2–3 s) as the SCADA measurement, to determine how to operate the measurement perfectly. However, this is almost an impossible task for attackers because it depends on the availability of real-time measurements and powerful computing capabilities, which are not available to attackers. Note that it does not require an accurate latest estimation to start a perfect DC-based FDIA. However, almost all existing state estimators in the control center are based on AC, and it does require an accurate latest state estimation to start AC-based FDIA.
As it is almost impossible to meet all the above conditions simultaneously, it can be reasonably assumed that AC-based FDIA is imperfect. Consider an imperfect AC-based FDIA as follows:
where
The derivation of the measurement residual vector based on imperfect AC FDIA is given as follows
where
The state estimation vector can be represented as
where η is the state estimation error vector of the system operator. Note that η and ξ are different because the model parameters obtained by the attacker are inaccurate.
Using to represent the measurement residual deviation vector caused by FDIA based on imperfect AC as:
In this case, the probability density function of imperfect FDIA measurement residuals is different from that of measurement residuals without FDIA. Such subtle differences may not trigger traditional LNR or chi-square tests, but it is possible to design more specialized and refined tests to discover them.
3 Proposed FDIA detection method
3.1 Measurement value similarity
In this section, a cosine similarity ratio detection method is proposed. Specifically, the proposed method utilizes the ratio of the cosine similarity between the actual measured values and the state estimation values of the power system at two different time instants as the detection index. When the system is operating normally without FDIA, the cosine similarity ratio between the two will remain relatively stable. However, when the system is under FDIA, the cosine similarity ratio will experience a sudden change, which can be used to detect the presence of FDIA.
The FDIA detection method based on measurement values proposed in the article is based on state estimation measurement data. It is not fixed to individual or determined measurement values, but rather focuses on global measurement data, including active and reactive power measurements of power branches, voltage amplitude and phase angle measurements of generators or bus nodes, and generator output force measurements.
Firstly, in the process of state estimation, the estimated measurement value
Similarly, the cosine similarity between the actual and estimated measurement values at the initial time instant can be computed as
where z1 represents the measurement vector and
The measurement values at initial time 1 are chosen to be taken when the system reaches a steady-state condition. Under steady-state conditions, the variations in system variables such as voltage and current reach their minimum values, thus providing a more reliable baseline.
If there are no FDIA in the system, the cosine similarity values should approach 1 due to the stable operation of the system. However, if FDIA occurs at time k in the power system, the injected attack sequence will immediately cause a measurement increment. The size of the actual measurement value zk will experience a sudden change, which can be denoted by a variable b. Therefore, the new cosine similarity value can be expressed as
where
The cosine similarity between the actual and estimated measurement values after the FDIA can be calculated as
where
The value of
where
Assuming that the system is safe and reliable before time k, when an attack occurs and the attack vector is injected, it will cause a sudden change in the actual measurement value, leading to a change in the value of
The threshold for detecting FDIA can be set based on a large amount of historical data collected during normal operation of the system. The calculation formula for the threshold can be expressed as follows
where l>0,
The specific steps of the detection algorithm are shown in Table 1.
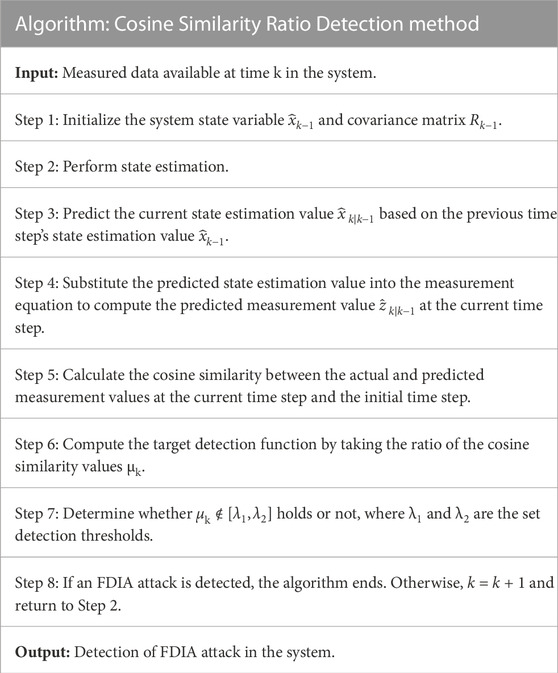
TABLE 1. Operation steps of cosine similarity ratio detection method.
3.2 Eigenvalue residual similarity test
One of the limitations often raised in the FDIA detection method based on measurement data is that it cannot be distinguished from actual power grid accidents because actual power grid accidents can also cause measurement deviations, which may lead to false positives in the FDIA detection method based on measurement data, resulting in incorrect judgments by the control center.
When a power grid actual accident occurs, the measurement values will be perturbed and deviate from the normal level, changing from zk to zk′. According to Eq. 10, the cosine similarity between the current estimated measurement and the actual measurement is
where cosk′ represents the cosine similarity between the actual (after actual power accident) and estimated measurement at time k; μk′ denotes the ratio of measurement cosine similarity between time k (after actual power accident) and initial time.
Assuming that the system is safe and reliable before the power grid failure at time k, i.e., the system state estimation value
Therefore, in Section 4, the cosine similarity ratio detection algorithm for FDIA detection was extended by adding an eigenvalue residual similarity test to distinguish between actual power accidents and FDIA.
As mentioned in Section 3.1, the construction of a perfect AC FDIA based on complete state information and network structure data can achieve high consistency in residual similarity. However, in the construction of imperfect AC FDIA, attackers cannot obtain exact real-time state estimation and model parameter data, resulting in defects in residual similarity of the constructed imperfect AC FDIA vector. However, due to the cost constraints of imperfect FDIA, it will choose to manipulate as little data as possible, thereby maintaining high similarity in some residual characteristic values.
At the same time, the measurement data anomalies caused by actual power grid accidents have randomness and irregularity, and the similarity between the measurement residual data calculated from abnormal measurement data and the measurement residual data without attack is very low, which is opposite to FDIA Therefore, in the FDIA detection scheme designed in the previous section, a n eigenvalue residual similarity test was added to effectively distinguish between FDIA and actual power grid accidents. The detection process is shown in Figure 1.
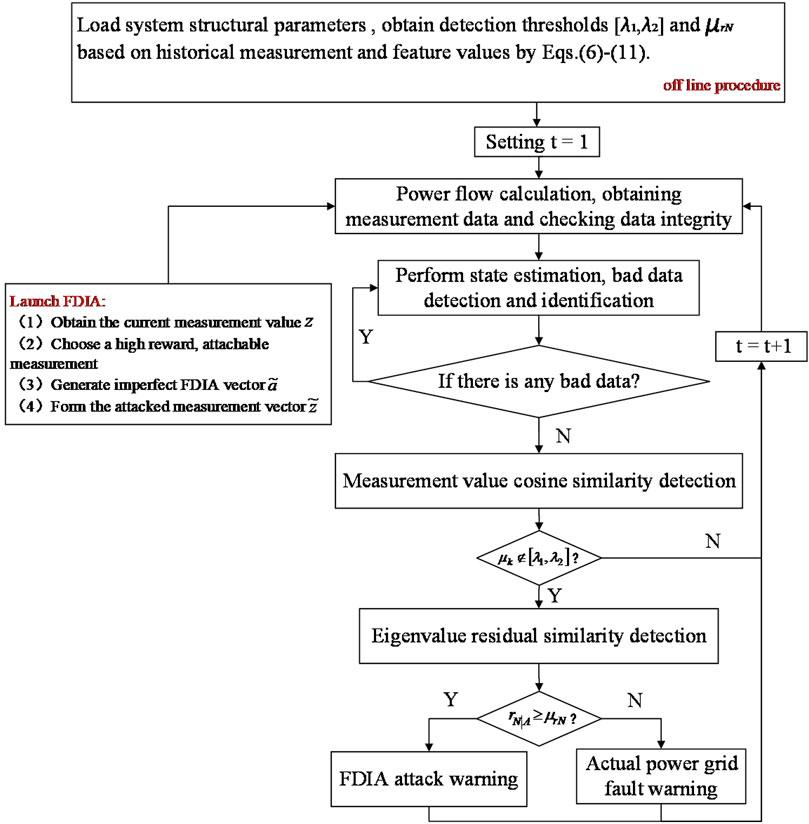
FIGURE 1. Flow chart of the MERS test.
The data used for the eigenvalue residual similarity test is the largest normalized residual (LNR). The sensitivity of LNR to a single residual perturbation provides a good foundation for the identification of FDIA. The similarity algorithm used in the test is still the cosine similarity algorithm used in the detection algorithm, which is given as follows
where rN represents the eigenvalue LNR before the attack,
When an actual power grid failure occurs, due to the irregular and abnormal fluctuations of the measurement, the overall similarity of the characteristic values of
4 Simulation results
4.1 Effects of false data injection attacks
To verify the effectiveness of the proposed detection algorithm proposed above, in this section, the matpower 7.0 simulation package is used to perform power flow calculation on the load data of the IEEE-39 bus standard test system. The single-line diagram of the test system is shown in Figure 2.
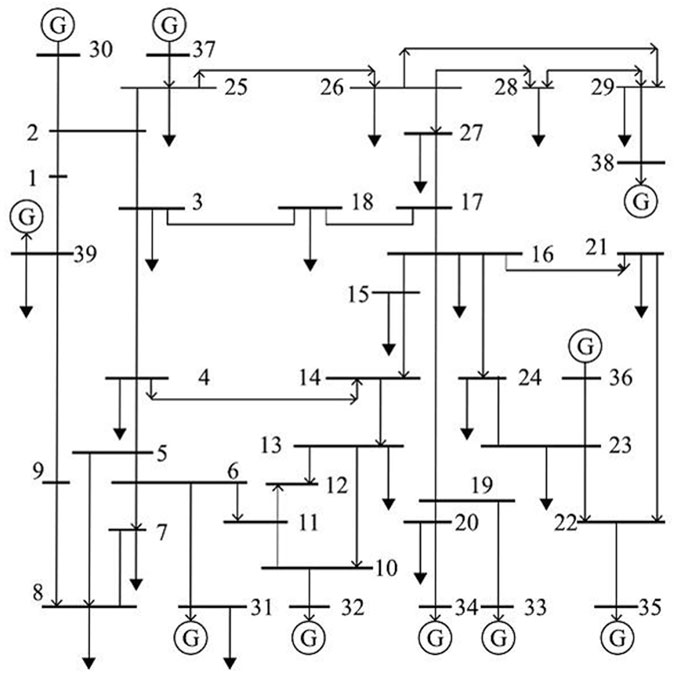
FIGURE 2. IEEE-39 bus test system single line diagram.
The data is processed as follows: First, perform power flow calculation on the existing system data to obtain the various measurement data of the current system. Secondly, simulate PMU measurement data, and add additive noise following a Gaussian distribution with a mean of 0 and a variance of 0.01 during the measurement process to simulate the influence of measurement random errors on the detection process. Finally, at a specified time, generate the attack vector for the specified measurement value using the method described in Section 2, and add it to the sensor measurement.
Firstly, the state estimation algorithm of the IEEE-39 bus system under normal operation should be validated. Taking the generator voltage amplitude and phase angle data as an example, the comparison between the estimated values and the actual values is shown in Figure 3. It can be seen that the state estimation algorithm has high accuracy in estimation performance.
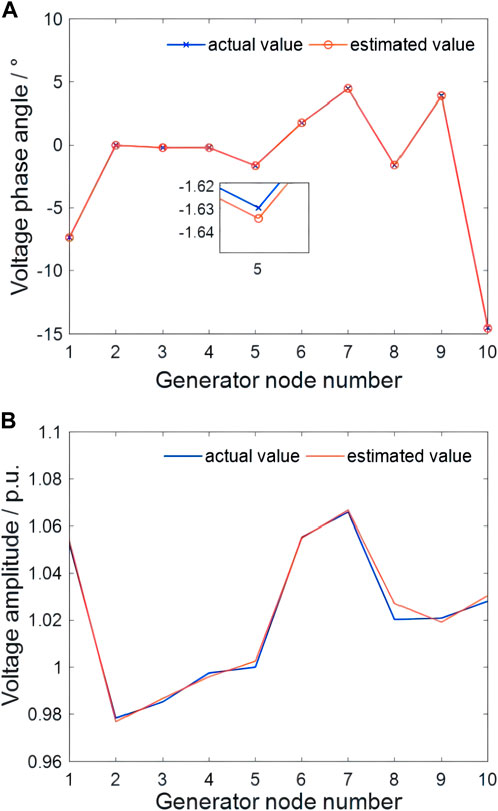
FIGURE 3. Accuracy test of (A) generator node voltage phase angle estimation and (B) voltage amplitude estimation.
Figure 4 shows the results of the bad data detection based on the LNR residual detection method. When the significance level is 0.05 and the degree of freedom is K = m − n = 122 − 77 = 45 (n is the number of states, m is the number of observations), the test p-value is 2.81. The blue line represents the residual distribution under normal conditions, the yellow line represents the residual distribution under the FDIA, and the red line represents the bad data detection threshold. It can be seen that although the carefully designed FDIA causes changes in the residual within a certain range, the fluctuation amplitude is not large and cannot exceed the test p-value. Therefore, the FDIA can bypass the bad data detection and identification process with a certain amount of redundancy, which indicates the reasonableness and feasibility of the FDIA setting in section III and provides assurance for subsequent research.
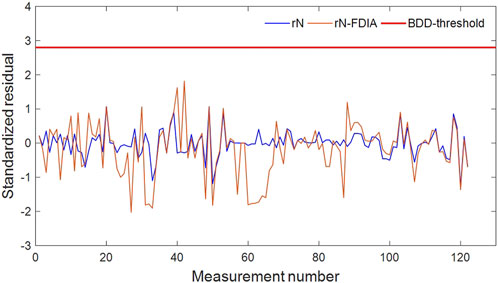
FIGURE 4. Simulation of bad data detection for FDIA.
4.2 Effectiveness of proposed methods
Before verifying the effectiveness of the detection algorithm, in order to better approximate the actual operating state of the power grid, load fluctuation simulation was added to the experiment. The load fluctuated with a random probability of ±1% in each simulation, with the aim of improving the accuracy and robustness and making the detection algorithm more universal.
In this section, the performance of the cosine similarity ratio detection algorithm based on measurement values is validated. As mentioned earlier, the detection indicator is the ratio of cosine similarity between the actual and estimated measurement values at two time instances. This experiment takes state estimation, bad data detection, and FDIA detection as a time cycle (approximately 2–3 s), eliminating subsequent steps such as local protection and recovery control, focusing only on the FDIA detection process and simplifying the overall process. Therefore, a 50 min simulation experiment is conducted on the system, and three different types of FDIA are launched in the 5th, 10th, and 15th minutes. Actual power accident events are added as references in the 35th, 40th, and 45th minutes. The specific event types are shown in Table 2 and Figure 5 shows the simulation results of cosine similarity ratio detection.
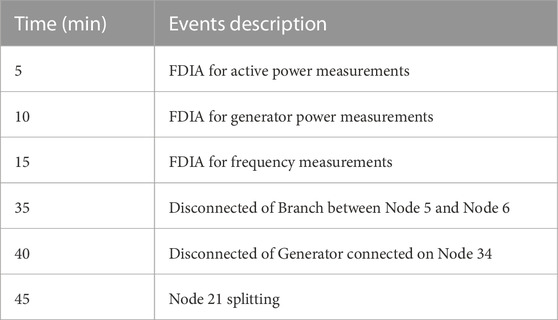
TABLE 2. List of events at different times in simulation.
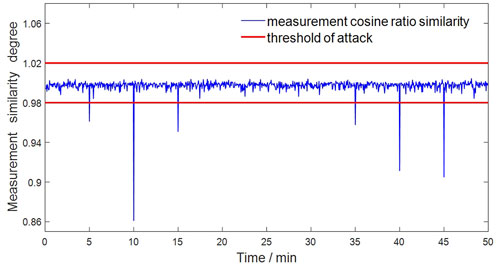
FIGURE 5. The proposed FDIA detection method effectiveness test.
In Figure 5, in the FDIA experiment launched within the first 30 min, it can be clearly seen that before the injection of false data, the value of μk tends to remain close to 1. Among them,
However, in the FDIA experiment of the last 20 min, the occurrence of the actual power accident will also lead to a significant decline in the similarity ratio of measurement, which is also one of the common problems of the detection algorithm based on the power grid data mentioned above.
In summary, after injecting FDIA, the similarity immediately significantly decreases and falls below the detection threshold, which can trigger an attack alert. However, data anomalies caused by actual power accidents can also lead to this. Therefore, the complete MERS algorithm will demonstrate in the next section how to distinguish FDIA from actual power accidents.
4.3 Distinguishing from actual power accident
The proposed method for distinguishing between FDIA and actual power accidents based on MERS test was validated for its effectiveness in this section.
The selected eigenvalue residuals were obtained based on the principle of constructing imperfect FDIA, and the attack vector of imperfect FDIA could be obtained using Eq. 7. From this principle, the unmodified measurement part could be deduced. In this experiment, three different types of FDIAs were designed, and the specific types are shown in Table 2. Taking the first type of FDIA, which injects false data of branch active power, as an example, Eq. 8 indicates that this attack mainly causes active power deviation by modifying the reactive power and voltage phase angle of the line, and the generator output power can be used for eigenvalue measurement. The complete detection system contains a complete program that includes eigenvalue checks for various types of FDIA.
Figures 6, 7 are the results of MERS tests for the selected eigenvalue. Three types of FDIA and three types of actual power accidents correspond to the events in Table 2. It is apparent that the attack warning caused by FDIA is much higher than that caused by actual power accidents in terms of eigenvalue residual similarity. From Figure 6, it can be seen that the similarity differences caused by FDIA launched for different measurement data are significantly different. The tampering attack against active measurement values needs to be modified to more necessary measurement values, resulting in a much lower similarity compared to the other two FDIAs.
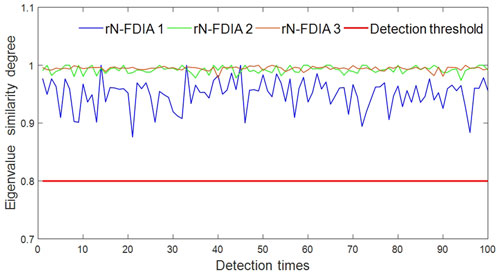
FIGURE 6. The proposed MERS test of FDIA.
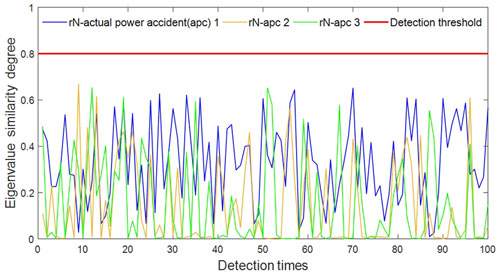
FIGURE 7. The proposed MERS test of actual power accident.
According to the above construction principle of imperfect FDIA, in order to bypass the bad data detection, the attack vector will maintain the high consistency of most eigenvalues and only modify the necessary residual values required by the attack, which will maintain the similarity of residual eigenvalues before and after the attack at a high threshold. On the contrary, the occurrence of actual power grid accidents is random, resulting in low similarity in residual eigenvalues.
After conducting a large number of experiments, the threshold μrN ≈ 0.8 was determined, i.e., when the eigenvalue residual similarity is greater than or equal to 0.8, the system can be considered to have been invaded by FDIA, and when the eigenvalue residual similarity is less than 0.8, the system is considered to have experienced an actual power accident.
5 Conclusion
Compared with existing testing methods, the detection method proposed in this paper combines measurement similarity testing and eigenvalue residual similarity testing to achieve high-precision detection of FDIA. Specifically, under normal operating conditions or physical power accidents, it does not generate a high false alarm rate, while in the presence of FDIA, it achieves a high detection rate.
The proposed similarity testing method for residual measurement of eigenvalues only requires system state measurements from measurement equipment and measurement residuals from state estimation as inputs, making it very suitable for modern energy management systems. The localization and elimination of false data will be the focus of future research directions.
Data availability statement
The raw data supporting the conclusion of this article will be made available by the authors, without undue reservation.
Author contributions
YZ: Conceptualization, Formal Analysis, Funding acquisition, Methodology, Project administration, Software, Supervision, Writing–original draft. RL: Conceptualization, Formal Analysis, Methodology, Software, Writing–original draft. DC: Validation, Writing–review and editing. HG: Validation, Writing–review and editing.
Funding
The author(s) declare financial support was received for the research, authorship, and/or publication of this article. This project is Supported by SEPRI High Potential Program (SEPRI-K213014).
Conflict of interest
The authors declare that the research was conducted in the absence of any commercial or financial relationships that could be construed as a potential conflict of interest.
Publisher’s note
All claims expressed in this article are solely those of the authors and do not necessarily represent those of their affiliated organizations, or those of the publisher, the editors and the reviewers. Any product that may be evaluated in this article, or claim that may be made by its manufacturer, is not guaranteed or endorsed by the publisher.
References
Abur, A., and Exposito, A. G. (2004). Power system state estimation: theory and implementation. CRC Press.
Chaojun, G., Jirutitijaroen, P., and Motani, M. (2015). Detecting false data injection attacks in ac state estimation. IEEE Trans. Smart Grid 6, 2476–2483. doi:10.1109/tsg.2015.2388545
Chen, B., Wu, Q., Li, M., and Xiahou, K. (2023). Detection of false data injection attacks on power systems using graph edge-conditioned convolutional networks. Prot. Control Mod. Power Syst. 8, 16–12. doi:10.1186/s41601-023-00287-w
Chen, L., Xu, A., Jiang, Y., Yang, H., Lu, H., Kuang, X., et al. (2020). Attack pattern recognition algorithm of power information network based on dynamic incremental cluster analysis. South. Power Syst. Technol. 14, 25–32. doi:10.13648/j.cnki.issn1674-0629.2020.08.004
Coluccia, A., D’Alconzo, A., and Ricciato, F. (2013). Distribution-based anomaly detection via generalized likelihood ratio test: a general maximum entropy approach. Comput. Netw. 57, 3446–3462. doi:10.1016/j.comnet.2013.07.028
Ericsson, G. N. (2010). Cyber security and power system communication—essential parts of a smart grid infrastructure. IEEE Trans. Power Deliv. 25, 1501–1507. doi:10.1109/tpwrd.2010.2046654
Feng, L., Yong, M., and Yihua, Z. (2023). Overview of the overall influence of cyber attack on typical scenarios of power systems. South. Power Syst. Technol., 1–15.
He, Y., Mendis, G. J., and Wei, J. (2017). Real-time detection of false data injection attacks in smart grid: a deep learning-based intelligent mechanism. IEEE Trans. Smart Grid 8, 2505–2516. doi:10.1109/tsg.2017.2703842
Jena, P. K., Ghosh, S., Koley, E., and Manohar, M. (2021). An ensemble classifier based scheme for detection of false data attacks aiming at disruption of electricity market operation. J. Netw. Syst. Manag. 29, 43. doi:10.1007/s10922-021-09610-y
Jiang, Q., Chen, H., Xie, L., and Wang, K. (2020). Learning-based cooperative false data injection attack and its mitigation techniques in consensus-based distributed estimation. IEEE Access 8, 166852–166869. doi:10.1109/access.2020.3023117
Liu, R., Mustafa, H. M., Nie, Z., and Srivastava, A. K. (2022). Reachability-based false data injection attacks and defence mechanisms for cyberpower system. Energies 15, 1754. doi:10.3390/en15051754
Liu, Y., Ning, P., and Reiter, M. K. (2011). False data injection attacks against state estimation in electric power grids. ACM Trans. Inf. Syst. Secur. (TISSEC) 14, 1–33. doi:10.1145/1952982.1952995
Tiande, G., Pingping, L., Jikeng, L., et al. (2023). Leverage measurement attack of power system considering unknown state variates. South. Power Syst. Technol. 17, 56–64.
Wu, Y., Wang, Q., Guo, N., Tian, Y., Li, F., and Su, X. (2023). Efficient multi-source self-attention data fusion for fdia detection in smart grid. Symmetry 15, 1019. doi:10.3390/sym15051019
Xiahou, K., Liu, Y., and Wu, Q. (2020). Robust load frequency control of power systems against random time-delay attacks. IEEE Trans. Smart Grid 12, 909–911. doi:10.1109/tsg.2020.3018635
Yang, H., Zhang, W., Shi, F., Xie, J., and Ju, W. (2019). Pmu-based model-free method for transient instability prediction and emergency generator-shedding control. Int. J. Electr. Power & Energy Syst. 105, 381–393. doi:10.1016/j.ijepes.2018.08.031
Zhang, Q., Li, F., Cui, H., Bo, R., and Ren, L. (2020a). Market-level defense against fdia and a new lmp-disguising attack strategy in real-time market operations. IEEE Trans. Power Syst. 36, 1419–1431. doi:10.1109/tpwrs.2020.3020870
Zhang, Y., Wang, J., and Chen, B. (2020b). Detecting false data injection attacks in smart grids: a semi-supervised deep learning approach. IEEE Trans. Smart Grid 12, 623–634. doi:10.1109/tsg.2020.3010510
Keywords: false data injection attacks, AC state estimation, measurement-eigenvalue residual similarity, bad data detection, cyber security
Citation: Zhu Y, Liu R, Chang D and Guo H (2023) Detection of false data injection attacks on power systems based on measurement-eigenvalue residual similarity test. Front. Energy Res. 11:1285317. doi: 10.3389/fenrg.2023.1285317
Received: 29 August 2023; Accepted: 27 October 2023;
Published: 13 November 2023.
Edited by:
Nantian Huang, Northeast Electric Power University, ChinaReviewed by:
Yuanshi Zhang, Southeast University, ChinaTao Zhou, Nanjing University of Science and Technology, China
Copyright © 2023 Zhu, Liu, Chang and Guo. This is an open-access article distributed under the terms of the Creative Commons Attribution License (CC BY). The use, distribution or reproduction in other forums is permitted, provided the original author(s) and the copyright owner(s) are credited and that the original publication in this journal is cited, in accordance with accepted academic practice. No use, distribution or reproduction is permitted which does not comply with these terms.
*Correspondence: Ren Liu, bGl1cmVuMjQ4QGdtYWlsLmNvbQ==