 Zhou Lan1
 Xin Fang
- 1Economic and Technological Research Institute, State Grid Zhejiang Electric Power Co., Ltd., Hangzhou, China
- 2Polytechnic Institute, Zhejiang University, Hangzhou, China
Due to the inherent power output correlation and uncertainty, renewable energy stations normally incur the deviation penalty in the day-ahead and real-time electricity market. Meanwhile, shared energy storage operators have been appearing to provide energy storage leasing services for neighboring renewable energy stations. In this context, this paper presents a novel optimization strategy to provide leasing services for renewable energy station clusters while improving the utilization rate and revenue of shared energy storage simultaneously. Especially, the proposed strategy utilizes a two-stage optimization model to incorporate the overselling risk. In the first stage, a matching index is defined to select a cluster of wind and solar power stations in the geographically-close region, when a set of highly complementary stations are selected by matching the typical output curve of the shared energy storage. In the second stage, an optimization strategy is determined to explore the benefit and risk of overselling for shared energy storage with the goal of maximizing the total revenue, when the correlation of wind and solar power output is realized in the scenario generation and sampling process. The results of numerical experiments have demonstrated that employing a moderate overselling method can provide an economical and efficient operational solution to improving the utilization of shared energy storage.
1 Introduction
Driven by the goal of low-carbon transformation in the modern power system, renewable energy resources (RES), such as wind and solar power generations, have developed rapidly in recent years. However, the volatility and intermittency of wind and solar power generations have become prominent issues, which brings severe challenges to the stable and reliable operation of power systems. Energy storage, with flexible charging and discharging capabilities, is widely used to improve RES accommodation and reduce the deviation penalties of RES (Kousksou et al., 2014; Luo et al., 2015). The existing energy storage applications include individual energy storage (IES) and shared energy storage (SES). IES is constructed by its investor, while the construction cost is high (Qiu et al., 2023). SES is a feasible and economical solution for RES to obtain the use rights of energy storage considering the temporal complementarity and various demand patterns among different users (Wang et al., 2013; Dongwei et al., 2020; Chen et al., 2022a). SES operation mode is: SES operators provide renewable energy stations with energy storage leasing services; renewable energy stations utilize the energy storage resources by signing contracts with operators to save the cost of independent configuration of energy storage devices and deviation penalties (Zheng et al., 2021; Song et al., 2022). Nevertheless, in the actual application of SES, there may be situations where energy storage capacity is reserved but not actually utilized, which leads to the low utilization of SES. Therefore, to improve the low utilization of SES, it is necessary to screen renewable energy stations that are matched with SES and maximize the utilization and revenue of SES considering overselling risk.
Some scholars have studied the operational leasing mechanism of SES, focusing on the charging and discharging strategy and storage capacity allocation of SES. The research (Han et al., 2023a) proposes a model for shared energy storage dynamic capacity leasing, revealing the essence of improving revenues through SES. Some researchers propose a peer-to-peer (P2P) energy trading framework that allows producers and consumers to share distributed solar and storage within a community and allocate the SES capacity fairly (He et al., 2021). The research (Zhong et al., 2020) focuses on community households and concentrates energy storage within the region while gaining leasing income through leasing services, based on optimizing the charging and discharging strategy of SES. Some researchers introduce an agreement leasing model that separates the ownership and operation rights of energy storage power stations (Liu et al., 2023). The research (Xiao et al., 2022) presents a new energy storage sharing framework that provides strategies for energy capacity allocation and power capacity allocation. The research (Sun et al., 2020) adopts a sharing leasing strategy on a per-user basis, where users lease energy storage mainly to profit from electricity price differentials in the spot market and participate in the ancillary services market. The robust reliability evaluation model based on the minimum volume enclosing ellipsoid algorithm is established to evaluate the power system reliability, while considering the correlations among renewable energy sources (RESs) and their uncertainties (He et al., 2023). The research (Han et al., 2023b) proposes an optimization model based on the chance-constrained goal programming to set up an internal energy balance mechanism to make full use of the complementary energy consumption characteristics of different DCs considering the renewable energy uncertainty. To take full advantage of the complementarity of MESs and improve the power system economic operation, the research (Ding et al., 2022) proposes the cascaded utilization of MES carriers which would lead to higher energy efficiency and lower operation costs. The research (Tao et al., 2018) sets up a multi-stage stochastic programming (MSSP) model to address uncertainties in the expansion co-planning problem of natural gas and power networks. The research (Zhang et al., 2021) summarizes the benefits and disadvantages of various ESSs and analyzes a variety of ESS evaluation indicators. Multi-stage stochastic programming is developed to address the uncertainties in the joint energy and reserve dispatch model, where the decisions are made sequentially with the uncertainties being revealed gradually over stages (Runzhao et al., 2020). However, these studies do not take into account the waste of energy storage resources due to the low energy storage utilization rate. In addition, the existing researches on the SES leasing mechanism only focus on the application for fixed demanders, while ignoring the impact of similar output characteristics of demanders with SES on utilization rate. To address this issue, this paper proposes a two-stage model. In the first stage, a matching index is defined to select a cluster of wind and solar power stations in the geographically-close region, when a set of highly complementary stations are selected by matching the typical output curve of the SES. The matching mechanism provides a RES cluster whose leasing demand matches the charging and discharging curve of SES with a high degree for the second stage. In the second stage, an optimization strategy is determined to explore the benefit and risk of overselling for SES with the goal of maximizing the utilization rate of the SES and the total profit.
To implement the operation strategy of SES considering overselling risk, the crucial issue is to accurately predict the actual energy storage utilization rate of renewable energy stations. First, the overselling method refers to the sales behavior that exceeds the supplier’s maximum supply (Zhijun et al., 2023). It is widely used in fields such as cloud computing services, airlines, and hotels. In the context of cloud computing services, it refers to the complex virtual machine placement problem in IaaS environments. The research (Tomás and Tordsson, 2014) implements an autonomic risk-aware overbooking architecture capable of increasing the resource utilization of cloud data centers by accepting more virtual machines than physically available resources, which shows a 50 percent increment in resource utilization with acceptable performance degradation. In the airline industry, it refers to selling more tickets than the actual number of seats. Some passengers frequently cancel or fail to board flights, resulting in empty seats (i.e., available resources) on the flights, so that some seats can be oversold to maximize seat utilization and revenue. However, there are times when passengers actually show up at the gate, which results in overbooked seats, and airlines will compensate these passengers financially. Therefore, it is necessary to find a balance between seat utilization and overselling penalty. The research (Alavi Fard et al., 2019) constructs a wealth function to set optimal overbooking strategies for flights, which views overbooking as a stochastic loss exposure based on the stochastic market average airfare and overbooking exposure. However, few works have addressed the problem of the low actual utilization of energy storage based on the overselling method. Similar to the aforementioned services, SES provides services with higher charges but lower resource utilization, making it crucial to maximize the utilization of the capacity of SES. Due to the non-timely delivery features of SES capacity resources, it is feasible to oversell when submitting energy storage capacity resources and the fact that it offers capacity leasing services by putting up bidding for capacity rather than electricity resources in the day-ahead market. Therefore, in the field of power system, overselling of SES refers to determining the overselling power of ESS by solving an optimal overselling model, aiming to increase the profit by improving the utilization rate of SES.
Some studies compare the common characteristics of the power and airline industries and introduce the concept of overselling operations to the power industry (Sioshansi and Vojdani, 2001), but only limited to theoretical analysis. Some researchers verify the feasibility of ESS overselling operational strategies but do not consider the integration of renewable energy sources (Lombardi and Schwabe, 2017). Some researchers study the price arbitrage and frequency regulation services of solar and storage sharing under overselling risk but do not consider overselling risk for various application scenarios, such as energy storage capacity leasing (Chen et al., 2022b). In this paper, a novel two-stage model is proposed for SES providng leasing services to renewable energy stations. We first select matched demanders considering the output similarity between SES and renewable energy stations. Based on the selected cluster of wind and solar power stations, scenarios predicting RES actual leasing demand are generated by non-parametric kernel density estimation and Copula function. Due to the randomness and the correlation of renewable energy output between wind farms and solar plants in the same region, a large number of scenarios are generated and reduced for analysis and computation to accurately predict the wind and solar output, thus obtaining reliable actual energy storage leasing demand of the wind and solar power stations cluster. By considering its randomness and correlation, a suitable wind and solar joint output model is established and typical scenarios are generated, which is important for the optimization model considering the overselling strategy in the second stage. Then an optimization model for maximizing the profit of SES considering the overselling risk is established based on the selected demanders. The contributions of this paper are summarized as follows.
(1) The matching mechanism based on a weighted matching degree between SES and renewable energy stations is first presented to improve the utilization rate of SES. Based on the matching degree, a cluster of renewable energy stations is selected in which leasing demand has a high degree of matching the charging and discharging curve of SES.
(2) Due to the uncertainty and correlation of wind and solar power output in the same region, this paper proposes a scenarios-generation approach considering the complementarity of wind and solar power output to obtain a reliable prediction of actual leasing demand.
(3) An optimized leasing model of the SES based on an overselling scheme is proposed in the second stage. In the overselling scheme, the SES fully utilizes its energy storage capacity to mitigate energy deviations of the renewable energy stations. On this basis, the SES makes decisions on the actual leasing capacity and overselling power through the model to maximize the profit.
The rest of this paper is organized as follows: Section 2 introduces the framework that the SES provides demanders with leasing services for the use of energy storage. Section 3 proposes a two-stage optimization model. Section 4 analyzes the result through the simulation. Section 5 summarizes the whole paper and gives the conclusion.
2 The framework of leasing services provided by SES
The framework of SES providing leasing services for renewable energy stations in the day-ahead and real-time market is shown in Figure 1. The system contains the following subjects, shared energy storage operators and renewable energy stations and distribution network.
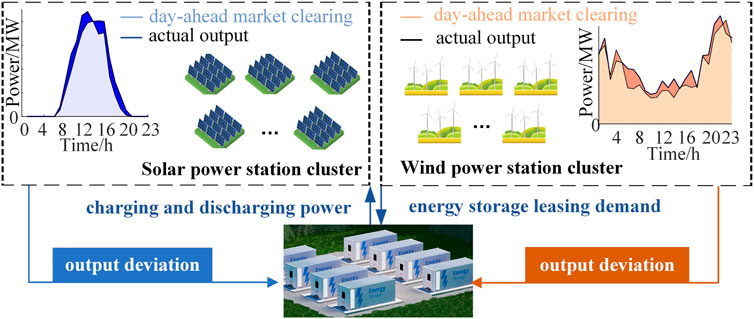
FIGURE 1. Framework of SES to provide leasing services.
Considering the uncertainty of RES output, the actual output often deviates from the day-ahead market clearing, resulting in significant power imbalance deviations in the real-time market (Yang et al., 2023). The real-time market establishes a penalty mechanism for output deviations. SES can utilize the complementarity of wind and solar power stations in real-time market generation deviations to meet users’ energy storage demand with minimal investment in energy storage. At the same time, the unit cost of SES is lower than IES, which can reduce the total investment cost of energy storage stations and shorten the investment payback period for energy storage. As can be seen in Figure 1, the renewable energy stations can obtain the use rights of energy storage in a certain period of time from the SES leasing market without a huge investment in constructing energy storage equipment. In this way, SES can provide reserves for RES in order to reduce the deviation penalty of RES forecast error on day-ahead market clearing operation.
2.1 Transaction considering overselling risk
The transaction stage between renewable energy stations and SES can be divided into two parts: the day-ahead market and the real-time market. In the day-ahead market, wind and solar power stations report their leasing demand 1 day in advance to reduce the deviation penalty caused by volatility. In the real-time market, SES provides charging and discharging services to the cluster of renewable energy stations, and determines the optimal overselling power and charging and discharging strategy to maximize the profit of SES. Renewable energy stations pay leasing service fees daily. Considering the sustainability of SES, after one operating cycle, the capacity of the energy storage station is restored to its initial state. When the next transaction occurs, the energy storage leased in the previous period will be retrieved by the SES operator and then supplied to meet the leasing demand of wind and solar power stations in the next period. Thus, the renewable energy stations collaborate with SES to complete transactions in one cycle.
To improve the actual utilization rate and economic efficiency of SES during the transaction, this paper introduces a novel operation strategy considering overselling risk. First, the predicted actual leasing demand is solved by a scenario-generation method based on non-parametric kernel density estimation and Copula function considering the correlation of wind and solar power output. Then, SES leases energy storage power in excess of its maximum supply based on the actual energy storage utilization and next determines the equilibrium between the net revenue and the overselling penalty by solving a revenue optimization model aiming at maximizing the SES’s profit.
The following assumptions are made in this paper.
(1) When the capacity of both the renewable energy stations and the SES stations is small, they are both considered recipients of market prices, and the clearing power will be accepted by the market (He et al., 2017; Díaz et al., 2019). It is assumed that the renewable energy stations and SES stations are connected to the main grid through the same node, and their market prices can be considered the same (Wang et al., 2022).
(2) Considering cost inefficiency and the small sizing of the cluster of renewable energy stations, it is assumed that they do not configure their own IES stations. In addition, this paper mainly considers the leasing mechanism of SES, and if the renewable energy stations are partially configured with IES stations and partially not, it needs to consider the complexity of mixing IES and SES.
2.2 Leasing mechanism of SES
As the lessor of energy storage, SES operators need to establish the billing method and leasing prices for leasing energy storage. Renewable energy stations, act as demanders and lease energy storage based on these prices. Given that the capacity of energy storage directly reflects the size of the user’s energy storage demand and each charging and discharging cycle during energy storage usage results in certain degradation to the battery life. Therefore, this paper proposes a hybrid billing method (Li et al., 2022) that takes into account both the energy storage capacity demand and the charging and discharging power. A method is established to calculate the energy storage capacity demand based on the charging and discharging demand curve of the renewable energy stations, including power demand and capacity demand.
(1) Power demand
where
(2) Capacity demand
First, the energy state of energy storage at time t depends on the energy state at time
where Ei,t and Ei,t-1 are the energy state of the energy storage for the renewable energy station i at time t and t-1 during the time period
In addition, the initial and the final energy state of energy storage are equal during the optimization period, as follows:
where Ei,0 is the initial energy state of energy storage in a dispatch cycle and Ei,T is the final energy state of energy storage in a dispatch cycle for the renewable energy station i.
Then, the energy capacity requirement of the energy storage can be determined considering a 1.1-fold energy storage capacity margin for the uncertainty in renewable energy output, which is calculated by:
where
In summary, the hybrid billing method of SES is:
where
The revenue of energy storage capacity demand is calculated by:
in which α and β are the leasing price per unit of energy capacity and power, respectively.
The revenue of the charging and discharging power is calculated by:
where
2.3 The framework of two-stage optimization model
The SES implements a two-stage optimization model to improve the utilization and increase the revenue of SES by incorporating the overselling risk. The optimization strategy is shown in Figure 2. First, based on the uncertainty of the renewable energy power generation, a metric quantifying the correlation of output fluctuations is established. SES selects a cluster of renewable energy stations with high compatibility to provide leasing services. Secondly, overselling behavior of SES can bring considerable overselling revenue. However, improper operation may lead to the embarrassment of being unable to provide the promised service in a timely manner when called upon, and a penalty must be paid for that. Therefore, the key to the operation strategy lies in determining the optimal overselling power of SES, so as to maximize the overselling operation revenue for SES while considering both conditions mentioned above.
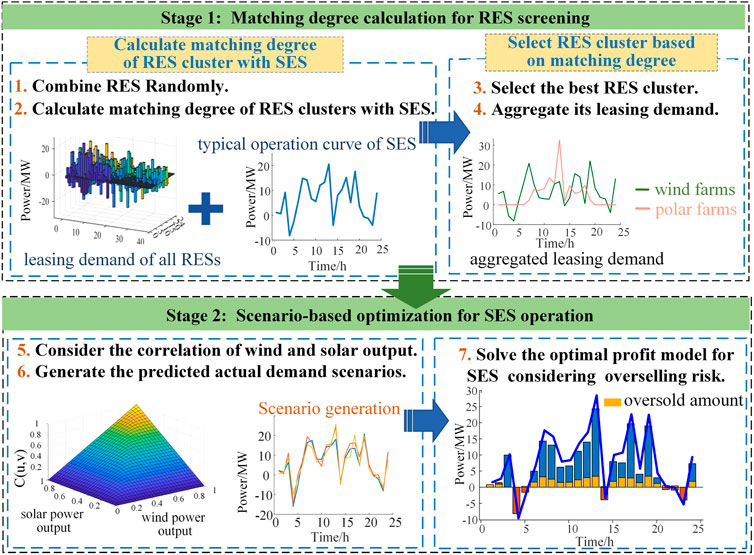
FIGURE 2. Two-stage optimization model for SES providing leasing services.
As can be seen in Figure 2, to improve the utilization and increase the revenue of SES, the research of this work is divided into two steps: matching degree calculation for RES screening and scenario-based optimization for SES operation. In the first stage, the matching degree is calculated for selecting a cluster of wind and solar power stations in the geographically-close region, which is matched with the typical output curve of the SES best. In the second stage, to maximize the utilization rate of the SES and the total profit, an optimization strategy for SES is determined considering overselling risk.
3 Matching degree calculation for RES screening
The charging and discharging behavior of SES is closely related to the fluctuation of the leasing demand for renewable energy station. Based on the similarity between the typical output curve of SES and the demand curve of the renewable energy station cluster, the compatibility is defined to quantify the similarity between the two curves. It is calculated as the average similarity between the two curves at each time interval throughout the day. The higher the similarity, the better the match between the renewable energy station cluster and the SES. By selecting a cluster of wind and solar stations that complement each other well and are most compatible with the SES, leasing services can be provided to improve the utilization of SES.
To obtain the typical charging and discharging curves of SES, the typical characteristics can be extracted from the operating curves of energy storage systems under specific application scenarios. By relying on the application scenarios where SES meets the leasing demand for reducing deviation assessment in renewable energy stations, the clustering analysis is applied to the yearly charging and discharging power curves of SES. The most optimal charging and discharging curves are aggregated from the storage operation curves. Then the typical charging and discharging curves serve as inputs to the matching model. According to the matching model, a selection is made from the renewable energy station cluster to find the cluster of renewable energy stations that best matches the charging and discharging curves of SES for providing leasing services.
The trend of a curve can determined through changes in slope (Liu et al., 2021). Slope correlation is an analytical method based on the slopes of curves. We can calculate the slope correlation between two curves to obtain a measure of compatibility, assigning different weights to different ranges or intervals, the correlation function between the typical charging and discharging curve and the leasing demand curve of renewable energy station cluster at each time interval,
where
where
where
where
Since the time interval is 1 hour, i.e.,
Then the average matching degree of SES
where the matching degree
The upper and lower constraints of the energy storage capacity demand of renewable energy station are expressed as follows:
where
The upper and lower constraints of the energy storage power demand of renewable energy station are expressed as follows:
where
The upper and lower constraints of charging power are expressed as follows:
where
The upper and lower constraints of discharging power are expressed as follows:
where
4 Scenario-based optimization for SES operation
4.1 Scenario generation
The wind and solar output scenario generation method based on non-parametric kernel density estimation and Copula function is an effective method to simulate the randomness and the correlation of renewable energy output in the same region. Non-parametric kernel density estimation is a non-parametric statistical method to estimate the probability density function of continuous random variables with Gaussian distribution as the kernel function (Gu et al., 2021). Copula function characterizes the probabilistic correlation between multiple random variables (Yu and Ghadimi, 2019), which is commonly used to study the correlation between wind and solar power output. By considering its randomness and correlation, a suitable wind and solar joint output model is established and typical scenarios are generated.
Based on historical power output data for wind and solar power plants over the past n days, Gaussian kernel functions are selected to generate probability density functions of wind and solar power output for 24 time periods within a day utilizing a non-parametric kernel density estimation method. The cumulative distribution function is calculated based on the probability density function of power output for each time period. Then, the joint distribution function of wind and solar power output is established using the Frank-Copula function for each time period.
The extent to which the point xt contributes to the estimate
where xt and yt are the wind and solar output at time t; Xtd and Ytd are the wind and solar output at time t in the day d; h is the step. The Gaussian kernel function K (·) is calculated by:
The cumulative distribution functions
where C (·) is the two-dimensional Frank-Copula function.
Sampling the joint distribution function for each time interval and using cubic spline interpolation to solve for the sampled wind and solar power output corresponding to the cumulative probabilities in each time interval, the sampled wind and solar power output can be expressed as follows:
where ut and vt are calculated by the empirical cumulative distribution function.
Then using K-means to cluster the sampled samples in order to reduce the number of scenarios to a specified threshold, and calculating the probability of occurrence for each scenario.
4.2 Revenue optimization model considering overselling risk
The overselling behavior of SES can bring considerable revenue to operators. However, if not operated properly, they may face the embarrassment of being unable to provide the promised services when called upon, resulting in a penalty payment. Therefore, determining the optimal overselling power is crucial for SES. This paper will establish a scenario-based optimization model for SES considering overselling risk. The uncertainty of wind and solar power output introduces certain the overselling risk. Therefore, a scenario-generation method based on non-parametric kernel density estimation and Copula function considering the correlation of wind and solar power output will be taken into account.
The objective function of the model can be represented as:
where Rs,net is the net revenue; Rre is the leasing services revenue; C1 is the penalty for overselling; C2 is the power purchase cost and C3 is the loss cost. They can be expressed as follows.
4.2.1 Leasing services revenue
where
4.2.2 Modeling the overselling risk
After considering the correlation between wind and solar power output, the actual output of the renewable energy station alliance is predicted. Obviously, the overall demand of the renewable energy stations is lower than the sum of the leasing demand submitted by each station in advance considering the correlation. Therefore, SES has potential to gain overselling profit. A penalty for overselling operation which can not fulfill the power leasing participation is expressed as follows:
where
The overselling power amount should be the leasing amount previously signed by SES minus the power amount it can currently provide in real time, which is calculated by:
4.2.3 Calculating the power purchase cost and loss cost
From the perspective of SES, the total cost can be calculated by purchase cost and loss cost. The power purchase cost is calculated by:
where C2 presents the purchase cost of SES;
The loss cost of SES is calculated by:
where
In the objective function, input variables include the leasing demand
4.3 The constraints of revenue optimization model
Then, the constraints in the optimal revenue model are expressed as follows.
4.3.1 SES charging and discharging power constraints
Since the charging and discharging behavior cannot be carried out at the same time, the state variables are introduced to the upper power limit. SES charging and discharging power constraints are expressed as follows:
where
It can be seen that the constraints Eqs 38-40 are non-linear constraints and the Big-M method is used to linearise the non-linear constraints.
4.3.2 SES state of charge constraints
The energy storage should keep its SOC within its energy capacity limits and hold enough energy for each time interval to provide leasing services, which is expressed as follows:
where SOCmin and SOCmax are the maximum and minimum SOC allowed by the SES owners, respectively.
The energy state of energy storage at time t depends on the energy state at time t-1 during the time period
The initial and the final energy states are equal during the optimization, as follows:
where
4.3.3 Power balance constraint of SES
The sum of the actual demand of renewable energy station cluster, the power amount of electricity purchased from and sold to the power grid should be equal to the leasing power amount that can be provided in real time by SES, and can be expressed as:
where
5 Case studies
This section solves a two-stage optimization model that considers an overselling risk for a SES operator providing leasing services in the MATLAB R2022b environment. The model is solved using the widely applied commercial software CPLEX 12.5 in the YALMIP toolbox. The differences in operational strategies between the overselling mode and the conventional mode of the SES operator are compared, as well as their impacts on revenue.
5.1 Test system settings
Historical RES data from the 2019 Elia dataset (OpenDataElia, 2019) are used to generate wind and solar power output data under different scenarios and the required dispatch power. 20 wind farms and 20 solar farms are initially selected from the Elia dataset, and the complementary 4 wind farms and 4 solar farms with the highest matching degree are selected to provide energy storage leasing services. The case study includes four wind farms, four solar stations, and one SES. Each wind farm and solar station have an installed capacity of 100 MW. The difference between the required dispatch power and the actual output curve of renewable energy is used as the demand curve for energy storage utilization by each renewable energy Power Plant. In this paper, the demand curve is a known amount derived from historical data.
The installed capacity of the SES is 30 MW/60 MWh, based on data from reference (Wang et al., 2023). The leasing price of the SES is assumed to be a known parameter since this study primarily focuses on the operational strategy of the SES. Additionally, the leasing price of the SES should be lower than the deviation penalty price. Therefore, the leasing unit price for the SES is set at $42/MW. The leasing price per unit of energy capacity and the leasing price per unit of power are denoted as
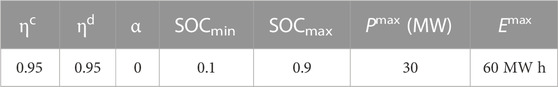
TABLE 1. SES parameters.
5.2 Selection of renewable energy stations
By comparing 40 renewable energy stations in a region, select the best complementary 4 wind power stations and 4 solar power stations with the highest matching degree between total leasing demand and SES output curve. The leasing demand of the 40 renewable energy stations are summarized in Figure 3.
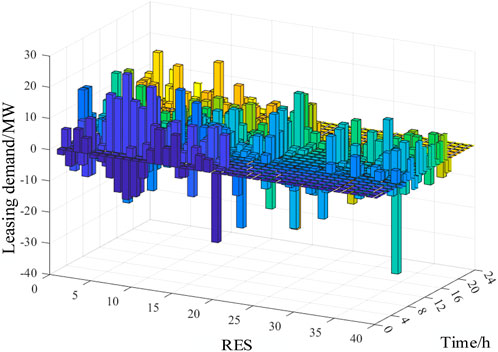
FIGURE 3. The leasing demand of the 40 renewable energy stations.
To obtain the combination of renewable energy stations with the highest matching degree to the SES, it is necessary to compare the charging and discharging curves of the SES with the leasing demand of the renewable energy stations. Using the typical charging and discharging curve of the SES as a reference, different weights are assigned to different intervals. When the leasing demand of the renewable energy stations falls into different intervals, the weights are assigned as
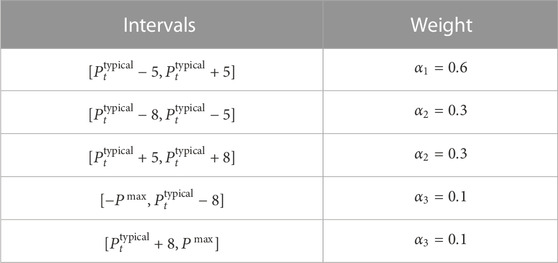
TABLE 2. Weights for different intervals.
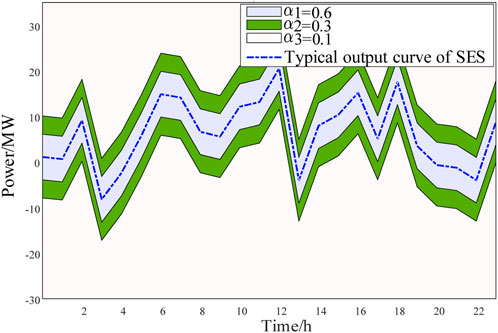
FIGURE 4. Weights for different intervals.
The matching degree of each cluster of renewable energy stations is calculated based on weights. The matching degrees of all eligible combinations of renewable energy stations are calculated, and the top five combinations with the highest matching degrees are 0.6440, 0.5567, 0.4833, 0.4829 and 0.4454 respectively. It can be seen that the highest matching degree is 0.6440. The output of the selected clusters of wind farms and solar farms is shown in Figures 5, 6, the leasing demand and total demand are shown in Figure 7. As can be seen from Figure 7 that the leasing demand of selected renewable energy station is complementary and the aggregate leasing demand is similar with the SES typical output curve.
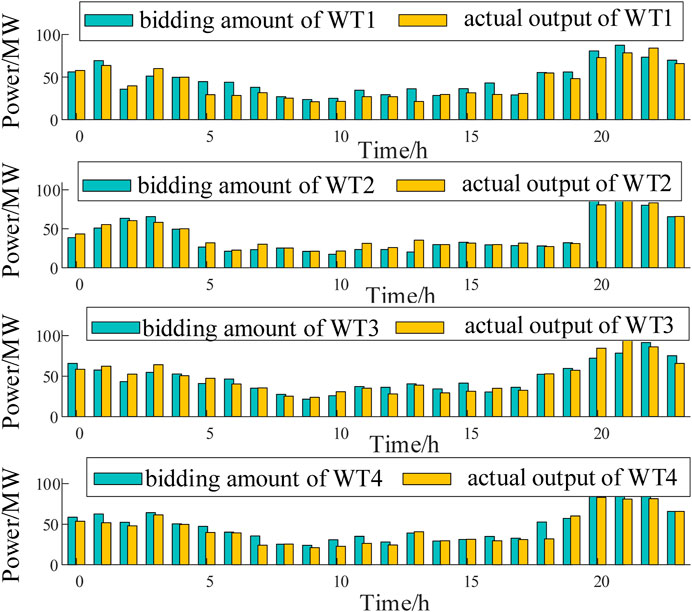
FIGURE 5. Day-ahead bidding amount and actual output of the wind farms.
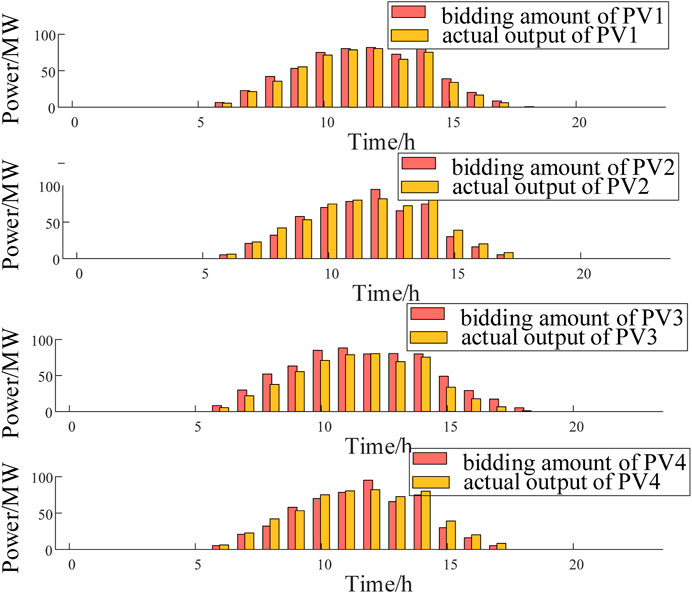
FIGURE 6. Day-ahead bidding amount and actual output of the solar farms.
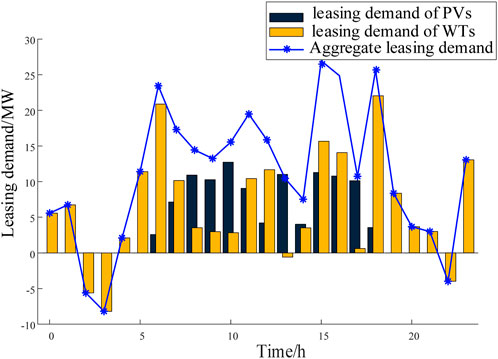
FIGURE 7. The leasing demand of RES.
5.3 Optimization of leasing services
Using the proposed scenario generation method, 1,000 sets of wind-solar output data considering their correlation are obtained. These 1,000 sets of data are then clustered into 3 typical daily wind-solar output scenarios. The correlation of wind-solar output and the generated output curves for each scenario are shown in Figure 8.
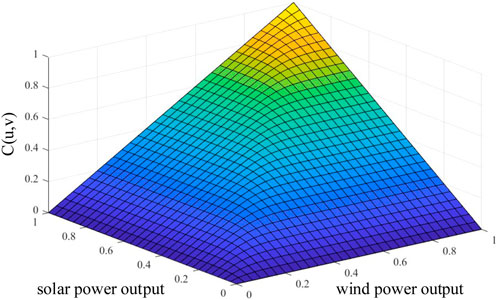
FIGURE 8. The Frank-Copula distribution function.
The Frank-Copula function is used to generate random points according to the probability, the horizontal and vertical coordinates of the generated points are the per unit of the wind farm and PV power plant, and the generated random points obey the joint output characteristics of the wind farm and PV power plant. Based on the Frank-Copula function, the joint distribution function of the power output of the wind farm and PV power plant is shown in Figure 8. It can be seen that the binary Frank-Copula function has a thick tail, the generated random points converge to the original function according to the probability, reflecting the correlation between the wind and solar power outputs from Figure 8.
The predicted actual leasing demand generated considering the correlation between wind and solar outputs in three typical scenarios is shown in Figure 9.
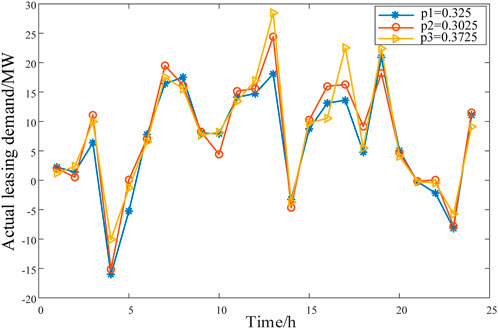
FIGURE 9. The predicted actual leasing demand for RES.
By comparing Figure 7; Figure 9, it can be observed that the day-ahead leasing demand of the renewable energy stations is higher than the actual leasing demand, indicating the profit potential of the overselling risk.
It is assumed that the market regulatory agency imposes penalties for overselling behaviors with the penalty coefficient set at 5 times the energy market price. The cost of using energy storage in a scheduling cycle and the revenue of the SES are calculated and compared by two schemes.
Scheme 1: SES leases energy storage without considering overselling risk.
Scheme 2: SES leases energy storage and implements the optimal overselling power.
In Scheme 1, renewable energy stations lease energy storage, and the SES operator transfers the utilization right of energy storage. The renewable energy stations determine the optimal leasing power amount in advance to maximize their revenue. Through optimization calculations, the daily total revenue of the renewable energy stations is $7812.41. In Scheme 2, the overselling risk is considered. By solving the optimization model for maximizing the revenue of SES, the optimal overselling power for SES is obtained, thus maximizing the utilization of energy storage, reducing resource idle time, and increasing SES revenue. The curves depicting the actual leasing power, overselling power, and predicted leasing power of the renewable energy station cluster for the three generated scenarios are shown in Figures 10–12.

FIGURE 10. Output curve considering overselling risk in scenario 1.
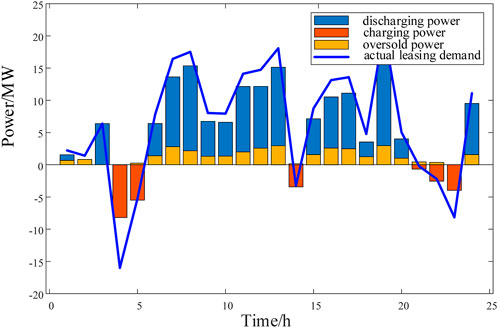
FIGURE 11. Output curve considering overselling risk in scenario 2.
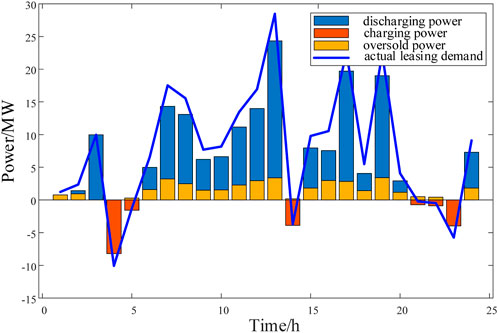
FIGURE 12. Output curve considering overselling risk in scenario 3.
In Scheme 2, SES provides leasing services considering overselling risk. The optimization results in three scenarios are shown in Figures 10–12. When the actual output of the renewable energy station cluster exceeds the day-ahead bidding amount, SES is charging. However, most of the time the actual output is lower than the day-ahead bidding amount, SES is discharging, and most of the time the actual demand is lower than the leasing power amount. Therefore, an appropriate overselling method reduces the idle capacity of energy storage. As can be seen from Figures 10–12 that SES can oversell the storage power in multiple time periods without affecting the overall trend of the energy supply for providing leasing services to renewable energy station.
The net revenues of SES in Scheme 1 and 2 are listed in Table 3.
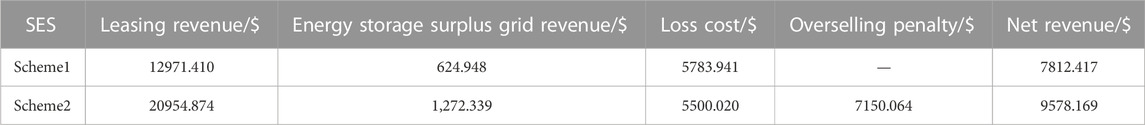
TABLE 3. Net benefits of SES in Scheme 1, 2
By comparing the revenue of providing leasing services for renewable energy stations with the same SES under two different schemes, it can be concluded that considering an overselling risk can significantly increase the revenue of SES leasing services. Although there is a need to pay a certain penalty for unfulfilled services due to overselling, the overall net revenue still increased by 22.6%, showing a clear improvement in revenue.
5.4 Sensitivity analysis
To verify the validity of the two-stage model, sensitivity analysis is performed. For stage 1, in order to demonstrate the effect of matching degree on the SES utilization rate, two parameters, the number of users and the type, are set for validation, which has a direct effect on the matching degree. For stage 2, in order to prove that the optimal overselling power solved by the optimization model improves the SES revenue, different amount of overselling power is set to verify its impact on the revenue, which is analyzed as follows.
5.4.1 Impact of user number and types on SES utilization rate
The degree of user complementarity and the number of users are key factors influencing the economic viability of the operational model. The SES model aims to improve SES utilization by integrating the usage demands of all users, thereby reducing overall costs and enhancing the economic viability of the project. Therefore, in this section, sensitivity analysis is conducted by controlling the number of users and user types. Table 4 illustrates how the SES utilization rate varies when the sensitivity analysis was performed. The SES utilization rate changes with the parameters of user number and types, which can be observed in Table 4.

TABLE 4. Impact of user number and types on SES utilization rate.
From Table 4, it can be observed that as the number of users in the renewable energy station increases, the utilization rate of SES also increases, with the highest utilization rate achieved under the stage 1 screening mode. Comparing renewable energy stations selected random and a high match under stage 1 screening with the same number of users and types, the energy storage utilization rate is still relatively high for the random mode but the leasing demand exceeds the storage capacity. This means that to meet the leasing demand under this mode, a larger capacity of SES needs to be allocated.
5.4.2 Impact of overselling power on SES revenue
In order to demonstrate the rationality of the optimal overselling power, the revenue under different overselling power is analyzed by calculating the revenue at 80%, 90%, 110%, and 120% of the optimal overselling power. The optimal overselling power is denoted as P_oversold. By using the overselling model described in Section 3.2, the leasing revenue, overselling penalty, and net revenue of SES are calculated and compared with the revenue under different overselling power, as shown in Table 5.
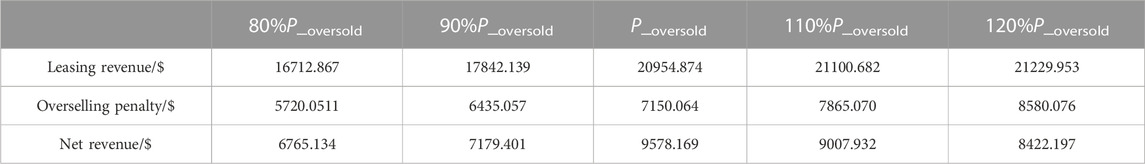
TABLE 5. Impact of overselling power on SES revenue.
As can be seen from Table 5 that the leasing revenue of the SES increases with the overselling power increasing. However, the net revenue of the SES increases initially and then decreases as the overselling power increases, due to the overselling penalty. The net revenue reaches its maximum at the optimal overselling power.
6 Conclusion
This paper proposes an optimization model for providing leasing services with SES under the overselling risk to maximize SES utilization and revenue. Conclusions are drawn through actual case analysis. First, the proposed leasing energy storage model for renewable energy stations can reduce the deviation assessment cost and the one-time investment cost of establishing energy storage. Then, the proposed matching strategy can increase the utilization rate of SES. Moreover, compared to the conventional energy storage sharing model, the overselling mode can reduce the idle state of energy storage and enhance the economic benefits of energy storage. However, excessive overselling would result in higher penalties and reduce overall revenues. Therefore, it is necessary to set a sensible level of overselling to obtain optimal revenue. In the future, as the overselling method matures, it can be considered to be included in the lease agreement terms, including overselling prices, overselling power limits, overselling time, etc., which will ensure that both lessors and demanders have a clear understanding and constraints on the overselling services.
Data availability statement
The raw data supporting the conclusion of this article will be made available by the authors, without undue reservation.
Author contributions
ZL: Conceptualization, Formal Analysis, Methodology, Resources, Writing–original draft, Writing–review and editing. JH: Data curation, Funding acquisition, Investigation, Project administration, Writing–review and editing. XF: Investigation, Methodology, Project administration, Software, Supervision, Writing–review and editing. WQ: Formal Analysis, Funding acquisition, Investigation, Methodology, Supervision, Writing–original draft. JL: Methodology, Project administration, Software, Supervision, Visualization, Writing–review and editing.
Funding
The author(s) declare financial support was received for the research, authorship, and/or publication of this article. This work was funded by the Science and Technology Project of State Grid Zhejiang Electric Power Company (No. B311JY220008). The funder was not involved in the study design, collection, analysis, interpretation of data, the writing of this article, or the decision to submit it for publication.
Conflict of interest
Authors ZL, JH, WQ, and JL were employed by State Grid Zhejiang Electric Power Co., Ltd.
The remaining author declares that the research was conducted in the absence of any commercial or financial relationships that could be construed as a potential conflict of interest.
Publisher’s note
All claims expressed in this article are solely those of the authors and do not necessarily represent those of their affiliated organizations, or those of the publisher, the editors and the reviewers. Any product that may be evaluated in this article, or claim that may be made by its manufacturer, is not guaranteed or endorsed by the publisher.
References
Alavi Fard, F., Sy, M., and Ivanov, D. (2019). Optimal overbooking strategies in the airlines using dynamic programming approach in continuous time. Transp. Res. Part E Logist. Transp. Rev. 128, 128384–128399. doi:10.1016/j.tre.2019.07.001
Chen, C., Li, Y., Qiu, W., Liu, C., Zhang, Q., Li, Z., et al. (2022a). Cooperative-game-based day-ahead scheduling of local integrated energy systems with shared energy storage. IEEE Trans. Sustain. Energy 13 (4), 1994–2011. doi:10.1109/tste.2022.3176613
Chen, Y., Beibei, W., and Bike, X. (2022b). Study on the coordination strategy of sharing distributed photovoltaic energy storage hybrid operation mode considering overselling. Trans. China Electrotech. Soc. 37 (7), 1836–1846. doi:10.19595/j.cnki.1000-6753.tces.201566
Díaz, G., Coto, J., and Gómez-Aleixandre, J. (2019). Optimal operation value of combined wind power and energy storage in multi-stage electricity markets. Appl. energy 235, 2351153–2351168. doi:10.1016/j.apenergy.2018.11.035
Ding, T., Jia, W., Shahidehpour, M., Han, O., Sun, Y., and Zhang, Z. (2022). Review of optimization methods for energy hub planning, operation, trading, and control. IEEE Trans. Sustain. Energy 13 (3), 1802–1818. doi:10.1109/tste.2022.3172004
Dongwei, Zhao, Hao, Wang, Jianwei, Huang, and Xiaojun, Lin (2020). Virtual energy storage sharing and capacity allocation. IEEE Trans. Smart Grid 11 (2), 1112–1123. doi:10.1109/tsg.2019.2932057
Gu, B., Zhang, T., Meng, H., and Zhang, J. (2021). Short-term forecasting and uncertainty analysis of wind power based on long short-term memory, cloud model and non-parametric kernel density estimation. Renew. Energy 164, 164687–164708. doi:10.1016/j.renene.2020.09.087
Han, O., Ding, T., Zhang, X., Mu, C., He, X., Zhang, H., et al. (2023a). A shared energy storage business model for data center clusters considering renewable energy uncertainties. Renew. Energy 202, 2021273–2021290. doi:10.1016/j.renene.2022.12.013
Han, O., Ding, T., Zhang, X., Mu, C., He, X., Zhang, H., et al. (2023b). A shared energy storage business model for data center clusters considering renewable energy uncertainties. Renew. Energy 202, 2021273–2021290. doi:10.1016/j.renene.2022.12.013
He, G., Chen, Q., Kang, C., Xia, Q., and Poolla, K. (2017). Cooperation of wind power and battery storage to provide frequency regulation in power markets. IEEE Trans. Power Syst. 32 (5), 3559–3568. doi:10.1109/tpwrs.2016.2644642
He, L., Liu, Y., and Zhang, J. (2021). Peer-to-peer energy sharing with battery storage: energy pawn in the smart grid. Appl. Energy 297117129, 117129. doi:10.1016/j.apenergy.2021.117129
He, X., Ding, T., Zhang, X., Huang, Y., Li, L., Zhang, Q., et al. (2023). A robust reliability evaluation model with sequential acceleration method for power systems considering renewable energy temporal-spatial correlation. Appl. Energy 340, 340120996. doi:10.1016/j.apenergy.2023.120996
Kousksou, T., Bruel, P., Jamil, A., El Rhafiki, T., and Zeraouli, Y. (2014). Energy storage: applications and challenges. Sol. Energy Mater. Sol. Cells 120, 12059–12080. doi:10.1016/j.solmat.2013.08.015
Li, X. S., Fang, Z., Li, F., Xie, S., and Cheng, S. (2022). Game-based optimal dispatching strategy for distribution network with multiple microgrids leasing shared energy storage. Proc. CEES, 1–15.
Liu, J., Chen, X., Xiang, Y., Huo, D., and Liu, J. (2021). Optimal planning and investment benefit analysis of shared energy storage for electricity retailers. Int. J. Electr. Power & Energy Syst. 126106561, 106561. doi:10.1016/j.ijepes.2020.106561
Liu, Y., He, Q., Shi, X., Zhang, Q., and An, X. (2023). Energy storage in China: development progress and business model. J. Energy Storage 72108240, 108240. doi:10.1016/j.est.2023.108240
Lombardi, P., and Schwabe, F. (2017). Sharing economy as a new business model for energy storage systems. Appl. energy 188, 188485–188496. doi:10.1016/j.apenergy.2016.12.016
Luo, X., Wang, J., Dooner, M., and Clarke, J. (2015). Overview of current development in electrical energy storage technologies and the application potential in power system operation. Appl. energy 137, 137511–137536. doi:10.1016/j.apenergy.2014.09.081
OPENDATAELIA (2019). Opendataelia. https://www.elia.be/en/grid-data/open-data.
Qiu, W., Zhou, S., Yang, Y., Lv, X., Lv, T., Chen, Y., et al. (2023). Application prospect, development status and key technologies of shared energy storage toward renewable energy accommodation scenario in the context of China. Energies 16 (2), 731. doi:10.3390/en16020731
Runzhao, Lu, Tao, Ding, Boyu, Qin, Jin, Ma, Xin, Fang, and Zhaoyang, Dong (2020). Multi-stage stochastic programming to joint economic dispatch for energy and reserve with uncertain renewable energy. IEEE Trans. Sustain. Energy 11 (3), 1140–1151. doi:10.1109/tste.2019.2918269
Sioshansi, F., and Vojdani, A. (2001). What could possibly Be better than real-time pricing? Demand response. Electr. J. 14 (5), 39–50. doi:10.1016/s1040-6190(01)00207-x
Song, M., Meng, J., Lin, G., Cai, Y., Gao, C., Chen, T., et al. (2022). Applications of shared economy in smart grids: shared energy storage and transactive energy. Electr. J. 35 (5), 107128. doi:10.1016/j.tej.2022.107128
Sun, L., Qiu, J., Han, X., Yin, X., and Dong, Z. (2020). Per-use-share rental strategy of distributed BESS in joint energy and frequency control ancillary services markets. Appl. Energy 277115589, 115589. doi:10.1016/j.apenergy.2020.115589
Tao, Ding, Yuan, Hu, and Zhaohong, Bie (2018). Multi-stage stochastic programming with nonanticipativity constraints for expansion of combined power and natural gas systems. IEEE Trans. Power Syst. 33 (1), 317–328. doi:10.1109/tpwrs.2017.2701881
Tomás, L., and Tordsson, J. (2014). An autonomic approach to risk-aware data center overbooking. IEEE Trans. Cloud Comput. 2 (3), 292–305. doi:10.1109/tcc.2014.2326166
Wang, C., Zhang, X., Xiong, H., and Guo, C. (2023). Distributed shared energy storage scheduling based on optimal operating interval in generation-side. Sustain. Energy, Grids Netw. 34101026, 101026. doi:10.1016/j.segan.2023.101026
Wang, W., Huo, Q., Zhang, N., Yin, J., Ni, J., Zhu, J., et al. (2022). Flexible energy storage power station with dual functions of power flow regulation and energy storage based on energy-sharing concept. Energy Rep. 8, 88177–88185. doi:10.1016/j.egyr.2022.06.035
Wang, Z., Gu, C., Li, F., Bale, P., and Sun, H. (2013). Active demand response using shared energy storage for household energy management. IEEE Trans. Smart Grid 4 (4), 1888–1897. doi:10.1109/tsg.2013.2258046
Xiao, J., Yang, Y., Cui, S., and Liu, X. (2022). A new energy storage sharing framework with regard to both storage capacity and power capacity. Appl. Energy 307118171, 118171. doi:10.1016/j.apenergy.2021.118171
Yang, X., Fan, L., Li, X., and Meng, L. (2023). Day-ahead and real-time market bidding and scheduling strategy for wind power participation based on shared energy storage. Electr. Power Syst. Res. 214108903, 108903. doi:10.1016/j.epsr.2022.108903
Yu, D., and Ghadimi, N. (2019). Reliability constraint stochastic UC by considering the correlation of random variables with Copula theory. IET Renew. Power Gener. 13 (14), 2587–2593. doi:10.1049/iet-rpg.2019.0485
Zhang, Z., Ding, T., Zhou, Q., Sun, Y., Qu, M., Zeng, Z., et al. (2021). A review of technologies and applications on versatile energy storage systems. Renew. Sustain. Energy Rev. 148111263, 111263. doi:10.1016/j.rser.2021.111263
Zheng, S., Huang, G., and Lai, A. C. (2021). Techno-economic performance analysis of synergistic energy sharing strategies for grid-connected prosumers with distributed battery storages. Renew. Energy 1781261, 1261–1278. doi:10.1016/j.renene.2021.06.100
Zhijun, Ding, Song, Wang, and Changjun, Jiang (2023). Kubernetes-oriented microservice placement with dynamic resource allocation. IEEE Trans. Cloud Comput. 11 (2), 1777–1793. doi:10.1109/tcc.2022.3161900
Keywords: shared energy storage, overselling risk, leasing service, two-stage optimization, renewable energy station
Citation: Lan Z, Hu J, Fang X, Qiu W and Li J (2023) Risk-based optimization for facilitating the leasing services of shared energy storage among renewable energy stations. Front. Energy Res. 11:1286045. doi: 10.3389/fenrg.2023.1286045
Received: 30 August 2023; Accepted: 18 September 2023;
Published: 12 October 2023.
Edited by:
Nantian Huang, Northeast Electric Power University, ChinaReviewed by:
Liang Che, Hunan University, ChinaJiajia Yang, James Cook University, Australia
Tao Ding, Xi’an Jiaotong University, China
Copyright © 2023 Lan, Hu, Fang, Qiu and Li. This is an open-access article distributed under the terms of the Creative Commons Attribution License (CC BY). The use, distribution or reproduction in other forums is permitted, provided the original author(s) and the copyright owner(s) are credited and that the original publication in this journal is cited, in accordance with accepted academic practice. No use, distribution or reproduction is permitted which does not comply with these terms.
*Correspondence: Xin Fang, Zi54aW5Aemp1LmVkdS5jbg==