 Yixuan Hu1
 Jiajun Chen
 Zhangmao Hu
- 1Business School, Huaihua University, Huaihua, China
- 2School of Energy and Power Engineering, Changsha University of Science and Technology, Changsha, China
Rice straw (RS) is the residue obtained during the rice processing process, and is recognized as one of the most abundant biomass resources in the world. Approximately 800 million to 1 billion tons of rice straw are produced globally every year, and most of them are considered general waste and typically end up in landfills or incineration. This approach wastes resources and can also lead to environmental pollution. In the current study, the RS was used as the source of biodiesel production and a comprehensive process model of the RS valorization process was developed to evaluate the energy flow, production efficiency, production costs, and greenhouse gas emissions in Hunan Province, China. The evaluation results showed that the energy efficiency of biodiesel production from rice straw and the overall energy efficiency of the rice straw valorization process are reported as 52.1% and 56.1%, respectively. The minimum selling price of biodiesel, which is CNY 3.03/kg, is considerably lower than the current market prices for similar products in China. The largest proportion of the production cost of biodiesel is the cost of natural gas, followed by utilities, capital, transportation, plant maintenance and overheads, consumables, labor, and waste disposal. For the current RS valorization plant with a 5000 kg/h RS feed rate, the investment payback times are 8.9 yr and 7.1 yr when the biodiesel is sold at the lowest (CNY 4/kg) and highest (CNY 4.6/kg) market price, respectively. Environmental analysis shows that the greenhouse gas emissions intensity of biodiesel production is 75.8 g CO2eq/MJ, which is only about 52% of traditional fossil diesel and indicating that biodiesel is an environmentally friendly energy source.
1 Introduction
Developing clean and renewable energy and reducing greenhouse gas emissions is a matter of great concern worldwide. Biomass energy is considered an environmentally friendly option due to its green and carbon-neutral properties. The biomass reserves are enormous, and 200 billion tons of biomass can be formed annually through photosynthesis on Earth, but the current utilization rate is still very low. Biomass has the potential to produce biofuels such as bioethanol, biosyngas, biodiesel, biogas, biochar, biohydrogen. These biofuels are produced through the fermentation process of wheat, corn, sugar beet, crop residues (Singh and Chaudhary, 2017). From the perspective of environmental and economic benefits, liquid biofuels are particularly suitable for the transportation sector, and strengthen the national energy security and international stability by reducing the risk of excessive dependence on fossil fuel imports (Hassan et al., 2021). Both the Kyoto Protocol and the Paris Agreement strongly emphasize the use of liquid biofuels to replace gasoline, diesel, and jet fuels. Biodiesel is one of the most common liquid biofuels and a typical “green energy” with good environmental performance, good engine starting performance, excellent fuel performance, a wide range of raw material sources, and renewable characteristics. Vigorously developing biodiesel has important strategic significance for sustainable economic development, promoting energy substitution, reducing environmental pressure, and controlling urban air pollution. Biodiesel is mainly produced from vegetable oils and animal fats using conventional technology (Dias et al., 2009). however, this is unacceptable in terms of production costs and ensuring food supply. Therefore, alternative feedstock is urgently needed to enable biodiesel production from cheaper and non-food materials, and a lot of research effort has been targeted to find cheaper and non-food materials to produce biodiesel, such as microalgae (Huang et al., 2010) and waste grease (Mustafa, 2007; Gui et al., 2008; Kumaran et al., 2011), among others.
RS is the byproduct of rice production. It is estimated that the world produces approximately 800 million to 1 billion tons of RS annually, with Asia accounting for nearly 90% of the total production (IRRI, 2022). The annual production of RS in China is as high as 230 million tons (Liu et al., 2021a). Such a considerable amount has great potential for bioenergy production. RS has advantages such as high photosynthetic carbon fixation efficiency, fast growth and development, high specific calorific value, low ash concentration, and low production cost, which has a very high potential for energy production. The production of biodiesel from RS has great development prospects (Das et al., 2020). Biodiesel can be synthesis by the transesterification process (Tabatabaei et al., 2019). In order to understand the technical and environmental feasibility, it is necessary to conduct technical, economic, and environmental analyses on the process of producing biodiesel from RS.
Many studies involve the technical and economic evaluation of producing biodiesel from different raw materials. Ahmad et al. (2011) introduced the source and production process of biodiesel in detail, including pyrolysis, dilution, micro lotion, transesterification process, biodiesel fuel characteristics, engine emissions, combustion characteristics and engine performance, as well as the economic feasibility of biodiesel. Research has shown that biodiesel is a choice to overcome energy crises and environmental hazards. Kamil et al. (2020) conducted a techno-economic evaluation on an 8,000 t/a biodiesel production process from spent coffee grounds. Research has found that the annual capital cost and annual operating cost were $15.12 million and $1.91 million, respectively. The cost of biodiesel production as $0.24/kg. The authors claim that the process could generate a positive internal rate of return of 45%, indicating that the spent coffee grounds to biodiesel production project could be worth investing in. Gengiah et al. (2022) explored the techno-economic analysis of biodiesel production from marine macroalgae Codium tomentosum. It was found that the maximum biodiesel conversion rate was 90.5% at optimum conditions. For the plant with a production capacity of 20MT/batch, the payback period for the plant investment is 8.59 years with a positive NPV of 1.381 billion USD per year. Juneja et al. (2022) developed a process simulation model to study the flow of phosphorus in soybean biodiesel processes. The study showed that phosphorus can be economically recovered from soap residue and wastewater streams, with an estimated operating cost of $1.65 and $3.62 per kilogram of recovered phosphorus. Lee et al. (2020) evaluated the production of biodiesel from waste cooking oil using solid biochar as the catalyst for transesterification. The author concluded that the total investment of the plant was 54.4 M$ and the production cost of biodiesel was $1.8/kg. Szulczyk and Badeeb, 2022 used a partial equilibrium model called the Malaysian Agriculture and Plantation Greenhouse Gas Model to evaluate three potential raw materials: hemp, jatropha, and kenaf. The research results indicated that hemp and kenaf biodiesel are sustainable and economically feasible. Hemp and kenaf producers can produce and sell biodiesel, competing with the diesel price of $0.51 per liter. Riayatsyah et al. (2017) assessed the feasibility of using Reutealis trisperma, and the results indicated that the life cycle cost and payback period of the 50 kt Reutealis trisperma biodiesel production plant are $710 million and 4.34 years, respectively. Sun et al. (2023) performed an economic and environmental assessment on biodiesel production from crude glycerol. The results showed that the bioconversion of crude glycerol to biodiesel can not only increase economic value by 48% compared to the sale of crude glycerol, but also reduce the CO2 and SO2 emissions. Jingura and Kamusoko (2016) conducted an analysis of the life cycle assessment (LCA) analysis of jatropha biodiesel, and the results showed that although the jatropha biodiesel has a positive energy and GHG balance, there are location-specific differences and many opportunities for improvement. Wahyono et al. (2022) assessed the environmental performance of simulated multi-feedstock biodiesel production and compared it with palm oil biodiesel production in Indonesia. The authors do not recommend using soybeans, rapeseed, and sunflowers to produce biodiesel as they have a higher environmental burden than palm oil biodiesel.
Although many studies addressed the techno-economic or environmental analysis of producing biodiesel from biomass, research on the production of biodiesel from RS is still rare. In this study, a modelled RS valorizing process for biodiesel production in China is proposed and comprehensively evaluated for the techno-economic and environmental feasibility. The modelled process provides a detailed description of the RS conversion process, including raw material treatment, drying, oil extraction, and conversion into biodiesel. The study contributes substantially to the in-depth analysis of the economic performance and identification of key factors that can affect feasibility and plant viability. The overall mass balance and energy flow were developed based on carefully selected data from high-quality literature. The system performance and production efficiency results were incorporated into the economic performance evaluation model to calculate the MSPs of the products and their sensitivity to a range of factors. The internal rate of return and expected investment payback were analyzed to provide practical recommendations for the process’s development. Lastly, the study calculates and compares the full life cycle carbon emissions of biodiesel from RS during production and use with those of traditional diesel.
2 Material and methods
2.1 Material definition and characteristics
In this study, RS was sourced from Hunan Province, one of the rice main production region in China. Table 1 presents the results of proximate and ultimate analyses of the typical RS and the dried RS (DRS). RS usually contains 10–15 wt% water (Huang et al., 2010b) and the water content is taken as 11.7% in this work.
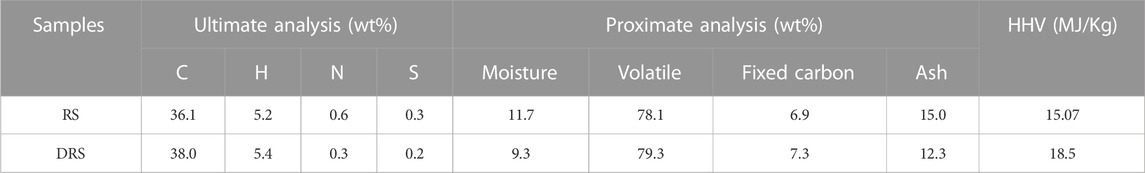
TABLE 1. Proximate and ultimate analyses of the RS and DRS.
2.2 RS valorization system
The RS valorization system, which was shown in Figure 1, includes five sub-systems: feedstock pre-treatment, pyrolysis, purification of biodiesel, waste treatment and disposal, and heat supply. The system boundary of the process model encompasses all the processing steps from RS reception to biodiesel production and waste disposal. As shown in Figure 1, RS is first collected and stored in storage tanks for a week. This storage process can remove some moisture. The RS coming out of the storage tank is then fed into a grinding machine to grind into particles with a particle size of 15 mm, which can achieve a good balance between energy consumption during grinding and pyrolysis performance. After grinding, the RS is sent to a torrefaction room and torrefied at 240°C for 30 min, resulting in the removal of approximately 9.7% of the moisture and obtaining DRS. The DRS is then transferred to the pyrolysis chamber for pyrolysis, producing three main products: bio-oil, fuel gas, and biochar. Bio-oil primarily consists of two types: biodiesel and glycerol, which can be easily separated through physical methods. The initial biodiesel can be further purified to obtain high-quality biodiesel by adding methanol and conducting transesterification in an alkaline environment. The wastewater generated during the purification process of biodiesel and glycerol is treated as waste effluent.
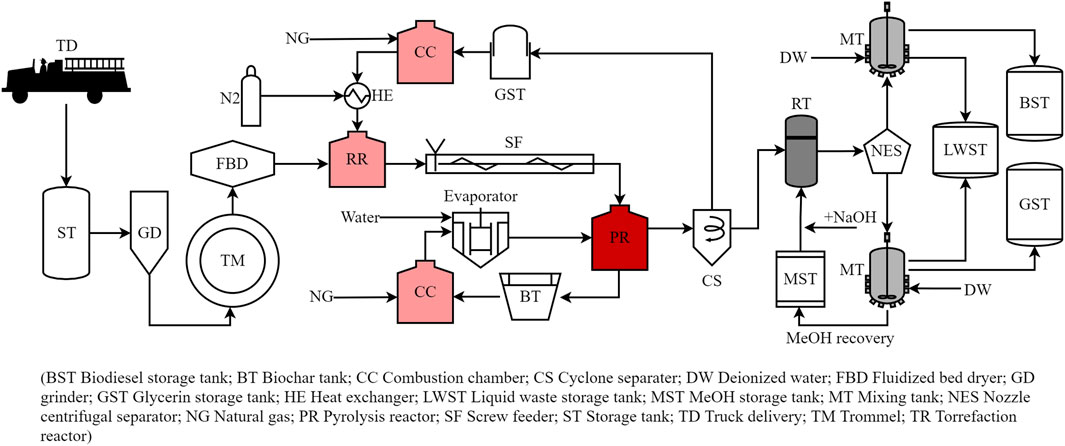
FIGURE 1. Schematic diagram of the RS utilization system.
2.2.1 Feedstock handling and drying
RS is characterized by a high oxygen content, high water content, low energy density, strong hydrophilicity, and difficulties in storage and grinding. These characteristics limit the application of RS pyrolysis. Therefore, RS usually requires treatment before pyrolysis to enhance its energy conversion efficiency (Chew and Doshi, 2011). Torrefaction, an effective biomass pretreatment process, involves low-temperature pyrolysis and the removal of water and some light volatile components in an anaerobic or anoxic environment at 200°C–300°C (Buratti et al., 2018). It increases the energy density of RS and reduces water and oxygen content. In this study, N2 is used as the carrier gas, with a torrefaction temperature of 240°C and a torrefaction time of 30 min. Figure 2 illustrates the energy and mass flow in the torrefaction process. From Figure 2, it can be observed that the heat required during the torrefaction process is provided by natural gas (4000 MJ/h), torrefaction gas generated during the torrefaction process (9694 MJ/h), and a small portion is also provided by the pyrolysis gas (6852 MJ/h). This maximizes the utilization of the straw’s own energy, reduces the reliance on natural gas, improves economic efficiency, and minimizes CO2 emissions.
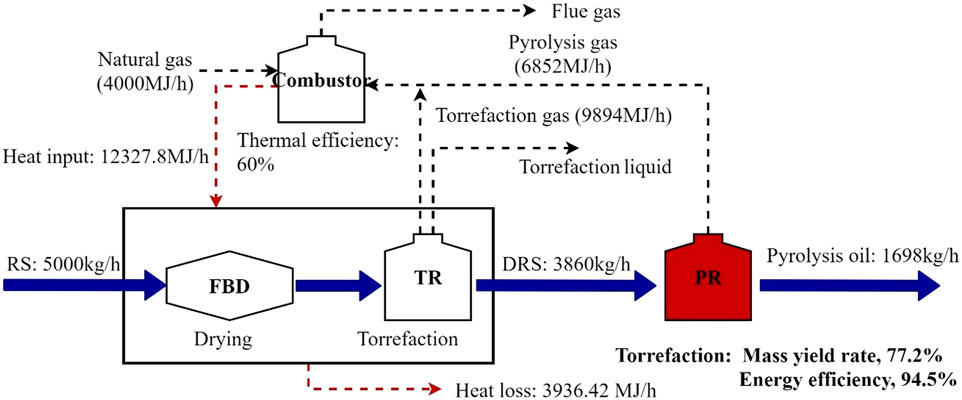
FIGURE 2. The energy and material flow of torrefaction process.
2.2.2 Pyrolysis process
In this study, the fluidized bed is chosen as the pyrolysis reactor. The DRS is fed into the pyrolysis chamber using a screw feeder. Nitrogen is used as the pyrolysis atmosphere, with a pyrolysis temperature of 550°C, a heating rate of 10°C/min, and a solid residence time of 10 min. Under these operating conditions, the pyrolysis process yields pyrolysis oil, biochar, and fuel gas, accounting for 45%, 42%, and 12% respectively. The biochar produced from pyrolysis is directly separated at the bottom of the pyrolysis chamber, while the gas and liquid obtained from pyrolysis are separated in the cyclone separator. The pyrolysis process requires a total energy input of 29,309 MJ/h, derived from natural gas combustion (32.8%) and the utilization of pyrolysis product biochar (67.2%).
2.2.3 Production of biodiesel
The production of biodiesel involves three steps: transesterification, biodiesel purification, and MeOH recovery. Transesterification requires the use of alkaline catalysts. In commercial biodiesel applications, common alkaline catalysts include KOH and NaOH, among others. In this study, NaOH has been chosen as the catalyst. The RS pyrolysis oil undergoes transesterification with MeOH under the promotion of NaOH catalyst, generating methyl oleate (C19H36O2) and glycerol (C3H8O3):
For the transesterification process described above, the optimal reaction temperature is 60°C, and the mass of NaOH catalyst is 1.5% of the RS pyrolysis oil (Lin and Li, 2009). Two main products can be obtained from transesterification: biodiesel and glycerol. The generated biodiesel floats at the top of the reactor, while the glycerol layer remains at the bottom. After the glycerol completely settles under gravity, a decanter is used to separate the two layers. Since the separated biodiesel contains impurities such as NaOH, MeOH, soap, and glycerol ester, a multi-stage water washing process is employed for biodiesel purification. This process includes static washing and two rounds of foam washing, which requires a water consumption of 5% of raw biodiesel. Before sending the mixture of glycerol and MeOH to a distillation column for MeOH and glycerol separation, the soap in the mixture is first removed by a nozzle centrifugal separator.
2.2.4 Waste disposal
Wastewater, flue gas, and ash are the main process wastes from the plant. Wastewater, which is the primary process waste, is mainly generated during RS drying and purification of biodiesel and glycerol. It generally contains biodiesel, glycerol, NaOH, MeOH, and soap. Typically, the wastewater is treated by the industrial sewage plant, which incurs a high treatment cost due to its high chemical oxygen demand. The flue gas generated by the combustor is treated to fully comply with local emission regulations before being discharged into the atmosphere. The ash from the combustion chamber can be utilized as raw materials for fertilizer or cement production. Therefore, it is accepted and taken away by local fertilizer or cement production plants without any additional cost.
2.3 Process mass and energy balances
To determine the overall production efficiency of the entire process, a spreadsheet model is used to calculate the process energy flow and mass balance of the conversion process. All the key process parameters are presented in Table 3. Based on the mass of DRS, the yields of the main products in the process are as follows: 44.0% RS pyrolysis oil, 41.8% biodiesel, 6.9% glycerol, and 42% biochar. The energy efficiencies of the heat exchanger, fluidized bed dryer, and combustor used in this study are 85%, 60%, and 80%, respectively (Shah et al., 2012; Yahya, Al-Qodah, and Ngah, 2015). The total energy input for the process comes from RS and natural gas. The production efficiencies are then calculated as follows:
where
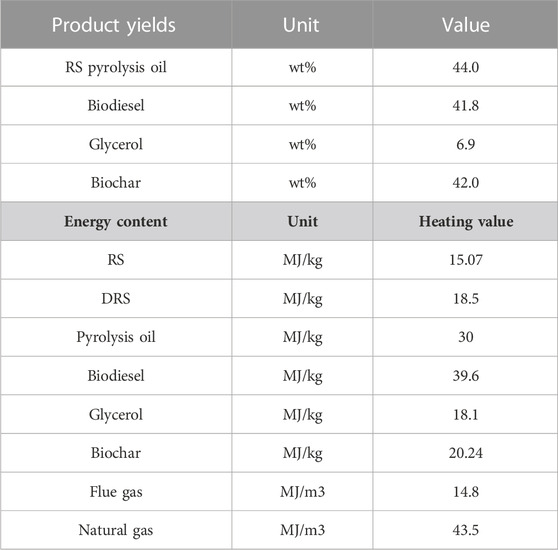
TABLE 2. Key process parameters used in the spreadsheet model.
3 Economic evaluation
3.1 General assumptions
Before conducting an economic evaluation of the proposed process, certain assumptions have been made as follows: 1) The plant is assumed to be constructed in an area with complete infrastructure facilities available for electricity, water, and industrial sewer access. The prices of all products are assumed to be acceptable to consumers, ensuring that all products can be sold. 2) The plant is assumed to have a lifespan of 20 years, with a salvage value of 15% of the equipment cost calculated at the end of the project (Liu et al., 2021b). 3) During the plant’s lifespan, the annual operating time is assumed to be 335 days, with an availability rate of 95%. In China, the construction time for such plants is typically 3 years (Kookos, 2018). The corporate tax rate for company profits and the industrial capital loan interest rate are taken as 32% and 4.9%, respectively.
3.2 Capital cost
The Total Plant Cost (TPC) of the plant includes all capital required for the entire production process until it can be officially put into operation, including expenses incurred in the early development and construction stages. The Equipment Cost (EC) is the total cost of purchasing new equipment delivered to the plant gate for installation and is the basic part of the TPC. All equipment prices used to calculate ECs in this study were selected from published data. The Direct Factory Cost (DPC) comprises ECs and other incremental factors such as installation, instrumentation, piping, electrical equipment, structure and architecture, civil engineering, and hysteresis. TPC consists of Installed Plant Cost (IPC), commissioning cost, contractor cost, interest during construction, and contingency cost. IPC is obtained by adding management costs and engineering design costs. Generally, TPC can be obtained by multiplying DPC by a factor, which, for the plant in this study and other similar plants, was set at 1.69 (Bridgwater et al., 2002; Rogers and Brammer, 2012). The calculation results for EC, DPC, IPC, and TPC are shown in Table 3.
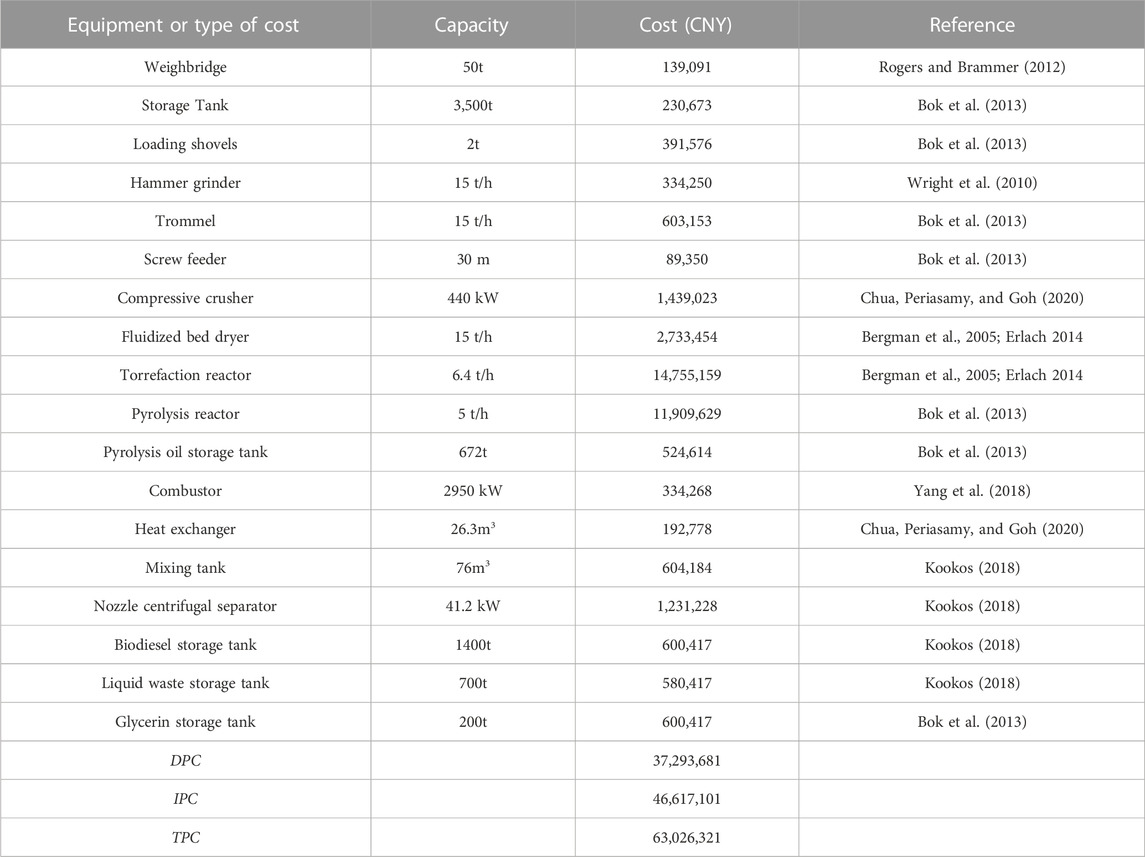
TABLE 3. List of equipment and associated costs for the 5 t/h RS valorization plant.
Annual Capital Cost (ACC) refers to the amount of capital that a company needs to repay annually after borrowing the TPC at a certain interest rate:
where TPC is Total Plant Cost, CNY; n is the project lifetime in years; i is the interest rate of the capital loan.
3.3 Operating cost
3.3.1 Consumables and utility costs
In the process proposed in this paper, the consumables mainly include rice-straw, methanol, sodium hydroxide and natural gas, with a price of CNY 34/t, 1765/t, 2211/t, and 3.49/m3, respectively. Water and electricity are the main utilities. Based on the estimated average electricity price and water price for industrial users in China in 2021, the electricity price and water price are approximately CNY 0.725/kWh and CNY 4.1/t. It is estimated that 25.2 kWh electricity and 1.26 tons water are used for processing 1 ton of RS. Taking a plant that processes 38190t of RS annually as an example, the costs of the consumables and utilities required for the process are presented in Table 4.
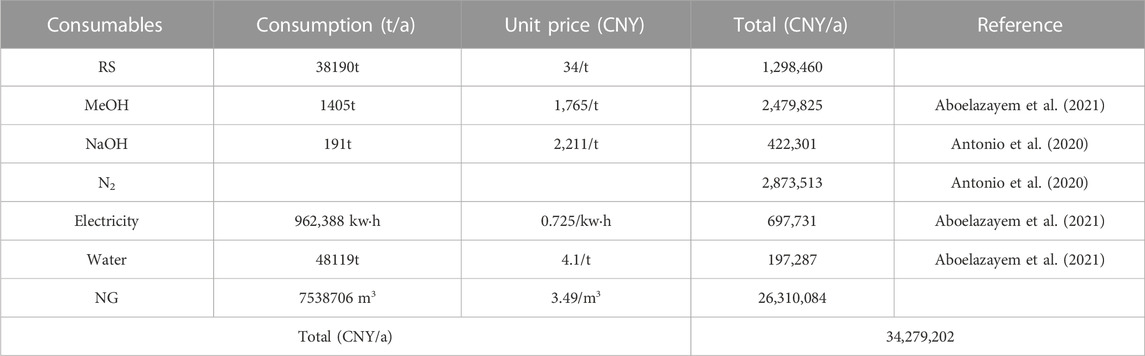
TABLE 4. Process consumables and utilities costs for the 38190t/a plant.
3.3.2 Labor costs
To determine the operating labor cost, we first determined the number of workers required for each shift and equipment, and then calculated the total number of workers needed for factory operation. It is estimated that the plant requires 15 staff members per day, including a daily shift with one factory manager, one administrator, and one technical manager, as well as three shifts with one supervisor and three operators. The average annual wage per person for chemical plants in China is CNY 76,125 (State Statistical Bureau, 2019), resulting in a total annual labor cost for the plant of CNY 1,141,875.
3.3.3 Plant maintenance and overheads costs
The annual maintenance costs and indirect expenses (including insurance, rent, taxes, etc.) are calculated as a percentage of annual TPC. Based on previous similar work (Bridgwater et al., 2002), the annual cost of plant maintenance and the plant overheads are taken to be 2.5% and 2.0% TPC, respectively.
3.3.4 Waste disposal cost
According to China’s “ordinance of Pollutant Discharge Feeing Collection, Use and Management,” the cost of industrial wastewater discharge (CIWD) can be calculated by:
where PET is unit pollution equivalent tax at a fee of CNY 0.7;
In this work, biodiesel, NaOH and glycerol are the first three pollutants in wastewater. the PEA of biodiesel, glycerol and NaOH are 0.1 kg, 0.16 kg and 0.13 kg, respectively. By calculation, the cost of industrial wastewater discharge is CNY 10.1/t.
3.3.5 Transportation cost
The cost of transportation (CT) is related to the transportation distance and truck cargo capacity:
where D and Ft are the retail prices of diesel and fuel tax, CNY/L, respectively; K is the transportation distance, km, and W is the load, t. AFC is the average fuel consumption of truck, and for the trucks weighing 3.5 tons or more, it is 3.7 km/L.
In this work, the Chiueh PT model (Chiueh et al., 2012), which is used to calculate the transportation cost of RS in Taiwan, China, is selected, and the CT calculated using the Chiueh P-T model is CNY 80–100/t.
3.4 Product sales
Biodiesel and glycerol are the two products from the plant can be sold for revenue. The lowest, base case and highest selling price for biodiesel are taken as CNY 4.0/kg, 4.3/kg, and CNY 4.6/kg, respectively. The selling price of glycerol is taken as CNY 5.6/kg. All prices quoted here exclude the VAT.
3.5 Minimum selling price
In this work, biodiesel is the main product, and glycerol is the by-product. Based on the assumption that customers emption glycerol and biodiesel at the lowest market price, the MSP of biodiesel can be calculated by:
where ACC is the annual cost of capital, CNY/a; OC is the annual operating cost, CNY/a; QBiodiesel is the quantity of biodiesel, kg/a; SGlycerol are the annual sale of glycerol, CNY/a.
3.6 Internal rate of return
The internal rate of return, which is an effective measure for the evaluation of project profitability, is the discount rate when the total present value of capital inflows is equal to the total present value of capital flows, and the net present value (NPV) is zero. The NPV of the invested project is equal to the sum of the discounted cash flows of each year, and the greater the NPV, the better. Generally, when the IRR is greater than or equal to the benchmark rate of return, it indicates that the project is feasible. The NPV is calculated as:
where
3.7 Rate of return on investment
The rate of return on investment (ROI) refers to the value that should be returned through investment, which is the economic return that a company receives from an investment activity, and it can be calculated by:
where ANP is the annual net profit, and IC is the total invested capital of the project in a year.
It should be noted that the ANP can be either pre-tax or post-tax, sometimes defined as the net profit in the third year after the project is launched. Investment capital can be referred to as original total capital investment, fixed capital, depreciation investment, average investment, etc.
3.8 Investment payback time
The investment payback time (PBT) is the time it takes for the total income obtained after the investment project is put into operation to reach the total investment amount invested in the investment project, and can be calculated by:
where FC is the fixed capital, CNY; AP is the average profit, which is calculated based on revenue minus OC, CNY/a. AD is the average depreciation, CNY/a.
4 Environmental evaluation
Life cycle assessment (LCA) is an effective environmental tool that deals with the complex interactions, recovery, and final disposal of products or activities throughout their entire life cycle, from cradle to grave. It quantifies the resources and effluents consumed at various stages, including acquisition, manufacturing, use, and resource treatment. In this work, LCA is applied to evaluate the environmental impacts of the RS valorization process. The framework consists of four main steps: (a) goal and scope determination, (b) inventory scrutiny, (c) impact evaluation, and (d) data interpretation (Guinee et al., 2002).
4.1 Goal and scope definition
The goal of this study is to calculate the annual carbon dioxide (CO2) absorption or emissions per ton of biodiesel production in each stage of each production path. The research scope starts from the extraction and processing of raw materials, and its boundaries are shown in Figure 3.

FIGURE 3. Research scope.
4.2 Inventory scrutinization
Life cycle inventory analysis starts with the acquisition of raw materials, and the intermediate process includes production, transportation, production, use, recycling, and final disposal. A functional unit is a quantitative description of the identification function of a product system, used as a reference unit. Choosing appropriate functional units for comparison between biofuels and fossil fuels is crucial, as different choices may lead to different results. The functional units used in the bioenergy system can be divided into four types: input unit correlation, output unit correlation, agricultural land unit and year. In this work, it is recommended to input unit related information such as MJ calorific value biomass and ton mass biomass.
4.3 Impact evaluation
The functional unit used in this work is 1 MJ of biodiesel, representing the final product obtained through a series of processes. We considered all the equipment required to convert straw biomass into commercial biodiesel, as well as the impact of energy input and output such as electricity and natural gas, and have accounted for the carbon emissions of each process.
4.3.1 Upstream emissions
The upstream emission process mainly refers to the potential greenhouse gas emissions to the environment before obtaining qualified raw biomass. This includes various cultivation techniques, crop management methods, and the use of biofuels in harvesting equipment. Since biomass absorbs CO2 from the atmosphere during its growth process, it is considered carbon neutral in many biofuel LCA studies, and the CO2 emitted by biomass during energy conversion and utilization is offset by the previously absorbed CO2. The CO2 emissions generated by biowaste are not counted, as biomass waste is also carbon neutral. According to Sharma’s research (Sharma et al., 2020), for every 1 kg of raw RS produced for the high-value process, the total lifetime greenhouse gas emissions are 0.08194 kg CO2eq (CO2 emission equivalent). Among them, the greenhouse gas emissions from the collection process and pretreatment process of RS are approximately 0.03953 kg CO2eq/kg and 0.04241 kg CO2eq/kg, respectively.
4.3.2 Transportation emission
When transporting straw, the transportation tool used diesel. The Energy consumption
where
4.3.3 Plant operation emissions
The greenhouse gas emissions generated by plant mainly come from industrial electricity and water use, with greenhouse gas emissions of approximately 0.394 kg CO2eq/kWh and 0.678 kg CO2eq/t. The electricity and water consumption are already provided in Section 3.
4.3.4 Pre-treatment emissions
During the pre-treatment stage, torrefaction is an important process, and its impact on the environment needs to be considered. Torrefaction temperature has a very important impact on the greenhouse gas emissions. The higher the temperature, the higher the emissions. When the torrefaction temperature is below 250°C, the greenhouse gas emissions are relatively low, while when the torrefaction temperature is above 275°C, the emissions rapidly increase. Research shows that for every 1 kg of RS torrefied, approximately 0.1469–0.2707 kg of carbon dioxide is released (Zhang et al., 2022). In this work, the torrefaction temperature is set at 240°C, which is lower than 250°C, resulting in approximately 734.5 kg of carbon dioxide emissions per hour.
4.3.5 Thermochemistry emissions
As the carbon in the pyrolysis gas and biochar is captured from the atmosphere by plant photosynthesis, the greenhouse gases produced during the combustion of pyrolysis gas and biochar in the burner are not included in the total greenhouse gas emissions of the system. During the pyrolysis of DRS, the main sources of carbon emissions are methanol and NaOH. The greenhouse gases emitted by the chemical plant for every 1 kg of methanol and catalyst NaOH produced are 1.32 kg CO2 and 2.04 kg CO2, respectively. The energy consumed for their production is 38.1 MJ and 21.7 MJ, respectively. For the plant in this work, the consumption of methanol and NaOH is 166 kg/h and 25 kg/h, respectively, resulting in a total CO2 emissions of 270.12 kg/h.
4.3.6 Biodiesel usage emissions
When biodiesel is used, it emits CO2, with an emission intensity of approximately −274 to 155 gCO2/MJ (Sharma et al., 2020). Generally, the carbon intensity caused by the industrial production process of biodiesel is about 14 gCO2/MJ. In this work, the calorific value of the biodiesel produced is 39.6 MJ/kg. This means that for every 1 kg of biodiesel used, approximately 0.554 kg of CO2 will be emitted.
5 Result and discussion
5.1 Overall production efficiencies
The process mass and energy balances and the energy efficiencies of the individual and overall RS valorization process for the base case scenario are presented in Table 5. In addition, the process mass and energy flow in the form of Sankey diagrams is illustrated in Figure 4. As shown in Table 5 and Figure 4, for the plant with an RS feed rate of 5,000 kg/h (75350 MJ/h), 1,140 kg/h (22.8 wt%) of the RS was torrefied during the pre-treatment process, and 3,860 kg/h (77.2%) of DRS was fed into the pyrolysis and activation system for biodiesel production. Based on the mass of DRS fed, the yields of the main products from the process are: 41.99% biochar, 41.79% biodiesel, 12.99% pyrolysis gas, and 6.96% glycerol. The rate of biodiesel production is 1613 kg/h.
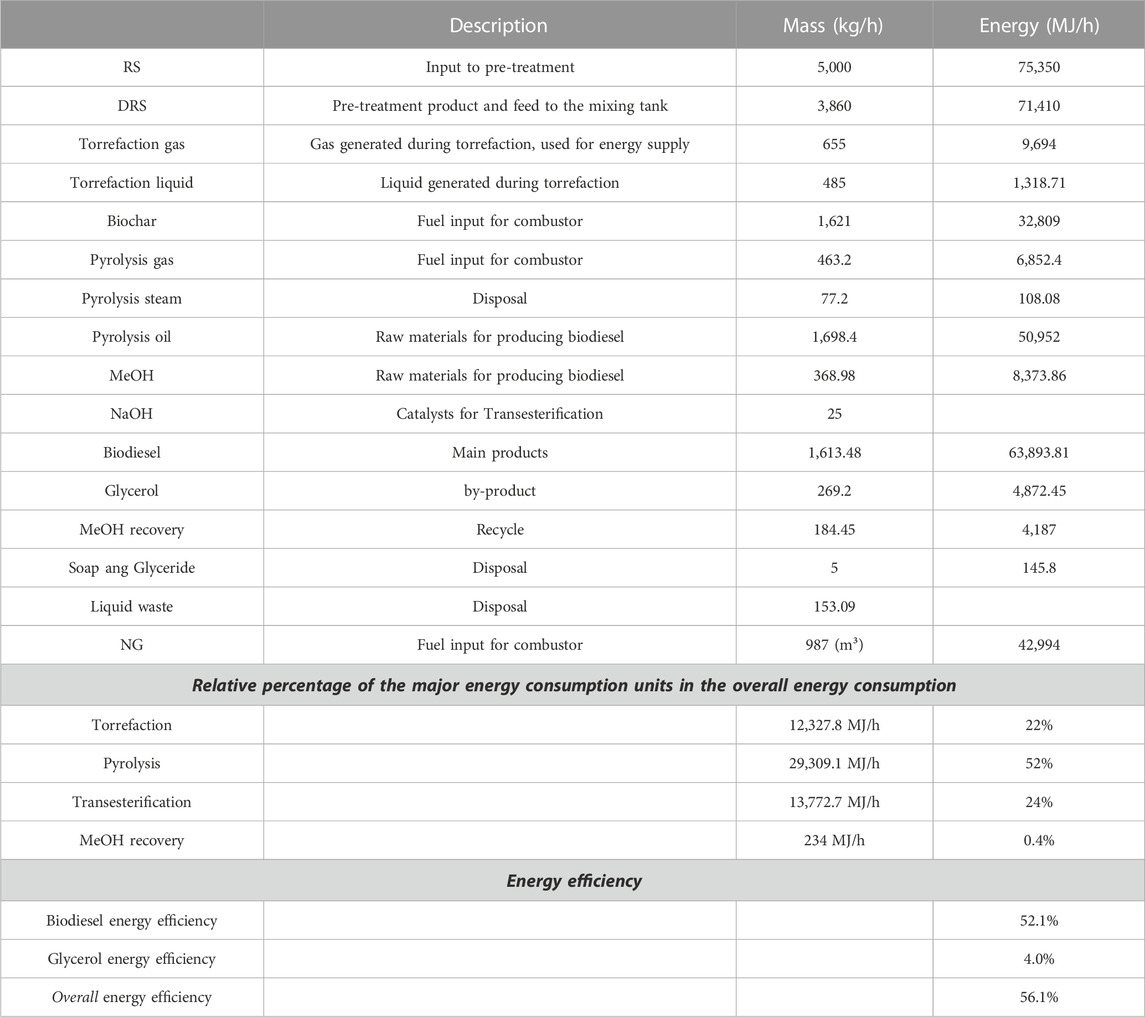
TABLE 5. Process mass balance, energy flow and system efficiencies.
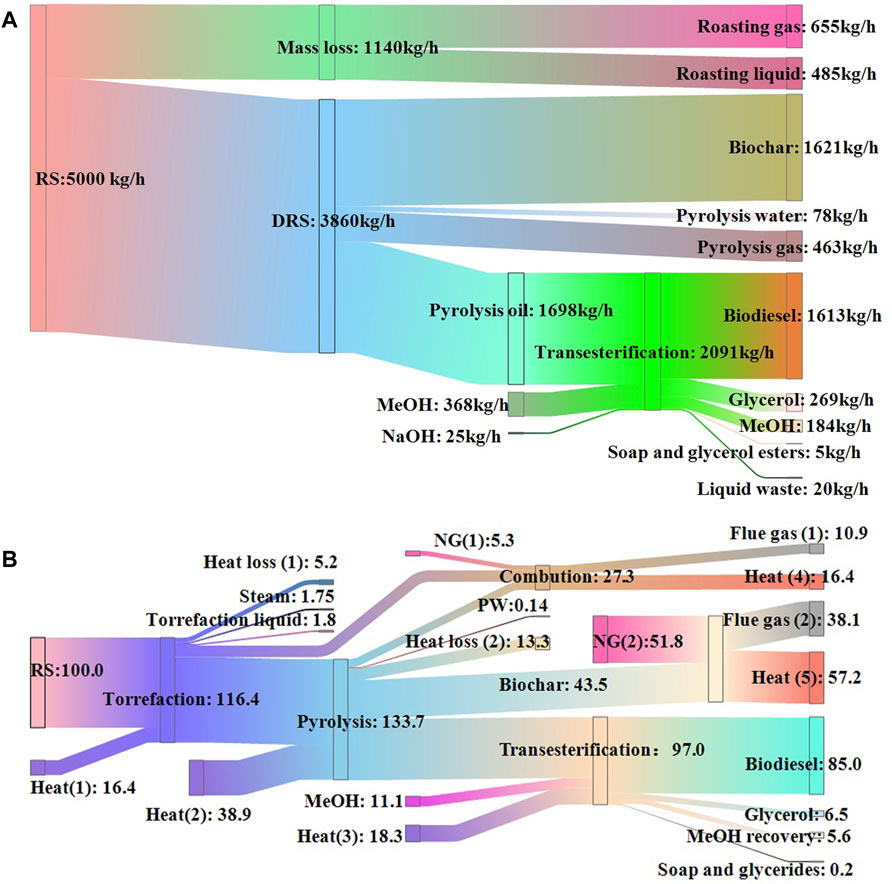
FIGURE 4. Process mass balance and energy flow. (A) Mass balance (B) Energy flow.
The data presented in Figure 4 was converted from the actual data presented in Table 5, and 100.0 is employed as the starting value for the RS energy content. The gas generated during torrefaction process can provide 9694 MJ/h for torrefaction and other processes. All the torrefaction gas (655 kg/h), pyrolysis gas (463 kg/h) and biochar (1621 kg/h) generated during pyrolysis process were combusted on site to generate 39661 MJ/h heat, and meets 72% of the total heat requirement for RS torrefaction, pyrolysis and transesterification. The energy contents of biodiesel and glycerol accounted for 52.1% and 4% of the total energy input, respectively, and the overall production energy efficiency of the system was calculated as 56.1%.
5.2 Minimum selling price of the products
The MSP of biodiesel and its breakdown are presented in Figure 5. In this figure, the positive bars represent the direct costs, while the negative bar indicate the incomes from glycerol sales. It can be found from Figure 5 that the cost of natural gas is the most significant contributing factor in the MSP of biodiesel, followed by ACC, consumables, utilities, CT, plant M&O, labor costs, and waste disposal cost. CT, plant M&O, consumables are at a similar level. Labor costs rank second to last, which differs from the conclusions of many similar studies conducted in developed countries, where equipment and labor costs are usually much higher than in China. Waste disposal costs are relatively insignificant in the current study.

FIGURE 5. The MSP of biodiesel and its breakdown.
In terms of product sales revenue, the sales of glycerol have a significant impact on the MSP of biodiesel. As a byproduct, increasing the selling price and production of glycerol can reduce the MSP of biodiesel and improve the economic feasibility of the process. When the selling price of glycerol is CNY 5/kg, the MSP of biodiesel is CNY 3.03/kg. The current market price of biodiesel is CNY 4.0–4.6/kg, indicating that the plant has a certain profit margin for biodiesel production.
5.3 IRR, ROI, and PBT
IRR, ROI, and PBT are the basis for revenue and profitability analysis. Figure 6 shows the IRR, ROI, and PBT of the plant when the sale price of biodiesel is at the lowest, middle, and highest price in the Chinese market with a sale price of glycerol CNY 5/kg. It can be seen from Figure 6 that the plant can have an IRR of 15.9% when the biodiesel sold at lowest market price (CNY 4.0/kg). When the biodiesel sold at an middle market price (CNY 4.3/kg), IRR is increased to 18.9%. When sold at the highest market price (CNY 4.6/kg), the plant can have an IRR of 20.7%, which is 4.8% higher than that at the lowest market price. Overall, at the current market price, the IRR is higher than the capital interest (8%), confirming that the project can generate positive internal revenue and is profitable.
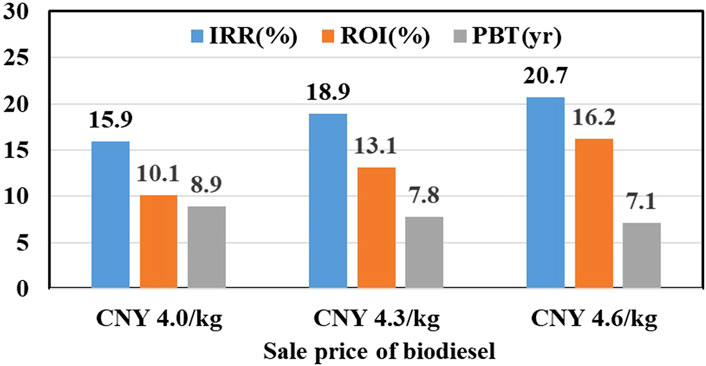
FIGURE 6. Effect of the sale price of biodiesel on IRR, ROI and PBT.
If biodiesel can only be sold at the lowest market prices (CNY 4.0/kg), the plant can achieve a marginal profit with an ROI of 10.1% and a payback of 8.9 years. When sold at the highest market prices, the ROI increases to 16.2% with a payback of 7.1 years. Generally, if the ROI is higher than 10%, the project performance is satisfactory. Obviously, the current RS valorization plant is feasible to be implemented when the sold price of biodiesel is higher than CNY 4.0/kg. For large petrochemical and refining plants, the PBT is generally 7–12 years, and the results illustrated in Figure 6 show that the PBT of this project is satisfactory.
5.4 Sensitivity analysis
The sensitivity analysis can provide a reasonable economic forecast for changes in biodiesel production cost. The price of nature gas and the sale price of glycerol are the two factors that have the greatest impact on the MSP of biodiesel. The price of NG varies considerably in different regions in China, being CNY 1.9–4.98/m3 (Tian et al., 2021). Figure 7 presents the impact of NG cost on the economic indicator of the MSP of biodiesel when glycerol is sold at a price of CNY 5/kg. It can be observed from Figure 7 that MSP is linearly correlated with NG prices, and a 61.8% reduction in natural gas costs can lead to a 47.7% reduction in the MSP of biodiesel. Therefore, plant operators are highly interested in optimizing process routes, more effectively utilizing process heat to reduce natural gas consumption, and identifying suitable but low-cost fuels to replace on-site NG usage.

FIGURE 7. Effect of the sale price of NG on the MSP of biodiesel.
The impact of the sale price of glycerol on the economic indicators of IRR, ROI, PBT, and the MSP of biodiesel is illustrated in Figure 8. When the glycerol is sold at a price of CNY 5/kg, IRR, ROI, PBT and the MSP of biodiesel are 15.9%, 10.1%, 8.9 years and CNY 3.03/kg, respectively. As the sale price of glycerol increased from CNY 5/kg to 6/kg, the IRR, ROI gradually increased, reaching 17.6 and 11.7 respectively. The PBT is shortened to 8.3 years, and the MSP of biodiesel has also been reduced to CNY 2.86/kg. However, it is not that the higher the price of glycerol, the better the economic performance of the plant. The model applied in this work is based on the premise that all products can be sold. When the sale price increases, it will inevitably reduce the sales volume, so it must also be considered comprehensively based on the actual situation.
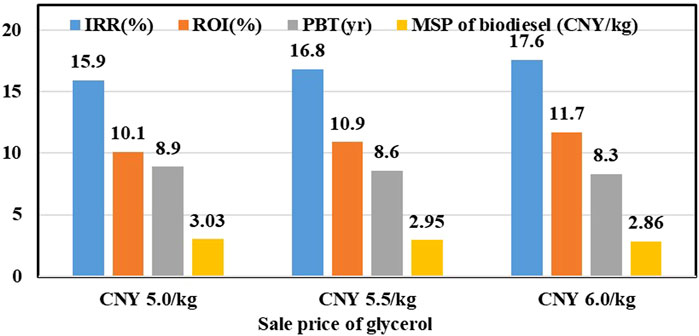
FIGURE 8. Effect of the sale price of glycerol on IRR, ROI, PBT and the MSP of biodiesel.
5.5 Impact on environment
Figure 9 shows the annual emissions and their proportions of greenhouse gases in the various processes involved in producing biodiesel from rice straw. It can be observed from Figure 9 that the process of using biodiesel has the highest greenhouse gas emissions, with an annual emission of 25048969 kg of CO2, accounting for 68% of the total greenhouse gas emissions. Nevertheless, the use of biodiesel is still considered environmentally friendly. Compared to traditional fossil diesel, burning 1 kg of biodiesel emits only 2.03 kg CO2, and the lifetime total greenhouse gas emissions from producing 1 kg of biodiesel are only 3.0 kg CO2, which is only 48% of the emissions generated by diesel. The calorific value of biodiesel is slightly lower than that of fossil diesel. After conversion, the greenhouse gas emission intensity of biodiesel is 75.8 g CO2eq/MJ, accounting for only 52% of the greenhouse gas emission density of fossil diesel 145.5 g CO2eq/MJ. The pre-treatment stage generates annual carbon emissions of 5610111 kg, which is second only to the use of biodiesel and accounts for 15% of the total emissions. This is because a large amount of natural gas needs to be consumed during the torrefaction process to maintain a certain torrefaction temperature. Due to the numerous evaluation indicators involved in environmental analysis, it is challenging to accurately quantify the impact of biofuels on the environment. To better support policy evaluation and formulation in China and globally, LCA research with standardized methods is needed. In addition to evaluating energy consumption and greenhouse gas emissions, more comprehensive impact categories need to be assessed.
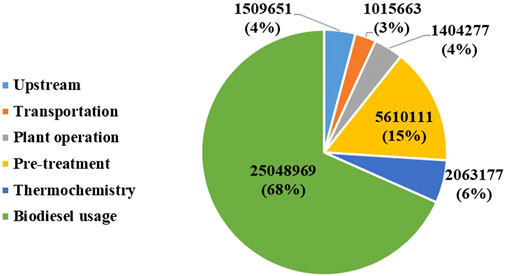
FIGURE 9. Annual greenhouse gas emissions of each process.
6 Conclusion
In this work, the valorization process of rice straw (RS) for biodiesel in China is presented, and its techno-economic and environmental performance are comprehensively evaluated. Based on the analysis of the process using wet raw materials, the current plant, with a 5,000 kg/h RS feed rate, is capable of producing 1,613 kg of biodiesel and 269 kg of glycerol per hour. The fuel gas and biochar generated during the pyrolysis process are utilized for process heat generation, but additional natural gas is required to fully meet the heat demand. The energy efficiency of biodiesel production and the overall energy efficiency of RS valorization process are 52.1% and 56.1%, respectively, which are higher than those of other similar chemical plants.
From the economic analysis, the minimum selling price (MSP) of biodiesel is calculated to be CNY 3.03/kg, which is significantly lower than the current market price of these products. The cost of natural gas constitutes the largest proportion of the production cost of biodiesel, followed by utilities, ACC, CT, plant M&O, consumables, labor costs, and waste disposal cost. The post-tax return on investments (ROIs) for the current plant are 10.1% and 16.2% when biodiesel is sold at the lowest (CNY 4/kg) and highest (CNY 4.6/kg) market prices, respectively.
The environmental analysis reveals that the full life cycle greenhouse gas emissions intensity of biodiesel production is only about 52% of those associated with traditional fossil diesel, indicating that biodiesel is indeed an environmentally friendly energy source.
Data availability statement
The original contributions presented in the study are included in the article/Supplementary material, further inquiries can be directed to the corresponding authors.
Author contributions
YH: Methodology, Writing–original draft. JC: Data curation, Writing–original draft. HT: Resources, Supervision, Writing–review and editing. ZH: Writing–review and editing.
Funding
The author(s) declare financial support was received for the research, authorship, and/or publication of this article. The authors would like to thank the Natural Science Foundation of China for Young Scholars (No. 51706022), the Natural Science Foundation of Hunan Province of China for Young Scholars (No. 2018JJ3545), Open Fund of Key Laboratory of Renewable Energy Electric-Technology of Hunan Province (No. 2017ZNDL007).
Conflict of interest
The authors declare that the research was conducted in the absence of any commercial or financial relationships that could be construed as a potential conflict of interest.
Publisher’s note
All claims expressed in this article are solely those of the authors and do not necessarily represent those of their affiliated organizations, or those of the publisher, the editors and the reviewers. Any product that may be evaluated in this article, or claim that may be made by its manufacturer, is not guaranteed or endorsed by the publisher.
References
Aboelazayem, O., Gadalla, M., Alhajri, I., and Saha, B. (2021). Advanced process integration for supercritical production of biodiesel: residual waste heat recovery via organic rankine cycle(ORC). Renew. Energy 164, 433–443. doi:10.1016/j.renene.2020.09.058
Ahmad, M., Zafar, M., Azam, A., Sadia, H., Khan, M. A., and Sultana, S. (2011). Techno-economic aspects of biodiesel production and characterization. Energy Sources, Part B Econ. Plan. Policy 6 (2), 166–177. doi:10.1080/15567249.2010.529557
Antonio, N. V., Jaime, P. Y., Anel, D. G. D., Ojeda, K. A., and Eduardo, S. T. (2020). Biodiesel and hydrogen production in a combined palm and jatropha biomass biorefinery: simulation, techno-economic, and environmental evaluation. ACS Omega 13 (5), 7074–7084.
Bergman, P. C. A., Boersma, A. R., Zwart, R. W. R., and Kiel, J. H. A. (2005). Torrefaction for biomass Co-firing in existing coal-fired power stations. Energy Res. Centre Neth. 71, ECNC05013.
Bok, J. P., Choi, H. S., Choi, J. W., and Choi, Y. S. (2013). Fast pyrolysis of miscanthus sinensis in fluidized bed reactors: characteristics of product yields and biocrude oil quality. Energy 60, 44–52. doi:10.1016/j.energy.2013.08.024
Bridgwater, A. V., Toft, A. J., and Brammer, J. G. (2002). A techno-economic comparison of power production by biomass fast pyrolysis with gasification and combustion. Renew. Sustain. Energy Rev. 6 (3), 181–246. doi:10.1016/s1364-0321(01)00010-7
Buratti, C., Barbanera, M., Lascaro, E., and Cotana, F. (2018). Optimization of torrefaction conditions of coffee industry residues using desirability function approach. Waste Manag. 73, 523–534. doi:10.1016/j.wasman.2017.04.012
Chew, J. J., and Doshi, V. (2011). Recent advances in biomass pretreatment – torrefaction fundamentals and technology. Renew. Sustain. Energy Rev. 15, 4212–4222. doi:10.1016/j.rser.2011.09.017
Chiueh, P. T., Lee, K. C., Syu, F. S., and Lo, S. L. (2012). Implications of biomass pretreatment to cost and carbon emissions: case study of rice straw and pennisetum in taiwan. Bioresour. Technol. 108, 285–294. doi:10.1016/j.biortech.2012.01.006
Chua, S. Y., Periasamy, L. A. P., Goh, C. M. H., Tan, Y. H., Mubarak, N. M., Kansedo, J., et al. (2020). Biodiesel synthesis using natural solid catalyst derived from biomass waste — a review. J. Industrial Eng. Chem. 81, 41–60. doi:10.1016/j.jiec.2019.09.022
Das, P. K., Das, B. P., and Dash, P. (2020). 13-Potentials of postharvest rice crop residues as a aource of biofuel. Refin. Biomass Residues Sustain. Energy Bioprod., 275–301.
Dias, M. O. S., Ensinas, A. V., Nebra, S. A., Filho, R. M., Rossell, C. E. V., and Maciel, M. R. W. (2009). Production of bioethanol and other bio-based materials from sugarcane bagasse: integration to conventional bioethanol production process. Chem. Eng. Res. Des. 87 (9), 1206–1216. doi:10.1016/j.cherd.2009.06.020
Erlach, B. (2014). Biomass upgrading technologies for carbon-neutral and carbon-negative electricity generation: techno-economic analysis of hydrothermal carbonization and comparison with wood pelletizing, torrefaction and anaerobic digestion. Thesis for: Doctor. Berlin, Germany: Technische Universität Berlin, 322–356.
Gengiah, K., Gurunathan, B., Rajendran, N., and Han, J. (2022). Process evaluation and techno-economic analysis of biodiesel production from marine macroalgae Codium tomentosum. Bioresour. Technol. 351, 126969. doi:10.1016/j.biortech.2022.126969
Gui, M. M., Lee, K. T., and Bhatia, S. (2008). Feasibility of edible oil vs. Non-edible oil vs. Waste edible oil as biodiesel feedstock. Energy 33, 1646–1653. doi:10.1016/j.energy.2008.06.002
Guinee, J., Gorree, M., Heijungs, R., Huppes, G., Kleijn, R., Koning, A., et al. (2002). Handbook on LCA, operational guide to the ISO standards.
Hassan, M. K., Chowdhury, R., Ghosh, S., Manna, D., Pappinen, A., and Kuittinen, S. (2021). Energy and environmental impact assessment of Indian rice straw for the production of second-generation bioethanol. Sustain. Energy Technol. Assessments 47 (3), 101546. doi:10.1016/j.seta.2021.101546
Huang, C., Han, L., Liu, X., and Ma, L. (2010a). The rapid estimation of cellulose, hemicellulose, and lignin contents in rice straw by near infrared spectroscopy. Energy Sources, Part A Recovery, Util. Environ. Eff. 33, 114–120. doi:10.1080/15567030902937127
Huang, G. H., Chen, F., Wei, D., Zhang, X. W., and Chen, G. (2010b). Biodiesel production by microalgal biotechnology. Appl. Energy 87 (1), 38–46. doi:10.1016/j.apenergy.2009.06.016
IRRI (2022). Rice straw management. Los Baños, Philippines: International Rice Research Institute. https://www.irri.org/rice-straw-management (Accessed on December 18, 2022).
Jingura, R. M., and Kamusoko, R. (2016). Evaluation of life-cycle assessment of jatropha biodiesel. Energy Sources, Part B Econ. Plan. Policy 11 (5), 396–403. doi:10.1080/15567249.2011.637546
Juneja, A., Kurambhatti, C., Kumar, D., Baffo, I., and Singh, V. (2022). Techno-economic evaluation of phosphorous recovery in soybean biodiesel process. Processes 10, 1512. doi:10.3390/pr10081512
Kamil, M., Ramadan, K. M., Olabi, A. G., Al-Ali, E. I., Ma, X., and Awad, O. I. (2020). Economic, technical, and environmental viability of biodiesel blends derived from coffee waste. Renew. Energy 147, 1880–1894. doi:10.1016/j.renene.2019.09.147
Kookos, I. K. (2018). Technoeconomic and environmental assessment of A process for biodiesel production from spent coffee grounds (SCGs). Resour. Conservation Recycl. 134, 156–164. doi:10.1016/j.resconrec.2018.02.002
Kumaran, P., Mazlini, N., Hussein, I., Nazrain, M., and Khairul, M. (2011). Technical feasibility studies for langkawi WCO (waste cooking oil) derived-biodiesel. Energy 36, 1386–1393. doi:10.1016/j.energy.2011.02.002
Lee, J. C., Lee, B., Sik, O. Y., and Lim, H. (2020). Preliminary techno-economic analysis of biodiesel production over solid-biochar. Bioresour. Technol. 206, 123086.
Lin, C. Y., and Li, R. J. (2009). Engine performance and emission characteristics of marine fish-oil biodiesel produced from the discarded parts of marine fish. Fuel Process. Technol. 90, 883–888. doi:10.1016/j.fuproc.2009.04.009
Liu, L., Qian, H., Mu, L., Wu, J., Feng, X., Lu, X., et al. (2021a). Techno-economic analysis of biomass processing with dual outputs of energy and activated carbon. Bioresour. Technol. 319, 124108. doi:10.1016/j.biortech.2020.124108
Liu, Q., Pan, S., Zhou, L., Feng, L., Li, Z., Du, L., et al. (2021b). Improving the biogas potential of rice straw through microwave-assisted ammunition pretreatment during anaerobic digestion. Bioenergy Res. 1, 1–11.
Mustafa, C. (2007). The potential of restaurant waste lipids as biodiesel feedstocks. Bioresour. Technol. 98 (1), 183–190. doi:10.1016/j.biortech.2005.11.022
Riayatsyah, T. M. I., Ong, H. C., Chong, W. T., Aditya, L., Hermansyah, H., and Mahlia, T. M. I. (2017). Life cycle cost and sensitivity analysis of Reutealis trisperma as non-edible feedstock for future biodiesel production. Energies 10, 877. doi:10.3390/en10070877
Rogers, J. G., and Brammer, J. G. (2012). Estimation of the production cost of fast pyrolysis bio-oil. Bio-Oil. Biomass Bioenergy 36, 208–217. doi:10.1016/j.biombioe.2011.10.028
Shah, A., Darr, M. J., Medic, D., Anex, R. P., Khanal, S., and Maski, D. (2012). Techno-economic analysis of A production-scale torrefaction system for cellulosic biomass upgrading. Biofuels, Bioprod. Biorefining 6 (1), 45–57. doi:10.1002/bbb.336
Sharma, A., Singh, G., and Arya, S. K. (2020). Biofuel from rice straw. J. Clean. Prod. 277, 124101. doi:10.1016/j.jclepro.2020.124101
Singh, L. K., and Chaudhary, G. (2017). “Advances in biofeedstocks and biofuels,” in Biofeedstocks and their processing, ume 1 (Hoboken: Wiley Scrivener Publishing).
Sun, H., Yang, M., Gao, Z., Wang, X., Wu, C., Wang, Q., et al. (2023). Economic and environmental evaluation for A closed loop of crude glycerol bioconversion to biodiesel. J. Biotechnol. 36, 65–71. doi:10.1016/j.jbiotec.2023.03.001
Szulczyk, K. R., and Badeeb, R. A. (2022). Nontraditional sources for biodiesel production in Malaysia: the economic evaluation of hemp, jatropha, and kenaf biodiesel. Renew. Energy 192, 759–768. doi:10.1016/j.renene.2022.04.097
Tabatabaei, M., Aghbashlo, M., Dehhaghi, M., Panahi, H. K. S., Mollahosseini, A., Hosseini, M., et al. (2019). Reactor technologies for biodiesel production and processing: a review. Prog. Energy Combust. Sci. 74, 239–303. doi:10.1016/j.pecs.2019.06.001
Tian, H., Zhou, T., Huang, Z., Wang, J., Cheng, H., and Yang, Y. (2021). Integration of spent coffee grounds valorization for Co-production of biodiesel and activated carbon:s an energy and techno-economic case assessment in China. J. Clean. Prod. 424, 129187.
Wahypno, Y., Hadiyanto, H., Gheewala, S. H., Budihardjo, M. A., and Adiansyah, J. S. (2022). Evaluating the environmental impacts of the multi-feedstock biodiesel production process in Indonesia using life cycle assessment (LCA). Energy Convers. Manag. 266, 115832. doi:10.1016/j.enconman.2022.115832
Wright, M. M., Daugaard, D. E., Satrio, J. A., and Brown, R. C. (2010). Techno-economic analysis of biomass fast pyrolysis to transportation fuels. Fuel 89, S2–S10. doi:10.1016/j.fuel.2010.07.029
Yahya, M. A., Al-Qodah, Z., and Ngah, C. W. Z. (2015). Agricultural bio-waste materials as potential sustainable precursors used for activated carbon production: a review. Renew. Sustain. Energy Rev. 46, 218–235. doi:10.1016/j.rser.2015.02.051
Yang, Y., Wang, J., Chong, K., and Bridgwater, A. V. (2018). A techno-economic analysis of energy recovery from organic fraction of municipal solid waste (MSW) by an integrated intermediate pyrolysis and combined heat and power (CHP) plant. Energy Convers. Manag. 174, 406–416. doi:10.1016/j.enconman.2018.08.033
Keywords: rice-straw, biodiesel, techno-economic evaluation, environmental evaluation, bioenergy
Citation: Hu Y, Chen J, Tian H and Hu Z (2023) Techno-economic and environmental evaluation of the production of biodiesel from rice-straw in China. Front. Energy Res. 11:1286373. doi: 10.3389/fenrg.2023.1286373
Received: 31 August 2023; Accepted: 15 November 2023;
Published: 28 November 2023.
Edited by:
Sivakumar Nallusamy, Sultan Qaboos University, OmanReviewed by:
Bheru Lal Salvi, Maharana Pratap University of Agriculture and Technology, IndiaMamdouh Gadalla, Port Said University, Egypt
Copyright © 2023 Hu, Chen, Tian and Hu. This is an open-access article distributed under the terms of the Creative Commons Attribution License (CC BY). The use, distribution or reproduction in other forums is permitted, provided the original author(s) and the copyright owner(s) are credited and that the original publication in this journal is cited, in accordance with accepted academic practice. No use, distribution or reproduction is permitted which does not comply with these terms.
*Correspondence: Hong Tian, dGlhbmgxMTAzQDE2My5jb20=; Zhangmao Hu, aHV6aGFuZ21hb0AxNjMuY29t