 Reza Nematirad
 Anil Pahwa
 Balasubramaniam Natarajan
 Hongyu Wu
- Electrical and Computer Engineering Department, Kansas State University, Manhattan, KS, United States
Due to increasing environmental concerns and demand for clean energy resources, photovoltaic (PV) systems are becoming more prevalent. Considering that in several instances, customers pay for both energy and power, PV installations not only must reduce the customers’ energy purchases but also lower their peak demand for maximum financial benefits. However, in many cases, the peak demand does not coincide with the peak of photovoltaic generation. To address this issue, excess energy generated during low-demand periods can be stored in a battery, which can then be used to meet peak demand. Determining the optimal size of photovoltaic and battery components while ensuring system performance and financial benefits is significantly challenging. This study proposes a novel statistical methodology for optimizing PV-battery system size. In the proposed method, the PV-battery system must meet peak demand thresholds with a specific probability. Further, cost and benefit functions are used for financial evaluation. Finally, Monte Carlo simulations, developed using time series clustering and a Bayesian model are utilized to assess system performance and financial feasibility.
1 Introduction
Photovoltaic (PV) systems have been widely used to generate electricity in recent years due to their advantages over traditional power resources (Mirzapour and Arpanahi, 2018). Based on the U.S. Department of Energy Solar Energy Technologies Office (SETO) and the National Renewable Energy Laboratory (NREL) PV vision, solar energy can supply 40 percent of the nation’s electricity by 2035 (Solar Futures Study, 2023). PV systems play an important role in power systems because they are able to generate clean and environmentally friendly energy from solar irradiance (Thirunavukkarasu and Sawle, 2021). Stand-alone, grid-connected PV, hybrid PV systems, and building-integrated PV systems, are among the most functional types of PV systems (Verma et al., 2011). From an economic point of view, the utilization of PV systems must be beneficial both for utilities and customers. In several instances, customers pay for both energy and peak demand. Consequently, PV system installation not only must reduce electrical energy purchase but also must reduce peak demand. Electricity energy reduction can be done by PV systems at any time of PV operations, but peak demand reduction needs more analysis. Because the PV generation in many cases does not coincide with peak demand hours. For example, during winter and partially in spring and fall the peak demand may occur in the early morning hours when PV generation is infinitesimal or zero. To tackle this problem, batteries can be used to store excess energy generated during low-demand periods, which can then be used to meet peak demand (Nkuriyingoma et al., 2022). Nevertheless, one of the main challenges is finding the appropriate size for PV systems and associated batteries that can meet a specific peak with high probability, resulting in peak demand reduction while considering the stochastic nature of both the system peak demand and solar irradiance. The literature review on PV-battery systems indicates a few studies focused on PV-battery systems sizing with consideration of risk analysis for peak demand reduction.
Several studies have been conducted to optimize PV-battery systems for residential load applications. These studies use various methodologies and objectives to achieve optimal PV-battery system performance and financial benefits. Among the most common optimization methodologies are deterministic optimization, stochastic optimization, robust optimization, and multi-objective optimization.
Deterministic optimization approaches involve using predetermined parameters and mathematical modeling to determine the optimal size of the PV and battery components (Okoye and Solyalı, 2017). proposes a deterministic optimization model to minimize the total cost of PV-battery systems while satisfying load demand and system constraints. The deterministic methodology described in (Belfkira et al., 2011) aims to optimize PV systems by utilizing long-term data. The goal of this methodology is to determine the optimal component numbers of the system while minimizing the total cost and ensuring the availability of energy.
Stochastic optimization approaches incorporate uncertainty in PV generation and other parameters to optimize the sizing of PV battery systems (Ensslen et al., 2018). presents a stochastic optimization model for determining the optimal size of a Solar System with battery storage. The sensitivity analysis shows that the PV size significantly relates to labor cost and demand, while the battery size is influenced by battery cost and demand. Further (Bagheri et al., 2022), presents a two-stage stochastic programming model that incorporates a conditional generative adversarial network to generate scenarios for generated PV power and demand. It aims to minimize costs and highlights the efficiency of PV-battery systems.
Robust optimization is a new technique in PV-battery sizing that considers the inherent uncertainty associated with parameters, such as solar irradiance, ambient temperature, demand, etc. By modeling the uncertain parameters by specific intervals, robust optimization seeks to find the optimal solution (Carli et al., 2022). Few studies in the literature incorporate the robust counterpart in their PV-battery optimal sizing problems. For example (Aghamohamadi et al., 2021), proposes an adaptive robust optimization to determine the optimal size of PV and battery while minimizing operating costs under the worst-case realization of uncertainties in a residential area. The 10 percent perturbation is considered for the uncertain parameters around their nominal values. A multi-objective robust optimization is proposed by (Rodríguez-Gallegos et al., 2018) to minimize the CO2 emissions, cost of energy, and voltage deviations under the worst-case scenarios.
Finally, multi-objective optimization approaches in PV-battery optimization aim to simultaneously optimize multiple conflicting objectives such as cost, PV-battery size, environmental impact, etc. (Khezri et al., 2020) proposes a multi-objective optimization scheme for grid-connected households, where the cost of energy and grid dependency are considered as the objectives (Emrani et al., 2021). presents a multi-objective methodology to choose the optimal size of the PV-battery system using load and solar irradiance profiles. That study aims to minimize the total cost of the PV-battery system investment. A multi-objective function is developed in (Kelepouris et al., 2022) to find the optimal size of a PV-battery system and the impact of different energy costs and load profiles on the objective functions are discussed. Authors in (Celik et al., 2020) propose a multi-objective problem in a grid-connected PV-battery system where energy autonomy, power autonomy, payback period, and lifetime capital cost are considered as the objective functions. The goal of the study in (Alramlawi and Li, 2020) is to minimize energy costs by using lead-acid batteries and PV panels, maximize battery depth-of-discharge, and maximize solar panel tilt angle. That study aims to improve system reliability by accounting for annual power supply losses and providing accurate battery lifespan estimations for economic analysis.
Although valuable studies are conducted in terms of long-term optimal planning of PV-battery system sizing, the robustness to withstand unpredictable conditions and risks of not meeting their proposed schemes are not evaluated adequately in most of them. Since the design of a PV-battery system is based on historical data, it is necessary to evaluate the capability and robustness of the designed PV-battery system for the expected load and solar irradiance profiles in the future.
Once the optimal PV-battery sizing methodologies have been established, evaluating the performance of the model becomes crucial. The robustness and risk of the system are critical aspects to consider when evaluating the performance of the optimized PV-battery system. Assessing the system behavior under various scenarios and uncertainties helps determine its ability to withstand unpredictable conditions and ensure reliable operation. Monte Carlo simulation, forecasting, historical data analysis, and stochastic analysis are among the most popular tools for assessing PV-battery systems. Stochastic approaches, such as stochastic optimization, often rely on assumptions about probability distributions or use simplified models to approximate system behavior. In (Cheng et al., 2018), the authors use clustering techniques to group wind energy generation and load data into different sets. This clustering approach helps identify distinct patterns and characteristics within the data. Monte Carlo simulation is used to generate various scenarios for planning purposes. In (Fu, 2022) a statistical machine learning technique is utilized to generate multi-scenarios in a distribution network. Besides, forecasting techniques can be used to generate various demand scenarios (Gonzalez-Briones et al., 2019). For example, a new method using the clustering technique and the autoregressive integrated moving average is proposed in (Nepal et al., 2020) to forecast the load demand for planning. Further (Berriel et al., 2017), proposes a modified long-short-term memory to forecast the energy consumption at a residential site. In addition (Morteza et al., 2023), explores the use of deep neural networks for medium and long-term energy demand prediction.
While several studies have been conducted on the long-term optimal sizing of PV-battery systems, certain gaps still remain. Many existing studies focus on deterministic approaches, which do not consider uncertainties in PV generation, load demand, and other parameters. In addition, some studies utilize stochastic approaches, but they often rely on simplified models, which may not accurately capture the complex behavior of PV-battery systems. Similarly, a robust optimization could be over-conservative since in most cases it deals with the worst-case scenarios (Aghamohamadi et al., 2021). Further, several studies are based on synthetic data and they do not explicitly address the trade-off between peak demand and energy consumption reduction.
An important problem in power system planning is to reduce peak demand and flatten demand profiles (Mahmud et al., 2018). This study aims to introduce a novel methodology for installing PV- battery systems that explicitly considers peak demand reduction as a key factor in determining the optimal solution to maximize the benefits over the life cycle of the project. The methodology is suitable for those residential, commercial, and industrial customers who pay for peak demand charges for electricity. Since the problem formulation has both continuous and discrete variables along with a search of thresholds with 95% probability of not exceeding the peak load, it is difficult and complex to use a conventional optimization approach to solve this problem. To address these issues, we have proposed a search approach, which is simple and easy to implement with the capability to integrate various aspects of the proposed problem. It also has low computation burden. A case study of a small municipal utility in the United States is considered in this paper for illustration of the methodology. Real system data of 3 years is used for cost and benefit computations over the project lifetime.
The main contributions of this paper can be summarized as follows:
1) The study recognizes the importance of reducing peak demand in PV-battery systems and incorporates it as a key objective in the optimization process. By considering the technical and economic requirements, the study aims to find the optimal size of the PV-battery system that can effectively reduce peak demand.
2) The paper introduces a new statistical methodology specifically designed to address the optimization of PV-battery sizing. This methodology offers a systematic approach to assess and determine the optimal size of the PV-battery system while considering the peak demand reduction effectively. This is a novel contribution as it provides alternative approaches to be utilized in decision-making.
3) Build a risk-based robust model to determine the optimal PV-battery system by incorporating advanced techniques including time series clustering and Monte Carlo simulation based on a Bayesian model. These techniques are used to generate a large number of realistic demand and solar irradiance data scenarios, allowing for a comprehensive evaluation of the system performance under different conditions.
2 Methodology
This section outlines the techniques employed to achieve the optimal size of a PV-battery system.
2.1 PV-battery system component model
The system under this study consists of PV panels, battery storage, and inverters. PV panels directly convert solar irradiance into electrical DC power. If the size of the PV system is X kW, the overall output power of the PV system can be obtained as follows (Yan et al., 2019):
where,
where,
2.2 System costs
2.2.1 Investment costs
The investment costs refer to the initial capital cost required to install the PV-battery system, including PV modules cost (Ndwali et al., 2020):
where,
Inverter cost (Ndwali et al., 2020):
where,
Labor costs:
where,
where,
Additionally, PV system installation has overhead costs as follows:
where,
where i is the discount rate used to compute the present worth of replacement batteries.
where,
With
2.2.2 Operation, maintenance, and insurance costs
The total annual operation and maintenance costs of a PV-battery system are an annuity and they need to be converted to the present worth as follows (Disney et al., 2013):
where,
2.2.3 Peak demand charge
The peak demand charge is calculated based on the highest level of power demand typically over a month. Here the peak demand charge is calculated before and after PV-battery installation. The present worth of peak demand charges for year n before PV-battery installation can be expressed as follows (Risbeck and Rawlings, 2020):
Where,
Where
2.2.4 Energy cost
The present worth of energy cost before PV-battery installation
Where,
2.2.5 Benefit
The total benefit over the project lifetime can be expressed as the difference between the total cost of the system with and without the installation of the PV-battery system, which can be expressed as follows:
2.3 Battery operation and updated peaks
In this section, a new simple but efficient algorithm is proposed to determine daily battery operation. For an X kW PV size, Eq. 1 gives the output power of the PV. Then, an updated daily load profile, named modified load is generated by subtracting the original load profiles from the PV generation for all days. The needed battery size for each day to flatten the load curve is determined by drawing a horizontal line such that the upper area between the modified load and the horizontal line is equal to the roundtrip efficiency multiplied by the lower area between the horizontal line and the modified load below this line as expressed by:
where
Where
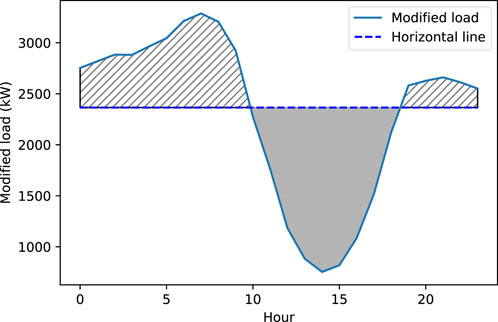
Figure 1. Modified load curve and equalization of areas for the needed battery.
Since each day will need a different battery size to flatten the load curve, the largest needed battery size would be able to flatten the load curve for all the days. However, choosing the largest battery size is not prudent because the cost will be prohibitive. Hence, determining an optimal size for flattening the load curve on most of days while having the risk of not being able to flatten the load curve on a few days is important. For these days, a new horizontal line is drawn such that the upper area between the modified load and the new horizontal line corresponds to the battery capacity while considering the battery efficiency and utilization factor. In other words, this is the maximum peak load reduction that can be obtained by the selected battery size. It should be noted that considering roundtrip efficiency in the battery sizing algorithm simulates battery loss. That means although battery installation is expected to reduce peak demands, battery operational losses increase the energy purchase from the grid.
2.4 Statistical modeling
With prior knowledge of daily energy and peak load, a range of battery sizes from Y1 to Yn can be defined for a given X PV size. Further, the updated daily peak loads are calculated for battery sizes Y1 to Yn. Subsequently, for each battery size, a histogram can be drawn for the daily peak loads. Based on the scaled histogram, an appropriate probability distribution function (PDF) is fitted for each histogram. To accomplish this, Gamma and Lognormal distributions are considered. The general PDF of the Gamma distribution is as follows (Schellenberg et al., 2005):
and
And PDF of the Lognormal is as follows (Chen et al., 2019):
where
where
2.5 Optimal PV-battery sizing
In the proposed heuristic method, the unique demand thresholds associated with the 95% probability for each battery size for the given PV size are utilized. Determination of the optimal battery size for a given X PV size involves identifying a point where the 95% threshold exhibits a significant change compared to the other thresholds associated with different battery sizes. This approach is based on the fact that increasing battery size leads to reduction in the 95% threshold, but after a certain size the reduction becomes smaller. Hence, to determine the optimal battery size, an elbow point in the 95% peak load threshold versus battery size curve is sought. The elbow point represents a battery size where the reduction in the 95% threshold is significantly greater than neighboring points. This indicates a significant improvement in the ability of the system to meet peak demand. Besides, this enhances the system performance in meeting peak demand while maintaining a desired probability. By repeating this methodology for a range of PV sizes from X1 to Xn, the optimal battery size for each PV size can be determined.
The proposed methodology determines multiple combinations of optimal PV-battery sizes. The optimal PV-battery system size is chosen based on financial benefit analysis. Besides, it is crucial to test the system under multiple scenarios to ensure its performance and effectiveness under various conditions. By subjecting the system to different scenarios, such as varying solar irradiance and demand its robustness and risk can be evaluated. For this purpose, time series clustering, and the Monte Carlo simulation technique is developed in the following sections.
2.6 Monte Carlo simulation
Monte Carlo simulation is a computational technique used to model and generate a large number of random scenarios. It relies on random sampling and repeated experiments to estimate and understand the range of possible outcomes for a given problem (Raychaudhuri, 2008). By clustering demand and solar irradiance data, more realistic scenarios can be created. Additionally, clustering allows Monte Carlo simulations to take into account the interdependencies between demand and irradiance, leading to more meaningful and effective scenarios.
2.6.1 Time series clustering
Time series clustering is a technique that groups similar time series data into distinct clusters based on their patterns, trends, or behaviors over time. Electricity demand and solar irradiance are time series data that include time intervals indicating the timesteps and corresponding demand and solar irradiance values. Time series clustering is a complex technique in data analysis and includes data preprocessing, similarity measures, cluster prototypes, clustering algorithms, and evaluation metrics (Ali et al., 2019). The preprocessing may include working with missing data or outliers, and normalization. This study uses Min-Max normalization to normalize the time series data (Petegrosso et al., 2020). A similarity measure quantifies the similarity between time series datasets. Dynamic time warping (DTW) is utilized in this study as a similarity measure and its efficiency is proven in several time series clustering (Aghabozorgi et al., 2015). A prototype is a time series that represents the characteristics of a cluster. This study utilized the medoid prototype that is proper for the DTW similarity measure (Ma and Angryk, 2017). Further, two types of most practical time series clustering methods including K-medoid and agglomerative hierarchical clustering algorithms are used. The K-medoid clustering method is a partitioning clustering algorithm suitable for building energy analysis. K-medoid clustering can handle non-Euclidean distance measures, resistance to outliers, and offers a superior level of computational efficiency over other partitioning-based clustering methods (Cui et al., 2023). The K-medoid algorithm utilizes medoids as prototypes of clusters. It selects medoids by minimizing the dissimilarity or distance between data points within each cluster. However, K-medoid requires that the number of clusters must be specified in advance (Gupta et al., 2021). Agglomerative hierarchical clustering is a specific type of hierarchical clustering, which offers a distinct advantage in building energy analysis. This method eliminates the need to predetermine the number of clusters. This approach generates a tree-like structure known as a dendrogram, which serves as a visual representation and helps in determining the optimal number of clusters (Li et al., 2018). Time series agglomerative hierarchical clustering organizes time series data into a hierarchy of clusters using a cumulative approach. It merges clusters based on similarity measures (Ali et al., 2019). Finally, the quality of time series clustering algorithms should be evaluated to figure out if the clustering algorithms are able to capture patterns and trends in the time series datasets. In this study, the Silhouette coefficient and gap statistic are used for the evaluation of K-medoid, and dendrogram plot for hierarchical clustering (Aghabozorgi et al., 2015). It should be noted that a combination of different time series clustering algorithms provides robust and reliable results and provides deeper insights into the underlying patterns.
2.6.2 Bayesian model
By considering the clustering results of the previous section, conditional probabilities are calculated to assess the relationship between demand and solar irradiance patterns for a computationally efficient implementation of Monte Carlo simulation. These conditional probabilities quantify the likelihood of a specific demand pattern occurring given a certain solar irradiance pattern. Figure 2 illustrates the process of determining these conditional probabilities for a month.
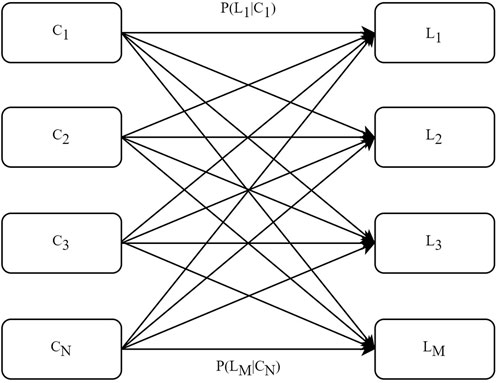
Figure 2. Process of determining the conditional probabilities.
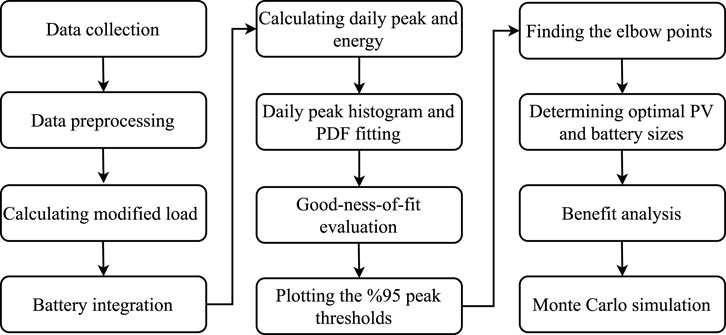
Figure 3. Organizational flowchart of the simulation procedure in this study.
3 Results and discussion
3.1 Data collection and assumption
In this study, the hourly demand and actual solar irradiance data of Greensburg, Kansas, United States of America, from 1 January 2019, to 31 December 2021, are collected. The values of different parameters used in this study are provided in Table 1. Further, the study is conducted with the assumption that the battery operates on a daily cycle, which means that the battery is charged and discharged fully within the same day. A tax credit of 30% for the initial cost of PV and batteries including the transformer, racking, switchgear, and wiring is considered. Tax credit is not considered for the replacement batteries that will be acquired 10 years later.
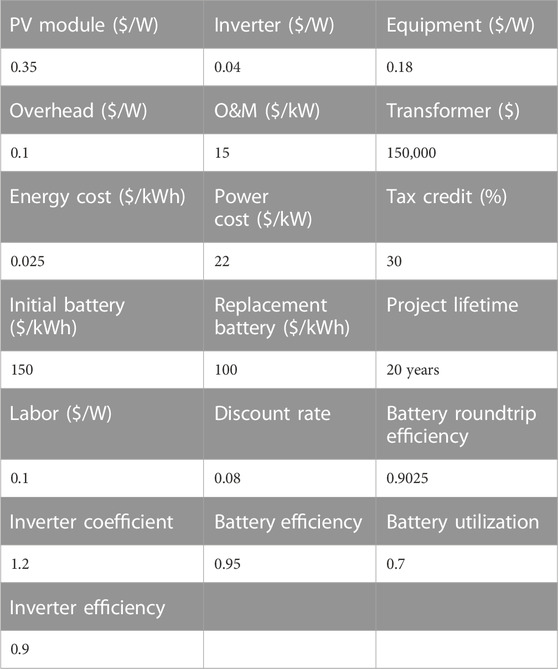
Table 1. Quantity values used in this study.
3.2 Statistical modeling
3.2.1 Proposed methodology
The load demand and PV generation profile of the peak demand day of January 2019 are shown in Figure 4. The peak demand occurs early in the day when there is no solar irradiance. Therefore, PV installation does not help in peak demand reduction, but batteries can be used as a complement to PV systems. For example, on this day, a battery can be discharged at the beginning of the day to reduce the peak and be charged during mid-day for possible use late in the day. Modified load profiles are calculated for the entire data of 3 years for PV sizes ranging from 200 kW to 10000 kW in steps of 100 kW. Subsequently, for each PV size, corresponding battery sizes are selected from 1000 kWh to 10000 kWh in steps of 100 kWh. Next, updated daily peak demand values for each combination of battery and PV sizes are calculated for the 3-year period. Then, the scaled histograms of peak demands are created, considering the frequencies of occurrence of different peak demands over the 3-year period. After fitting the PDFs (lognormal and Gamma) to the generated histograms, the goodness-of-fit is evaluated using the KS statistic test. KS statistic test results show the p-values for the Gamma PDFs are significantly greater than the typical significance level of 0.05, indicating a good fit for the data. However, for the Lognormal PDFs, some p-values are much less than 0.05, suggesting poor fits. For example, for PV size of 2000 kW and battery size of 2000 kWh and 3000 kWh, the p-values are 0.0053 and 0.027, respectively. Furthermore, both PDFs exhibit relatively small KS statistic test scores. Consequently, the KS statistic test indicates that the Gamma distribution fits the observed data better than the Lognormal PDF. These fitted Gamma PDFs for various combinations of PV and battery size are used in the proposed methodology to determine optimal PV and battery sizes.
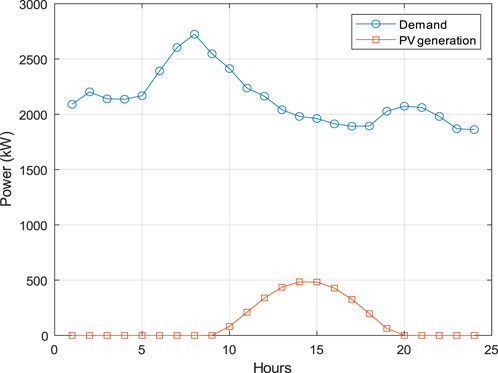
Figure 4. Original load and PV generation on the peak day of January 2019.
Based on the calculated fitted PDFs, the 95% peak thresholds are determined for all fitted Gamma PDFs. For example, Figure 5 shows the 95% peak threshold for a battery size of 4000 kWh and a PV size of 2000 kW for the corresponding fitted Gamma PDF. The peak demand threshold with a 95% probability for the given case is 1985 kW. This means that with 95% probability, the PV-battery system is expected to meet peak demand ranging from 0 kW to 1985 kW. Figure 6 displays the peak load thresholds with a 95% probability for the PV size of 2000 kW and various battery sizes. It can be observed that the thresholds for meeting peak demand with a 95% probability decrease as the battery size increases. This trend is particularly significant up to a battery size of 4400–4800 kWh, indicating that increasing the battery size within this range leads to a substantial reduction in the thresholds. But further increasing the battery size does not provide significant additional benefits in terms of improving the system ability to meet peak demand with a 95% probability. Therefore, to determine the optimal battery size for a PV size of 2000 kW, an elbow point in the 95% peak threshold versus the battery size curve is sought. The elbow point represents the size of the battery at which the 95% threshold is reduced significantly more than its neighboring points. Figure 7 illustrates the elbow curve (Antunes et al., 2018) derived from the data presented in Figure 6. By examining the elbow curve, the point with the highest value represents the optimal battery size for the given PV size of 2000 kW. Based on the elbow curve depicted in Figure 7, the maximum value occurs at a battery size of 4600 kWh for the given PV size of 2000 kW with a peak load threshold of 1971 kW. If this analysis is repeated for different PV sizes, the optimal battery size corresponding to each PV size can be obtained. Table 2 provides selected optimal combinations of PV and battery size with consideration for the 95% probability. For example, a PV size of 3600 kW with a battery size of 4400 kWh can meet peak demand ranging from 0 kW to 1931 kW with 95% probability, indicating the best combination in terms of peak reduction. However, the PV size 400 kW can meet the 2167 kW peak with specified probability with battery size 6200 kWh, indicating a poor combination. However, to determine the best PV and battery size, a benefit analysis must be conducted over all the optimal combinations of PV and battery sizes. The final size of the PV-battery system is the combination of PV and battery sizes that yield the highest overall benefit for the system over 20 years.
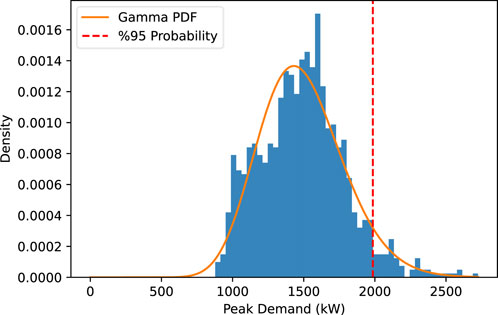
Figure 5. The 95% peak threshold for a fitted Gamma PDF with a battery size of 4000 kWh and a PV size of 2000 kW.

Figure 6. Thresholds with the 95% probability for the PV size of 2000 kW vs. various battery sizes.
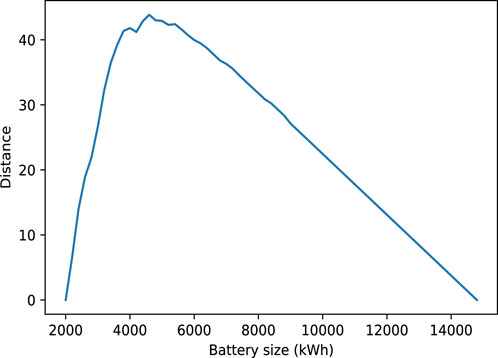
Figure 7. Elbow curve associated with thresholds with the 95% probability for the PV size of 2000 kW.
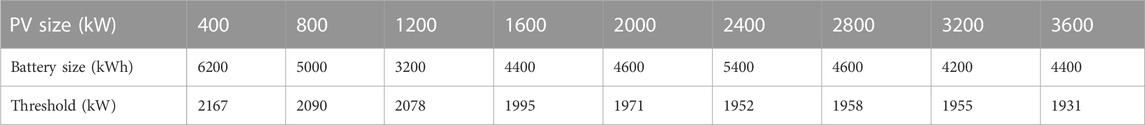
Table 2. Selected optimal combinations of PV and battery sizes.
3.3 Benefit analysis
The benefit analysis is conducted to evaluate the financial profitability of PV and battery size combinations over 20 years. Data from 3 years, including both demand and solar irradiance, are grouped on a monthly basis. Energy and peak demand costs are calculated individually for each month over the 3-year period and subsequently averaged to obtain the monthly average costs. Table 3 presents the financial benefits associated with each combination of optimal PV and battery sizes. Figure 8 illustrates the financial benefit of each optimal PV and battery size combinations. It should be noted due to the limitation of the plotting, the optimal battery sizes associated with each PV size are not explicitly shown in the figure. The best PV and battery size combination among all the combinations is a PV size of 1200 kW, battery size of 3200 kWh, peak threshold of 2078 kW, and the financial benefit associated with this combination is $820,373 over 20 years. Table 4 provides a detailed financial analysis of the optimal PV-battery system considering the energy and peak demand costs before and after PV-battery installation over a 20-year period for this case. The original energy and peak demand costs (before PV and battery installation) are $3,788,907 and $6,913,926.51, respectively over the 20-year period. Peak demand charges are approximately twice the energy cost, indicating the importance of peak demand in reducing overall costs. The PV installation results in a reduction of 12.9% in energy costs and 5.58% in peak demand costs. These reductions indicate that PV installation is more successful at reducing energy costs than peak demand costs. However, the total cost of PV installation, in this case, amounts to $1,093,847. The calculated net benefit, which is -$190,366, indicates that PV installation does not yield a positive economic outcome. So, although PV reduces energy and peak demand charges, the high total installation cost outweighs the cost savings achieved. Therefore, from an economic perspective, PV installation alone is not profitable. Despite adding additional costs to the system, the installation of a battery results in a notable 25.28% reduction in peak demand costs compared to the original peak demand costs. Furthermore, the difference of $27,647 in energy costs between PV-only and PV-battery system is the cost of losses associated with charging and discharging of the battery. However, incorporating the battery system increases the overall benefit of the PV-battery system, which indicates that the combined effect of battery and PV is more advantageous than relying solely on PV installation. Finally, in order to assess the performance and effectiveness of the PV-battery system based on the proposed method, it is necessary to test the designed PV-battery system under different scenarios and conditions. To generate multiple scenarios with Monte Carlo simulation, the demand and solar irradiance profiles must be clustered.
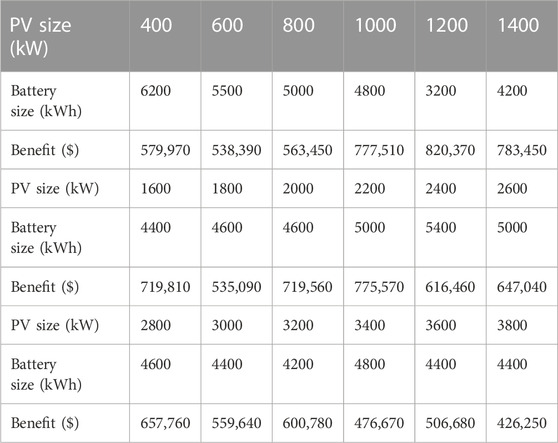
Table 3. Financial benefits for optimal combinations of PV and battery sizes.
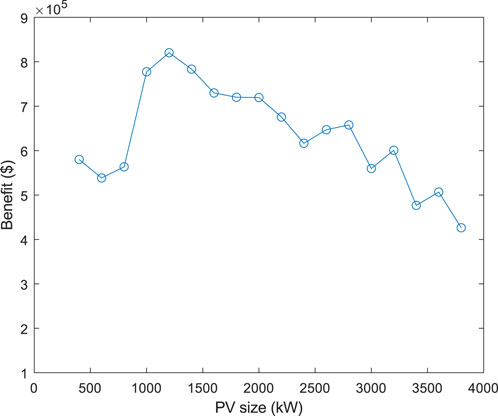
Figure 8. Benefit of the various combinations of optimal PV and battery size.
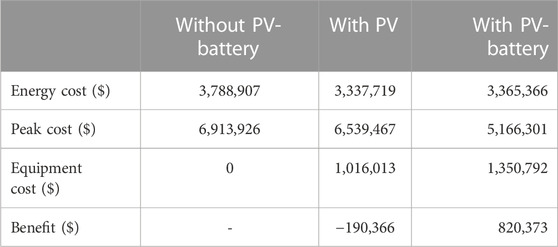
Table 4. Economic analysis of the optimal PV-battery system.
3.4 Monte Carlo simulation
3.4.1 Time series clustering
The first step in the time series clustering is to prepare the datasets. To achieve this goal, the data is grouped monthly. For instance, the demand and solar irradiance data for all Januarys in the 3 years are combined, resulting in 93 time series datasets in which, each time series contains 24 hourly data points. Then, all datasets are normalized based on Min-Max normalization. Subsequently, K-medoid and agglomerative hierarchical time series clustering algorithms are utilized to group similar profiles in a cluster using the DTW similarity measure. Gap statistics and Silhouette scores are used as evaluation metrics to determine the proper number of clusters of the K-medoid algorithm. To obtain the gap statistic and Silhouette scores, the K-medoid algorithm performs clustering for a range of integer values representing the number of clusters. The clustering results demonstrate that each cluster represents a group of similar demand and solar irradiance profiles based on their patterns allowing for the discovery of distinct monthly variations in electricity demand and solar irradiance. For example, Figure 9 demonstrates the gap statistic and Silhouette coefficient scores for different numbers of clusters for July load demand profiles. Based on Figure 9, the maximum gap statistic score of 0.114 suggests that 3 clusters are meaningful for July load demand profiles. Similarly, the Silhouette coefficient peaks at 0.472 with 3 clusters. These results offer valuable insights into choosing the optimal number of clusters. These distinct clusters represent high electricity demand, moderate demand, and relatively low demand for the month of July. These variations can be attributed to factors like differences between weekdays, weekends, and weather conditions.
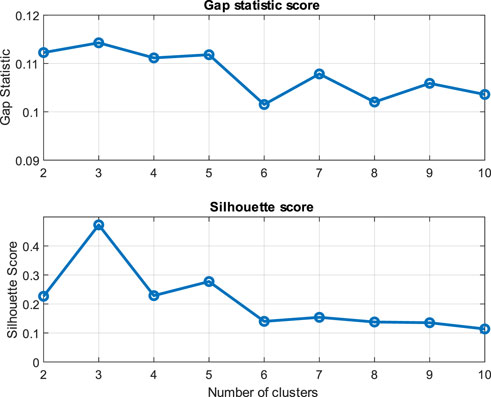
Figure 9. Gap statistic and Silhouette score for K-medoids algorithm.
The agglomerative hierarchical clustering algorithm starts by treating each individual demand and solar irradiance time series as a separate cluster. It calculates pairwise distances between these clusters using the DTW similarity measure. Clusters are then merged iteratively based on their distances, creating a hierarchy of clusters. This hierarchy for July load demand profiles is visualized in Figure 10 as a dendrogram graph. In the dendrogram graph, the vertical lines indicate clusters at different levels of the hierarchy and a point where vertical lines merge together demonstrates a cluster formation. Besides, the height of the vertical lines represents the dissimilarity or distance between the clusters and longer lines show significant dissimilarity. Intuitively, if a horizontal line cuts through the highest vertical lines in a dendrogram, the intersections can indicate the desired number of clusters. Accordingly, in Figure 10, the red horizontal line intersects three vertical lines that represent the largest dissimilarities compared to other clusters. This suggests that dividing the data into three clusters could be a suitable choice based on the dendrogram structure. Given that both K-medoid and hierarchical clustering suggests a similar number of clusters for the July demand profiles, July load data can be confidently divided into three distinct clusters. By applying the same clustering methods to the remaining demand and solar irradiance data, the time series clustering process is completed for use in the Monte Carlo simulation.
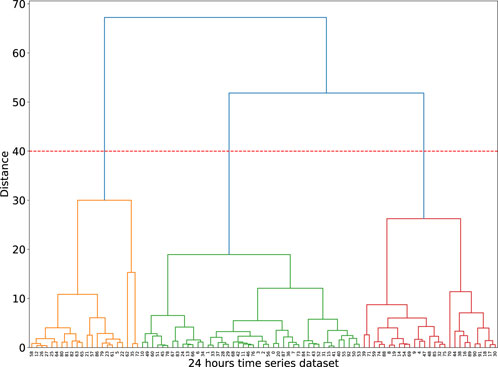
Figure 10. Dendrogram associated with the hierarchical clustering.
3.4.2 Bayesian simulation
Based on the mentioned methodology, a Monte Carlo simulation is performed to generate 10,000 scenarios in which each scenario contains yearly load and solar irradiance data. These scenarios are generated based on the conditional probability between demand and solar irradiance profiles. Previously selected best PV and battery sizes of 1200 kW and 3200 kWh, respectively, with a peak load threshold of 2078 kW are used to calculate the benefits for various scenarios. Among the 10,000 scenarios, 20 scenarios are randomly selected to calculate the benefits over a 20-year period to create one sample benefit in the Monte Carlo simulation. The process is repeated 500 times to determine 500 benefit samples without replacement. Figure 11 shows the histogram of these benefit samples. The mean benefit value is determined to be $822,440, indicating the average benefit that can be expected from implementing the proposed method with the determined PV and battery sizes over the 20-year period. Furthermore, the standard deviation is $7554 indicating the variability of the benefit around the mean. In this case, the coefficient of variation (CV), which is the ratio of the standard deviation to the mean is 0.0092 which is relatively small compared with the general CV (Chen and Mili, 2013). It suggests that the benefits obtained from the Monte Carlo simulation are relatively consistent and close to the mean value. This level of low variability can be seen as a positive characteristic, indicating a higher level of predictability and reliability in the benefits obtained from the simulation. Besides, a Normal PDF is fitted to the histogram. The KS statistic is calculated to be 0.0235, and the p-value is found to be 0.957. These values indicate a good fit between the Normal PDF and the benefits data. Moreover, a 95% confidence interval for the mean of the benefits is computed, resulting in the range [821,773, 823,100]. That means, it is estimated that the average benefit value is likely to be between $821,773 and $823100 with a 95% confidence. To perform a risk analysis, three predetermined benefits are considered as desired benefits to be achieved over the project lifetime. If the predetermined benefit is less than $821,773, it suggests that with 95% confidence, the estimated mean benefit is likely to be higher than the threshold. This indicates a favorable outcome, as the estimated mean benefit is expected to surpass the desired threshold. On the other hand, if a predetermined benefit is higher than $823,100, it indicates with 95% confidence, the estimated mean benefit may fall below the predetermined threshold, suggesting a potential failure to meet the desired benefit. Finally, if the predetermined benefit falls between the lower and upper bounds of the 95% confidence interval, this means there is an uncertainty about whether the estimated average benefit will be higher or lower than the predetermined threshold. Further, the first and second STDs represent the lower and upper bounds around the mean benefit value (see Figure 11), indicating the potential range within which benefits are likely to occur. Considering the first and second STDs, the benefits will be within the range of $814,880 to $829,990 and $807,330 to $837,550, respectively with approximately 68% and 95% confidence. The first and second standard deviations can provide insight into the range within which benefits are likely to fluctuate, helping decision-makers make thorough assessments.
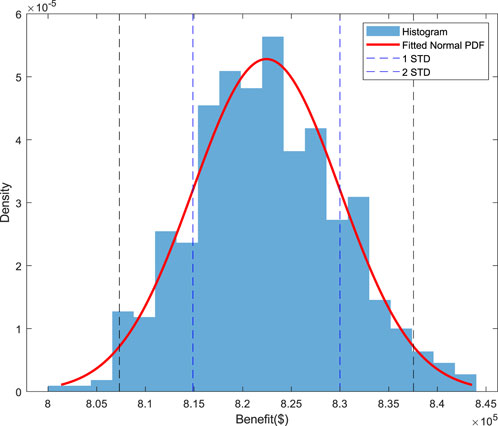
Figure 11. Histogram of benefit values based on the Monte Carlo results.
4 Conclusion
This study addresses the significance of peak demand in solar PV system planning and management. While PV installations reduce energy flow from the grid, their impact on peak demand reduction is limited in some cases. Batteries for energy storage are used to overcome this limitation. An innovative methodology is proposed for determining the optimal sizes of PV and battery. The proposed method considers variable peak load thresholds with a 95% probability for all PV and battery sizes and identifies optimal sizes based on the elbow point. To evaluate various optimal combinations of PV and battery sizes economically, the total benefit for these combinations is calculated to identify the best sizes of the PV and battery for the given system. Finally, a novel Monte Carlo simulation is used to evaluate the effects of uncertainties and risk on the results comprehensively by generating multiple load and solar and irradiance scenarios. Since many small municipal utilities and rural electric cooperatives buy electricity from large suppliers for distribution to their customers, the methodology presented in this paper provides a valuable tool for them in planning solar PV-battery system installations. However, it should be noted that the proposed methodology is not suitable for general sizing of solar PV and batteries, but suitable for only those utilities with a goal to reduce the peak demand. In future research, an investigation can be conducted with a fixed peak load threshold for the PV-battery system. Additionally, various aspects such as demand response, power system topologies and associated reliability indices can be included in the analysis.
Data availability statement
The original contributions presented in the study are included in the article/Supplementary material, further inquiries can be directed to the corresponding author.
Author contributions
RN: Data curation, Formal Analysis, Investigation, Software, Writing–original draft. AP: Conceptualization, Funding acquisition, Investigation, Methodology, Project administration, Supervision, Writing–original draft. BN: Formal Analysis, Investigation, Supervision, Writing–review and editing. HW: Writing–review and editing.
Funding
The author(s) declare financial support was received for the research, authorship, and/or publication of this article. This research was conducted with funding from NSF through award No. 2125548.
Acknowledgments
The authors thank the City of Greensburg, Kansas, and Kansas Power Pool (KPP) for supporting this research by providing load and billing data. Also, thanks to Kansas State University Agricultural Extension for providing the solar irradiation data.
Conflict of interest
The authors declare that the research was conducted in the absence of any commercial or financial relationships that could be construed as a potential conflict of interest.
The author(s) declared that they were an editorial board member of Frontiers, at the time of submission. This had no impact on the peer review process and the final decision.
Publisher’s note
All claims expressed in this article are solely those of the authors and do not necessarily represent those of their affiliated organizations, or those of the publisher, the editors and the reviewers. Any product that may be evaluated in this article, or claim that may be made by its manufacturer, is not guaranteed or endorsed by the publisher.
References
Aghabozorgi, S., Seyed Shirkhorshidi, A., and Ying Wah, T. (2015). Time-series clustering – a decade review. Inf. Syst. 53, 16–38. doi:10.1016/j.is.2015.04.007
Aghamohamadi, M., Mahmoudi, A., and Haque, M. H. (2021). Two-stage robust sizing and operation Co-optimization for residential PV–battery systems considering the uncertainty of PV generation and load. IEEE Trans. Ind. Inf. 17, 1005–1017. doi:10.1109/TII.2020.2990682
Ali, M., Alqahtani, A., Jones, M. W., and Xie, X. (2019). Clustering and classification for time series data in visual analytics: a survey. IEEE Access 7, 181314–181338. doi:10.1109/ACCESS.2019.2958551
Alramlawi, M., and Li, P. (2020). Design optimization of a residential PV-battery microgrid with a detailed battery lifetime estimation model. IEEE Trans. Ind. Appl. 56, 2020–2030. doi:10.1109/TIA.2020.2965894
Antunes, M., Gomes, D., and Aguiar, R. L. (2018). “Knee/elbow estimation based on first derivative threshold,” in 2018 IEEE Fourth International Conference on Big Data Computing Service and Applications (BigDataService), Bamberg, Germany, March, 2018, 237–240. doi:10.1109/BigDataService.2018.00042
Bagheri, F., Dagdougui, H., and Gendreau, M. (2022). Stochastic optimization and scenario generation for peak load shaving in Smart District microgrid: sizing and operation. Energy Build. 275, 112426. doi:10.1016/j.enbuild.2022.112426
Belfkira, R., Zhang, L., and Barakat, G. (2011). Optimal sizing study of hybrid wind/PV/diesel power generation unit. Sol. Energy 85, 100–110. doi:10.1016/j.solener.2010.10.018
Berckmans, G., Messagie, M., Smekens, J., Omar, N., Vanhaverbeke, L., and Van Mierlo, J. (2017). Cost projection of state of the art lithium-ion batteries for electric vehicles up to 2030. Energies (Basel) 10, 1314. doi:10.3390/en10091314
Berriel, R. F., Lopes, A. T., Rodrigues, A., Varejao, F. M., and Oliveira-Santos, T. (2017). “Monthly energy consumption forecast: a deep learning approach,” in 2017 International Joint Conference on Neural Networks (IJCNN), Anchorage, AK, USA, May, 2017, 4283–4290. doi:10.1109/IJCNN.2017.7966398
Carli, R., Cavone, G., Pippia, T., De Schutter, B., and Dotoli, M. (2022). Robust optimal control for demand side management of multi-carrier microgrids. IEEE Trans. Automation Sci. Eng. 19, 1338–1351. doi:10.1109/TASE.2022.3148856
Celik, B., Suryanarayanan, S., Roche, R., and Hansen, T. M. (2020). Quantifying the impact of solar photovoltaic and energy storage assets on the performance of a residential energy aggregator. IEEE Trans. Sustain Energy 11, 405–414. doi:10.1109/TSTE.2019.2892603
Chen, J., Wang, Q., Wang, J., and Li, N. (2019). Change detection of water index in danjiangkou reservoir using mixed log-normal distribution based active contour model. IEEE Access 7, 95430–95442. doi:10.1109/ACCESS.2019.2929178
Chen, Q., and Mili, L. (2013). Composite power system vulnerability evaluation to cascading failures using importance sampling and antithetic variates. IEEE Trans. Power Syst. 28, 2321–2330. doi:10.1109/TPWRS.2013.2238258
Cheng, L., Zhao, E., Liu, M., Wang, Z., and Zhang, Y. (2018). “A planning scenario clustering method based on monte-carlo simulation,” in 2018 International Conference on Power System Technology (POWERCON), Guangzhou, China, November, 2018, 212–217. doi:10.1109/POWERCON.2018.8601961
Cui, Y., Zhu, Z., Zhao, X., and Li, Z. (2023). Energy schedule setting based on clustering algorithm and pattern recognition for non-residential buildings electricity energy consumption. Sustainability 15, 8750. doi:10.3390/su15118750
Disney, S. M., Warburton, R. D. H., and Zhong, Q. C. (2013). Net present value analysis of the economic production quantity. IMA J. Manag. Math. 24, 423–435. doi:10.1093/imaman/dpt002
Emrani, A., Berrada, A., and Bakhouya, M. (2021). Optimal sizing and deployment of gravity energy storage system in hybrid pv-wind power plant. SSRN Electron. J. doi:10.2139/ssrn.3878686
Ensslen, A., Ringler, P., Dörr, L., Jochem, P., Zimmermann, F., and Fichtner, W. (2018). Incentivizing smart charging: modeling charging tariffs for electric vehicles in German and French electricity markets. Energy Res. Soc. Sci. 42, 112–126. doi:10.1016/j.erss.2018.02.013
Fu, X. (2022). Statistical machine learning model for capacitor planning considering uncertainties in photovoltaic power. Prot. Control Mod. Power Syst. 7, 5. doi:10.1186/s41601-022-00228-z
Ghatak, G., Mohanty, H., and Rahman, A. U. (2022). Kolmogorov–Smirnov test-based actively-adaptive thompson sampling for non-stationary bandits. IEEE Trans. Artif. Intell. 3, 11–19. doi:10.1109/TAI.2021.3121653
Gonzalez-Briones, A., Hernandez, G., Corchado, J. M., Omatu, S., and Mohamad, M. S. (2019). “Machine learning models for electricity consumption forecasting: a review,” in 2019 2nd International Conference on Computer Applications and Information Security (ICCAIS), Riyadh, Saudi Arabia, May, 2019, 1–6. doi:10.1109/CAIS.2019.8769508
Gupta, D., Bhatia, M. P. S., and Kumar, A. (2021). Resolving data overload and latency issues in multivariate time-series IoMT data for mental health monitoring. IEEE Sens. J. 21, 25421–25428. doi:10.1109/JSEN.2021.3095853
Kelepouris, N. S., Nousdilis, A. I., Bouhouras, A. S., and Christoforidis, G. C. (2022). Cost-effective hybrid PV-battery systems in buildings under demand side management application. IEEE Trans. Ind. Appl. 58, 6519–6528. doi:10.1109/TIA.2022.3186295
Khezri, R., Mahmoudi, A., and Aki, H. (2020). “Multi-objective optimization of solar PV and battery storage system for A grid-connected household,” in 2020 IEEE International Conference on Power Electronics, Drives and Energy Systems (PEDES), Jaipur, India, December, 2020, 1–6. doi:10.1109/PEDES49360.2020.9379481
Li, K., Ma, Z., Robinson, D., and Ma, J. (2018). Identification of typical building daily electricity usage profiles using Gaussian mixture model-based clustering and hierarchical clustering. Appl. Energy 231, 331–342. doi:10.1016/j.apenergy.2018.09.050
Ma, R., and Angryk, R. (2017). “Distance and density clustering for time series data,” in 2017 IEEE International Conference on Data Mining Workshops (ICDMW), New Orleans, LA, USA, November, 2017, 25–32. doi:10.1109/ICDMW.2017.11
Mahmud, K., Hossain, M. J., and Town, G. E. (2018). Peak-load reduction by coordinated response of photovoltaics, battery storage, and electric vehicles. IEEE Access 6, 29353–29365. doi:10.1109/ACCESS.2018.2837144
Mirzapour, O., and Arpanahi, S. K. (2018). “Photovoltaic parameter estimation using heuristic optimization,” in 2017 IEEE 4th International Conference on Knowledge-Based Engineering and Innovation, KBEI 2017, Tehran, Iran, December, 2017, 0792–0797. doi:10.1109/KBEI.2017.8324904
Morteza, A., Yahyaeian, A. A., Mirzaeibonehkhater, M., Sadeghi, S., Mohaimeni, A., and Taheri, S. (2023). Deep learning hyperparameter optimization: application to electricity and heat demand prediction for buildings. Energy Build. 289, 113036. doi:10.1016/j.enbuild.2023.113036
Ndwali, K., Njiri, J. G., and Wanjiru, E. M. (2020). Multi-objective optimal sizing of grid connected photovoltaic batteryless system minimizing the total life cycle cost and the grid energy. Renew. Energy 148, 1256–1265. doi:10.1016/j.renene.2019.10.065
Nepal, B., Yamaha, M., Yokoe, A., and Yamaji, T. (2020). Electricity load forecasting using clustering and ARIMA model for energy management in buildings. Jpn. Archit. Rev. 3, 62–76. doi:10.1002/2475-8876.12135
Nkuriyingoma, O., Özdemir, E., and Sezen, S. (2022). Techno-economic analysis of a PV system with a battery energy storage system for small households: a case study in Rwanda. Front. Energy Res. 10. doi:10.3389/fenrg.2022.957564
Okoye, C. O., and Solyalı, O. (2017). Optimal sizing of stand-alone photovoltaic systems in residential buildings. Energy 126, 573–584. doi:10.1016/j.energy.2017.03.032
Petegrosso, R., Li, Z., and Kuang, R. (2020). Machine learning and statistical methods for clustering single-cell RNA-sequencing data. Brief. Bioinform 21, 1209–1223. doi:10.1093/bib/bbz063
Raychaudhuri, S. (2008). “Introduction to Monte Carlo simulation,” in 2008 Winter Simulation Conference, Miami, FL, USA, December, 2008, 91–100. doi:10.1109/WSC.2008.4736059
Risbeck, M. J., and Rawlings, J. B. (2020). Economic model predictive control for time-varying cost and peak demand charge optimization. IEEE Trans. Autom. Contr 65, 2957–2968. doi:10.1109/TAC.2019.2939633
Rodríguez-Gallegos, C. D., Yang, D., Gandhi, O., Bieri, M., Reindl, T., and Panda, S. K. (2018). A multi-objective and robust optimization approach for sizing and placement of PV and batteries in off-grid systems fully operated by diesel generators: an Indonesian case study. Energy 160, 410–429. doi:10.1016/j.energy.2018.06.185
Schellenberg, A., Rosehart, W., and Aguado, J. (2005). Cumulant-based probabilistic optimal power flow (P-opf) with Gaussian and Gamma distributions. IEEE Trans. Power Syst. 20, 773–781. doi:10.1109/TPWRS.2005.846184
Solar Futures Study, (2023). Solar futures study. https://www.energy.gov/eere/solar/solar-futures-study.
Thirunavukkarasu, M., and Sawle, Y. (2021). A comparative study of the optimal sizing and management of off-grid solar/wind/diesel and battery energy systems for remote areas. Front. Energy Res. 9. doi:10.3389/fenrg.2021.752043
Verma, D., Midtgard, O.-M., and Satre, T. O. (2011). “Review of photovoltaic status in a European (EU) perspective,” in 2011 37th IEEE Photovoltaic Specialists Conference, Seattle, WA, USA, June, 2011, 003292–003297. doi:10.1109/PVSC.2011.6186641
Keywords: photovoltaic-battery system, peak demand reduction, time series clustering, statistical analysis, Monte Carlo simulation
Citation: Nematirad R, Pahwa A, Natarajan B and Wu H (2023) Optimal sizing of photovoltaic-battery system for peak demand reduction using statistical models. Front. Energy Res. 11:1297356. doi: 10.3389/fenrg.2023.1297356
Received: 19 September 2023; Accepted: 27 November 2023;
Published: 07 December 2023.
Edited by:
Zijun Zhang, City University of Hong Kong, ChinaReviewed by:
Zicheng Fei, City University of Hong Kong, ChinaZhongju Wang, University of New South Wales, Australia
Copyright © 2023 Nematirad, Pahwa, Natarajan and Wu. This is an open-access article distributed under the terms of the Creative Commons Attribution License (CC BY). The use, distribution or reproduction in other forums is permitted, provided the original author(s) and the copyright owner(s) are credited and that the original publication in this journal is cited, in accordance with accepted academic practice. No use, distribution or reproduction is permitted which does not comply with these terms.
*Correspondence: Anil Pahwa, cGFod2FAa3N1LmVkdQ==