 Wenwei Zhou
 Binjie Wang
 Jipeng Gu
 Youbing Zhang
- Zhejiang University of Technology, Hangzhou, Zhejiang, China
Virtual synchronous generator (VSG) control addresses the issue of decreasing microgrid standby inertia caused by the rise in wind turbines and photovoltaic (PV) penetration. However, various types of perturbations occur frequently making the traditional constant parameter VSG control unable to meet the system performance requirements, and thus a two-parameters fuzzy VSG control is proposed to ensure that microgrid inertia and damping. Firstly, the device-level control of each generation unit in the microgrid is designed based on the wind-PV-battery alternating current (AC) microgrid architecture. Secondly, fuzzy VSG control uses fuzzy rules written in plain language to represent the relationship between the main VSG factors and the power and frequency. Then, the influence of virtual inertia and damping coefficient on the dynamic performance of the system is analyzed through the theory of small-signal model, and a reasonable variation range of VSG parameters are given. Finally, the simulation model of wind-PV-battery AC microgrid is built in MATLAB/Simulink, and compared with other improved VSG control strategies, the fuzzy VSG control proposed in this paper has better dynamic performance and safety stability. This research emphasizes the practicality and importance of utilizing fuzzy control to adjust VSG techniques for developing microgrid configurations incorporating more renewable energy sources to guarantee the reliability and efficiency of microgrid.
1 Introduction
With the gradual transformation of energy utilization, the construction of microgrids generating electricity from renewable energy sources such as wind, light and water has become an important strategy for new energy development in various countries (Rezkallah et al., 2019; Bilal Abdul et al., 2022). Microgrids are primarily comprised of renewable energy sources, including wind turbines, photovoltaics, distributed energy storage, alternating current (AC) and direct current (DC) converters, and their control circuits, which facilitate the efficient use of energy. These components work together to achieve optimal energy usage in a microgrid system. However, the increasing penetration of wind and photovoltaic leads to a significant reduction of standby inertia in microgrids, which is harmful to the stable operation of microgrids and seriously affects the quality of output power (Li et al., 2021; Nguyen and Khazaei, 2021). Therefore, in order to provide sufficient inertia and damping, it is particularly important to rationally control the operation strategies of the units in the microgrid.
Inverter is an important energy conversion device in the power system, which can realize the energy interaction between microgrid and AC distribution network, and its control strategy determines the overall operation state of microgrid. National and international scholars have proposed many control strategies, such as active-frequency, reactive-voltage, droop control, model predictive control, sliding mode control, etc. The above control strategies have the advantages of fast response speed and simple and flexible control structure, but they lack the regulation of inertia and damping and cannot actively follow the voltage and frequency changes of the microgrid (Rafaq et al., 2022). To address the aforementioned issues, certain academics have suggested using the virtual synchronous generator (VSG) technique. In Rosso et al. (2021), it outlines a range of common control strategies, with the VSG topology being commonly employed in distributed energy control devices (Srinivas et al., 2020). In Liu et al. (2016) and Meng et al. (2021), the dynamic performance of the system under droop control and VSG control was compared, and the results showed that the inverter with VSG control presented stronger anti-interference and robust characteristics compared to the droop control method (Wang et al., 2023). VSG control simulates the principle of power synchronization of actual synchronous generators, and realizes the functions of frequency and voltage regulation, which provide system inertia for scaled and diversified groups of renewable energy sources (Fahad et al., 2021). As in Bakeer et al. (2023) and Kerdphol et al. (2023), VSG control of inverters was introduced in AC microgrids and AC-DC hybrid microgrids respectively, as a way to enhance the virtual inertia and damping of the corresponding microgrids and to improve the overall stable operation of the system. Proposed in Liang et al. (2023) is a VSG control strategy for quasi-Z-source inverters for optical storage microgrids, which effectively enhances the frequency and voltage self-regulation capability of the system. In Liang et al. (2022), VSG control is proposed to replace the conventional power control of grid-connected inverters in AC microgrids for brushless doubly-fed wind turbines, which solves the problem of lack of “inertia” and grid-supporting capability in AC microgrids. When the microgrid system is faced with environmental changes or disturbances, the existing constant parameter VSG control can no longer meet the performance requirements of inertia and damping, which may even affect the stable operation of the system in serious cases (Jain et al., 2023). To tackle such issues, it is suggested in Wu et al. (2016) to modify the output characteristics by adjusting the damping coefficient and rotational inertia of the VSG to attain mitigation of output power and frequency fluctuations. In Hou et al. (2020), an adaptive VSG control strategy is proposed to achieve flexible regulation of inertia by constructing an adaptive variation relationship between the frequency rate of change and the virtual inertia. In Fathi et al. (2018), a VSG incorporating robust control is proposed for optimally adjusting the inertia constant to regulate the system frequency. The adaptive regulation of the virtual inertia was achieved in Fathi et al. (2018) and Hou et al. (2020), but the effect of the damping coefficient on the system was not considered, and the adaptive adjustment of the damping coefficient helped to avoid frequency instability and collapse of the system (Skinder et al., 2022). In Pouresmaeil et al. (2021), the optimal value of the damping coefficient in the VSG oscillation equation is investigated for facilitating a smooth transition between grid-connected and islanded modes. The effect of the damping coefficient on the inertial capacity enhancement was considered, but the adaptive nature of the virtual inertia was neglected. In Wang et al. (2018), the virtual inertia and damping coefficients were designed using optimal damping ratios and these parameters were adaptively updated according to the frequency fluctuations, which effectively regulated the inertia and damping coefficients only in a limited range of values. In summary, the existing adaptive VSG control improves the dynamic performance of the system to a certain extent, but there are still shortcomings: 1) It does not make full use of the advantage of flexible adjustment of the two parameters of the VSG, which leads to a lack of continuity in the adaptive process of the microgrid, and at the same time, limited enhancement of its inertial capacity. 2) Few studies have used intelligent algorithms, fuzzy logic and neural networks, to adaptively adjust virtual inertia and damping coefficients in the VSG equation.
Based on the above research background, this paper takes an AC microgrid containing wind, photovoltaic and battery units as an example. A two-parameters fuzzy VSG control strategy is introduced in the battery unit’s inverter to improve the dynamic response of the system and its inertia. Firstly, the system-level control strategy and mathematical model are established. Secondly, the relationship between virtual inertia, damping coefficient and system frequency is established based on VSG power angle characteristics. A reasonable fuzzy rule is formulated to express the relationship between the above variables, so that the VSG parameters can adaptively approach the optimal value according to the actual working conditions. The control targets of reducing power overshoot and shortening system response time are achieved. After that, a small-signal model of VSG control is established, and the effects of virtual inertia and damping coefficient values on the stability of the system are analyzed. It provides help to determine the range of parameter selection. Finally, simulation analyses are carried out for four control strategies: two-parameters fuzzy VSG control (virtual inertia and damping coefficients), single-parameter fuzzy VSG control (virtual inertia), linear adaptive VSG, and constant parameter VSG, which verifies the validity and reasonableness of the control method proposed in this paper. The main contributions of this paper lies in:
(1) The implementation of VSG control technology in wind-PV-battery AC microgrid warrants consideration. Simulations of synchronous generator characteristics can provide virtual damping and inertia, which effectively stabilizes power output in the connection line. This approach prevents system oscillation and power fluctuation issues associated with large-scale new energy integration.
(2) The effects of virtual inertia (J) and damping coefficient (D) on the system power overshoot and regulation time are analyzed, and a two-parameters fuzzy VSG control strategy is proposed, which effectively improves the inertia capability of wind-PV-battery AC microgrid.
(3) Based on the small-signal model of VSG control, the effects of J and D on the stability of the system are analyzed by using the root-trajectory method. The critical stability value is established by analysing the characteristic root distribution, which validates the boundary values outlined in the fuzzy controller output.
(4) Compared with the existing VSG control methods, the proposed two-parameters fuzzy VSG in this paper shows a reduction in frequency deviation and output power overshoot, which reflects a better dynamic performance.
2 Wind-PV-battery AC microgrid architecture
The diagram in Figure 1 illustrates the structure of an AC microgrid that incorporates wind, photovoltaic, and battery unit, as well as the AC main grid. Among them, the wind unit comprises a permanent magnet synchronous motor (PMSG), wind turbine, rectifier, inverter, and filter that feed into the AC microgrid. The photovoltaic unit adopts a two-stage grid-connected structure, where the photovoltaic array is boosted through the DC/DC circuit and then passed through the inverter and filter into the AC microgrid. And the battery unit comprises a battery connected to the AC microgrid through a bi-directional DC/DC converter, an inverter and a filter.
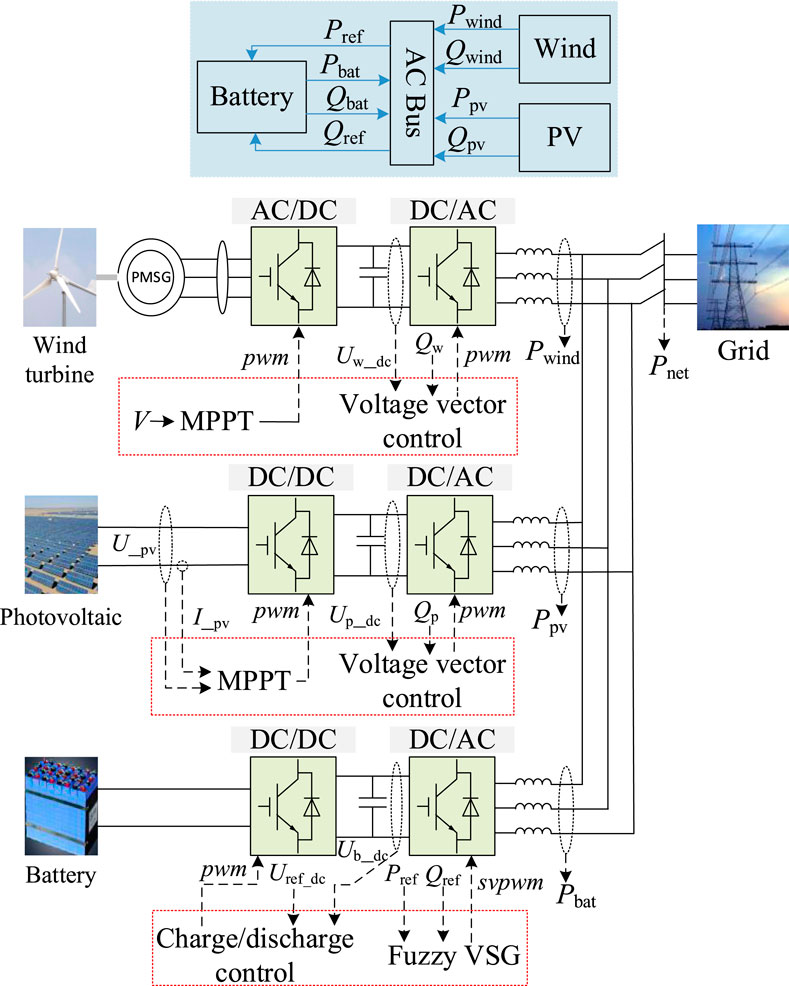
FIGURE 1. Microgrid architecture.
The wind, photovoltaic and battery units are brought together in the AC bus using a distributed and independent architecture, and deliver power to the microgrid through their respective inverters, with the three linked in the form of power complementarity. The primary control objective is steady active power in the connection line, which is stated as:
Where: Pwind and Ppv are the active power output from wind and photovoltaic units respectively; Pbat is the active power output from the battery unit, and the reference value of the power of the battery unit is determined by the actual output power of the connection line and the deviation of the target power; Pnet is the output power of the connection line.
Assuming the power profiles of the wind and PV units are available for a given time period T, the wind and PV units power generation can be calculated. Finally, the average power of the AC microgrid during the time period T is converted, and this value serves as the reference value for the output power of the connection line.
Where: Wwind and Wpv are the wind and PV units power generation in the T time period. PT is the converted average power in the T time period.
3 Device-level control of units in an AC microgrid
3.1 Control of wind unit
In this paper, the PMSG with high efficiency, adjustable speed and flexible control is selected to construct the wind turbine. Firstly, the wind turbine is driven by the external wind, which generates torque to drive the generator to produce alternating current (AC) with unstable frequency and amplitude, and then after going through the machine-side rectifier, the grid-side inverter and the filtering circuit, a stable AC with stable frequency and amplitude is obtained and used for grid connection.
The maximum power point tracking (MPPT) algorithm for the wind turbine is based on the blade tip speed ratio method as shown in the following equation.
Where: R is the radius of the paddle; V is the wind speed measured by an external velocimeter; λ is the blade tip speed ratio; ωref is the given PMSG reference speed. By utilizing the wind speed, one can determine the preferred output power of the fan (Pref) using the equation displayed in Eq. 4.
The voltage equation of the machine-side AC/DC rectifier in the dq-rotating coordinate system is:
Where: Rs is the PMSG stator resistance; Ld and Lq are the straight-axis (d-axis) and cross-axis (q-axis) inductances; isd and isq are the dq-axis components of the stator currents; ωe is the electromagnetic angular velocity; Ψf is the PMSG rotor magnetic chain; and u1d and u1q are the dq-axis voltage components of the rectifier output.
The mathematical model of the grid side DC/AC inverter in dq-rotating coordinates can be expressed as:
Where e2d, e2q, i2d and i2q represent the dq-axis voltage and current components of the grid; ω is the grid-side angular frequency; L and R refer to the filtering inductor and filtering resistor respectively. Furthermore, u2d and u2q are the voltage components that are produced as output from the inverter. The control of the PMSG machine-side rectifier and net-side inverter can be observed in Figure 2.
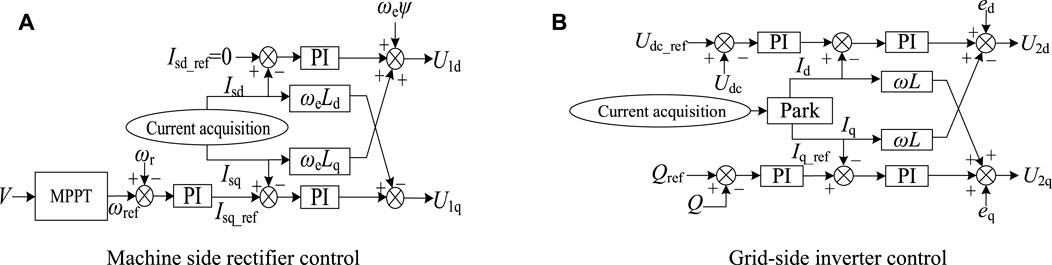
FIGURE 2. PMSG machine side rectifier and network side inverter control. (A) Machine side rectifier control (B) Grid-side inverter control.
In Figure 2A, the machine-side rectifier control is structured with an outer loop for speed and an inner loop for current, and its primary function is to perform the MPPT of the wind turbine. In Figure 2B, the inverter control design on the grid side adopts the Udc-Q strategy, which serves to maintain the stability of the DC voltage whilst providing active power to the inverter side, as well as delivering reactive power to the grid.
3.2 Control of photovoltaic unit
The photovoltaic unit adopts a two-stage structure, with the first stage being a DC/DC booster circuit and the second stage being a DC/AC inverter circuit. This structure is clear and easy to be modularized as it separates the maximum power point tracking (MPPT) and grid-connection functions of the photovoltaic unit. The DC/DC boost circuit using incremental conductance (INC) for maximum power point tracking (MPPT) in photovoltaic systems, which has the advantage of solving the oscillation problem that exists in the traditional perturbation observation method. The INC control flow is shown in Figure 3. When the photovoltaic array output voltage has deviation, the dynamic conductance value (dI/dU) is compared with the static conductance value (-I/U); otherwise, only the positive or negative of (dI) is judged. Judge the duty cycle adjustment direction according to the selection result to achieve maximum power tracking.
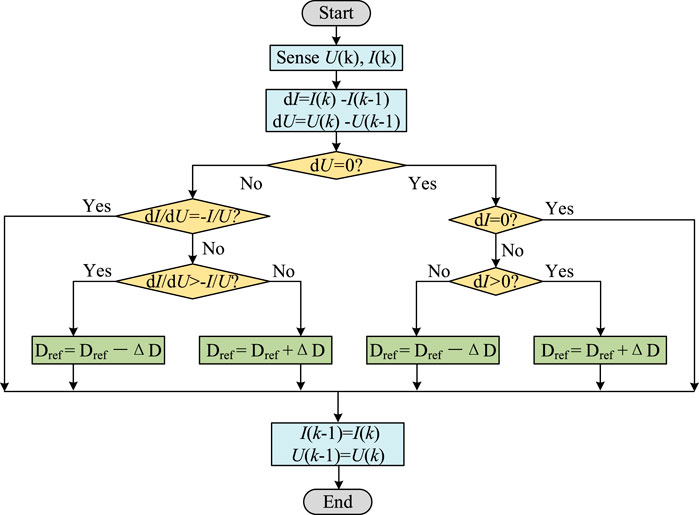
FIGURE 3. INC control process.
The inverter for photovoltaic unit is uniformly controlled in the form of Udc-Q control with the wind unit grid-side inverter. The adjustable reactive power control can be modified as required by adjusting the q-axis current reference signal using the power controller in the outer loop. The reactive power reference is typically set to 0 to ensure a unity power factor grid connection.
3.3 Control of battery unit
The battery unit consists of a battery, a bi-directional DC/DC converter, a DC/AC inverter, a filter and related control circuits, which can realize the bi-directional flow of energy from the battery. Among them, the bi-directional DC/DC converter control adopts a double closed-loop control strategy, with the DC bus voltage as the outer loop and the inductor current as the inner loop, which can absorb or provide the corresponding power according to the system demand command. The battery charge/discharge control is shown in Figure 4.
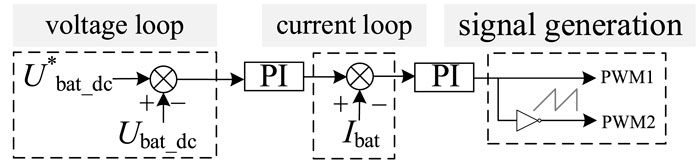
FIGURE 4. Battery charge and discharge control.
The VSG topology utilized in this paper’s inverter aims to enhance the battery’s ability to cope with power fluctuations from distributed power supplies. It achieves this by regulating frequency and voltage of the grid through control of active and reactive power, resulting in better control accuracy and effectiveness. This form of decoupled control is achieved through improved inertia (Yu and Hu, 2019; Yang et al., 2023). The essence of VSG control is to simulate the operating characteristics of the synchronous generator. After referring to the simplified model of the conventional second-order synchronous generator, the rotor motion equation for VSG frequency regulation can be obtained analytically, as shown in Eq. 7.
Where: Tm, Te, TD are the mechanical torque, electromagnetic torque and damping torque of the synchronous generator. The damping torque mainly comes from mechanical friction and stator loss; J and D are the virtual inertia and damping coefficient of the synchronous generator; δ is the power angle of the synchronous generator; ω is the virtual angular frequency of the VSG; ω0 is the rated angular frequency.
Drawing upon the characteristic of active power regulation by mechanical torque in synchronous generators, the magnitude of Tm in the VSG is determined by the power reference value (Pref) in conjunction with the extent of frequency deviation in the feedback loop. In this way, the regulation of the active power of the VSG is implemented. The relationship between Te, Tm and power is shown in Eq. 8.
Where: Pe is the output electromagnetic power of VSG; Pref is the power reference value; kω is the frequency modulation coefficient of VSG. Associative Eqs 7, 8, and do the corresponding transformation can be obtained active power regulation frequency of the equation:
In addition, according to the reactive voltage control principle of the synchronous generator, the output reference voltage amplitude (E) of the VSG can be expressed as:
Where: E0 is the no-load voltage magnitude of VSG; Qref and Q are the reference and actual values of grid reactive power; Uref and Un are the reference and actual magnitudes of grid voltage; kq and ku are used to regulate reactive power deviation and voltage deviation.
The reference angular frequency ω is integrated to obtain the phase angle θ. In turn, the VSG virtual potential (eabc) is obtained from Eq. 11.
The overall VSG control results are displayed in Figure 5. Figure 5A illustrates the control of active adjusted frequency and reactive adjusted voltage. Meanwhile, Figure 5B portrays the VSG impedance characteristic equation and the proportional resonant (PR) current loop control link (Note: for the design of the two-parameters fuzzy VSG controller, refer to the following sections).
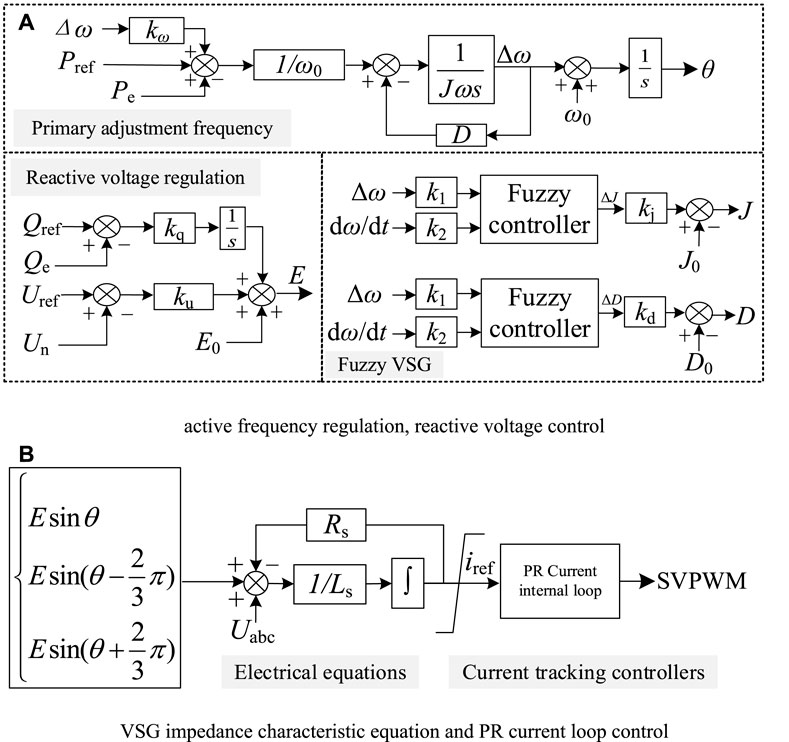
FIGURE 5. VSG overall control. (A) Active frequency regulation, reactive voltage control (B) VSG impedance characteristic equation and PR current loop control.
In the microgrid, consider the introduction of VSG control for battery inverters, which essentially converts the potential energy stored in the battery into mechanical energy in the rotor, thus specifying the inherent inertial properties of potential energy, with the characteristics of fast and flexible storage and release of energy. However, photovoltaic and wind turbine power output is unstable and susceptible to environmental factors and other influences, and it is difficult to directly access the grid through VSG, which is still mainly used for power generation.
4 AC microgrid inertia enhancement based on two-parameters fuzzy VSG control
4.1 Effect of J and D on frequency
By combining Eqs 7, 8, the relationship between Δω, dω/dt, the virtual inertia J and the damping coefficient D in the VSG model can be determined as shown in Eq. 12.
If Tm - Te - Jdω/dt remains stable, it follows from Eq. 10 that Δω and D are inversely proportional, an increase in D causes a decrease in Δω. When Tm, Te, and TD are constant, an inverse relationship between dω/dt and J exists. As J increases, dω/dt decreases proportionally. As a result, the system stability can be further ensured by adjusting J and D and thus controlling Δω and dω/dt.
4.2 Adaptive VSG control
The power angle characteristic curve and rotor angular frequency oscillation curve of the synchronous generator are shown in Figure 6. The oscillation curve showing the angular frequency of the rotor, as presented in Figure 6B, is divided into four time periods, namely, t1-t2, t2-t3, t3-t4, and t4-t5. These periods are identified by the serial numbers T1, T2, T3, and T4, and they correspond to the four power variations displayed in the power angle characteristic of the synchronous generator, which is shown in Figure 6A.
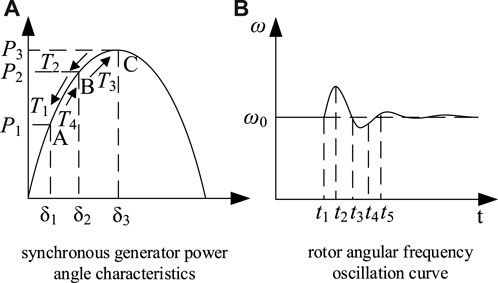
FIGURE 6. Synchronous generator power angle characteristic curve and rotor angular frequency oscillation curve. (A) Synchronous generator power angle characteristics (B) rotor angular frequency oscillation curve.
During time period T1, there is a rapid increase in power from P1 to P2, and dω/dt shows an initial sudden increase followed by a slow decrease, while Δω increases throughout this period. By analysing the effects of the J and D, it is concluded that J and D must be increased to prevent dω/dt from changing too quickly and Δω from becoming too large.
During time period T2, the power gradually increases from P2 to P3 and dω/dt<0, causing it to enter deceleration. However, the virtual angular velocity remains higher than the rated value. To quickly reach the rated frequency value, J should be reduced while a slight increase in D can further minimize the angular frequency shift.
The J and D selection rules for T3 and T4 relate to T1 and T2 respectively. In essence, the rules rely on the rate of change of angular frequency (dω/dt) and angular frequency deviation (Δω) conditions. The combined selection rules for J and D are shown in Table 1.
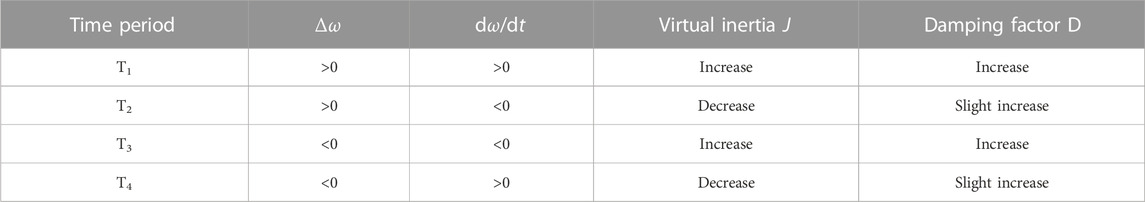
TABLE 1. J and D selection rules.
Yang et al. (2019) proposes a linear adaptive VSG control strategy whose core algorithm is shown in Eqs 13, 14:
Where: Kj and Kd are the adjustment coefficients of J and D; J0 and D0 are the steady state values; Tj and Td are the thresholds for triggering adaptation.
The linear adaptive VSG control strategy requires the dω/dt and Δω to achieve a specific threshold for successful adaption. However, the limited linear quantization does not fully utilize the flexibility and adjustability of the system. Therefore, the introduction of adaptive fuzzy control enhances the flexibility of selecting J and D (Karimi et al., 2020; Long et al., 2021).
4.3 Two-parameters fuzzy logic VSG control
When there are variations in dω/dt and Δω, it is possible to design the corresponding fuzzy controllers using the selection rules given in Table 1, which will help to improve the adaptive capability and robustness of the system.
The inputs of the fuzzy controller are made up of Δω and dω/dt, while its outputs are made up of ΔJ and ΔD, forming a fuzzy controller with two inputs and two outputs. To represent the input and output variables, they are quantized into 13 levels in the discrete domain as (−6 −5 −4 −3 −2 −2 −1 0 1 1 2 3 4 5 6), where the fuzzy sets are divided into intervals using (PL PS ZE NS NL). ZE represents position 0, PL and PS represent positive deviations large and small, while NS and NL represent negative deviations small and large. Consider the transition from time period T2 to time period T3, where Δω occurs beyond 0, and needs to be differentiated at ZE with a relevant triangular membership function. The other time periods of Δω and the complete time period of dω/dt are depicted using a smooth gaussian membership function. ΔJ and ΔD are subsequently given by the triangular subordination function.
The fuzzy control output needs to satisfy the positive and negative direction development of J and the smooth change of D in Table 1. The rules are continuously adjusted through theoretical analysis and empirical methods, and the final fuzzy rules for ΔJ and ΔD are shown in Table 2. Taking the first row of ΔJ in Table 2 as an example for illustration, if dω/dt lies within the PB segment and Δω is within the PS to PB segment, it is imperative to progressively augment J. Conversely, if Δω is within the PS to PB segment, then J should be gradually diminished. This approach, as demonstrated in the first and fourth rows of Table 1, accelerates the angular frequency response.
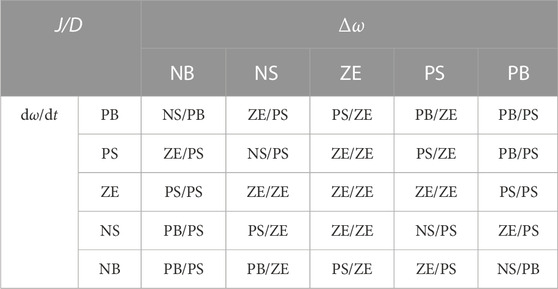
TABLE 2. Fuzzy rule for ΔJ/ΔD.
Similarly, as demonstrated in the first row of ΔD in Table 2, when dω/dt is in the PB segment and Δω is in the NB to ZE segment, D gradually increases. However, when Δω is in the ZE to PB segment, D only slightly increases. This approach, as shown in the second and third rows of Table 1, increases the rate of frequency attenuation. By using the centre of gravity method for defuzzification, the control quantity is determined as the final output value.
5 VSG small-signal model stability analysis
In order to deeply analyse the influence of each relevant parameter on the microgrid, the active power (P) and reactive power (Q) of the virtual synchronous generator are calculated by the VSG one-phase apparent power(S), as shown in Eq. 15:
Where U represents the virtual synchronous generator terminal voltage; δ is the power angle. As the power angle is insignificant during steady state operation, therefore, sinδ ≈ δ, cosδ ≈ 1. The impedance (Z) of the filter circuit between the virtual synchronous generator and the grid can be calculated using Eq. 16.
Where: the filter circuit uses an RL configuration, with R representing the filter resistor and L representing the filter inductor.
Referring to the technique for analysing the small signal model of synchronous generators in a power system, one can obtain the first and second order derivatives of active power in Eq. 17. Eq. 18 is obtained by inserting Eq. 17 into Eq. 9.
The Eq. 18 is reformulated using a pull-type transformation to derive the transfer function of the power input and output of the virtual synchronous generator. This function is expressed as:
According to Eq. 19, the small signal model of the virtual synchronous generator can be drawn as shown in Figure 7.
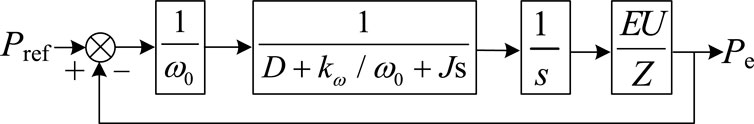
FIGURE 7. Small signal model for virtual synchronous generators.
From Eq. 19, the power transfer function of the virtual synchronous generator is a standard second-order system. The automatic control principle is applied to derive its corresponding damping ratio (ξ) and oscillation frequency (ωn), as shown in Eq. 20:
Using a value of 0 < ξ < 1, the range approximation for D can be determined by calculating J. Similarly, Eq. 20 can be used to obtain the overshooting amount (σ%) and regulation time (ts) for the system presented in Eq. 21. As shown in Figure 8, it is possible to observe the trend of the system’s overshoot and regulation time.
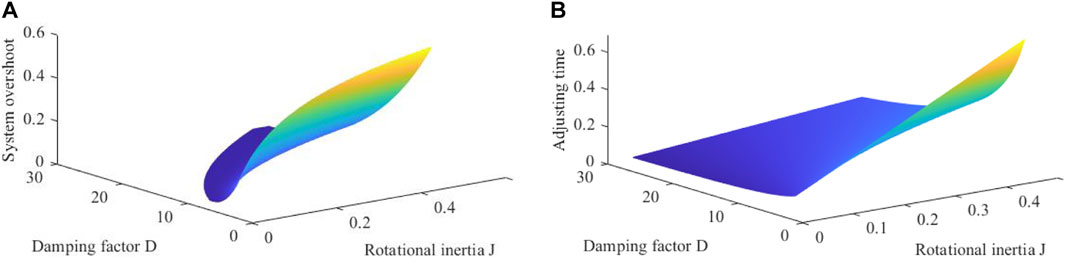
FIGURE 8. Trends in system overshoot and regulation time. (A) System overshoot (B) adjustment time.
The critical angular frequency is determined using the principle 20lg|G(jωc)| = 0, as shown in Eq. 22:
The margin of stability of the phase angle can be ascertained from ωc.
In order to guarantee the stability and robustness of the system, it is standard practice to use PM within the range (20°, 60°) and to determine the appropriate values of J by applying the Eq. 20.
According to the D-Boundary design principle described in the EN50438 standard, if the frequency of the grid voltage varies by 1 Hz, the active power output of the inverter will vary by 40%–100% (based on the rated capacity of the designed inverter of 50 kVA). The range of values of D is given in the following equation:
Where: ωn = 2π∙f = 100π, Δω = 2π. Dmax is the maximum value and Dmin is the minimum value of D.
Usually, the modulation coefficient (kω) remains constant. Analysis of Figure 8 reveals that if D is held constant, an increase in J leads to a decrease in ξ and ωn, resulting in a greater percentage σ% and an extended ts. When J is constant, ωn remains constant due to its significant impact. When D increases, ξ also increases, leading to a decrease in the σ% and a shorter ts.
6 Simulation results and analysis
To verify the design and analysis results, the overall model of the VSG in Figure 5 was built using MATLAB/Simulink. Figure 9 illustrates how varying D and J affects the σ% and ts of the VSG system. In Figure 9A, with a constant D, the σ% and ts increase as J increases. In Figure 9B, with a constant J, the σ% and ts decrease as D increases. These results further confirm the validity of theoretical analysis.
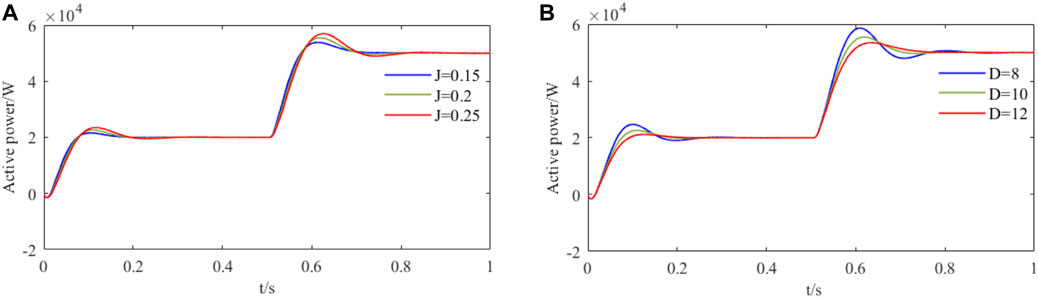
FIGURE 9. System overshoot and adjustment time change. (A) D constant, J = 0.15 ∼ 0.25 (B) J constant, D = 8 ∼ 12.
To examine how J and D impact system output stability, J values of 0.1, 0.5, and 1, with corresponding D values ranging from 0 to 60, were analysed. The zero-pole diagram for the small signal of the VSG’s grid-connected active power was plotted as shown in Figure 10.

FIGURE 10. VSG grid-connected active power small signal zero pole. (A) D = 20, J = 0.01∼0.5 (B) J = 0.2, D = 0∼50.
From Figure 10A, it is evident that the system has two conjugate poles. As J increases, the poles gradually approach the imaginary axis, causing an increase in system overshoot. When J reaches approximately 8, the poles approach the zero point, which poses a threat to the grid-connection stability. As Figure 10B illustrates, the poles shift towards the real axis as D increases, while the imaginary part decreases gradually and the damping ratio increases until the system achieves the overdamped state and the pole falls entirely on the real axis. The final boundary value obtained is 100. With an increase in system damping, the overshoot declines.
Ultimately, the range of values for J and D is determined through a combination of the zero-pole distribution and Eqs 24, 27. In order to ensure that the microgrid retains a certain stability margin, when designing the fuzzy VSG controller, it is only necessary to ensure that the output values of J and D are within the range of Eqs 24, 27.
Therefore, selecting a smaller J and a larger D would ensure a higher stability margin for the system, resulting in safe and stable operation of the microgrid. Using the same software platform, a wind-PV-battery AC microgrid system model is constructed with the architecture depicted in Figure 1. The microgrid system model parameters are outlined in Table 3.
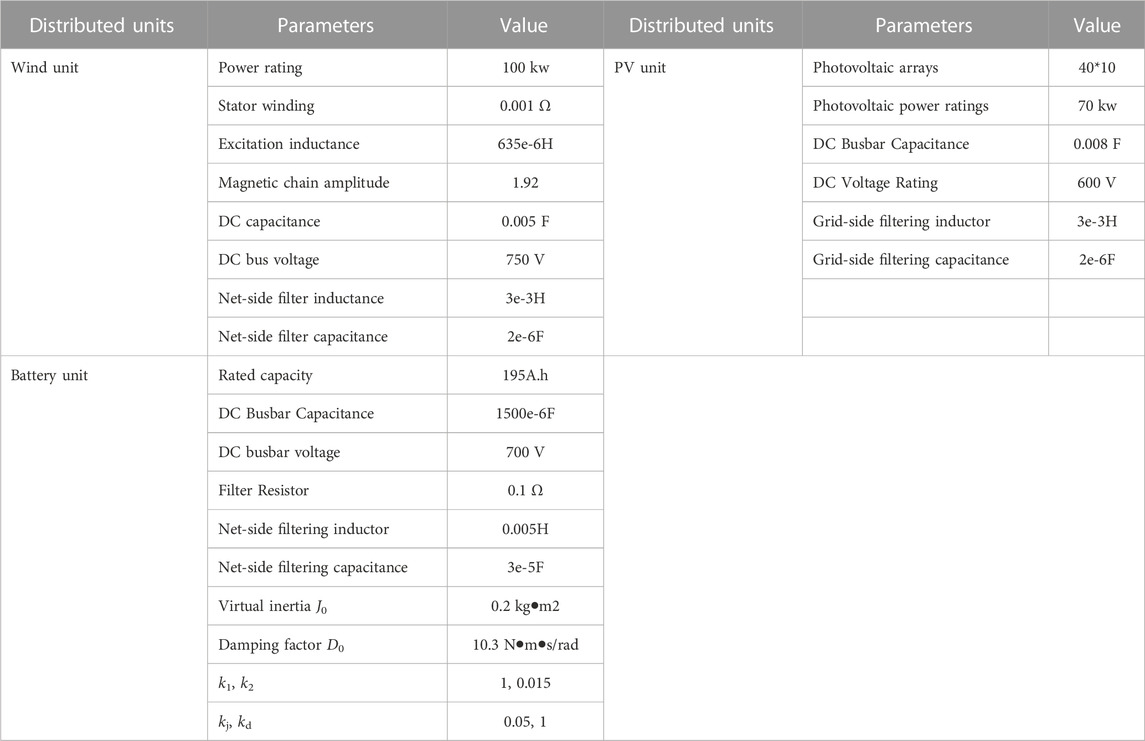
TABLE 3. Microgrid system model parameters.
To verify the effectiveness of the proposed method, the present study employs simulation to investigate alterations in AC microgrid power. Specifically, it examines three aspects: transient performance for active and reactive power as well as steady-state performance for active power.
6.1 Analysis of active power transient performance
Constant parameter VSG, linear adaptive VSG, single-parameter fuzzy VSG (virtual inertia) and two-parameters fuzzy VSG (virtual inertia and damping coefficients) control strategies are simulated and compared. Lighting and wind speed are set to be constant before 1 s, and part of the power is supplied by the battery unit; after 1 s, lighting and wind speed are set to be 0 simultaneously, and all the power is supplied by the battery unit. Under these circumstances, the wind-PV-battery AC microgrid system’s transient performance is validated, and variations in DC-side current are examined. Figure 11 displays AC microgrid state simulation results using several VSG control strategies.
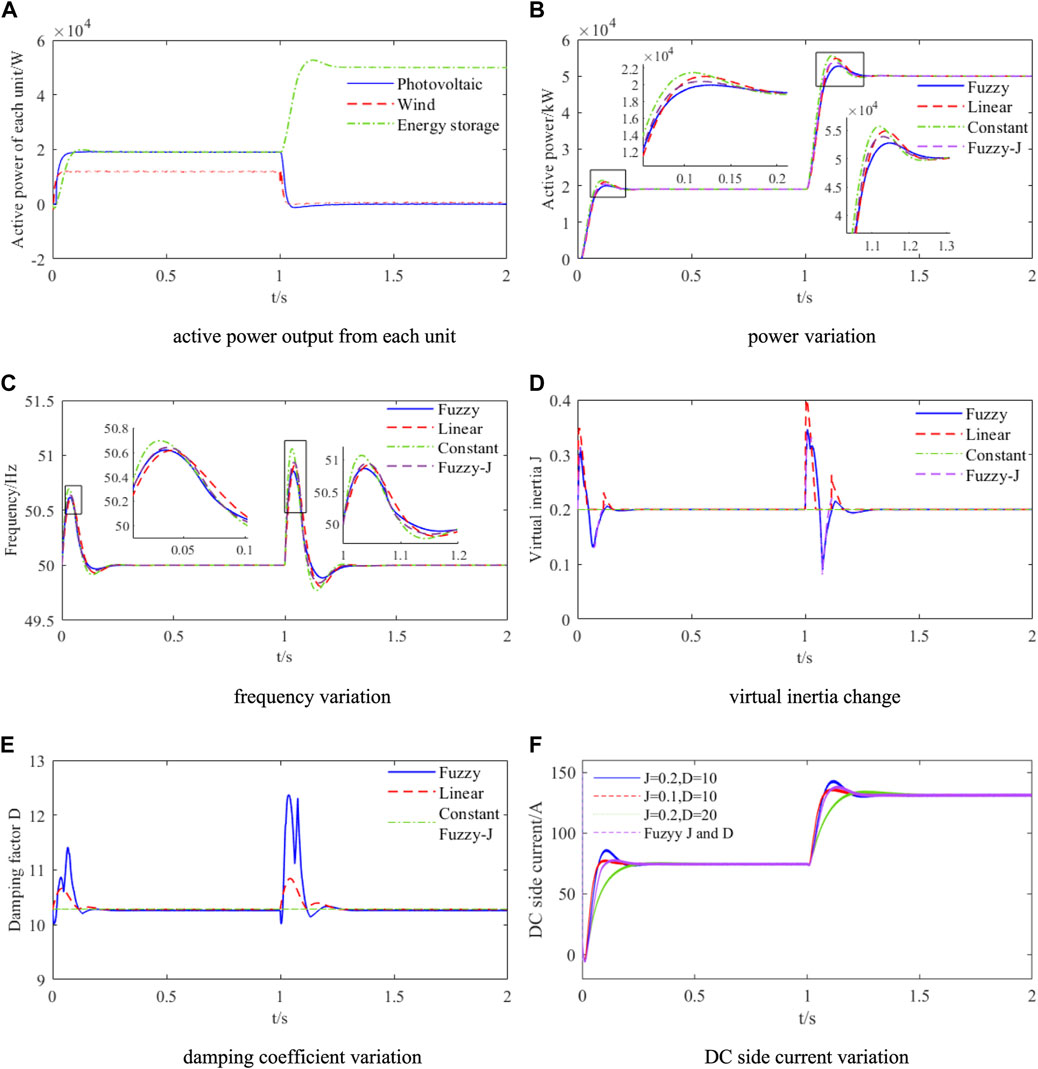
FIGURE 11. Active power transient performance analysis. (A) Active power output from each unit (B) power variation (C) frequency variation (D) virtual inertia change (E) damping coefficient variation (F) DC side current variation.
From Figure 11A, it can be seen that the photovoltaic and wind turbine unit generated an output power of 19 and 12 kW respectively in the interval 0–1 s, and the battery unit generated an output power of 19 kW. In addition, the wind turbine unit had a total output power of 0 kW in the interval of 1–2 s, while the battery unit generated an output power of 50 kW. The active power of the connection line is maintained at 50 kW. From a verification perspective, flexible access to wind and photovoltaic energy is able to ensure a stable flow of power to the grid. Even when the battery is removed, it will not adversely affect the normal operation of renewable energy generation.
From Figures 11B, C, the system performance metrics of the four control strategies are analysed under the condition of step change in power, which includes the overshooting amount of power, the rise time, the regulation time, and the overshooting amount of frequency change.
The Figures 11D, E indicate variations in J and D, suggesting that a single logic governs linear adaptive VSG. This logic only initiates adaptation after reaching a specific threshold. When under fuzzy control, the VSG control displays outstanding flexibility and can adjust J and D automatically within a particular range based on external conditions. In addition, the amount of adjustment under simultaneous fuzzy control of J and D decreases more rapidly than that of J singly, suggesting that the adaptive response is faster when J and D work together.
From Figure 11F, it can be seen that the changes in the J and D parameters at times 0 s and 1 s produce different transient characteristics in the DC side current, but they all eventually reach a steady state after a certain period of time. Therefore, as long as the J and D parameters remain within a reasonable range, the output power of the VSG will persist at the intended value.
The results of the comparison of the four strategies’ indicators are shown in Table 4.
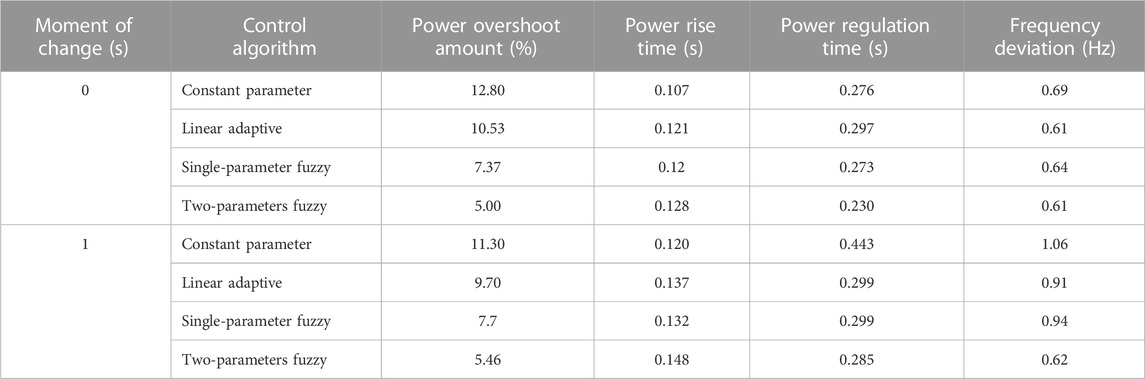
TABLE 4. Comparison of the results of the four strategy indicators.
As shown in Table 4, the power overshoot and frequency deviation under the two-parameters fuzzy VSG control are about 5.00% and 0.61 Hz, after the power reference value is given at 0 s, which are lower than the corresponding indexes of the linear adaptive VSG and the constant parameter VSG and the single-parameter fuzzy VSG, and taking into account the power overshoot and frequency deviation, the control effect is better, and the rise time lags behind by only 0.007–0.021 s. The power reference value experiences a sudden change at 1 s. The two-parameters fuzzy VSG displays better dynamic performance compared to linear adaptive VSG, constant parameter VSG, and single-parameter fuzzy VSG. It achieves a reduction in power overshoot, power regulation time, and frequency deviation. The rise time is only slightly slower, by 0.016–0.028 s.
6.2 Analysis of reactive power transient performance
By adjusting the reactive power command for each unit in the wind-PV-battery AC microgrid system to match the reactive power required by the microgrid, the demands of the system can be met. It is assumed that at the start (0 s), the microgrid is supporting an inductive load of 5 kVar, which is being sustained by the battery unit alone. At 5 s, the same inductive load of 10 kVar is being shared across all three units. According to the capacity size, the ratio of wind, photovoltaic, and battery is 3:2:5. Figure 12 illustrates the transient analysis of reactive power under the control of four strategies of regulation in this variable scenario.
FIGURE 12. Reactive power transient performance analysis. (A) Reactive power output from each unit (B) VSG reactive power (C) VSG virtual voltage.
From Figure 12A, it is clear that before 1 s the reactive power demand of 5 kVar is supplied by the battery unit, the output of the wind and photovoltaic unit is 0 Var and the total reactive power of the connection line is 5 kVar; after 1 s the reactive power demand of the grid suddenly increases by 10 kVar, the wind, photovoltaic and battery units take over the responsibility proportionally, supplying 3, 2, and 5 kVar. Eventually, the connection line’s reactive power reaches 15 kVar. Furthermore, the wind and photovoltaic unit is operated through traditional power control without inertia, while the battery unit is controlled by VSG, which has some inertia effect. Consequently, the wind-PV-battery AC microgrid benefits from a certain level of support capability.
From the reactive power response obtained in Figure 12B for the four strategies, it is clear that J and D variations indirectly affect the reactive power. The reactive power overshoots under constant parameter VSG, linear adaptive VSG, single-parameter fuzzy VSG, and two-parameters fuzzy VSG control are 85.64%, 81.80%, 74.8%, and 63.4%. This guarantees that the reactive power overshoots become better controlled with a lower response time. From the virtual voltage response shown in Figure 12C, it can be observed that the voltage inertia capacity under the two-parameters fuzzy VSG control is 27.3% higher than that under constant parameter VSG, 12.5% higher than that under linear adaptive VSG, and 8.60% higher than that under single-parameter fuzzy VSG. The improved response accuracy ensures a greater inertia support capacity.
6.3 Analysis of active power steady state performance
Figure 13 illustrates the analysis of power constancy and steady-state performance for the connection line of the wind-PV-battery AC microgrid under different conditions. There is little difference in steady-state performance between the four control strategies. For this reason, only two-parameters fuzzy VSG control is used for analysing the active power steady-state performance.
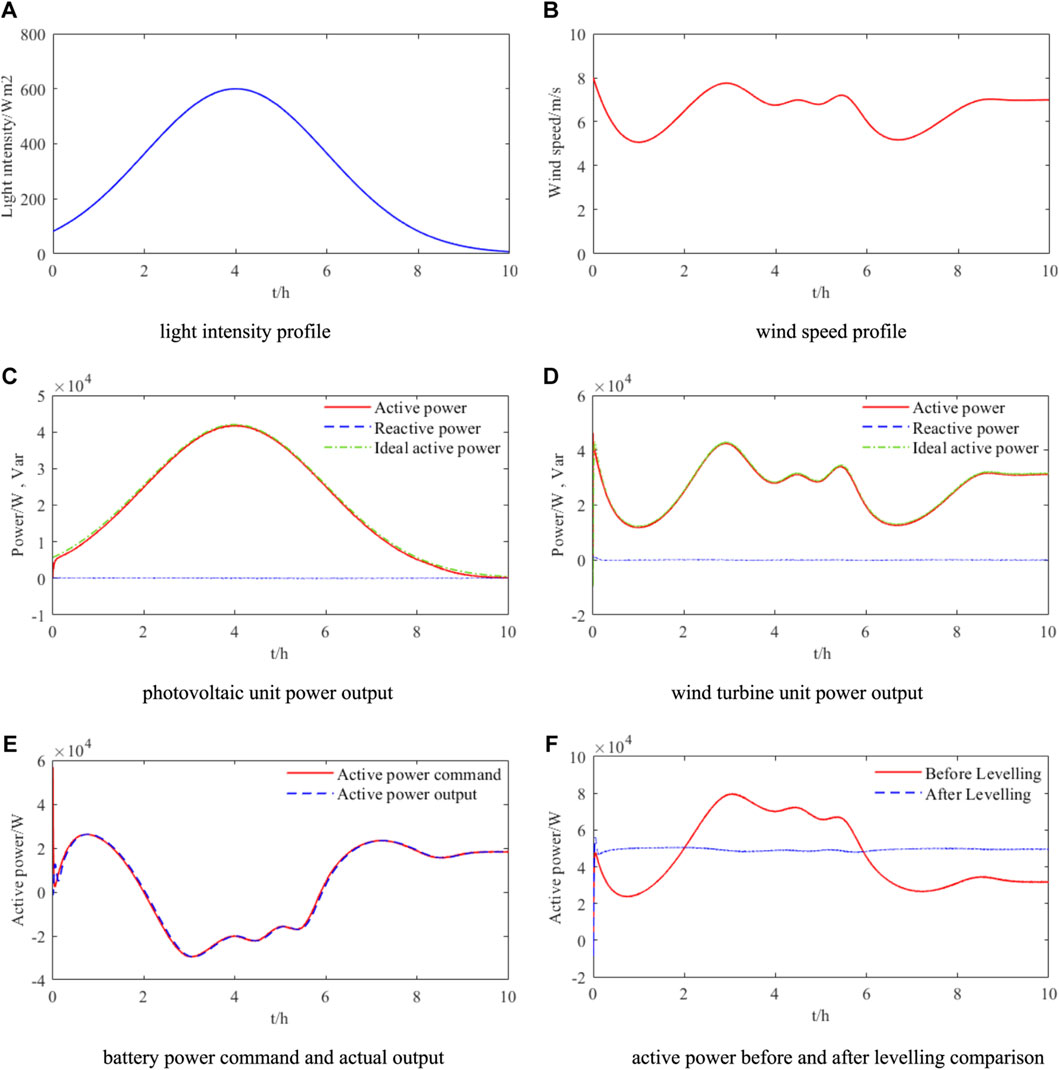
FIGURE 13. Analysis of the power constancy and steady-state performance of wind-PV- battery microgrid connection line. (A) Light intensity profile (B) wind speed profile (C) photovoltaic unit power output (D) wind turbine unit power output (E) battery power command and actual output (F) active power before and after levelling comparison.
The curve displays the simulation of light intensity variation during the day is depicted in Figure 13A, and the corresponding curve demonstrates wind speed variation is displayed in Figure 13B. Each unit operates in the maximum power tracking state, with the unit power factor being set concurrently.
Figure 13C shows that the photovoltaic unit reaches the maximum light value at 4.01 h for a given light intensity, which corresponds to an active output power of 41.82 kW and a reactive power of 75.44 Var. At 4.006 h, the maximum power tracking effect can be as high as 99.23%. As seen in Figure 13D, the wind turbine reaches the highest wind speed at the moment of 2.906 h for a given wind speed, and the wind turbine outputs active power of 42.66 kW and reactive power of 147.7 Var; at the moment of 1.055 h, when there is a minimum wind speed of 5.07 m/s, the wind turbine outputs active power of 58.06 kW and reactive power of 58.06 Var. The power tracking effect reaches the highest of 98.6% at the moment of 2.20 h. It can be seen that the MPPT control of the wind and photovoltaic units is excellent and that decoupled control of active and reactive power is achieved, so that the system operates in a unit power factor state.
Based on the actual power output of the wind and PV unit, a constant connection line power (Pnet) can be determined. This value can be calculated using Eqs 1, 2. To measure the converted power over a period of 10 h, Figures 13C, D are used as reference. The converted power is obtained using a computer data fitting process. The target value for the connection line power is 45.8 kW, which is then rounded up to 50 kW.
Figure 13E shows a comparison between the power command and the actual output of the battery unit. At 2 h the power command becomes negative and the battery unit starts to charge. Until 5.90 h, when the power command becomes positive, the battery unit starts to discharge. Due to the inertia and damping characteristics of the two parameters, the fuzzy VSG itself will have a certain delay effect. Apart from the deviation of the system start-up moment, the rest of the power absorption and release curves basically overlap with the microgrid power command. It is demonstrated that the battery unit’s designed fuzzy VSG control strategy can rapidly absorb or release wind turbine and photovoltaic output power redundancy values based on the power command. The inertia and damping characteristics of the microgrid to respond to power fluctuations caused by changing external conditions are improved to ensure stable microgrid operation.
Figure 13F shows a comparison of the pre and post power levelling data, illustrating the significant power fluctuations observed during the pre and post levelling periods. Prior to the power levelling, the lowest measurement of 23.8 kW is observed at 0.65 h, while the highest value of 79 kW is recorded at 3.08 h. After the battery smooths the power, the connection line’s power is consistently maintained at approximately 50 kW. This demonstrates that the two-parameters fuzzy VSG control strategy of the battery unit is effective in suppressing the system’s power fluctuations, and improves the microgrid’s immunity to interference in response to external and complex conditions.
Specifically, there is a transition from 30 to 45.8 kW at the 3 h, followed by a corresponding increase to 60 kW at 7 h. The results of this scenario are shown in Figure 14. This is a simulation of a situation where the external conditions change significantly.
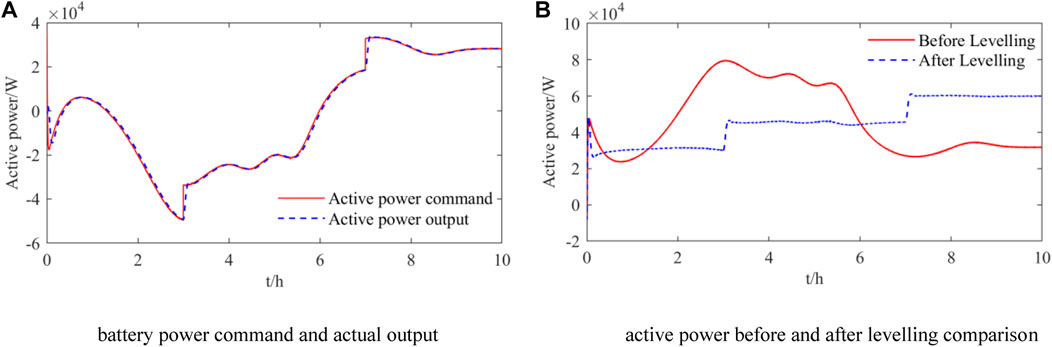
FIGURE 14. (A) battery power command and actual output (B) active power before and after levelling comparison.
Figure 14A shows the comparison of the power command and the actual output of the energy storage device. By setting 3 and 7 s moments, the power command of the overhead line changes abruptly, the designed fuzzy VSG control strategy of the energy storage device can still follow the power command quickly and take advantage of the inertia and damping of the VSG, which slows down the frequent sudden changes of the electronic equipment such as the inverter and the energy storage device, and prolongs the service life. Figure 14B shows the comparison results before and after power levelling, and it can be clearly seen that the value of the catenary power command changes at the moment of 3 and 7 s, and still maintains a stable levelling function. During the levelling period, the catenary power has a slight fluctuation, which is due to the presence of inertia to reduce the effect of the disturbance shadow on the overall stability capability of the system.
7 Conclusion
The paper focuses on an integrated control approach to improve the voltage and frequency regulation, enhance inertia and damping, and maintain constant connection line power in an AC microgrid with wind, photovoltaic, and battery components. Accordingly, a strategy for the control of the battery unit VSG is proposed. The strategy employs a two-parameters fuzzy VSG control method, and the associated stability analysis is carried out using small-signal model theory. The following conclusions are drawn through MATLAB/Simulink simulations:
(1) The wind and photovoltaic power generation unit can quickly and accurately track wind speed and light variations, ensuring maximum power output and grid stability. The battery unit employs a two-parameters fuzzy VSG control to release or absorb the necessary power according to the power reference value. This approach efficiently minimizes power fluctuation from wind turbines, photovoltaics, and other distributed power generation systems and keeps the power of the connection line at a steady level.
(2) The system’s stability is investigated using the VSG small-signal model theory. The effects of the virtual inertia (J) and damping coefficient (D) on the power overshoot and regulation time of the system. For the selection of reasonable limits for virtual inertia and damping coefficients, valuable references are provided.
(3) By comparing the constant parameter VSG with the linear adaptive VSG control strategy and the single-parameter (virtual inertia) fuzzy VSG, the two-parameter fuzzy VSG (virtual inertia and damping coefficients) control strategy actively and coherently adjusts the magnitude of the virtual inertia and damping coefficients according to real-time frequency variations under transient conditions, which further improves the operational performance of the system (e.g., steady state error, regulation time).
Based on the research in this paper, possible future research directions are summarised:
1) The two-parameter fuzzy VSG control strategy, as proposed in this paper, possesses universal applicability and can be employed in numerous other scenarios to enhance the inertia of microgrids, including interlinking converters for AC-DC hybrid microgrids and grid-connected inverters for DC microgrids.
2) The two-parameter fuzzy VSG control strategy, suggested in this paper, has areas that require improvements. For instance, the influence of the fuzzy affiliation function and the fuzzy input-output domain on the variation of J and D parameters can be discussed.
3) The stability of the energy storage unit has been confirmed through analysis using a small signal model. However, further research is required to study the system stability of the AC/DC microgrid.
Data availability statement
The raw data supporting the conclusions of this article will be made available by the authors, without undue reservation.
Author contributions
WZ: Writing–original draft, Writing–review and editing. BW: Conceptualization, Data curation, Investigation, Methodology, Software, Supervision, Validation, Writing–original draft. JG: Writing–review and editing, Data curation, Methodology, Supervision. YZ: Formal Analysis, Funding acquisition, Project administration, Resources, Validation, Visualization, Writing–review and editing. SW: Data curation, Methodology, Supervision, Writing–review and editing. YW: Conceptualization, Investigation, Software, Supervision, Writing–review and editing.
Funding
The author(s) declare financial support was received for the research, authorship, and/or publication of this article. This work is supported by Joint Foundation of National Natural Science Foundation of China (U22B20116).
Conflict of interest
The authors declare that the research was conducted in the absence of any commercial or financial relationships that could be construed as a potential conflict of interest.
Publisher’s note
All claims expressed in this article are solely those of the authors and do not necessarily represent those of their affiliated organizations, or those of the publisher, the editors and the reviewers. Any product that may be evaluated in this article, or claim that may be made by its manufacturer, is not guaranteed or endorsed by the publisher.
References
Bakeer, M., Gaber, M., Bakeer, A., and Mohamed, M. A. (2023). Resilient virtual synchronous generator approach using DC-link capacitor energy for frequency support of interconnected renewable power systems. J. Energy Storage 65 (1), 107–129. doi:10.1016/j.est.2023.107230
Bilal Abdul, B., Anh Tuan, N., Sang-Wook, R., Park, H., and Jung, J. (2022). A state-of-the-art comprehensive review of modern control techniques for grid-connected wind turbines and photovoltaic arrays distributed generation systems. IET Renew. Power Gener. 16 (1), 2191–2222. doi:10.1049/rpg2.12511
Fahad, S., Goudarzi, A., and Xiang, J. (2021). Demand management of active distribution network using coordination of virtual synchronous generators. IEEE Trans. Sustain. Energy 1 (12), 250–261. doi:10.1109/TSTE.2020.2990917
Fathi, A., Shafiee, Q., and Bevrani, H. (2018). Robust frequency control of microgrids using an extended virtual synchronous generator. IEEE Trans. Power Syst. 33 (6), 6289–6297. doi:10.1109/TPWRS.2018.2850880
Hou, X., Sun, Y., Zhang, X., Lu, J., Wang, P., and Guerrero, J. M. (2020). Improvement of frequency regulation in VSG-based AC microgrid via adaptive virtual inertia. IEEE Trans. Power Electron. 35 (2), 1589–1602. doi:10.1109/TPEL.2019.2923734
Jain, A., Pathak, M. K., and Padhy, N. P. (2023). Conjoint enhancement of VSG dynamic output responses by disturbance-oriented adaptive parameters. IEEE Trans. Industrial Inf., 1–18. doi:10.1109/TII.2023.3283540
Karimi, A., Khayat, Y., Naderi, M., Dragicevic, T., Mirzaei, R., Blaabjerg, F., et al. (2020). Inertia Response Improvement in AC Microgrids: a fuzzy-based virtual synchronous generator control. IEEE Trans. Power Electron. 35 (4), 4321–4331. doi:10.1109/TPEL.2019.2937397
Kerdphol, T., Ngamroo, I., and Surinkaew, T. (2023). Forced oscillation suppression using extended virtual synchronous generator in a low-Inertia microgrid. Int. J. Electr. Power & Energy Syst. 15 (1), 109126–126. doi:10.1016/j.ijepes.2023.109126
Li, X., Wang, L., Yan, N., and Ma, R. (2021). Cooperative dispatch of distributed energy storage in distribution network with PV generation systems. IEEE Trans. Appl. Supercond. 3 (8), 1–4. doi:10.1109/TASC.2021.3117750
Liang, S., Jin, S., and Shi, L. (2022). Research on control strategy of grid-connected brushless doubly-fed wind power system based on virtual synchronous generator control. CES Trans. Electr. Mach. Syst. 6 (4), 404–412. doi:10.30941/CESTEMS.2022.00052
Liang, W., Liu, Y., and Shen, Y. (2023). Active power control integrated with reactive power compensation of battery energy stored quasi-Z source inverter PV power system operating in VSG mode. IEEE J. Emerg. Sel. Top. Power Electron. 11 (1), 339–350. doi:10.1109/JESTPE.2021.3137397
Liu, J., Miura, Y., and Ise, T. (2016). Comparison of dynamic characteristics between virtual synchronous generator and droop control in inverter-based distributed generators. IEEE Trans. Power Electron. 31 (5), 3600–3611. doi:10.1109/TPEL.2015.2465852
Long, B., Liao, Y., Chong, K. T., Rodriguez, J., and Guerrero, J. M. (2021). Enhancement of frequency regulation in AC microgrid: a fuzzy-MPC controlled virtual synchronous generator. IEEE Trans. Smart Grid 12 (4), 3138–3149. doi:10.1109/TSG.2021.3060780
Meng, X., Liu, J., and Liu, Z. (2021). A generalized droop control for grid-supporting inverter based on comparison between traditional droop control and virtual synchronous generator control. IEEE Trans. Power Electron. 34 (6), 5416–5438. doi:10.1109/TPEL.2018.2868722
Nguyen, D. H., and Khazaei, J. (2021). Unified distributed control of battery storage with various primary control in power systems. IEEE Trans. Sustain. Energy 12 (4), 2332–2341. doi:10.1109/TSTE.2021.3091976
Pouresmaeil, M., Sangrody, R., Taheri, S., and Pouresmaeil, E. (2021). An adaptive parameter-based control technique of virtual synchronous generator for smooth transient between islanded and grid-connected mode of operation. IEEE Access 9 (1), 137322–137337. doi:10.1109/ACCESS.2021.3117617
Rafaq, M. S., Basit, B. A., Mohammed, S. A., and Jung, J. (2022). A comprehensive state-of-the-art review of power conditioning systems for energy storage systems: topology and control applications in power systems. IET Renew. Power Gener. 16 (1), 1971–1991. doi:10.1049/rpg2.12498
Rezkallah, M., Singh, S., Chandra, A., Singh, B., Tremblay, M., Saad, M., et al. (2019). Comprehensive controller implementation for Wind-PV-Diesel based standalone microgrid. IEEE Trans. Industry Appl. 55 (5), 5416–5428. doi:10.1109/TIA.2019.2928254
Rosso, R., Wang, X., Liserre, M., Lu, X., and Engelken, S. (2021). Grid-forming converters: control approaches, grid-synchronization, and future trends—a review. IEEE Open J. Industry Appl. 2 (1):93–109. doi:10.1109/OJIA.2021.3074028
Skinder, K. S., Kerdphol, T., Mitani, Y., and Turschner, D. (2022). Frequency stability assessment of multiple virtual synchronous generators for interconnected power system. IEEE Trans. Industry Appl. 58 (1), 91–101. doi:10.1109/TIA.2021.3121219
Srinivas, V. L., Singh, B., and Mishra, S. (2020). Seamless mode transition technique for virtual synchronous generators and method thereof[J]. IEEE Trans. Industrial Inf. 16 (8), 5254–5266. doi:10.1109/TII.2019.2954593
Wang, F., Zhang, L., Feng, X., and Guo, H. (2018). An adaptive control strategy for virtual synchronous generator. IEEE Trans. Industry Appl. 54 (5), 5124–5133. doi:10.1109/TIA.2018.2859384
Wang, Z., Meng, F., Zhang, Y., Wang, W., Li, G., and Ge, J. (2023). Cooperative adaptive control of multi-parameter based on dual-parallel virtual synchronous generators system. IEEE Trans. Energy Convers., 1–14. doi:10.1109/TEC.2023.3283048
Wu, H., Ruan, X., Yang, D., Chen, X., Zhao, W., Lv, Z., et al. (2016). Small-signal modeling and parameters design for virtual synchronous generators. IEEE Trans. Industrial Electron. 63 (7), 4292–4303. doi:10.1109/TIE.2016.2543181
Yang, Y., Mei, F., Zhang, C., Miao, H., Chen, H., Zheng, J., et al. (2019). Cooperative adaptive control strategy for virtual synchronous generator rotational inertia and damping coefficient. Electric Power Automation Equipment. 39 (03), 125–131. doi:10.16081/j.issn.1006-6047.2019.03.020
Yang, Y., Xu, J., Li, C., Zhang, W., Wu, Q., Wen, M., Blaabjerg, F., et al. (2023). A new virtual inductance control method for frequency stabilization of grid-forming virtual synchronous generators. IEEE Trans. Industrial Electron. 70 (1), 441–451. doi:10.1109/TIE.2022.3148749
Keywords: wind-PV-battery AC microgrid, virtual synchronous generator, fuzzy control, virtual inertia, damping factor, power control
Citation: Zhou W, Wang B, Gu J, Zhang Y, Wang S and Wu Y (2023) Power stability control of wind-PV-battery AC microgrid based on two-parameters fuzzy VSG. Front. Energy Res. 11:1298033. doi: 10.3389/fenrg.2023.1298033
Received: 21 September 2023; Accepted: 31 October 2023;
Published: 17 November 2023.
Edited by:
Enrico Pons, Polytechnic University of Turin, ItalyReviewed by:
Fabio Mandrile, Polytechnic University of Turin, ItalySahaj Saxena, Thapar Institute of Engineering and Technology, India
Copyright © 2023 Zhou, Wang, Gu, Zhang, Wang and Wu. This is an open-access article distributed under the terms of the Creative Commons Attribution License (CC BY). The use, distribution or reproduction in other forums is permitted, provided the original author(s) and the copyright owner(s) are credited and that the original publication in this journal is cited, in accordance with accepted academic practice. No use, distribution or reproduction is permitted which does not comply with these terms.
*Correspondence: Jipeng Gu, amlwZW5nZ3VAMTYzLmNvbQ==