 Ting Min*
 Qiang Zhou
- School of Chemical Engineering and Technology, Xi’an Jiaotong University, Xi’an, China
Catalyst layers (CLs) of proton exchange membrane fuel cells (PEMFCs) where the electrochemical reactions take place have a critical effect on the cell performance and liquid water forming in CLs during operation can influence the reactive transport processes which is challenge for experimental observation due to the temporal and spatial limitation. In this study, nanoscale structures of CLs in PEMFCs are reconstructed with pores, carbon, platinum (Pt) particles, and ionomers fully resolved. Distributions of liquid water with different saturations and wettabilities within nanoscale structures are simulated by the lattice Boltzmann method. Pore-scale modeling of oxygen reactive transport in the nanoscale structures is implemented, with oxygen diffusion in pores and ionomers, as well as an electrochemical reaction at the Pt surface considered. Effects of liquid water on the pore size distribution, electrochemical area, and oxygen concentration distribution are discussed. Liquid water in hydrophilic CL tends to form a film covering the reactive sites, while that in hydrophobic CL forms a droplet preferentially occupying large pores. For the hydrophilic case, local transport resistance increases significantly under a low saturation, while for the hydrophobic case, a remarkable increase in the local transport resistance can only be found after liquid water saturation higher than 0.8. Finally, the conjecture that liquid water in pores with a size smaller than a threshold pore size can conduct protons is considered. Different values of the threshold pore size are studied. The results show that when the threshold value is greater than 10 nm, the local transport resistance will decrease as the liquid water saturation increases, which means the optimizing strategy of CL needs to carefully consider the effects of liquid water.
1 Introduction
Water management is vital for the performance and durability of proton exchange membrane fuel cells (PEMFCs), and there are abundant studies focused on this topic (Jiao and Li, 2011; Zhao et al., 2022). Compared with extensive experimental and numerical studies of liquid water distributions and dynamic behaviors inside the gas channel (GC) and gas diffusion layer (GDL), the work related to liquid water distribution inside the catalyst layer (CL), especially the cathode CL, a key component of PEMFCs where the electrochemical reaction takes place and water is generated, is rare, and further studies are urgently required for enhancing the reactive transport processes inside CLs (Sui et al., 2019; Wang et al., 2021). CL is a nano-porous composite consisting of platinum (Pt) nanoparticles (2∼5 nm), carbon particles (20–50 nm), and the ionomer film (∼5-nm-thick) covered on carbon and Pt nanoparticles (see Figure 1) (Lopez-Haro et al., 2014; Orfanidi et al., 2017). In cathode CLs, an oxygen reduction reaction takes place at the surface of Pt nanoparticles which connect with the connected transport network of the ionomer for protons, carbon for electrons, and are in close proximity to pores for the reactant gas, leading to the generation of liquid water. Water is also brought into PEMFCs by the humidification of the reactant gas before entering the PEMFCs. Inside CLs, on one hand, the ionomer needs to be hydrated by water to guarantee good proton conductivity; on the other hand, however, if there is too much water, water will block the pores and cover the reactive sites, leading to water flooding, which is generally believed to have negative effects on the reactive transport processes inside CLs (Zhao et al., 2022).
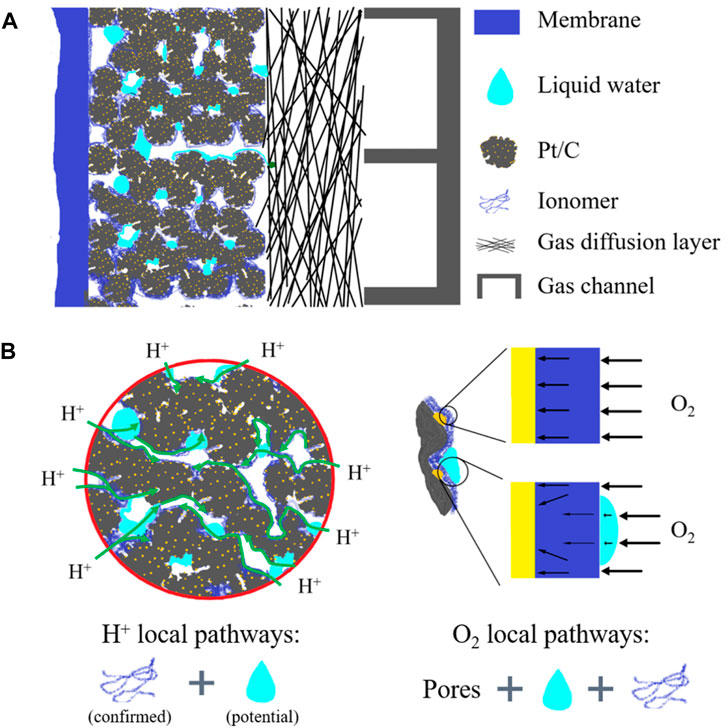
FIGURE 1. Schematic representation of structures of and transport processes in the cathode catalyst layer. (A) Nanoscale structures and constituents; (B) proton transfer, oxygen transport processes, and effects of liquid water.
There are several technologies which can be adopted in operating PEMFCs to explore the distribution and migration of liquid water, such as optically transparent GCs to visualize liquid water dynamic behaviors in GCs (Xiao et al., 2021), neutron radiography (with the resolution of approximately 100 μm) to explore water in GC and GDL (Owejan et al., 2006), synchrotron X-ray computed tomography (X-ray CT) with a resolution of a few micrometers to visualize liquid water in GDLs (Manke et al., 2007), and quasi-elastic neutron scattering (QENS) to measure water dynamics in an ionomer (Ito et al., 2021). Currently, most of the in situ experimental studies focus on GDL or membrane, and the in situ observation and measurement of water in CLs are still very challenging due to the multiple constituents inside and nanoscale structures of CLs. Ito et al. (2021) explored water dynamics in CL by QENS and small-angle neutron scattering (SANS), and illustrated three modes of water in ionomers including immobile water tightly connected to a sulfonic group, water in a fast mode assigned to free diffusion restricted in a sphere, and water in a slow mode described by a jump diffusion model. Lee et al. (2020) developed an instrument utilizing high-resolution operando SANS to probe water content in CLs and quantified liquid water saturation and water adsorbed in the ionomer. It was found that even under a relatively low current density of 150 mA cm-2, water was observed in CLs as liquid. Due to the resolution of the neutron beam (30 μm) and low divergence angle (0.005⁰), a much thicker CL (100-μm-thick) was adopted. Currently, it is still difficult for experiments to directly provide distribution details of liquid water inside the nanoscale structures of CLs.
Due to the vital role of water management in CLs on the performance and durability of PEMFCs and the limitation of experimental exploration, numerical modeling becomes a powerful tool to uncover dynamics of water in CLs. Among different numerical models, pore-scale models directly based on the realistic CL structures can provide details of distribution and migration of liquid water and are helpful for understanding the effects of liquid water on reactive transport processes. Fathi et al. (2017) established a three-dimensional (3D) pore-scale modeling of CL, considering the immiscible two-phase flow based on the volume of fluid (VOF) method to explore the effects of wettability and saturation on distributions of liquid water and oxygen effective diffusivity. Zheng et al. (2019) developed a multiscale multiphase pore-scale model combining the high-order lattice Boltzmann method (LBM) with the multiphase decomposition method to increase the computational efficiency and simulated the generation, transportation, and evaporation of liquid water in CLs with the contact angle of 120⁰ and Pt loading of 0.3 mg cm-2. Chen et al. (2021) developed a pore-scale multiphase reactive transport model based on LBM to capture the generation, growth, and migration of liquid water in CLs, and effects of wettability on liquid water dynamic behaviors and oxygen reactive transport processes were explored. Kaneko et al. (2020) obtained a 3D nanostructure of CLs by cryo FIB-SEM with revolution as 6 nm and simulated effective diffusivity of oxygen under different relative humidities, considering the capillary condensation based on the lattice density functional theory. Mu et al. (2021) explored the effects of relative humidity and Pt loading on the transport properties of CLs. Zhang et al. (2022) comprehensively evaluated the effects of relative humidity on capillary condensation in micropores inside carbon particles, the electrochemical active surface area (ECSA) of Pt particles, and local transport resistance of oxygen. It was found that as relative humidity increases, the condensed water accumulated in the micropores will form a “water bridge” for proton conduction, which can further activate the Pt particles in the micropores, thus increasing ECSA and reducing the transport resistance.
In the literature, much work has been devoted to reducing Pt loading in CLs to reduce the cost of PEMFCs and promote commercialization (Jiao et al., 2021). However, as the Pt loading decreases, especially below 0.1 mg cm-2, oxygen transport resistance increases significantly under high current density which cannot be explained based on existing models (Greszler et al., 2012; Banham et al., 2021). It has been found that such unexpected mass transport resistance originates from the local transport processes inside CLs; however, the underlying mechanisms are not clear and are still under debate (Weber and Kusoglu, 2014). Some researchers believe that the unexpected resistance is caused by the confinement of the ionomer film in CLs whose properties may differ from those of bulk ionomers (Ramaswamy et al., 2021), while other researchers suggested that it is caused by the interfacial processes such as the dissolution of oxygen at the pore–ionomer interface (Owejan et al., 2013) or interfacial resistance between ionomers and Pt catalysts (Kudo et al., 2016). In addition, there are also experimental results indicating that the unexpected resistance is related to water management in CLs (Srouji et al., 2017). Srouji et al. (2017) compared the oxygen transport resistance of ultra-low Pt loading PEMFCs in a traditional channel/land flow field and an open metallic element (OME) flow field. The results show that the pressure-independent oxygen transport resistance varies from 13.3 to 14.5 s m-1 for the OME flow field and from 13.7 to 34.3 s m-1 for the traditional channel/land flow field as Pt loading reduces from 0.4 mg cm-2 to 0.03 mg cm-2. The effect of the flow field on the independent oxygen transport resistance attributes to the excellent water removal capability of the OME flow field, which reduces liquid water saturation in CLs. Effects of liquid water on local mass transport resistance are complicated. On one hand, as shown in Figure 1B, liquid water accumulated in CL pores or covered on the ionomer surface will hinder the oxygen transport to reactive sites. On the other hand, it has been reported in recent studies that the liquid water can provide pathways for protons in micropores of CL and active Pt particles inside the micropores. Soboleva et al. (2011) suggested that liquid water in the micropores with a size below 20 nm can conduct protons. Padgett et al. (2018) determined ECSA in their experimental study and found that as relative humidity increases from 10% to 100%, the liquid water condensed in micropores can increase ECSA by approximately 63%. It can be found that coupling mechanisms of liquid water on oxygen transport and electrochemical activity need to be further investigated.
Therefore, in the present study, pore-scale modeling is implemented to study liquid water distributions inside CLs and their effects on oxygen reactive transport processes. In Section 2, nanoscale CL structures with carbon particles, Pt particles, pores, and ionomer films are reconstructed, and pore-scale distributions of liquid water in the reconstructed structures with different wettabilities are simulated using the LBM pseudo-potential multiphase model. The reactive transport model of oxygen inside CLs with the existence of liquid water is established and simulated using LBM in Section 3. In Section 4, effects of liquid water distributions on the oxygen transport resistance in CLs with different Pt loadings are studied. Both the circumstances that liquid water can or cannot conduct protons are investigated. It will be found that the reactive transport processes in the 3D nanostructure of CL vary significantly with wettability and liquid water saturations, which provides a valuable evidence to improve the PEMFC performance. The proton conductivity of liquid water in nanopores of CL can significantly change the local transport resistance; therefore, it is vital to further study the proton conduction mechanism of liquid water in nano-porous CL, which may provide the new improvement strategy of CL. Finally, important conclusions are drawn in Section 5.
2 Reconstruction of 3D nanoscale CL structures
The nanoscale CL structures significantly affect the multiphase reactive transport processes inside CLs and cell performance. An accurate description of the nanoscale structures is the first step toward a fundamental understanding of multiphase reactive transport phenomena inside CLs. According to experimental observation, CL in PEMFCs with a typical thickness of approximately 10 μm includes four constituents as carbon particles, Pt particles, ionomers, and pores. Pt particles with a size of 2–5 nm are deposited on carbon supports with a typical size of 20–50 nm. Currently, it is still challenging and costly for experimental techniques to fully resolve the 3D nanoscale CL structures (Cetinbas et al., 2017). Alternatively, computational reconstruction schemes based on the known topology and parameters of CL structures are helpful for generating the CL structures with distribution details of different constituents (Chen et al., 2015). Up to now, several reconstruction schemes have been developed, such as the fabrication process-based scheme (Siddique and Liu, 2010) and sphere-based simulated annealing method (Lange et al., 2011). In this study, the scheme in Chen et al. (2020) is adopted, which is actually a process-based scheme by reconstructing each constituent in CLs step by step, as shown in Figure 2. The reconstruction process is as follows, and the values for reconstruction are listed in Table 1.
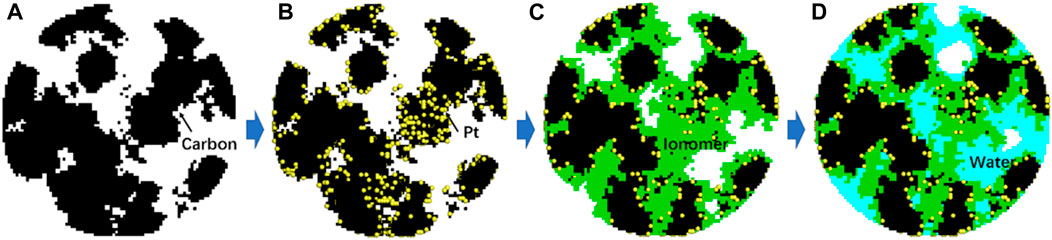
FIGURE 2. Reconstruction procedures of CL structures with each constituent gradually generated. (A) Carbon, (B) Pt particles further added, (C) ionomer film further added, and finally (D) liquid water generated in the pores.
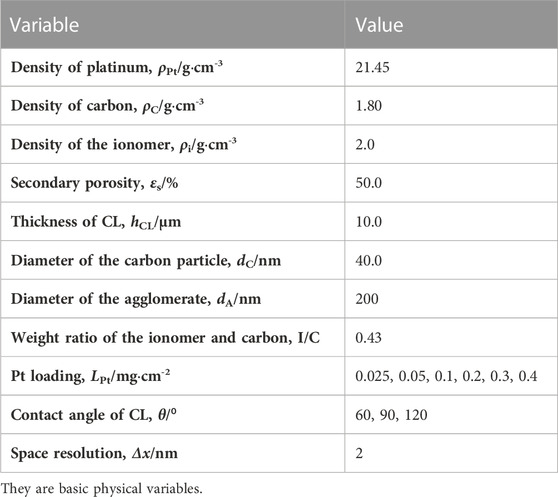
TABLE 1. Parameters for structural reconstruction (Chen et al., 2015; Chen et al., 2020; Zhang et al., 2022).
First, in a spherical domain representing the typical shape of agglomerates widely observed in the experiments (Cetinbas et al., 2017), the carbon supports with the prescribed volume are generated by the quartet structure generation set (QSGS) method (Chen et al., 2015). The generation processes include two steps, namely, the random distribution of carbon seeds and the growth of carbon phase around the seeds. The number of seeds is determined based on the total carbon phase volume and typical size of each carbon particle. Note that the resolution of each mesh in the reconstructed structures is 2 nm, which is sufficient considering the typical Pt size of approximately 2∼5 nm (Lopez-Haro et al., 2014). Figure 2A shows a 2D cross section of a 3D reconstructed carbon structure in the spherical domain.
The second step is to generate Pt particles loaded on carbon particles. The volume of Pt particles
where m and ρ are mass and density, respectively. With
where V is the total volume of the reconstructed domain and
The third step is to generate the ionomer film covered on Pt/C structures. An ionomer is observed to form a thin film on the Pt/C surface with a typical thickness of a few nanometers (Lopez-Haro et al., 2014). The ionomer volume in the reconstructed structures is obtained according to the weight ratio of the ionomer to carbon (I/C). Here, the value of I/C is set as 0.43 based on the studies regarding optimizing the ionomer content (Chen et al., 2020). To control the averaged thickness of the ionomer film, there are two steps to add ionomer nodes. First, ionomer seeds are randomly added on Pt/C, and the volume of the ionomer seeds is set as 30% of the total ionomer volume, and then, the ionomer grows around these seeds until the given volume is obtained. Figure 2C displays the reconstructed structures with the ionomer further added.
To study the effect of Pt loading, different Pt loadings are explored including 0.025, 0.05, 0.1, 0.2, 0.3, and 0.4 mg cm-2. Figure 3 shows the reconstructed structures with different Pt loadings. The specific surface of the carbon phase is approximately 251.5 m2 g-1, which is comparable with experimental measurements of approximately 231 m2 g-1 (Orfanidi et al., 2017).
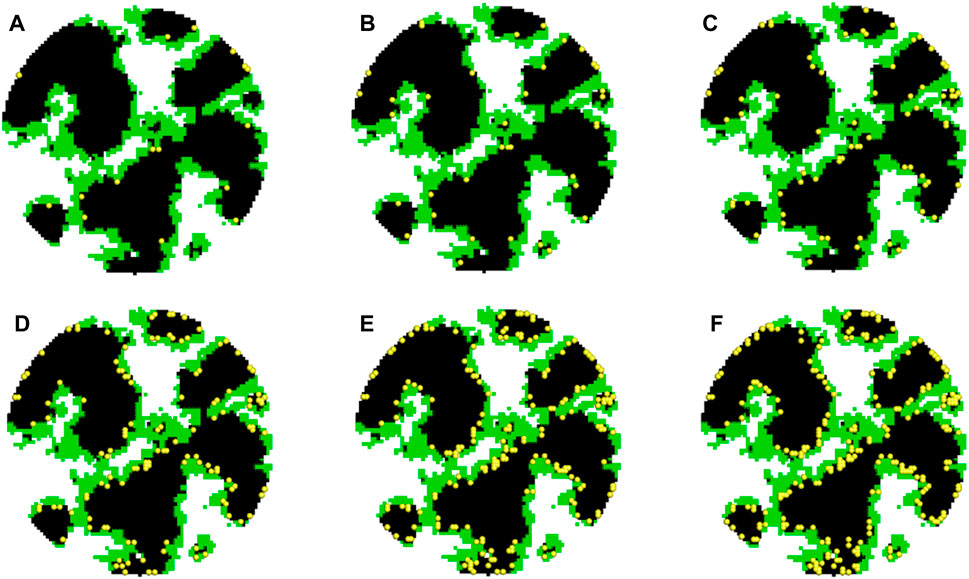
FIGURE 3. Distribution of Pt nanoparticles in agglomerates with different Pt loadings. (A–F) Pt nanoparticles in agglomerates with LPt = 0.025, 0.05, 0.1, 0.2, 0.3, and 0.4 mg cm-2.
Up to now, the nanoscale CL structures with carbon, Pt particles, and ionomers have been generated. The remaining space is pores. As the last step of reconstruction, the pores will be filled with liquid water with different saturations and wettabilities. This is achieved by performing pore-scale air–water two-phase simulations using the LB pseudo-potential multiphase model developed by Chen et al. (2014). First, for each pore node, a random number is generated, and if it is lower than the prescribed liquid water saturation S, this node is set as the liquid node and the density is set as the liquid water density. Then, LB simulation is conducted with the aforementioned initial distribution for certain time steps (in this study, 20,000 steps), and the typical liquid water distribution is shown in Figure 2D. The final two-phase distribution is employed for subsequent oxygen-relative transport simulations. By setting different fluid–solid interaction strengths, liquid water distribution with different contact angles can be obtained. In the present study, liquid water distributions with different saturations (S) (0.2, 0.4, 0.6, and 0.8) and contact angles (θ) (60⁰, 90⁰, and 120⁰) are generated, as displayed in Figure 4. It can be observed that wettability dramatically affects liquid water distribution. For θ = 60⁰, liquid water prefers covering on the solid surface and distributes relatively uniformly, while as θ increases to 120⁰, it tends to form isolated droplets in large pores.
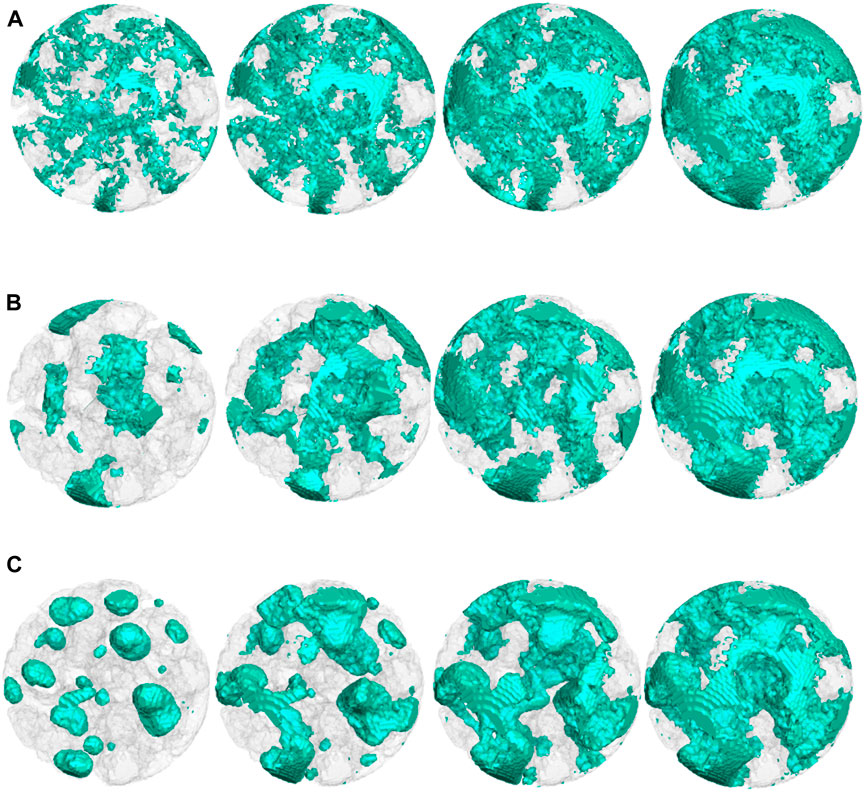
FIGURE 4. Liquid water distributions with different saturations and wettabilities. S = 0.2, 0.4, 0.6, and 0.8 from left to right. (A) θ = 60⁰; (B) θ = 90⁰; (C) θ = 120⁰.
3 Physicochemical models and numerical method
3.1 Oxygen reactive transport model
Oxygen transport processes with electrochemical reactions taking place in the aforementioned reconstructed porous structures are rather complex. As shown in Figure 1, oxygen transports in the pores, dissolves into the ionomer or liquid water, and participates in the electrochemical reaction at the surface of active Pt particles. As liquid water forms in CL, water may occupy some of the pores, block the oxygen transport pathway, cover the surface of the ionomer, and/or provide the pathway for protons, significantly affecting cell performance. Details of oxygen reactive transport processes are introduced as follows (Chen et al., 2019; Zhang et al., 2022).
First, oxygen diffuses in pores of the reconstructed structures:
where Dp is diffusivity of oxygen in pores taking Knudsen diffusion into account (Cunningham and Williams, 1980). Cg represents the oxygen concentration.
When oxygen transports across the pore–ionomer interface, its concentration will drop due to Henry’s law:
where HN is Henry’s constant of oxygen across the pore–ionomer interface and
where kdis is the oxygen interfacial dissolution rate constant, n is the normal direction of the interface, and
At the pore–water interface, the oxygen concentration also drops based on the Henry’s law:
where Hw is Henry’s constant of oxygen across the pore–water interface.
Oxygen transports in the ionomer or liquid water can be described as follows:
where subscripts N and w denote the ionomer and liquid water, respectively.
The electrochemical reaction takes place at the Pt–ionomer interface (and the Pt–water interface, if liquid water is allowed for conduction of protons) (Zhang et al., 2022):
where F, Cref, Iref, αc, η, and kelec are the Faraday constant, reference oxygen concentration, reference current density, transfer coefficient, overpotential, and reaction rate constant of the electrochemical reaction, respectively. CPt is the local oxygen concentration at Pt–ionomer or Pt–water interfaces.
The local transport resistance (Rlocal) of oxygen is determined by the limiting current density method corresponding to the maximum total reaction rate ψlim (Chen et al., 2018):
where C0 and Vagg represent the oxygen concentration at the outer surface of the reconstructed structures and the total volume of the spherical agglomerate, respectively.
3.2 The numerical method
In the present study, LBM is adopted to simulate the reactive transport processes in the 3D nanoscale structures introduced previously. LBM has been widely utilized to explore the complex transport phenomena occurring in porous media due to its ability to capture distribution of critical variables and to explore the coupled mechanisms between reactive processes and porous structures (Chen et al., 2022). The multi-relaxation time (MRT) LB mass transport model is used, and the evolution of the concentration distribution function can be described as follows (Chen et al., 2020):
where gi represents the oxygen concentration distribution function in the ith direction. x, ci, t, Δt, and Λ are the lattice site, lattice velocity, time, time step, and relaxation coefficient, respectively.
Compared with D3Q19, the D3Q7 model lattice is enough to simulate diffusion processes accurately while reducing computational costs significantly. The lattice velocity, ci, in the D3Q7 model is as follows:
Q and Q−1 in Eq. 11 are the transformation matrix and reverse transformation matrix, respectively, which transfer the distribution function between velocity space and momentum space (Chen et al., 2020). The relaxation coefficient matrix Λ is expressed as follows:
where τ in the matrix is the relaxation coefficient, and τ0 = τ4 = τ5 = τ6 = 1 represent the numerical stability. τij is related to diffusivity:
For isotropic mass transport, diffusivity in different directions is uniform, that is, Dij is a constant (D) and τxx = τyy = τzz = 4DΔt/Δx2+0.5; τij (i ≠ j) = 0. The local dissolution reaction at the interface described by Eq. 5 and Henry’s law described by Eq. 4 or Eq. 6 is treated by the following scheme in the LB framework (Mu et al., 2018):
where subscripts A and B are two neighboring nodes across the interface. A is the pore, and B is the ionomer or water. i and

TABLE 2. Parameters adopted in reactive transport simulation (Chen et al., 2020; Zhang et al., 2022).
4 Results and discussion
Based on the reconstruction scheme introduced in Section 2, a series of 3D nanoscale structures of CLs with different Pt loadings, wettability, and saturations are reconstructed. The variation in pore size distribution (PSD), coverage rate of liquid water on the solid surface, and ECSA with wettability and saturation will be discussed in Sections 4.1–4.2. In Sections 4.3–4.4, oxygen reactive transport processes are studied, and local transport resistance is predicted using the model and method in Section 3. Particularly, effects of saturation and wettability on the oxygen transport resistance under different Pt loadings are explored. Note that in simulation, the electron transfer resistance and proton transport resistance inside the reconstructed structures are ignored and the overpotential in the whole agglomerate is uniform as the potential variation can be neglected due to the small size of the agglomerates (Xing et al., 2014).
4.1 Coverage rate of liquid water on the solid surface and pore size distribution
To quantitatively evaluate the effects of liquid water distribution, the variation in the coverage rate of liquid water on the solid surface and PSD are displayed in Figure 5. The coverage rate of liquid water on the solid surface is defined as the ratio between the area of the water–solid interface to the total area of pore–solid and water–solid interface, where solid includes carbon, Pt, and ionomer nodes. The coverage rate of liquid water can quantitatively describe liquid water distribution in CL with different contact angles and is an important parameter if liquid water in nanopores is set as a proton conductor. As shown in Figure 5A, for the hydrophilic circumstance (θ = 60⁰), the coverage rate of liquid water on the solid surface rapidly increases with S first and then decelerates. Such a trend indicates that liquid water tends to cover the hydrophilic solid surface as a thin film. As for the hydrophobic case (θ = 120⁰), the changing trend is opposite and the curve is concave, indicating that liquid water tends to form droplets to avoid touching the hydrophobic surface. Therefore, under the same saturation, the coverage rate of the hydrophilic case is much higher than that of the hydrophobic case. For example, as S is approximately 0.2, the coverage rate is as high as 38.4% for θ = 60⁰, which is only 2.7% for θ = 120⁰. As S is approximately 0.8, the coverage rate is 87.6% and 56.4% for θ = 60⁰ and 120⁰, respectively, as shown in Figure 5A.
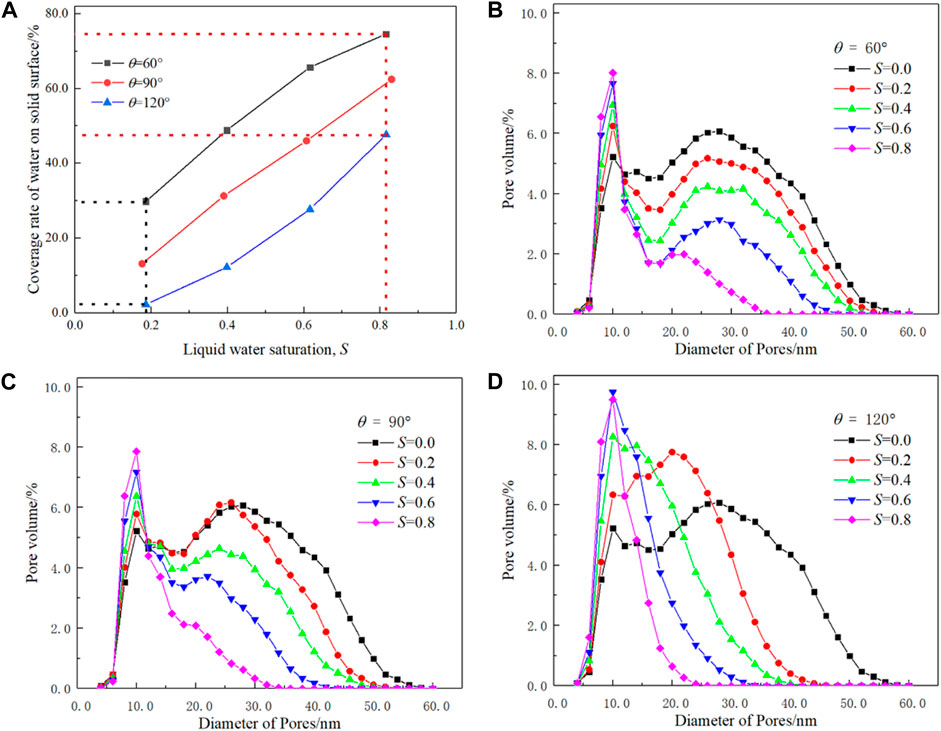
FIGURE 5. Effects of liquid water saturation, S, and wettability, θ, on the coverage rate of water on the solid surface (A) and pore size distribution (B–D).
Figures 5B–D display the effects of liquid water saturation on PSD under different wettabilities, in which the pore diameter is defined as the average length of 13 different directions of pore lattices (Chen et al., 2015) and PSD with S = 0.0 is provided as a reference. It can be seen that the initial PSD is typical bimodal distribution with one peak at 9 nm and the other at 26 nm, and such a double-peak feature has been reported in the literature (Soboleva et al., 2011). For all the cases, the pore volume reduces with increasing S, regardless of the hydrophobic or hydrophilic circumstances as expected. However, the PSD changes with wettability significantly. For hydrophilic structures, the bimodal distribution of PSD is significant for all the cases, while the larger pores decrease gradually with S, and the smaller pores increase with S. For hydrophobic agglomerates, the volume of bigger pores reduces with S rapidly, as shown in Figure 5D. Another interesting result is that the volume of smaller pore increases more significantly than that shown in Figure 5B since the droplets divide the larger pores into smaller pores. In addition, for the hydrophobic case, due to uneven distribution of liquid water, the peak of a smaller pore size decreases and disappears for S higher than 0.4, while the double-peak feature still can be observed in Figure 5B even after S is higher than 0.8.
4.2 Effects of liquid water on the electrochemical surface area
In the reconstructed structures, Pt particles loaded on carbon can be classified into three categories, those in contact with void space, those covered by the ionomer, and those covered by liquid water. It is usually believed that only the Pt particles covered by the connected ionomer network can be considered active. As mentioned previously, whether the Pt particles covered by liquid water can be utilized still needs further study (Soboleva et al., 2011). Nevertheless, both the circumstances with Pt particles covered by liquid water as active or inactive sites will be explored. Here, four parameters are adopted to quantitatively evaluate the existence of Pt particles in the reconstructed structures, namely, the specific surface, the roughness factor, the coverage rate of Pt particles by the ionomer, and the coverage rate of Pt particles by liquid water.
The specific surface (m2·g-1) of Pt is defined as the ratio between the total surface area of Pt particles to their total weight, while the roughness factor stands for the ratio between the surface area of Pt and the geometrical area of CLs. As shown in Figure 6A, the specific surface (black lines) decreases with the Pt loading from 84.9 m2 g-1 at 0.025 mg cm-2 to 67.6 m2 g-1 at 0.4 mg cm-2. The decrease in the specific surface area indicates that as Pt loading increases, the Pt particles agglomerate with each other slightly. The roughness factor decreases from 270.5 at 0.4 mg cm-2 to 21.2 at 0.025 mg cm-2. The roughness factor is coincident with the experimental results (Greszler et al., 2012), in which the roughness factor decreases from 235 at 0.4 mg cm-2 to 25 at 0.03 mg cm-2.
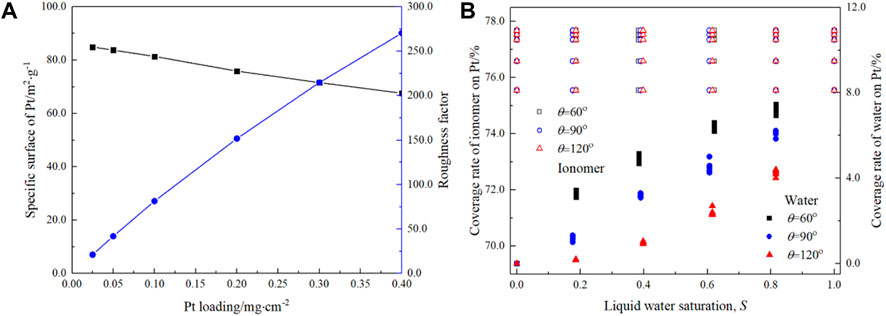
FIGURE 6. Variation in the specific surface and roughness factor with the Pt loading (A) and coverage rate of the ionomer and liquid water on the Pt surface (B).
Figure 6B shows the variation in the coverage rate of water and the ionomer on the Pt surface. First, as Pt loading increases, the ionomer coverage rate slightly increases from 75.6% at 0.025 mg cm-2 to 77.7% at 0.4 mg cm-2, indicating a uniform distribution of the ionomer generated by the reconstruction scheme. Second, liquid water saturation or wettability does not change the ionomer coverage rate, as expected based on the reconstruction scheme. For the liquid water coverage rate, the situation is different. It can be found that both saturation and wettability significantly affect the coverage rate. As the contact angle, θ, decreases, the coverage rate increases, consistent with the liquid water distribution shown in Figure 4. In addition, the coverage rate also increases with S. For example, the water coverage rate increases significantly from 3.3% ± 0.2% at S ≈ 0.2 to 7.2% ± 0.3% at S ≈ 0.8 for θ = 60⁰ and from 0.2% at S ≈ 0.2 to 4.2% ± 0.2% at S ≈ 0.8 for θ = 120⁰. Note that the summation of the ionomer coverage rate and liquid water coverage rate is the ratio of the Pt surface that can be potentially utilized to the total Pt surface. It can be found that even for S = 0.8, the total coverage rate is approximately 86% for the hydrophilic case, indicating the Pt particles are not fully active.
4.3 Nanoscale oxygen concentration distribution
The results in Sections 4.1–4.2 provide a deep understanding of liquid water distribution and wettability on the pore blockage and coverage of the reactive sites, which further play important roles in oxygen reactive transport processes. Therefore, in this section, oxygen reactive transport processes under limiting current density inside the nanoscale CL structures are simulated using the method in Section 3.
Figure 7 shows oxygen concentration distribution in different constituents including pores and ionomers, which is still very challenging for state-of-the-art experimental techniques to measure. Note that in Figure 7, liquid water saturation is zero, corresponding to the case free of water. Oxygen diffuses into the spherical agglomerate from the surface with a uniform concentration. Dissolution reaction and Henry’s law are considered at the pore–ionomer interface, where the dramatic oxygen concentration drop can be clearly observed. In addition, with the increase in Pt loading from 0.025 mg cm-2 to 0.4 mg cm-2, the oxygen concentration in the agglomerates decreases, as shown in Figures 7A–H and more clearly indicated by the dashed circles and rectangles in Figures 7E, F. The significant drop of oxygen across the pore–ionomer interface leads to quite a low concentration of oxygen at the reactive surface, and material with less oxygen transport resistance that can conduct protons is thus highly required.
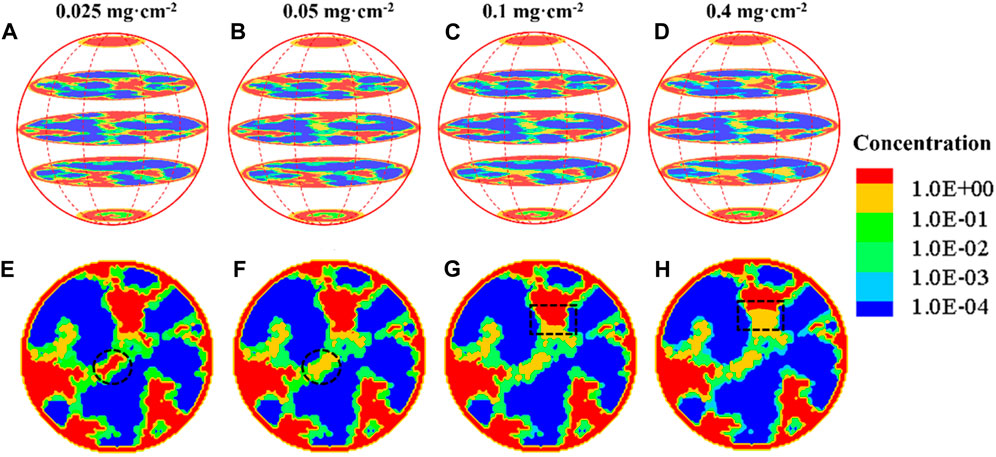
FIGURE 7. Oxygen concentration distribution in the agglomerate without liquid water under different Pt loadings. (A) 0.025 mgt·cm-2, (B) 0.05 mg cm-2, (C) 0.1 mg cm-2, and (D) 0.4 mg cm-2; (E–H) slices across the center of the agglomerate.
Figure 8 shows the oxygen concentration field in the nanoscale CL structures with a contact angle of 60⁰. The corresponding structures free of liquid water with different Pt loadings and those with different liquid water saturations are also provided for a better understanding of the concentration fields. From left to right in each row with the same saturation, the Pt loading gradually increases, and thus, oxygen concentration gradually decreases as expected. From top to bottom in each column with the same Pt loading, the saturation gradually increases, and liquid water tends to form a water film on the Pt–C surface and to fill the smaller pores first. Thanks to the same structures of carbon, Pt, and ionomer employed in each column, the oxygen concentration distribution in the nanoscale structures with different saturations can be well compared. Taking the case with Pt loading as 0.4 mg cm-2 for example, it can be found that when liquid water saturation is 0.2, compared with the case free of liquid water, the oxygen distribution does not change significantly as liquid water mainly forms a thin film on the carbon, Pt, or ionomer surface, and the main porous pathway is not altered. However, as S further increases, either the porous pathway is blocked or fully filled with liquid water, leading to severe flooding, and this results in significant reduction in the oxygen concentration, as shown by the black arrows. It can be found that in the case with S = 0.8 that expects few regions without liquid water, in most of the regions, the oxygen concentration value is several orders of magnitude lower than the prescribed value at the outer surface of the spherical domain.

FIGURE 8. Oxygen concentration distribution in the nanoscale CL structures with θ = 60⁰ under a limiting current density. From left to right, the Pt loading is 0.025, 0.05, 0.1, and 0.4 mg cm-2, respectively. From top to bottom, the liquid water saturation is 0.0, 0.2, 0.4, 0.6, and 0.8, respectively. To more clearly illustrate the effects of liquid water, the last row shows the CL nanoscale structures free of liquid water with different Pt loadings, and the last column displays the distribution of liquid water in the nanoscale structures.
Figure 9 further shows the oxygen concentration distributions in the hydrophobic nanoscale structures with a contact angle of 120°. The most remarkable result as the contact angles increase is that liquid water tends to fill large pores first instead of covering the solid surface, as observed in Figure 8. The effects of such a remarkable change in the liquid water distribution pattern on the oxygen reactive transport processes are as follows. First, as pores with a large size are blocked by liquid water, the transport of oxygen in the large pores is hindered, leading to a lower oxygen concentration, as marked by the circles in Figure 9. Second, a local region with small pores is free of liquid water, and the local oxygen concentration is higher as marked by the dark rectangles in Figure 9. Finally, under hydrophobic circumstances, coverage of liquid water on the surface of carbon, Pt, or the ionomer is not significant, which is beneficial for these Pt particles already covered by the ionomer as oxygen does not need to transport through both the liquid layer and ionomer before arriving at the Pt surface. However, it may be not desirable for these Pt particles not covered by the ionomer because if liquid water can conduct protons, these Pt particles will not be utilized as they are not covered by liquid water. From the previous discussion, it can be found that as CL changes from hydrophilic to hydrophobic, effects of liquid water on oxygen reactive transport processes are complicated as there are both positive and negative effect factors.
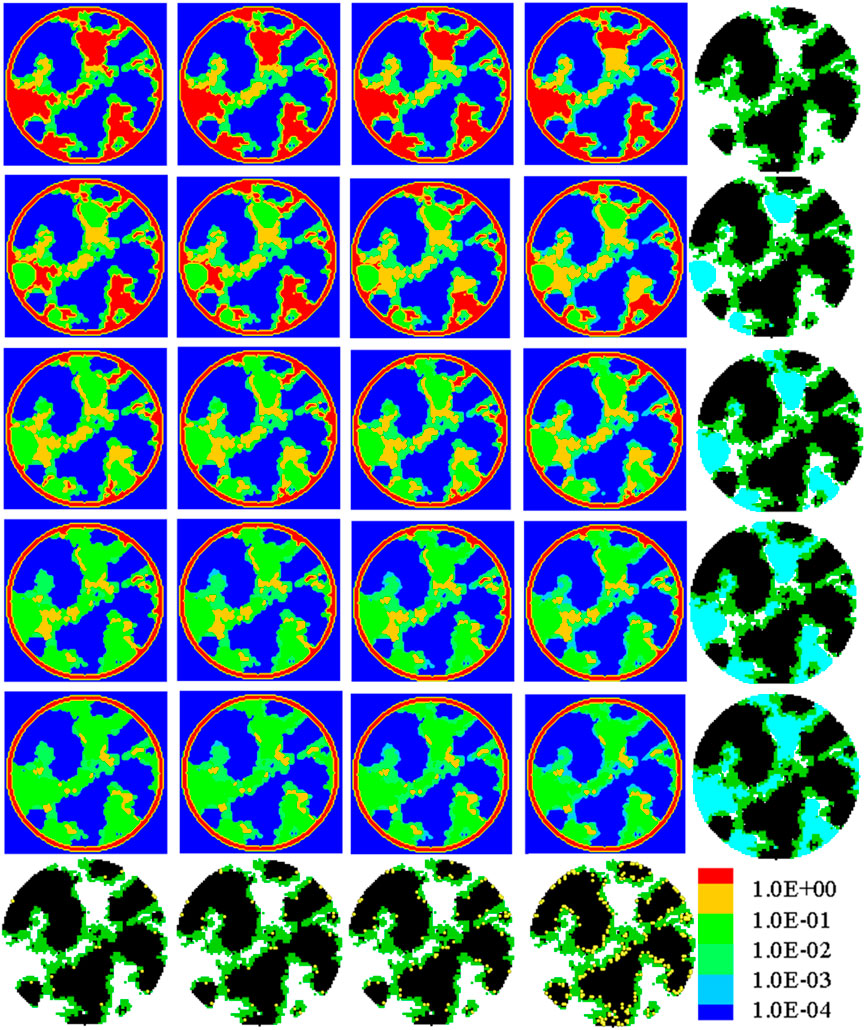
FIGURE 9. Oxygen concentration distribution in the nanoscale CL structures with θ = 120⁰ under a limiting current density. From left to right, the Pt loading is 0.025, 0.05, 0.1, and 0.4 mg cm-2, respectively. From top to bottom, the liquid water saturation is 0.0, 0.2, 0.4, 0.6, and 0.8, respectively. To more clearly illustrate the effects of liquid water, the last row shows the CL nanoscale structures free of liquid water with different Pt loadings, and the last column displays the distribution of liquid water in the nanoscale structures.
4.4 Effects of liquid water on the oxygen local transport resistance
To quantitatively explore the effects of liquid water on the CL performance under different Pt loadings with different saturations and wettabilities, local oxygen transport resistance Rlocal, as defined in Eq. 10, is further predicted based on the pore-scale oxygen concentration field obtained in Section 4.3, and the results are displayed in Figure 10. Note that in Figure 10, liquid water is not allowed to conduct protons, and thus, only Pt particles covered by the ionomer can be utilized. First, it can be seen that as Pt loading decreases, Rlocal increases especially after a Pt loading of 0.1 mg cm-2, consistent with the existing experimental results (Greszler et al., 2012; Owejan et al., 2013), where the local transport resistance increases significantly as Pt loading reduces below 0.1 mg cm-2. Such high Rlocal, which prevents the reduction of Pt loading, can be resolved by improving reactive transport processes in CLs by improving physicochemical properties and optimizing the nanoscale distributions of different constituents (Chen et al., 2020). Second, it can be found that as S increases, Rlocal also increases as expected as the existence of liquid water shows negative effects on oxygen transport processes under the circumstance that liquid water does not provide the pathway for protons. Third, the variation in Rlocal with S shows obvious discrepancy under different wetting conditions. Compared with the hydrophilic case, Rlocal for the hydrophobic case is not sensitive to S under relatively low S (for example, less than 0.6). This is because under relatively low S, the coverage rate of Pt particles by the liquid water is negligible for the hydrophobic case, and the blockage of the large pores does not reduce the oxygen flux significantly. In addition, in the hydrophilic case as S = 0.8, Rlocal is comparable with that of S = 1.0, while in the hydrophobic case, the discrepancy between S = 0.8 and S = 1.0 is still considerable. Finally, to more clearly illustrate the effects of liquid water, the variation in Rlocal with S and θ is normalized and compared with Rlocal under S = 0.0, as shown in Figure 10D. It can be clearly observed that, overall, a hydrophobic CL will lead to lower Rlocal, indicating better oxygen transport and thus cell performance, especially under relatively high S.
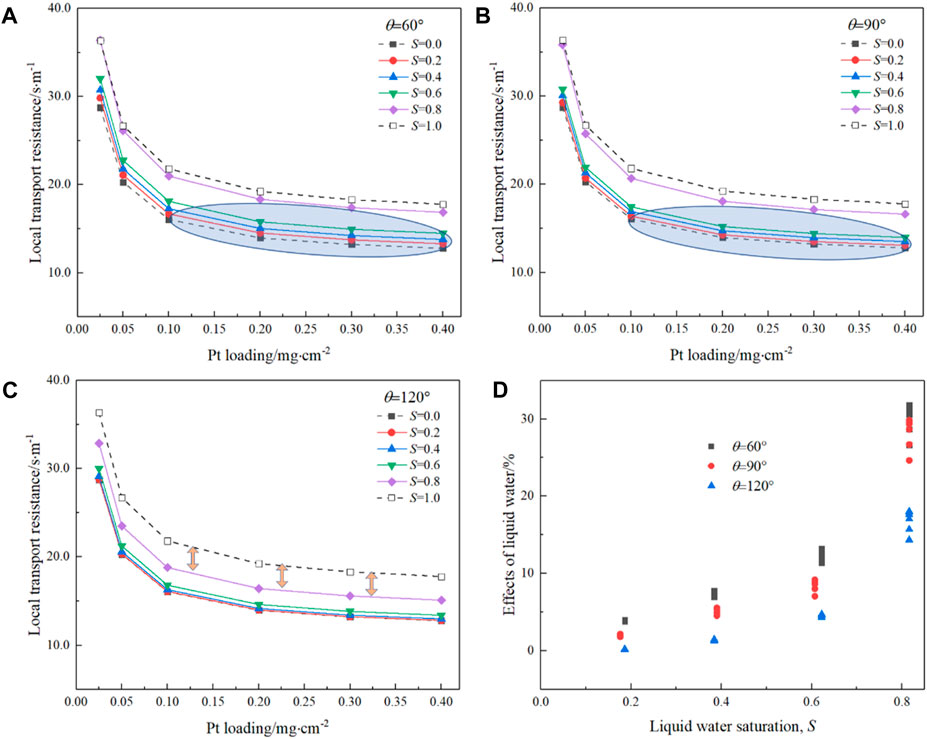
FIGURE 10. Effects of liquid water saturation and wettability on the local transport resistance inside CLs. (A) 60⁰, (B) 90⁰, and (C) 120⁰. (D) Normalized local transport resistance.
Finally, the circumstance that liquid water can conduct protons is explored. In the literature, it was found that in CLs with a low ionomer loading, the utilization of Pt particles inside the pores with a size less than 20 nm can be improved under high relative humidity, which was explained as the water adsorbed inside the CLs can provide the pathway for protons (Soboleva et al., 2011). In another study, it was reported that Pt particles inside the micropores with a size of 1–5 nm, which is too small for the ionomer to enter, can be utilized under a high relative humidity condition due to condensed water (Padgett et al., 2018). Therefore, in this section, three pore sizes are evaluated, namely, 6 nm, 10 nm, and 20 nm, which are called as the threshold pore size herein. Pt particles covered by water in these pores will be activated. Pore-scale modeling is implemented, and the local transport resistance is predicted, as plotted in Figure 11. As shown in Figure 11A, for the hydrophilic case, as the threshold size increases, indicating more Pt particles activated by the liquid water, Rlocal decreases, consistent with some experimental results that Rlocal will decrease as the relative humidity increases (or liquid water saturation increases generated by capillary condensation) (Soboleva et al., 2011). For the threshold pore size as 6 nm, Rlocal still increases as S increases. However, for the threshold pore size as 10 and 20 nm, Rlocal decreases as S increases. The aforementioned results are caused by combined positive effects of liquid water on activating the Pt particles and the negative effects of the liquid water film covered on the solid surface. Similar combined effects can also be observed in the hydrophobic case. The results here indicate that if the threshold pore size is lower than 6 nm, the existence of liquid water still has negative effects on the local transport processes. Considering the experimental results in Soboleva et al. (2011); Padgett et al. (2018), the aforementioned results indicate that the threshold pore size will be higher such as 10 nm, meaning more Pt particles can be activated in CLs by condensed liquid water by interesting mechanisms such as the water bridge (Weber and Kusoglu, 2014). We want to point out that the study in this paragraph is tentative, and more work at different scales is required for exploring the activation effects of liquid water.
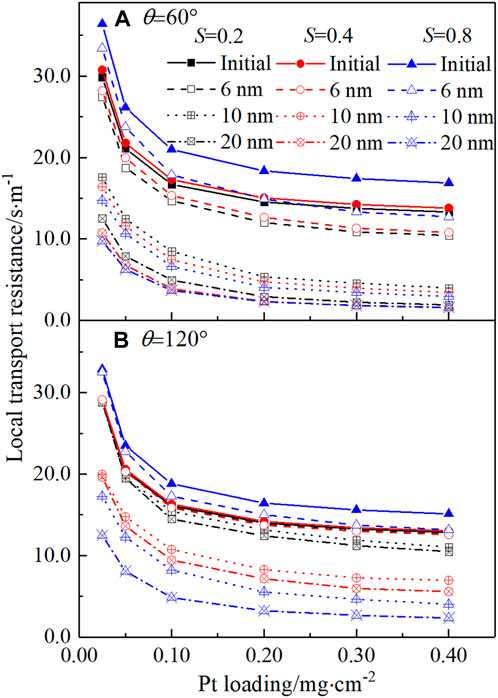
FIGURE 11. Local transport resistance under the circumstance that Pt particles covered by liquid water can be activated. (A) Hydrophilic case and (B) hydrophobic case.
5 Conclusion
A deep understanding of liquid water distributions inside CLs of PEMFC and their effects on reactive transport processes is important for improving cell performance. Although current experimental techniques still face difficulty in providing the nanoscale distribution details, pore-scale modeling directly based on the realistic porous structures serves as a powerful tool. In this study, pore-scale modeling is conducted to simulate liquid water distributions in nanoscale CL structures with different wettabilities. Then, oxygen reactive transport processes in CL with the existence of liquid water are explored by pore-scale modeling based on LBM, including oxygen diffusion in pores, dissolution at the pore–ionomer interface, transport inside the ionomers and liquid water, and electrochemical reactions at the active sites. Effects of liquid water on pore size distribution, ECSA, oxygen concentration distribution, and local transport resistance are explored. The main conclusions are as follows:
1) Liquid water tends to cover the solid surface as a film in the hydrophilic CL, which can increase the local transport path of oxygen before reaching the reactive Pt surface and can provide more reactive Pt sites if liquid water can produce protons, while it presents as droplets filling large pores first in hydrophobic structures.
2) PSD of the CL free of liquid water shows a double-peak feature, which, as liquid water saturation increases, is maintained in the hydrophilic structures; however, it vanishes in the hydrophobic structure.
3) Oxygen transport inside the CL undergoes remarkable drop across the pore–ionomer or pore–liquid interface. The oxygen concentration distribution is significantly affected by the existence of liquid water under different wettabilities. For the hydrophobic case, the oxygen local transport resistance does not change much under relatively low saturation, opposite to the changing trend in the hydrophilic structure.
4) If liquid water in CL micropores can conduct protons, Pt particles in pores filled with liquid water and with a pore size under a threshold value can be utilized, leading to increasing ECSA and reduced local transport resistance. It is found when the threshold value of the pore size is 10 nm, the local transport resistance decreases as the liquid water saturation increases from 0.2 to 0.8. Therefore, a further study of the proton conduction mechanism is highly suggested, which may provide the new optimization strategy.
Data availability statement
The raw data supporting the conclusion of this article will be made available by the authors, without undue reservation.
Author contributions
TM: conceptualization, data curation, formal analysis, funding acquisition, investigation, methodology, project administration, resources, validation, writing–original draft, and writing–review and editing. QZ: project administration and writing–review and editing.
Funding
The author(s) declare financial support was received for the research, authorship, and/or publication of this article. The authors thank the support of National Natural Science Foundation of China (51906187) and the China Postdoctoral Science Foundation, Grant Number 2019M653620.
Conflict of interest
The authors declare that the research was conducted in the absence of any commercial or financial relationships that could be construed as a potential conflict of interest.
Publisher’s note
All claims expressed in this article are solely those of the authors and do not necessarily represent those of their affiliated organizations, or those of the publisher, the editors, and the reviewers. Any product that may be evaluated in this article, or claim that may be made by its manufacturer, is not guaranteed or endorsed by the publisher.
References
Banham, D., et al. (2021). Ultralow platinum loading proton exchange membrane fuel cells: performance losses and solutions. J. Power Sources 490. doi:10.1016/j.jpowsour.2021.229515
Cetinbas, F. C., Ahluwalia, R. K., Kariuki, N., De Andrade, V., Fongalland, D., Smith, L., et al. (2017). Hybrid approach combining multiple characterization techniques and simulations for microstructural analysis of proton exchange membrane fuel cell electrodes. J. Power Sources 344, 62–73. doi:10.1016/j.jpowsour.2017.01.104
Chen, L., et al. (2020). Pore-scale study of pore-ionomer interfacial reactive transport processes in proton exchange membrane fuel cell catalyst layer. Chem. Eng. J. 391. doi:10.1016/j.cej.2019.123590
Chen, L., He, A., Zhao, J., Kang, Q., Li, Z. Y., Carmeliet, J., et al. (2022). Pore-scale modeling of complex transport phenomena in porous media. Prog. Energy Combust. Sci. 88, 100968. doi:10.1016/j.pecs.2021.100968
Chen, L., Kang, Q., Mu, Y., He, Y. L., and Tao, W. Q. (2014). A critical review of the pseudopotential multiphase lattice Boltzmann model: methods and applications. Int. J. Heat Mass Transf. 76, 210–236. doi:10.1016/j.ijheatmasstransfer.2014.04.032
Chen, L., Kang, Q. J., and Tao, W. Q. (2019). Pore-scale study of reactive transport processes in catalyst layer agglomerates of proton exchange membrane fuel cells. Electrochimica Acta 306, 454–465. doi:10.1016/j.electacta.2019.03.158
Chen, L., Kang, Q. J., and Tao, W. Q. (2021). Pore-scale numerical study of multiphase reactive transport processes in cathode catalyst layers of proton exchange membrane fuel cells. Int. J. Hydrogen Energy 46 (24), 13283–13297. doi:10.1016/j.ijhydene.2021.01.146
Chen, L., Wu, G., Holby, E. F., Zelenay, P., Tao, W. Q., and Kang, Q. (2015). Lattice Boltzmann pore-scale investigation of coupled physical-electrochemical processes in C/Pt and non-precious metal cathode catalyst layers in proton exchange membrane fuel cells. Electrochimica Acta 158, 175–186. doi:10.1016/j.electacta.2015.01.121
Chen, L., Zhang, R., He, P., Kang, Q., He, Y. L., and Tao, W. Q. (2018). Nanoscale simulation of local gas transport in catalyst layers of proton exchange membrane fuel cells. J. Power Sources 400, 114–125. doi:10.1016/j.jpowsour.2018.07.099
Fathi, H., Raoof, A., and Mansouri, S. H. (2017). Insights into the role of wettability in cathode catalyst layer of proton exchange membrane fuel cell; pore scale immiscible flow and transport processes. J. Power Sources 349, 57–67. doi:10.1016/j.jpowsour.2017.03.012
Greszler, T. A., Caulk, D., and Sinha, P. (2012). The impact of platinum loading on oxygen transport resistance. J. Electrochem. Soc. 159 (12), F831–F840. doi:10.1149/2.061212jes
Ito, K., Yamada, T., Shinohara, A., Takata, S. i., and Kawakita, Y. (2021). Dynamics of water in a catalyst layer of a fuel cell by quasielastic neutron scattering. J. Phys. Chem. C 125 (39), 21645–21652. doi:10.1021/acs.jpcc.1c06014
Jiao, K., and Li, X. G. (2011). Water transport in polymer electrolyte membrane fuel cells. Prog. Energy Combust. Sci. 37 (3), 221–291. doi:10.1016/j.pecs.2010.06.002
Jiao, K., Xuan, J., Du, Q., Bao, Z., Xie, B., Wang, B., et al. (2021). Designing the next generation of proton-exchange membrane fuel cells. Nature 595 (7867), 361–369. doi:10.1038/s41586-021-03482-7
Kaneko, T., et al. (2020). Relation between oxygen gas diffusivity and porous characteristics under capillary condensation of water in cathode catalyst layers of polymer electrolyte membrane fuel cells. Int. J. Heat Mass Transf. 150. doi:10.1016/j.ijheatmasstransfer.2019.119277
Kudo, K., Jinnouchi, R., and Morimoto, Y. (2016). Humidity and temperature dependences of oxygen transport resistance of nafion thin film on platinum electrode. Electrochimica Acta 209, 682–690. doi:10.1016/j.electacta.2016.04.023
Lange, K. J., Sui, P. C., and Djilali, N. (2011). Pore scale modeling of a proton exchange membrane fuel cell catalyst layer: effects of water vapor and temperature. J. Power Sources 196 (6), 3195–3203. doi:10.1016/j.jpowsour.2010.11.118
Lee, J., Escribano, S., Micoud, F., Gebel, G., Lyonnard, S., Porcar, L., et al. (2020). In situ measurement of ionomer water content and liquid water saturation in fuel cell catalyst layers by high-resolution small-angle neutron scattering. Acs Appl. Energy Mater. 3 (9), 8393–8401. doi:10.1021/acsaem.0c00853
Lopez-Haro, M., Guétaz, L., Printemps, T., Morin, A., Escribano, S., Jouneau, P. H., et al. (2014). Three-dimensional analysis of Nafion layers in fuel cell electrodes. Nat. Commun. 5, 5229. doi:10.1038/ncomms6229
Manke, I., Hartnig, C., Grünerbel, M., Lehnert, W., Kardjilov, N., Haibel, A., et al. (2007). Investigation of water evolution and transport in fuel cells with high resolution synchrotron x-ray radiography. Appl. Phys. Lett. 90 (17). doi:10.1063/1.2731440
Mu, Y. T., et al. (2021). Mesoscopic modeling impacts of liquid water saturation, and platinum distribution on gas transport resistances in a PEMFC catalyst layer. Electrochimica Acta, 388. doi:10.1016/j.electacta.2021.138659
Mu, Y.-T., Gu, Z. L., He, P., and Tao, W. Q. (2018). Lattice Boltzmann method for conjugated heat and mass transfer with general interfacial conditions. Phys. Rev. E 98 (4), 043309. doi:10.1103/physreve.98.043309
Orfanidi, A., Madkikar, P., El-Sayed, H. A., Harzer, G. S., Kratky, T., and Gasteiger, H. A. (2017). The key to high performance low Pt loaded electrodes. J. Electrochem. Soc. 164 (4), F418–F426. doi:10.1149/2.1621704jes
Owejan, J. P., Owejan, J. E., and Gu, W. B. (2013). Impact of platinum loading and catalyst layer structure on PEMFC performance. J. Electrochem. Soc. 160 (8), F824–F833. doi:10.1149/2.072308jes
Owejan, J. P., Trabold, T., Jacobson, D., Baker, D., Hussey, D., and Arif, M. (2006). In situ investigation of water transport in an operating PEM fuel cell using neutron radiography: Part 2 - transient water accumulation in an interdigitated cathode flow field. Int. J. Heat Mass Transf. 49 (25-26), 4721–4731. doi:10.1016/j.ijheatmasstransfer.2006.07.004
Padgett, E., Andrejevic, N., Liu, Z., Kongkanand, A., Gu, W., Moriyama, K., et al. (2018). Editors' choice—connecting fuel cell catalyst nanostructure and accessibility using quantitative cryo-STEM tomography. J. Electrochem. Soc. 165 (3), F173–F180. doi:10.1149/2.0541803jes
Ramaswamy, N., Kumaraguru, S., Koestner, R., Fuller, T., Gu, W., Kariuki, N., et al. (2021). Editors’ choice—ionomer side chain length and equivalent weight impact on high current density transport resistances in PEMFC cathodes. J. Electrochem. Soc. 168 (2), 024518. doi:10.1149/1945-7111/abe5eb
Siddique, N. A., and Liu, F. Q. (2010). Process based reconstruction and simulation of a three-dimensional fuel cell catalyst layer. Electrochimica Acta 55 (19), 5357–5366. doi:10.1016/j.electacta.2010.04.059
Soboleva, T., Malek, K., Xie, Z., Navessin, T., and Holdcroft, S. (2011). PEMFC catalyst layers: the role of micropores and mesopores on water sorption and fuel cell activity. Acs Appl. Mater. Interfaces 3 (6), 1827–1837. doi:10.1021/am200590w
Srouji, A. K., Zheng, L., Dross, R., Aaron, D., and Mench, M. (2017). The role of water management on the oxygen transport resistance in polymer electrolyte fuel cell with ultra-low precious metal loading. J. Power Sources 364, 92–100. doi:10.1016/j.jpowsour.2017.07.036
Sui, P. C., Zhu, X., and Djilali, N. (2019). Modeling of PEM fuel cell catalyst layers: status and outlook. Electrochem. Energy Rev. 2 (3), 428–466. doi:10.1007/s41918-019-00043-5
Wang, X. R., Ma, Y., Gao, J., Li, T., Jiang, G., and Sun, Z. (2021). Review on water management methods for proton exchange membrane fuel cells. Int. J. Hydrogen Energy 46 (22), 12206–12229. doi:10.1016/j.ijhydene.2020.06.211
Weber, A. Z., and Kusoglu, A. (2014). Unexplained transport resistances for low-loaded fuel-cell catalyst layers. J. Mater. Chem. A 2 (41), 17207–17211. doi:10.1039/c4ta02952f
Xiao, B. A., Zhao, J., Tu, Z., and Chan, S. H. (2021). Water distribution and performance variation in a transparent PEMFC with large active area. Int. J. Hydrogen Energy 46 (76), 38040–38050. doi:10.1016/j.ijhydene.2021.09.075
Xing, L., Liu, X., Alaje, T., Kumar, R., Mamlouk, M., and Scott, K. (2014). A two-phase flow and non-isothermal agglomerate model for a proton exchange membrane (PEM) fuel cell. Energy 73, 618–634. doi:10.1016/j.energy.2014.06.065
Zhang, R. Y., Min, T., Chen, L., Li, H., Yan, J., and Tao, W. Q. (2022). Pore-scale study of effects of relative humidity on reactive transport processes in catalyst layers in PEMFC. Appl. Energy 323, 119553. doi:10.1016/j.apenergy.2022.119553
Zhao, J. J., Huang, X., Tu, Z., and Chan, S. H. (2022). Water distribution and carbon corrosion under high current density in a proton exchange membrane fuel cell. Int. J. Energy Res. 46 (3), 3044–3056. doi:10.1002/er.7361
Zheng, W. B., Kang, J., Moriyama, K., and Kim, S. H. (2019). A multiscale decomposition method for pore-scale simulation of multiphase transport and reactions in cathode catalyst layers of proton exchange membrane fuel cells. J. Electrochem. Soc. 167 (1), 013509. doi:10.1149/2.0092001jes
Appendix
A1 Validation of the LB two-phase model
The LB two-phase flow model is validated by simulating a bubble located at the center of a periodic domain without gravity, leading to the dominant role of surface tension force. The size of the domain is 90*90*90. A series of simulations are conducted by setting bubbles with different initial radii, and after convergence, the pressure difference ΔP across the bubble interface is calculated and the final bubble radius r is measured. The relationship between ΔP and 1/r is plotted in Figure A1, which clearly displays a linear relationship with surface tension σ fitted as 0.381, indicating that the Laplace law is well-satisfied.
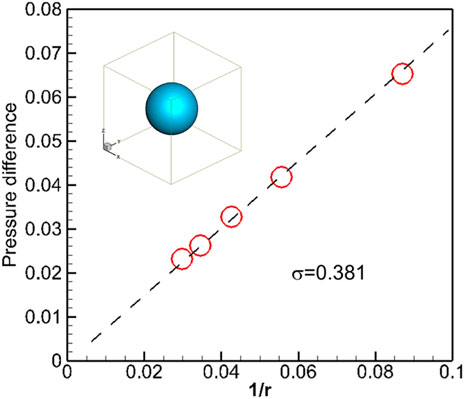
FIGURE A1. Relationship between ΔP and 1/r.
A2 Validation of the reactive transport model.
The LB reactive transport model is validated by simulating the mass transport across the phase interface with a chemical reaction, as shown in Figure A2. The phase interface is located at the center of the cubic domain with a size of L, with the left half as phase 1 and the right half as phase 2. The species diffuses in the left phase with a diffusivity of Dp = 4.0 × 10⁻⁶ m2 s-1, dissolved at the phase interface with the dissolution reaction rate constant as kdis, as described in Eq. 5, and then diffuses inside the right phase with diffusivity DN as 0.1Dp. Concentration boundary conditions are prescribed at the left and right boundaries as C0 = 1 and C1 = 0, respectively, while for the remaining four boundaries, periodic boundary conditions are employed. The aforementioned reactive transport process actually is a 1D problem with the following analytical solution:
where
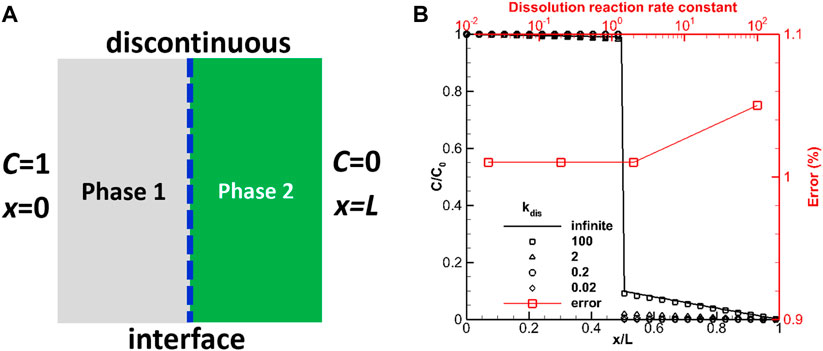
FIGURE A2. One-dimensional interface reactive transport processes. (A) Schematic representation of the reactive transport processes. (B) Comparison between numerical results and analytical solutions.
Keywords: catalyst layer, proton exchange membrane fuel cells, lattice Boltzmann method, local transport resistance, liquid water
Citation: Min T and Zhou Q (2023) Effects of liquid water on transport in the catalyst layer of proton exchange membrane fuel cells. Front. Energy Res. 11:1330124. doi: 10.3389/fenrg.2023.1330124
Received: 30 October 2023; Accepted: 13 November 2023;
Published: 04 December 2023.
Edited by:
Yulin Wang, Tianjin University of Commerce, ChinaReviewed by:
Ben Chen, Wuhan University of Technology, ChinaLei Zhang, China University of Petroleum, China
Liang Hao, Dalian University of Technology, China
Copyright © 2023 Min and Zhou. This is an open-access article distributed under the terms of the Creative Commons Attribution License (CC BY). The use, distribution or reproduction in other forums is permitted, provided the original author(s) and the copyright owner(s) are credited and that the original publication in this journal is cited, in accordance with accepted academic practice. No use, distribution or reproduction is permitted which does not comply with these terms.
*Correspondence: Ting Min, dGluZ19taW5AbWFpbC54anR1LmVkdS5jbg==