 Jackson G. White1
 Ravi Samikannu2,3*
 Moses Tunde Oladiran2
 Abid Yahya2
 Patricia Makepe2
 Gladys Gamariel2
 Nyagong Santino David Ladu4
 Bokang Agripa Tlhabologo2
 Maruliya Begam Kadarmydeen5
 Kanimozhi Gunasekaran6
 Lilian Amuhaya2
- 1The Pan African University of Water and Energy Sciences (PAUWES), Tlemcen, Algeria
- 2Botswana International University of Science and Technology, Palapye, Botswana
- 3Department of Electronics and Communication Engineering, Saveetha School of Engineering, Saveetha Institute of Medical and Technical Sciences, Saveetha University, Chennai, Tamil Nadu, India
- 4Rumbek University of Science and Technology, Rumbek, South Sudan
- 5Periyar Maniammai Institute of Science & Technology, Thanjavur, India
- 6Centre for Smart Grid Technologies, Vellore Institute of Technology, Chennai, India
Introduction: Liberia has a significant obstacle in terms of restricted power accessibility, as only 26.7% of its populace have access to electrical energy. To tackle this issue, there is a collaborative effort between the government and private sector to undertake energy projects aimed at enhancing the power supply of the grid. The purpose of this study is to evaluate the techno-economic feasibility and analyze the performance of a standalone biomass/solar photovoltaic (PV) hybrid energy system for a rural Liberian community that mostly relies on traditional biomass.
Methods: HOMER pro program was used to configure the system, model the community’s load over a year, and generate the resource data of the location.
Results and Discussion: Four different configurations were obtained and analyzed both technically and economically to determine the most feasible configuration. This study has shown that a hybrid configuration incorporating Biomass Gasifier, Solar PV, and Battery storage is more feasible with annual output power of 77104 kWh/yr, LCOE ($/kwh) of 0.29 and NPC ($) of 0.3979 million. If implemented with external funding, it will enhance the education, economic and socio-economic status of rural settlements. The results will serve as a valuable resource for informing choices on the implementation of the hybrid energy solution and guaranteeing its sustained efficacy within the community.
1 Introduction
As of 2020, Liberia had a population of approximately 5.058 million people, with only 26.7% having access to electricity. The remaining 73.3% of the population relies on unclean and crude sources for electricity production, such as charcoal or firewood for cooking and space heating. The transport sector in Liberia is entirely dependent on fossil fuels, including gasoline, diesel, and kerosene. In 2019, Liberia produced 0.4 TWh of electricity, with 99% coming from oil and the remaining 1% from solar energy sources (Our World in Data, 2021).
Studies have shown that the energy sector accounts for 67.5% of Liberia’s Green House Gas (GHG) emissions, followed by the agricultural sector at 31.9%, and other sectors comprising 0.6% (IRENA, 2020). This significant contribution of the energy sector to GHG emissions is because oil and traditional biomass account for approximately 99% of electricity production and 100% of primary energy consumption in the country (IRENA, 2020). If current trends in unsustainable energy and electricity consumption continue, emissions levels could exceed the Paris Agreement target (below 2°C) as the total population of Liberia is projected to reach approximately 10.3 million by 2058 (Jackson, 2021).
Climate change has already had adverse impacts on the environment, including droughts, increased concentration of GHGs, floods, inconsistent weather patterns, poor harvests due to extreme climatic conditions, and rising sea levels (WMO, 2021). In Liberia, environmental threats include disruption of the agricultural sector, degradation of living standards and income, and destruction of homes (UNDP, 2018). For instance, Liberia is at risk of losing the John F. Kennedy (JFK) Memorial Hospital and the Redemption Hospital due to sea encroachment (UNDP, 2018).
Unlike most previous studies on this topic, which concentrated mainly on the techno-economic feasibility assessment or the performance analysis of renewable energy hybrid energy systems, our study combines both the performance analysis and the techno-economic feasibility assessment of entirely renewable energy hybrid energy systems for a typical rural Liberian area, referred to in this study as “Own Your Own Community.” As a result, this research will also offer insightful information, supporting data, and technical resources that can serve as a benchmark for the sustainable implementation of the mini grids in Liberia’s rural areas as well as those of other communities with comparable energy resources, and geographic conditions.
The study will also analyze the hybrid system’s affordability and viability at various cost points, in addition to evaluating the possible socioeconomic and environmental effects of the system.
Through the development of a sustainable energy system, the study tackles the reduction of carbon emissions and cost-saving measures.
2 Literature review
In addition to the environmental impacts of unsustainable energy, economic activities are also greatly impacted by affordable access to energy rates and consumption. Countries with high modern energy access rates experience faster economic growth compared to countries with low energy consumption rates (Yeager et al., 2012). Studies project that the number of Liberians living on a little over one dollar per day could reach 52% in 2021, up from 44% in 2016 (ESI AFRICA, 2021). This situation may be due to low energy access, exacerbated by the COVID-19 pandemic. Electricity access stood at 21.5% in 2017, with a 5.2% increment in 2019, according to World Bank data (Ministry of Lands and Mines and Energy MLME, 2009; UNFCCC, 2015; Pachauri and Shonali, 2017a; Adams et al., 2018; RREA, 2018; WFP Liberia Country Programme, 2018; The Borgen Project, 2019a; World Bank, 2019a; World Bank, 2019b; IRENA, 2020a; World Bank, 2020a; Trading Economics, 2020; Energypedia, 2021, 2018; Maliro et al., 2022; Sankoh et al., 2022).
Access to energy and uninterrupted electricity supply is crucial for socio-political stability. Citizens in countries with high energy and electricity access rates tend to enjoy their rights to quality education, healthcare, comfortable homes, security, clean water, food security, and peaceful existence (Adams et al., 2018). However, these privileges are limited in Liberia. Living conditions are below acceptable levels compared to most other parts of the world. Liberia is one of the world’s Least Developed Nations (LDNs), with about 64% of the population living below the poverty line and about 1.3 million living in extreme poverty (RREA, 2018; Fortune Business Insights, 2020-2027; Nyagong Santino et al., 2022; MCC, 2018; Mohantya et al., 2018; Gildas Fosso et.al.,2023; Clint Ameri et.al.,2023; Mahdavi et al., 2023; Mulenga et al., 2023). Additionally, 3.7 million Liberians lack access to clean water; 80% are food-insecure; the child labor rate is 21%, compounded by many slum communities (Milbrant Anelia, 2009; Ministry of Lands and Mines and Energy MLME, 2009; Pachauri and Shonali, 2017b; Nations Encyclopedia, 2021; Samikannu et al., 2022; Ahmed et al., 2023; Mishra et al., 2023).
Despite these challenges, the government of Liberia (GoL), in collaboration with international partners, has made efforts to alleviate energy poverty and build the economy. In 2009, GoL crafted the National Energy Policy (NEP), a roadmap for economic and social development by delivering modern, dependable, affordable, and environmentally sustainable energy services (Kumar et al., 2023). Before 2009, Liberia ratified the United Nations Framework Convention on Climate Change (UNFCCC) and the Kyoto Protocol in 2002. GoL developed its National Adaptation Programme of Action which followed its Initial National Communication to the UNFCCC in 2012 (Leduchowicz et al., 2023; Agarwal et al., 2023; Renewables Liberia). , Liberia became a signatory to the Paris Climate Agreement, resulting in the development of the Intended Nationally Determined Contributions (INDC), finalized in 2015 (WFP Liberia Country Programme, 2018; UNFCCC, 2015; World Bank, 2019b; Hydropower Projects; SE4ALL. per cent of access to modern electricity in Liberia, 2013; Solar Panel Comparison Table, 2021; The Borgen Project, 2019b; USAID, 2016; Vourvoulias, 2021; Weather Spark, 2021; World Bank, 2020b). The increase in the population in Liberia and the importance of using the renewable energy resources for the replacement of fossil fuels like coal, oil and gas encourage the government to use the distributed energy system to feed the communities, urban area, and isolated population so that it can reduce the dependency on the electricity grid. The combination of the different renewable energy systems in the off-grid places can be considered to feed the different loads not supplied by the grid. The proposed system helps us to find the best model that can be used for the hybrid system for the off-grid systems. Different varieties of hybrid energy system models are analyzed in the paper. These achievements form the basis for developing a robust energy action plan, providing universal electricity access, creating climate adaptation and mitigation strategies, and creating sources of finance for sustainable development.
It is pertinent to review a few projects that are similar to the current study. An approach using HOMER software was utilized to size and optimize a hybrid solar PV, biogas generator, and battery system for the goal of rural electrification in a community in Mauritania (Our World in Data, 2021). The study’s findings demonstrated that the suggested solar-biogas hybrid system could handle the village’s load requirements (Our World in Data, 2021). The performance analysis of a standalone PV/WT/Biomass/Bat system in Alrashda Village, Egypt, was performed using four optimization algorithms: the Heap-based optimizer, Franklin’s and Coulomb’s algorithm, the Sooty Tern Optimization Algorithm, and the Grey Wolf Optimizer (IRENA, 2020). The outcomes reveal that the Heap-based optimizer achieved the most optimal results (IRENA, 2020). Utilizing renewable energy sources in the mix of electricity generation through hybrid systems significantly reduces carbon emissions, and in particular, a combination of photovoltaic/wind/hydroelectric hybrid systems is the most efficient combination in combating climate change (WMO, 2021). A case study of the Jamataka village, Botswana electrification project under SolaNetwork has shown that PV/wind/battery hybrid combination is a viable option in terms of Net Present Cost and emissions (Samikannu et al., 2022). An analysis of the feasibility and financial implications of implementing a hybrid energy system combining photovoltaic and biomass in rural areas of Bangladesh indicates that this kind of system is cheaper and more sustainable than conventional kerosene-based systems (Our World in Data, 2021). Heap-based optimizer, Franklin’s and Coulomb’s algorithm, the Sooty Tern Optimization Algorithm, and GreyWolf Optimizer were used in a performance analysis of a stand-alone PV/WT/Biomass/Battery system in Alrashda Village, Egypt, to find an optimally lower-cost system. The results indicate that, in comparison to the other algorithms, the Heap-based optimization is the most effective algorithm for minimizing costs (IRENA, 2020). A techno-economic evaluations of an island-independent hybrid energy system for Monpura Island, Bangladesh, was carried out using the HOWER Pro software. The findings demonstrated that the PV/biogas/wind hybrid system is more cost-effective, environmentally friendly, and has a smaller battery capacity than the prevailing PV/diesel mini-grid (Jackson, 2021).
3 Problem statement and case study location
Liberia, a country located on the west coast of Africa, spans an area of approximately 38,000 square miles and has an abundance of renewable energy resources, including biomass, solar, and large, high-speed rivers. However, Liberia relies heavily on petroleum products for energy and electricity production and consumption. Total primary energy demand is satisfied by the consumption of traditional, unsustainable biomass. Only 26.7% of the population has access to electricity, with about 95% located in Monrovia and the remaining 5% in rural areas. The absence of electricity and clean cooking technology in Southeastern Liberia contributes to poor education systems and healthcare, a stagnant economy, and respiratory and optical-related illnesses resulting from the burning of charcoal and firewood.
Despite these challenges, Southeastern Liberia has substantial biomass potential and receives enormous solar irradiation, making it an attractive location for renewable energy development. Coupling solar energy with a constant energy resource such as biomass can provide affordable, modern, dependable, and undisrupted power to the residents of Buchanan, Grand Bassa County. This paper investigates the feasibility of developing a hybrid renewable energy system (encompassing biodigester design and solar collector setup) in the Own Your Own community on the outskirts of Buchanan City to mitigate the deficiency in reliable electrical power for domestic and commercial use in the rural settlement. It is also to combat the sole dependency on non-renewable energy sources that will deplete and also cause pollution and contribute to the carbon footprint. The community contains seventy-six households, a public school, a market building, a church, and a community clinic. The average daily load for the estate is 165.44 kWh with a peak load of 14.95 kW during the year. Figure 1 shows the case study location as identified using the HOMER PRO Geolocation for precise modelling of the system.
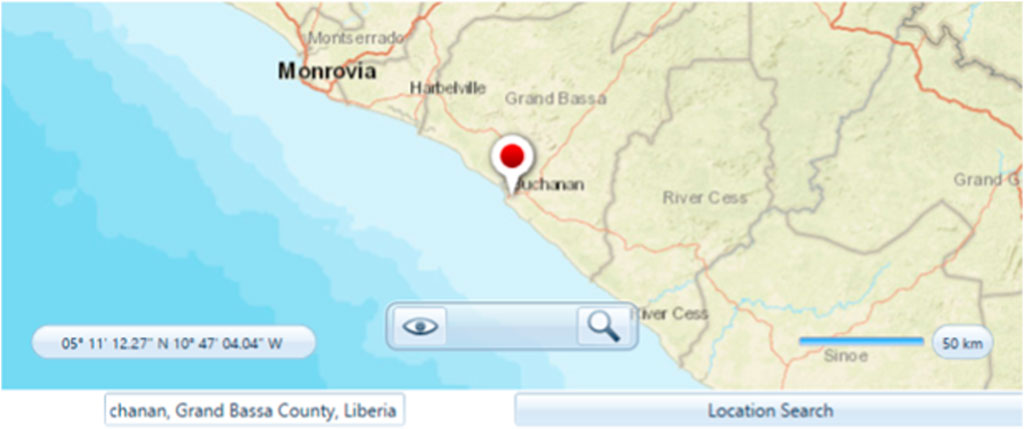
FIGURE 1. Case study location. Source: Homer pro geolocation.
To determine the daily load, the researchers performed an hourly load assessment and divided the load estimation into two periods: the dry (sunny) season, from October to March, and the rainy season, from April to September. These two seasons are the determining factors in the daily activities of the residents. The aggregate daily consumption for the dry season is 234,420.59 kWh/day and for the rainy season is 168,673.835 kWh/day.
3.1 Climatic conditions and solar energy potential
The case study and its proposed system setup are located at 5°, 53.2 min north latitude, and 10°, 1.8 min west longitude. The monthly solar irradiation for the case study, including the biomass resources data, are shown in Figure 2 and Figure 3. The peak temperature from February to May is 27.31°C.
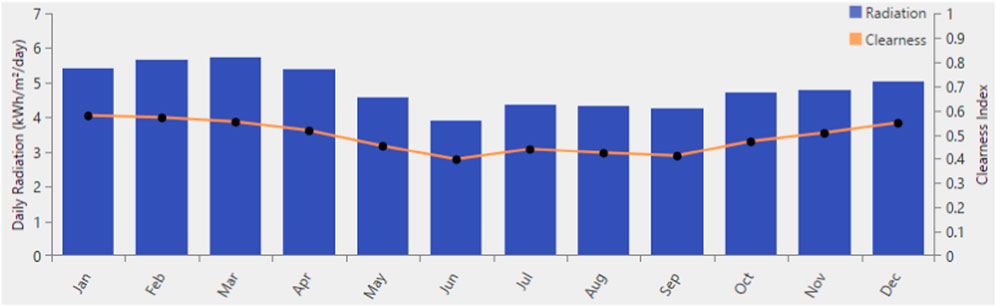
FIGURE 2. Average monthly solar irradiation trend in the case study area. Source: NASA Data, HOMER Pro.
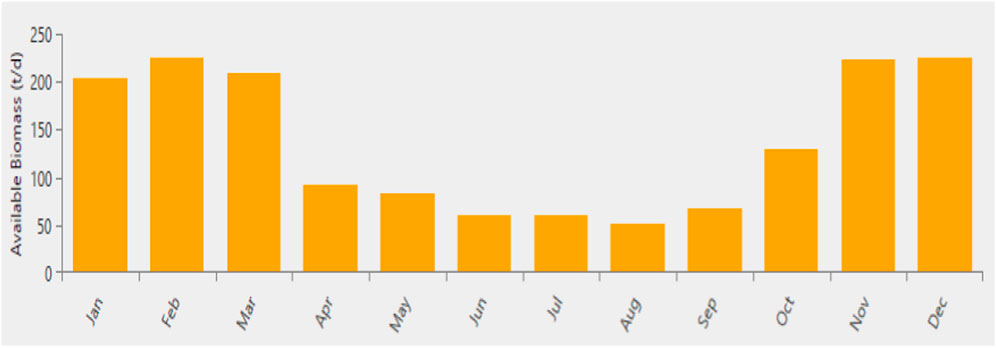
FIGURE 3. Average monthly biomass yield in the case study area; HOMER Pro data.
The highest solar irradiation for the research site occurs in March at 5.720 kWh/m2/day, with the annual average being a moderate 4.84 kWh/m2/day. The annual average clearness index is low, at approximately 44.5%. The moderate solar irradiation of the case study, coupled with its low clearness index, implies a low solar energy potential for the case study.
The annual average biomass resource for the case study is 136.17 t/d, with the highest values reported in February, November, and December at 225 t/d, 223 t/d, and 226 t/d, respectively, as shown in Figure 3. This information suggests that there is a significant potential for utilizing biomass as a renewable energy source in the case study area.
3.2 Methodology
This study is based on real life and simulation data. Data is collected to generate a profile pool of households in the rural settlements. This is used to generate electrical consumption estimates and power demand calculation. Homer Pro software is then used to simulate and model the system required to effectively supply this demand. Different model configurations will be simulated to figure out the more efficient, cost effective and less contaminant to the environment. It is important that when dealing with efficiency the study will take into consideration the Net Present Cost, Levelized Cost of Energy, and CO2 Emission reduction. Figure 4 presents the proposed system’s methodology flow chart.

FIGURE 4. Methodology flow chart of the proposed hybrid system.
4 Data collection survey and profiling
The findings highlight the prevailing socio-economic conditions at the case study site, including the electricity consumption patterns of households. For the first component of the survey, the questionnaire focused on the social relationship trends in the area.
Figure 5 reveals that Household No. 13, as reported by Respondent #13, has the highest number of residents, with 12 people, followed by Households No. 26 and No. 06, with 11 and 10 residents, respectively. In terms of energy needs, it can be expected that these households will demand more electricity and bear the significant costs associated with increased power consumption. On the other hand, four households reported having just one resident each; thirteen households reported hosting two residents each, while another thirteen revealed hosting three residents each. Similarly, households reporting such low figures should have significantly lower incurred energy costs compared to their counterparts with more residents.
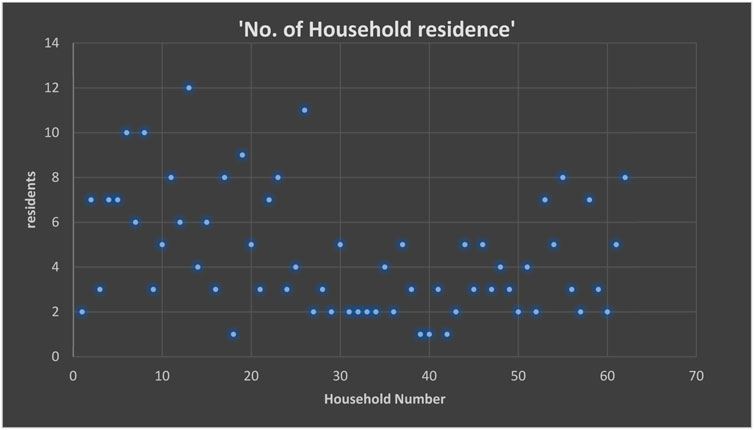
FIGURE 5. Per household distribution on residents in the case study area. Source: Researcher’s survey data.
To put this into perspective, the following assumptions are made:
Equal non-human load for all households, One mobile phone for every two residents, and One laptop computer for every four residents.
Given that the base rated power for a mobile phone is 5W and for a laptop is 60W, then the additional load for Household No. 13 becomes (1/2) * (12) * (5W) * (1 h) + (1/4) * (12) * (60W) * (1 h) = 390 Wh, and for Households No. 06 and No. 26, it becomes (1/2) * (10) * (5W) * (1 h) + (1/4) * (10) * (60W) * (1 h) = 325 Wh each. Based on these assumptions, a household with one resident has an additional null load. However, a household with two residents will incur an additional load of 65 Wh, and a household with three residents will incur an additional load of 97.5 Wh. Taking USD 0.03/Wh as the average cost of electricity, we can see the cost difference between these households.
Also captured under this category is the respondents’ gender profile. The total number of respondents is sixty-two, with females constituting approximately 53% of the total respondents. Table 1 summarizes the gender distribution in the case study area.

TABLE 1. Male to Female distribution in the case study area. Source: Researcher’s survey data.
The average age of the population is 34 years, indicating potential for industrial and economic growth.
4.1 Economic status
The key components of the analysis include the employment rate, total earnings for the case, and the distribution of liquid capital among residents. Table 2 shows the employment status as revealed by the respondents.
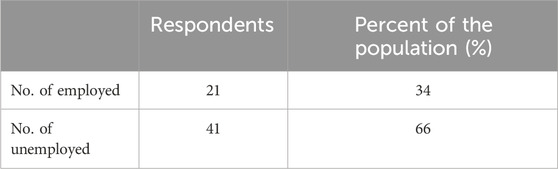
TABLE 2. Employment status in the case study area. Source: Researcher’s survey data.
The 66% unemployment rate in the case study is alarming, as people without jobs are vulnerable to poor living standards and insecurity. This high level of unemployment can also impair most residents’ ability to purchase electricity. Nevertheless, the average monthly earning for the employed portion of the population is LRD 55,857.14 (approximately USD 328.57). When spread across the entire population, this value drops to a mere LRD 900.92 (USD 5.30). Given that the average monthly cost of electricity is LRD 5,100.00 (USD 30.00), it becomes clear how challenging it must be for residents to access electricity. Nonetheless, increasing job opportunities for a young population could boost the region’s economy, improve living conditions, and enable residents to afford their energy needs. Generally, the rural areas have less population density and maximum the households suffer with low electrification rates. The rural household’s income depends on different activities like doing the farming, sales of agricultural products, plumping, contract jobs, government support etc., In line with the study’s survey estimates of daily household consumption by families, low-income households live on $2 or less per day, medium-income households on $2–$4 per day, and high-income households on $4 or more per day which is shown in Table 3.

TABLE 3. Household income status in the case study area. Source: Researcher’s survey data.
4.2 Electricity profile
The electricity profile includes the electricity access rate, average cost of electricity, and share of electricity by source (CDG for community diesel generator, CLL for Chinese led light, KL for kerosene lantern, PDG for personal diesel generator, and SP for solar panel). Table 4 shows levels of electricity access as observed during the survey and revealed by respondents.
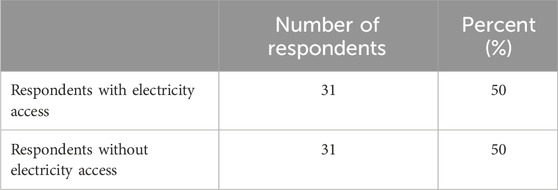
TABLE 4. Electricity access rate in the case study area. Source: Researcher’s survey data.
With only half of the population having access to electricity, the other half endures unbearable darkness and lives below standard conditions. However, introducing alternative modern energy sources could significantly reduce energy costs and eventually alleviate energy poverty in the region. A look at the share of electricity access from various sources reveals the following information reported in Table 5.
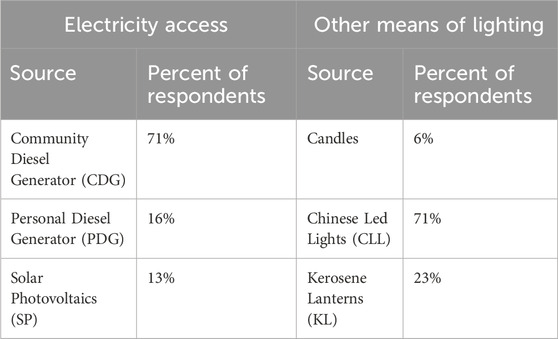
TABLE 5. Electricity and lighting sources.
Most residents rely on CDG for electricity, with only 13% getting power from SP systems. Those without access to electricity primarily depend on CLL for lighting at night, with only 6% relying on candles–a potentially dangerous source of light. Lastly, service centers such as schools, churches, and community clinics all lack access to electricity. As a result, these facilities provide limited services to residents, leading to slow personal growth, a stagnant economy, suppression of innovation, and increased poverty.
5 Sizing of components, and the HOMER simulations
Four simulations with varying combinations of components and resources were performed to determine the suitable power system for the case study. The four configurations and their respective components are as follows:
1. Configuration No. 01: Diesel generator (Base case)
2. Configuration No. 02: Diesel generator, Solar PV, and Storage.
3. Configuration No. 03: Diesel generator, Biomass Gasifier, Solar PV, and Storage.
4. Configuration No. 04: Biomass Gasifier, Solar PV, and Storage.
These simulations aimed to compare the net present costs, levelized costs, and technical performance of each system within the geographical and climatic context of the Own Your Own Housing Estate.
In each configuration, the penetration of solar PV and biomass determines the sizing of the resources. For instance, in the base case configuration, only a diesel generator is used, so its generation capacity is solely the generator. However, in configuration number two, solar PV is included in the mix, so some of the load demand is covered by the direct energy from the sun and the stored solar energy. Also, in configuration number 3 and configuration number 4, the different mix of the energy sources creates different technical and economic results as they both contributes to the energy share. All these variables contribute to the components being sized differently in each configuration in an effort to design an optimum system.
5.1 Solar PV details and cost
The chosen solar PV panel for the case study is a generic flat plate PV with a rated power of 24.2 kW. The solar panel has a lifetime of 25 years and does not include a tracking system with the derating factor of 80%. The efficiency of the system is 15% and the ground reflectance is 20%. This solar PV system costs 2500 USD, and the Operation and Maintenance (O&M) cost is 0.4% of the capital.
We computed the energy generated by the photovoltaic system by employing (Our World in Data, 2021).
Where
5.2 Batteries details and cost
Batteries are storage options that ensure a continuous power supply during periods of outages, including during the absence of renewable resources such as solar energy. The chosen battery for the case study is a generic 1 kWh Lead Acid battery (Kinetic battery model). A single model costs 300 USD, with the O&M cost being approximately 3.33% of the capital. The replacement cost is the same as the model cost (USD 300), and the battery has a lifespan of 10 years.
The array of batteries is recharged by the excess energy generated from renewable sources, and the battery provides the power defined by the equation (IRENA, 2020).
Where
The battery cell voltage,
5.3 Converter details and cost
The chosen converter for the system is an AC-DC converter with a rated capacity of 18.3 kW. The capital cost is USD 300, with no O&M cost. The converter has an efficiency of 95% and consists of an inverter and rectifier, with a lifespan of 15 years.
Solar converters are an essential component of solar energy systems to convert the direct current energy produced by solar resources and the electricity stored in batteries into a steady and reliable alternating current. The expression for the solar converter’s efficiency is (Jackson, 2021).
where
5.4 Biomass gasifier details and cost
The chosen biomass gasifier for the case study is a BioGen 100 kW Fixed Capacity Genset with an initial capital cost of USD 40000.00. The replacement cost is also USD 40000.00, and the O&M cost is USD 2.00 per operation hour. The lifetime of the BioGen set is 15,000.00 h, and its engine efficiency is 45%. The cost of the biofuel is equivalent to the price per kg of biomass, which is USD 0.84 per kg. Penalties for emitting GHGs into the atmosphere and environment are as follows: for CO2, it is USD 30 per ton according to international standards; for sulfur dioxide, it is USD 2.12; and for nitrogen dioxide, it is USD 15.10.
Thus, the overall efficiency of the biomass gasifier (
Where
5.5 System configurations No. 01: diesel generator (base case)
The first configuration (i.e., Configuration No. 1) of the operating system comprises only a diesel generator, as shown in Figure 6A. The generator size is 17.0 kW. The system’s LCOE is USD 0.54 per kWh, the total Net Present Cost (NPC) is USD 420,148.20, the Capital Expenditure (CAPEX) is USD 8500.00, and the Operating Expenditure (OPEX) is USD 31843.00. The diesel generator accounts for 100% of the annual electricity production which stands at 60,788 kWh/yr.
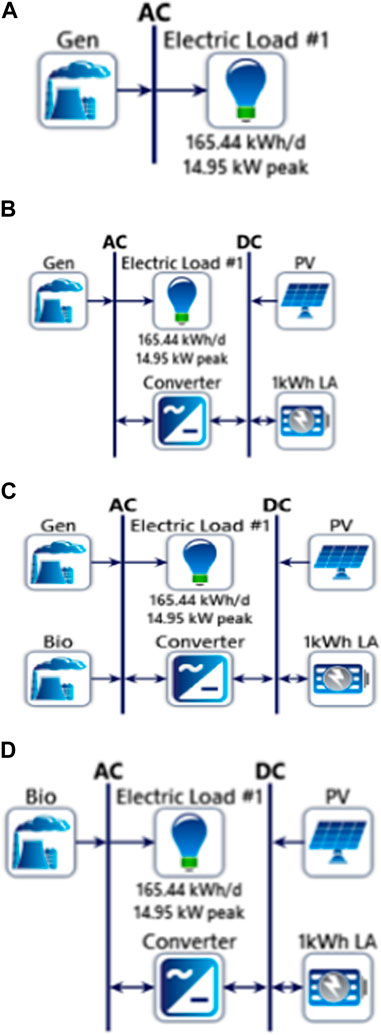
FIGURE 6. (A) Schematic diagrams of the proposed systems: No. 1 displays a diesel generator system. (B) Schematic diagrams of the proposed systems: No. 2 shows a system that combines a diesel generator, solar PV, and storage system. (C) Schematic diagrams of the proposed systems: No. 3 shows a system with a diesel generator, biomass gasifier, solar PV, and storage. (D) Schematic diagrams of the proposed systems: No. 4 includes a biomass gasifier, solar PV, and storage system. Source: HOMER Pro.
The proposed system in configuration No. 2 comprises a 17.0 kW diesel generator, a 23.7 kW generic flat-plate PV, an 18.3 kW system converter, and a Generic 1 kWh Lead Acid battery as a power storage option for instances of power outages and absences of solar energy resources. The storage system has a 12 V capacity, requiring thirty-nine strings of batteries to meet the backup demand. The total Net Present Cost (NPC) is USD 335435.30, and the LCOE is USD 0.46 per kWh. The CAPEX and OPEX are USD 75149 and USD 21681, respectively. Configuration No. 2 is shown in Figure 6B.
Proposed configuration No. 3, shown in Figure 6C, consists of a 17.0 kW diesel generator, a 200-kW generic biomass gasifier, a 23.7 kW generic flat plate PV with a 13.2 kW system converter, and a battery with a rated capacity of 1 kWh. The battery has one string in series and forty-one strings in parallel, with a voltage of 12 V. The system’s total NPC is USD 371274.20, and its LCOE is USD 0.48 per kWh of electricity. The CAPEX and OPEX are USD 83967.00 and USD 45263.00, respectively.
Configuration No. 4, shown in Figure 6D, utilizes a rated 100 kW BioGen Fixed Capacity gasifier along with a 24-kW capacity generic flat plate solar PV. The storage option is a 1 kWh generic lead acid battery containing eighty-one strings of batteries, and the converter is an 18.3 kW system converter consisting of an inverter and a rectifier. The system’s total NPC is USD 397953.50, with a LCOE of USD 0.51 per kWh of electricity. The CAPEX is USD 130411.00, while the OPEX is USD 20696.00.
6 Results validation and discussion
This section summarizes the results obtained for the different configurations of components for the case study. The discussions begin with the system’s electrical output for the various configurations, followed by the outputs and share of electricity production generated by each component. The total Net Present Costs (NPCs) and Levelized Costs of Energy (LCOEs) are also analyzed. This chapter highlights the cost contributions of each component to the capital cost, O&M cost, replacement cost, and salvage value. The economic viability of the different configurations is evaluated, and the best technology option is determined considering cost and other key sustainability variables.
6.1 Configuration No. 01: diesel generator
The system has been optimized for this configuration, with a diesel generator size of 17.0 kW. The diesel generator accounts for 100% of the annual electricity production, which amounts to 60,788 kWh/yr. The system’s total NPC is USD 420,148.20, with a CAPEX of USD 8,500.00 and an OPEX of USD 31,843.00. As the sole component, the diesel generator accounts for 100% of the system’s NPC. The mean electrical output, as well as the minimum and maximum outputs, are reported in Table 6. Figure 7 shows a cost summary for Configuration No. 01: Diesel Generator. As shown above, the resource (diesel fuel) accounts for the largest portion of the NPC at approximately 69.75%, followed by replacement costs at 14.68%.

TABLE 6. Diesel Generator technical characteristics. Source: HOMER Pro.
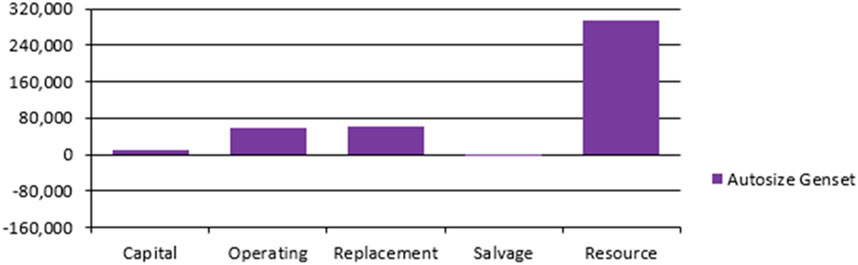
FIGURE 7. Costs summary for the Configuration No. 01: Diesel Generator. Source: HOMER Pro.
6.2 Configuration no. 02: diesel generator, solar PV, and storage (proposal 1)
The system employs a 17.0 kW diesel generator, a 7.30 kW solar PV array, twenty-three (23) strings of 1 kWh battery storage, and a 9.67 kW AC-DC converter system. The total annual electricity production for this configuration is 62,053 kWh/yr, with the solar PV system contributing just 12.4% of the annual electricity production and the diesel generator supplying the remainder. The 1 kWh lead-acid battery with a voltage of 12 V receives 4,378 kWh of electricity annually from the PV system, but its energy output is only 3,502 kWh/yr, resulting in a loss of 876 kWh/yr. The next four tables present summaries of the electrical characteristics of the various components. Table 7 depicts the desired system production summary for the Diesel Generator, Solar PV, and Storage. Figure 8 shows the system costs, which include CAPEX, OPEX, replacement costs, salvage value, and resource costs.
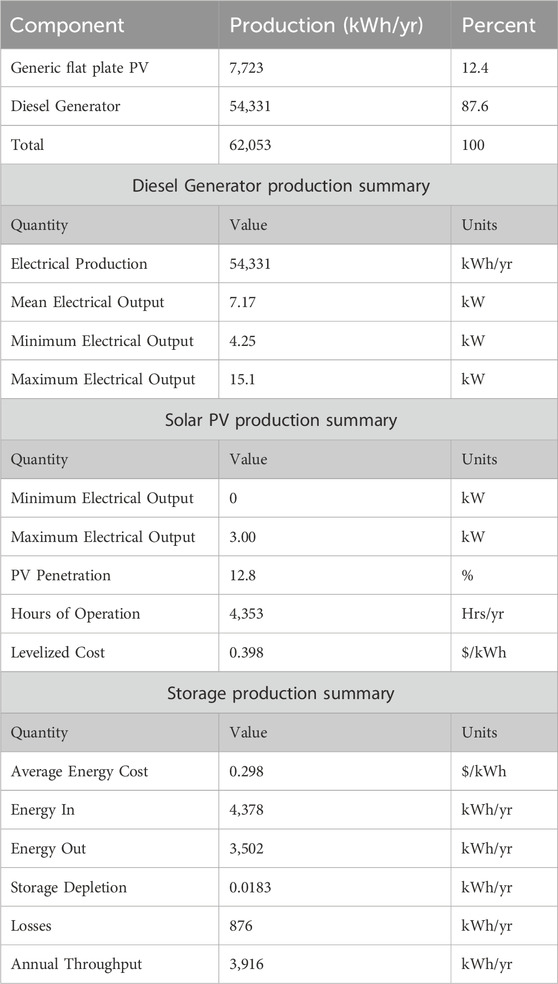
TABLE 7. Proposal 1 components technical characteristics Source: HOMER Pro.
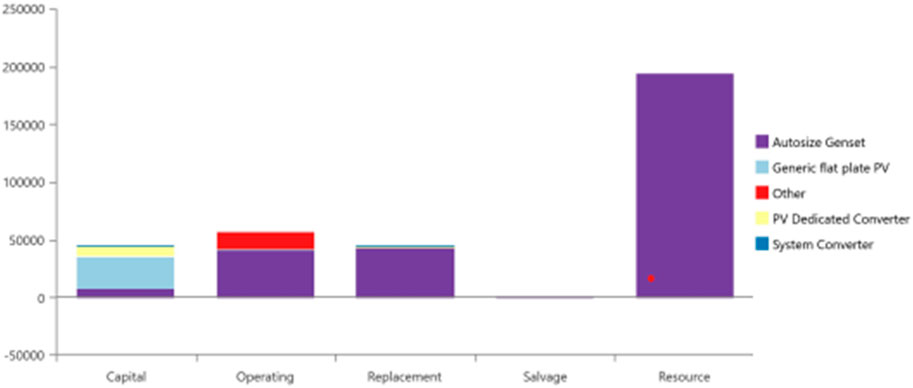
FIGURE 8. Proposal 1 costs summary. Source: HOMER Pro.
As shown, the resource for the diesel generator constitutes a significant portion of the system costs, accounting for 55.8% of the total cost and approximately 69.5% of the costs for operating the diesel generator. Additionally, the solar PV accounts for a large percentage of the CAPEX, with a value of USD 18,250.00, or approximately 42.3% of the CAPEX. The diesel generator dominates the OPEX and replacement costs, with values of USD 35,607.00 (66.8% of the OPEX) and USD 37,255.00 (71.40% of the replacement costs), respectively. Following the value of the replacement costs for the generator is the battery’s value of USD 11,114.00, which represents approximately 21.92% of the replacement costs. Hence, the annual cost of the diesel generator is the primary contributor to the high system costs for this configuration. However, a 50% government subsidy on the generator resource cost could result in a 27.9% reduction in annual system costs, saving approximately USD 92,224.57.
6.3 Configuration No. 03: diesel generator, biomass gasifier, solar PV, and storage (proposal 2)
This system comprises a 17.0 kW diesel generator, a 200-kW generic biomass gasifier, a 23.7 kW generic flat plate PV array with a 13.2 kW system converter, and forty-one strings of a 1 kWh lead-acid battery. The total annual electrical production for the system is presented in Table 8.
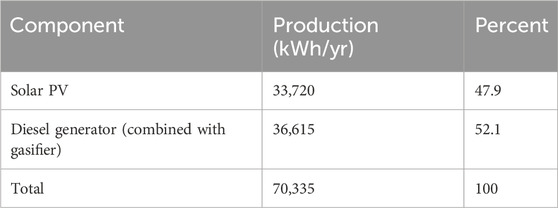
TABLE 8. Proposal 2 components’ technical characteristics. Source: HOMER Pro.
The system costs include CAPEX, OPEX replacement costs, salvage value, and resource costs. Figure 9 presents a cost summary for the configuration that includes a Diesel Generator, Biomass Gasifier, Solar PV, and Storage.
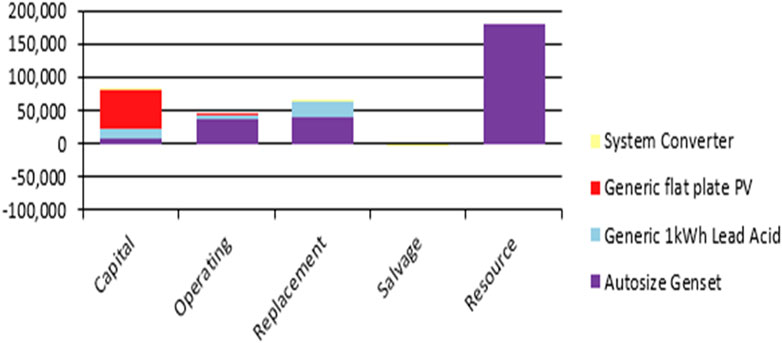
FIGURE 9. Proposal 2 costs summary. Source: HOMER Pro.
As in previous cases, the resource cost accounts for 68.6% of the diesel generator costs, with a value of USD 180,448. The solar PV contributes approximately 70.5% to the total capital costs, with a value of USD 83,967.00. On the other hand, the diesel generator dominates the system operating costs, with a value of USD 45,263.00, accounting for 81.5% of the total costs for this category. Once again, the diesel generator contributes significantly to the total annual system cost, representing approximately 70.8% of the overall system costs of USD 371,274.00.
6.4 Configuration No. 04: biomass gasifier, solar PV, and storage (proposal 3)
This system configuration includes a biomass gasifier with a fixed capacity of 100 kW for the biogas Genset, a set of solar PV panels, a system converter, and a lead-acid storage option. The technical characteristics of the components are presented in Table 9.
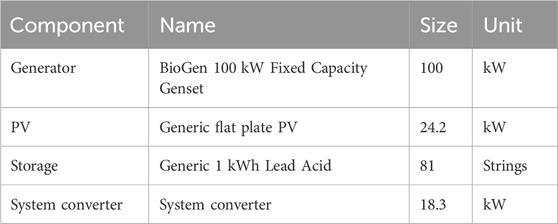
TABLE 9. Proposal 3 components technical characteristics. Source: HOMER pro.
The Biomass Gasifier and Solar PV together satisfy 100% of the load requirement, with the Solar PV accounting for 44.8% of the annual electrical production and the lead-acid battery supplying backup power. The total electrical production is 77,104 kWh/yr, with the AC primary load consuming 78.32% of this amount and an excess of 5,597 kWh/yr of electricity to spare. The production summary and consumption summary are reported in Table 10 and Table 11, respectively.
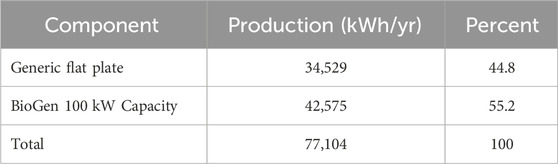
TABLE 10. Proposal 3 system’s energy production summary. Source: HOMER Pro.
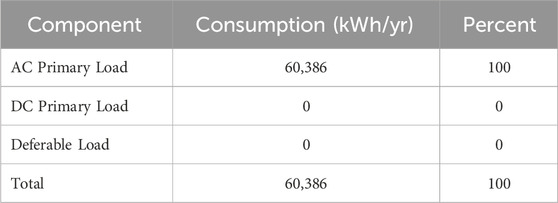
TABLE 11. Proposal 3 system’s consumption summary. Source: HOMER Pro.
Further reports on the Biogas Genset reveal that it has a fuel consumption of 22.2 tons/yr, which is a low fuel consumption rate of 0.365 kg/kWh. The statistics for the biogas genset show that it operates for 1,703 h/yr, with a capacity factor of 4.86 and a marginal cost of USD 0.0302/kWh. The CO2 emissions are a mere 3.45 kg/yr, down from a high of 17.7 kg/yr reported for the base case, representing an 80.5% reduction in annual greenhouse gas emissions. Table 12 details the technical characteristics and emission values for this configuration.
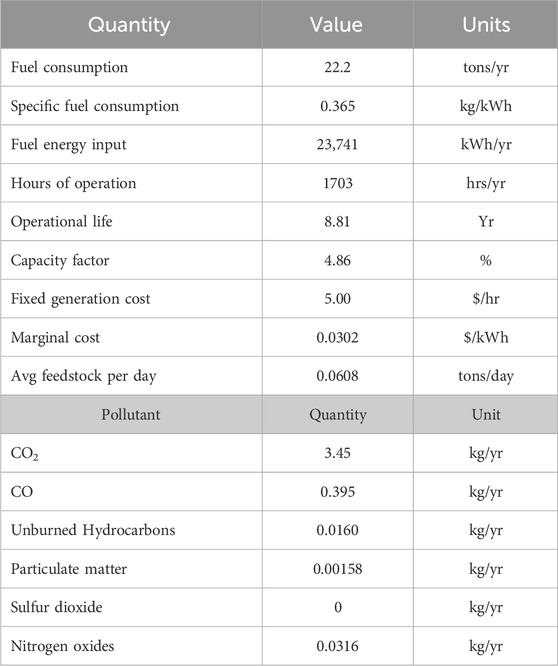
TABLE 12. Proposal 3 Components Technical Characteristics along with system’s emissions details. Source: HOMER Pro.
The system costs include several components: CAPEX, OPEX replacement costs, salvage value, and resource costs. The following chart shows the contributions of each cost component to the overall cost, as presented in Figure 10.
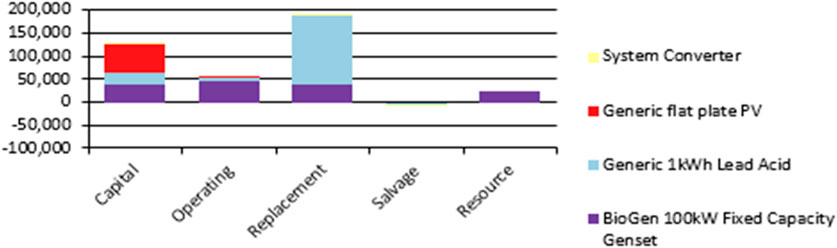
FIGURE 10. Proposal 3 costs summary. Source: HOMER Pro.
Configuration No. 04 contributes approximately 6.02% to the overall system costs. Although solar radiation energy is free, there are costs associated with biomass resources, such as land costs, feedstock prices, and labor costs. Solar PV dominates the system CAPEX, contributing 46.49% (USD 60,624.00), followed by the BioGen 100 kW Fixed Capacity Genset with approximately 30.67% (USD 40,000.00). In the OPEX category, the BioGen 100 kW Fixed Capacity Genset accounts for 76.39% of the OPEX (USD 44,031.00) of the total. For replacement costs, the lead-acid battery dominates with a value of USD 149,736.00, representing 78.45% of the total. As expected, the BioGen 100 kW genset is the only contributor to resource costs, with a value of USD 23,964.00. Finally, despite contributing the highest amount in a single category, the lead-acid battery tops the list as the highest contributor to overall system costs, accounting for approximately 45.63% of the annual total, followed by the BioGen 100 kW Fixed Capacity Genset at 36.50%. This result is expected because batteries have a short 2-year lifespan compared to the solar PV’s 25-year lifespan and the BioGen Genset’s 8.81-year lifespan, resulting in ever-compounding replacement costs and maintenance fees.
In further comparison of the Configuration No. 4 to a similar system which is purely renewable based, the Jamataka village electrification project in Botswana (also a Sub-Saharan location) is selected which uses the Solar/Wind/Battery configuration. In comparing the two, the LCOE ($/kwh) of both is at 0.29 and 0.298 respectively as illustrated in Table 13. For both systems the NPC ($) stands at 0.3979M for the Configuration No. 4 and 0.3398M for the Jamataka configuration. Since Configuration No. 4 produces 77,104 kWh/yr, whereas the Jamataka produces 3,124 kWh/yr. This difference in annual power supply accounts for the significantly high NPC of proposal 3 as it is meant to supply a higher power demand.
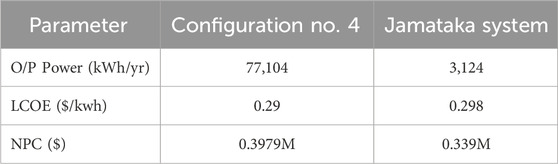
TABLE 13. Configuration 4 compared to Jamataka system.
Also in similarity, proposal 3 being Configuration No. 4 and the Jamataka system both have proven significant role in ability to electrify the rural settlements. Implementation of the proposed system will give households access to sustainable and reliable power to enhance their socio-economic activities including their small-scale businesses such as welding, and hair salons, only to mention a few. As such, the livelihood of the people is improved, and their individual and community integrity is boosted. Readily available electricity also improves the education sector as it gives learners access to advanced technological enhanced learning materials and also enables them to study for extended hours even into the nighttime. More similarly to the project in comparison, government, and external funders’ input in implementation of the proposed system will significantly reduce the costs that remain with customers who connect to the system as most expensive implementation components will be taken care of via the funds.
Table 14 shows the comparison between proposed system configuration arrangement results with the existing systems. From the comparison, the proposed Configuration No4 was chosen because it has the potential to be more cost-effective than the alternatives at 0.29 $/kwh LCOE and NPC $0.3979M at output power of 77,104 kWh/year. Furthermore, it is free of carbon emissions, and enables provision of rural electrification and empowerment of rural population.
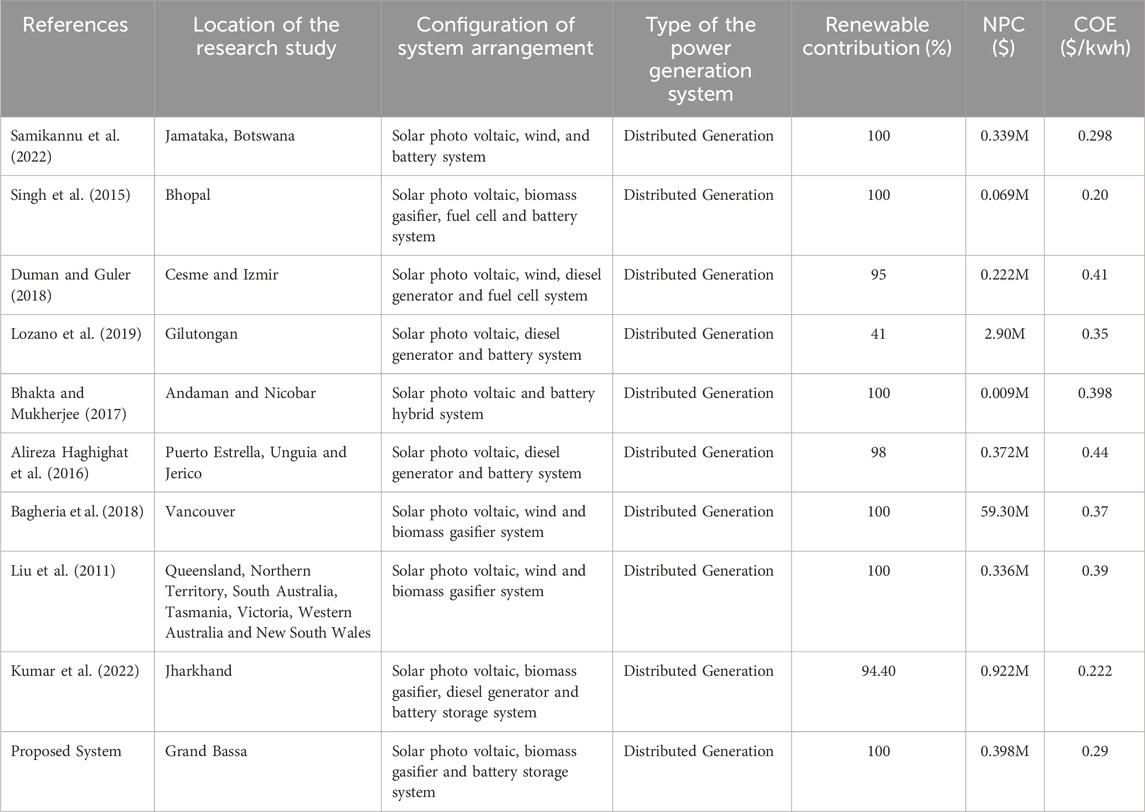
TABLE 14. Proposed system configuration arrangement results with the existing systems.
7 Conclusion
This paper aims to design a sustainable hybrid energy system for the off-grid community of Own Your Own Housing Estate. The estate comprises seventy-six (76) households, a primary public school, a church, a community clinic, and a marketplace. Four configurations comprising various proposed systems were simulated to determine the most suitable hybrid energy system for the case study. A techno-economic analysis was performed, followed by a discussion of the survey results for the case study, to compare each system and choose the most suitable power system based on the residents’ economic and social characteristics. HOMER Pro Software was used to design and set optimization parameters for the four (4) proposed configurations. The system design considered each component’s techno-economic characteristics, including load demands, climatic characteristics of the case study site, and component costs. The load requirements accounted for the seventy-six households within the case study boundaries, as well as the primary school, church, community clinic, and marketplace. The load assessment also covered both climatic periods: the Dry Season and the Rainy Season. The average daily load is 165.44 kWh, with a peak value of 14.95 kW. Comparisons among the seven configurations reveal that the configurations with the lowest Levelized Cost of Electricity (LCOE) (a value showing how much a kWh of electricity costs) are Configuration No. 02 with USD 0.46/kWh, Configuration No. 03 with USD 0.48/kWh, and Configuration No. 04 with USD 0.29/kWh. However, Configuration No. 02 has an associated emission value of CO2 at 37,139 kg/yr, followed by Configuration No. 03 with 36,538 kg/yr of CO2 emissions. Compared to these two configurations, Configuration No. 04 yields a 99.99% reduction in annual CO2 emissions.
Therefore, considering the narrow price gap between Configurations No. 02 and No. 04 and Configuration No. 04 alone, Configuration No. 04 - comprising a biomass gasifier (100 kW fixed capacity biogas Genset), a set of solar PV panels (24.2 kW), a system converter (18 kW), and a lead-acid storage option (81 strings)—is technically the best energy system option for the case study with Sustainable Development Goal 7 (SDG7) in mind. However, considering the residents’ economic status and the need for low-cost electricity, Configuration No. 02 (with the lowest LCOE) is the best energy system option. Even still, with just a 5% decrease in its NPC, Configuration No. 04 could become more affordable than its competitors. Additionally, an increase in employment rates among residents can improve their ability to afford power from Configuration No. 04. The optimization techniques and different combinations of renewable energy can be used for the further development of the research.
Data availability statement
The raw data supporting the conclusion of this article will be made available by the authors, without undue reservation.
Author contributions
JW: Methodology, Software, Validation, Visualization, Writing–original draft, Conceptualization, Data curation, Investigation. RS: Conceptualization, Formal Analysis, Funding acquisition, Supervision, Validation, Visualization, Writing–original draft. MO: Funding acquisition, Investigation, Methodology, Project administration, Supervision, Visualization, Writing–review and editing. AY: Investigation, Methodology, Supervision, Validation, Visualization, Writing–review and editing. PM: Formal Analysis, Investigation, Project administration, Supervision, Validation, Visualization, Writing–review and editing. GG: Conceptualization, Data curation, Formal Analysis, Project administration, Resources, Supervision, Validation, Writing–review and editing. NL: Data curation, Investigation, Methodology, Resources, Validation, Visualization, Writing–review and editing. BT: Conceptualization, Formal Analysis, Resources, Validation, Visualization, Writing–review and editing. MK: Formal Analysis, Methodology, Resources, Validation, Visualization, Writing–review and editing. GK: Formal Analysis, Methodology, Resources, Validation, Visualization, Writing–review and editing. LL: Writing–review and editing.
Funding
The author(s) declare financial support was received for the research, authorship, and/or publication of this article. The authors acknowledge Botswana International University of Science and Technology, Palapye, Botswana and SolaNetwork Project, which was funded through the “Innovate UK: Energy Catalyst Round 6: Transforming Energy Access Fund” (Grant reference number: 105280) for supporting the research.
Acknowledgments
The authors would like to express sincere gratitude to The Pan African University Institute of Water and Energy Sciences (including Climate Change), Algeria for their support in this research.
Conflict of interest
The authors declare that the research was conducted in the absence of any commercial or financial relationships that could be construed as a potential conflict of interest.
Publisher’s note
All claims expressed in this article are solely those of the authors and do not necessarily represent those of their affiliated organizations, or those of the publisher, the editors and the reviewers. Any product that may be evaluated in this article, or claim that may be made by its manufacturer, is not guaranteed or endorsed by the publisher.
References
Adams, B., Lea-Langton, A., and Ross, W. (2018). Chapter 8 - biomass conversion technologies. ScienceDirect, 107–139. doi:10.1016/B978-0-08-101036-5.00008-2
Agarwal, U., Singh Rathore, N., Jain, N., Sharma, P., Bansal, R. C., Chouhan, M., et al. (2023). Adaptable pathway to net zero carbon: a case study for Techno-Economic & Environmental assessment of Rooftop Solar PV System. Energy Rep. 9, 3482–3492. doi:10.1016/j.egyr.2023.02.030
Ahmed, E. E. E., Demirci, A., and Mirza Tercan, S. (2023). Optimal sizing and techno-enviro-economic feasibility assessment of solar tracker-based hybrid energy systems for rural electrification in Sudan. Renew. Energy 205, 1057–1070. doi:10.1016/j.renene.2023.02.022
Alireza Haghighat, M., Sebastian Alberto, A. E., Najafi, B., Alec, S., and Rinaldi, F. (2016). Techno-economic feasibility of photovoltaic, wind, diesel and hybrid electrification systems for off-grid rural electrification in Colombia. Renew. Energy 97, 293–305. doi:10.1016/j.renene.2016.05.086
Bagheria, M., Shirzadib, N., Kennedya, E. B. C. A., and Kennedy, C. A. (2018). Optimal planning of hybrid renewable energy infrastructure for urban sustainability: green Vancouver. Renew. Sustain. Energy Rev. 95, 254–264. doi:10.1016/j.rser.2018.07.037
Bhakta, S., and Mukherjee, V. (2017). Performance indices evaluation and techno economic analysis of photovoltaic power plant for the application of isolated India’s island. Sustain. Energy Technol. Assessments 20, 9–24. doi:10.1016/j.seta.2017.02.002
Clint Ameri, W. N., Kohol´e, Y. W., Fodoup Cyrille, V. F., and Tchuen, G. (2023). Techno-economic analysis and optimal sizing of a battery-based and hydrogen-based standalone photovoltaic/wind hybrid system for rural electrification in Cameroon based on meta-heuristic techniques. Energy Convers. Manag. 48, 116794.
Duman, A. C., and Guler, O. (2018). Techno economic analysis of off-grid PV/wind/fuel cell hybrid system combinations with a comparison of regularly and seasonally occupied households. Sustain. cities Soc. 42, 107–126. doi:10.1016/j.scs.2018.06.029
Energypedia 2021 (2018). Liberia energy situation. Country profile. Monrovia: Energypedia. Sierra Leone, West Africa, https://energypedia.info/wiki/Liberia_Energy_Situation.
ESI AFRICA (2021). World Bank projects to boost energy access and economy in Liberia, Improved energy access to stimulate economic growth. https://www.esi-africa.com/industry-sectors/generation/world-bank-projects-to-boost-energy-access-and-economy-in-liberia/.
Fortune Business Insights (2020-2027). Bioenergy market size, share & COVID-19 impact analysis, by product type, by feedstock, by application, and regional forecast. Market Research https://www.fortunebusinessinsights.com/bioenergy-market-103296.
Gildas Fosso, T., Pascalin, T. K., and Lenine Djanna Koffi, R. (2023). Techno-economic investigation of an environmentally friendly small-scale solar tracker-based PV/wind/Battery hybrid system for off-grid rural electrification in the mount bamboutos, Cameroon. Energy Strategy Rev. 48, 101107. doi:10.1016/j.esr.2023.101107
Hydropower Projects Hydropower/diesel grid for lofa (RREA/World Bank). http://www.renewables-liberia.info/index.php/projects-new/project-plants/134-plans-for-lofa-hydropower-and-diesel-powered-grid-rrea-world-bank.
IRENA (2020a). Energy profile Liberia, sustainable development goal 7: energy indicators (2017). https://www.irena.org/publications/2020/May/Tracking-SDG7-The-Energy-Progress-Report-2020.
IRENA (2020). Energy profile Liberia, total primary energy supply (2017). https://www.irena.org/-/media/Files/IRENA/Agency/Statistics/Statistical_Profiles/Africa/Liberia_Africa_RE_SP.pdf.
Jackson, G. (2021). White feasibility of solid biomass-solar hybrid standalone system using HOMER pro: Grand Bassa. Pan- African University Institute for Water and Energy Sciences Including Climate Change. Algeria, North Africa, Bassa, Liberia http://repository.pauwes-cop.net/bitstream/handle/1/468/MEE05%20MT%20Final%20Copy_Jackson%20G.%20White.pdf?sequence=1&isAllowed=y.
Kumar, N., Namrata, K., and Samadhiya, A. (2023). Techno socio-economic analysis and stratified assessment of hybrid renewable energy systems for electrification of rural community. Sustain. Energy Technol. Assessments 55, 102950. doi:10.1016/j.seta.2022.102950
Kumar, P., Pal, N., and Sharma, H. (2022). Optimization and techno-economic analysis of a solar photo-voltaic/biomass/diesel/battery hybrid off-grid power generation system for rural remote electrification in eastern India. Energy 247, 123560. doi:10.1016/j.energy.2022.123560
Leduchowicz, M., Domenech, B., Ferrer-Marti, L., Udaeta, M. E. M., and Gimenes, A. L. V. (2023). Women, equality, and energy access: emerging lessons for last-mile rural electrification in Brazil. Energy Res. Soc. Sci. 102, 103181. doi:10.1016/j.erss.2023.103181
Liu, G., Rasul, M. G., Amanullah, M. T. O., and Khan, M. M. K., Feasibility study of stand-alone PV-wind-biomass hybrid energy system in Australia”, IEEE Proceedings of the 2011 Asia-Pacific power and energy engineering conference, pp.1-6, Wuhan, China, 2011.
Lozano, L., Querikiol, E. M., Abundo, M. L. S., and Bellotindos, L. M. (2019). Techno-economic analysis of a cost-effective power generation system for off-grid island communities: a case study of Gilutongan Island, Cordova, Cebu, Philippines. Renew. Energy 140, 905–911. doi:10.1016/j.renene.2019.03.124
Mahdavi, M., Jurado, F., Verdú Ramos, R. A., and Augustine, A. (2023). Hybrid biomass, solar and wind electricity generation in rural areas of Fez-Meknes region in Morocco considering water consumption of animals and anaerobic digester. Appl. Energy 343, 121253. doi:10.1016/j.apenergy.2023.121253
Maliro, P., Diarra, B., and Samikannu, R. (2022). Technical and economic feasibility assessment for a solar PV mini-grid for Matekenya village. Cogent Eng. 9, 1–17. 2110707. doi:10.1080/23311916.2022.2110707
MCC (2018).Increasing access to electricity in Liberia, the mount coffee hydropower plant. Project report. Liberia Electricity Corporation. Monrovia: Millennium City Challenge. Monrovia, Liberia, https://www.mcc.gov/blog/entry/blog-072318-success-of-mount-coffee-hydropower-plant-helps-liberia.
Milbrant Anelia (2009). Assessment of biomass resources in Liberia. Technical NREL/TP-6A2-44808 https://www.nrel.gov/docs/fy09osti/44808.pdf.
Ministry of Lands, Mines and Energy (MLME) (2009). National energy policy, an agenda for action and economic and social development. GoL research. Ministry of lands, Mines and energy. Monrovia, Liberia: MLME. https://www.moci.gov.lr/doc/National%20Energy%20Policy%202009.pdf.
Mishra, S., Saini, G., Chauhan, A., Upadhyay, S., and Balakrishnan, D. (2023). Optimal sizing and assessment of grid-tied hybrid renewable energy system for electrification of rural site. Renew. Energy Focus 44, 259–276. doi:10.1016/j.ref.2022.12.009
Mohantya, A., Raya, P. K., Viswavandya, M., Mohanty, S., and Mohanty, P. P. (2018). Experimental analysis of a standalone solar photo voltaic cell for improved power quality. Optik - Int. J. Light Electron Opt. 171, 876–885. doi:10.1016/j.ijleo.2018.06.139
Mulenga, E., Kabanshi, A., Henry, M., Ndiaye, M., Nyirenda, E., and Mulenga, K. (2023). Techno-economic analysis of off-grid PV-Diesel power generation system for rural electrification: a case study of Chilubi district in Zambia. Renew. Energy 203, 601–611. doi:10.1016/j.renene.2022.12.112
Nations Encyclopedia (2021). Liberia climate. https://www.nationsencyclopedia.com/.
Nyagong Santino, D. L., Samikannu, R., Kahsu Gebrehans Gebreslassie, , Sankoh, M., Edward Rufas, L., and Badawi Omer, A. A., “Feasibility study of a standalone hybrid energy system to supply electricity to a rural community in South Sudan”, Scientific African, 16, 1157, 2022, doi:10.1016/j.sciaf.2022.e01157
Our World in Data (2021). Liberia: energy country profile, electricity production by source, Liberia. https://ourworldindata.org/energy/country/liberia.
Pachauri, N. D. R., and Shonali, (2017a). Energy access and living standards: some observations on current trends. Environ. Res. Lett. IV 12, 1–2.
Pachauri, N. D. R., and Shonali, (2017b). Energy access and living standards: some observations on latest trends. Environ. Res. Lett. IV 12, 1–2. doi:10.1088/1748-9326/aa5b0d
Renewables Liberia Hydropower potential in Liberia renewable energy strategy and masterplan. https://www.renewables-liberia.info/index.php/technologies/logo-editing.
RREA (2018). Total charcoal consumption (NACUL 2010 Report). Web report. Monrovia: Energypedia. Monrovia, Liberia, https://energypedia.info/wiki/Liberia_Energy_Situation.
Samikannu, R., Moses Tunde, O., Gamariel, G., Makepe, P., Keisang, K., and Nyagong Santino, D. L. (2022). An assessment and design of a distributed hybrid energy system for rural electrification: the case for Jamataka village, Botswana. Int. Trans. Electr. Energy Syst. 2022, 1–12. Article ID 4841241. doi:10.1155/2022/4841241
Sankoh, M., Diarra, B., and Samikannu, R.Nyagong Santino David Ladu (2022). Techno-economic feasibility analysis of a solar photovoltaic hybrid system for rural electrification in Sierra Leone for zero carbon emission. Int. Trans. Electr. Energy Syst. Special issue Zero carbon energy Syst. 2022, 1–14. Article ID 6349229. doi:10.1155/2022/6349229
SE4ALL per cent of access to modern electricity in Liberia (2013). Monrovia: sustainable energy for all. pdf report https://www.se4all-africa.org/fileadmin/uploads/se4all/Documents/Country_RAGAs/Liberia_RAGA_EN_Released.pdf.
Singh, A., Baredar, P., and Gupta, B. (2015). Computational simulation & optimization of a solar, fuel cell and biomass hybrid energy system using HOMER pro software. Procedia Eng. 127, 743–750. doi:10.1016/j.proeng.2015.11.408
Solar Panel Comparison Table (2021). The most electricity for the best price? http://sroeco.com/solar/most-efficient-solar-panels.
The Borgen Project (2019a). Living conditions in Liberia, News Report. Tacoma, WA, USA: The Borgen Project. https://borgenproject.org/tag/living-conditions-in-liberia/.
The Borgen Project (2019b). Living conditions in Liberia. News report. Tacoma, WA. Tacoma, WA, USA: The Borgen Project. Online Newsletter. 29 June 2021 https://borgenproject.org/tag/living-conditions-in-liberia/.
Trading Economics (2020). Liberia GDP annual growth rate, summary. https://tradingeconomics.com/liberia/gdp-growth-annual (Accessed June 29, 2021).
UNDP (2018). Building effective climate governance in Liberia, what risks does climate change pose to the people, economy, and security of Liberia? https://www.adaptation-undp.org/building-effective-climate-governance-liberia.
Unfccc (2015). Liberia first NDC - UNFCCC. San Francisco, CA, USA: UNFCCC. Public doc https://www4.unfccc.int/sites/ndcstaging/PublishedDocuments/Liberia%20First/INDC%20Final%20Submission%20Sept%2030%202015%20Liberia.pdf.
USAID (2016). Power africa in liberia, liberia energy sector overview: pa targets (2030 & 2050). blog report. Washington DC, USA: Liberia Fact Sheet.
Vourvoulias, A. (2021). How efficient are solar panels in the UK? What types of solar panels are most efficient? Blog. London, UK: GreenMatch. https://www.greenmatch.co.uk/blog/2014/11/how-efficient-are-solar-panels#:∼:text=While%20solar%20panel%20efficiency%20is,is%20measured%20under%20laboratory%20conditions.
Weather Spark (2021). Average weather in Monrovia, Liberia, wind, average wind speed. Blog post. Monrovia: weather Spark. https://weatherspark.com/y/31914/Average-Weather-in-Monrovia-Liberia-Year-Round.
Wfp Liberia Country Programme (2018). Country assessment. Room. World Food Programme. Rome, Italy, https://www.wfp.org/operations/200395-liberia-country-programme-2013-2018.
WMO (2021). State of the global climate change 20220, climate change indicators and impacts worsened in 2020. https://library.wmo.int/doc_num.php?explnum_id=11178.
World Bank (2019a). Access to electricity (% of the population)-Liberia. https://data.worldbank.org/indicator/EG.ELC.ACCS.ZS?loEGcations=LR.
World Bank (2019b). Access to electricity (% of the population)-Liberia. Chart data. Glasgow, UK: World Bank. https://data.worldbank.org/indicator/EG.ELC.ACCS.ZS?locations=LR.
World Bank, 2020a. Global Outlook of Liberia (2020). Public doc. World Bank Group. Glasgow, UK, www.pubdocs.worldbank.org>liberia(mpo-lbr.pdf.
World Bank, 2020b. Global Outlook of Liberia (2020), World Bank. Glasgow, UK. https://www.pubdocs.worldbank.org>liberia(mpo-lbr.pdf).
Yeager, K., Dayo, F., Fisher, B., Fouquet, R., Gila, A., and Rogner, H.-H. (2012). “Chapter 6 – energy and economy,” in Global energy assessment – toward a sustainable future (Cambridge, UK: Cambridge University Press), 385–422. and New York, NY, USA, and the International Institute for Applied Systems Analysis, Laxenburg, Austria https://www.cambridge.org/core/books/abs/global-energy-assessment/energy-and-economy/F90873793AC027510D352B1253C8B287.
Keywords: electricity, biomass, solar photo voltaic, mini grid, gasifier, battery, standalone system
Citation: White JG, Samikannu R, Oladiran MT, Yahya A, Makepe P, Gamariel G, Ladu NSD, Tlhabologo BA, Kadarmydeen MB, Gunasekaran K and Amuhaya L (2024) Techno-economic feasibility assessment and performance analysis of standalone solar photo voltaic-biomass hybrid system with optimized storage: a case study—Grand Bassa, Liberia. Front. Energy Res. 12:1326558. doi: 10.3389/fenrg.2024.1326558
Received: 23 October 2023; Accepted: 16 January 2024;
Published: 13 March 2024.
Edited by:
Jianwen Zhang, Shanghai Jiao Tong University, ChinaReviewed by:
Mobi Mathew, Rajiv Gandhi Institute of Petroleum Technology, IndiaAgnimitra Biswas, National Institute of Technology, India
Copyright © 2024 White, Samikannu, Oladiran, Yahya, Makepe, Gamariel, Ladu, Tlhabologo, Kadarmydeen, Gunasekaran and Amuhaya. This is an open-access article distributed under the terms of the Creative Commons Attribution License (CC BY). The use, distribution or reproduction in other forums is permitted, provided the original author(s) and the copyright owner(s) are credited and that the original publication in this journal is cited, in accordance with accepted academic practice. No use, distribution or reproduction is permitted which does not comply with these terms.
*Correspondence: Ravi Samikannu, cmF2aXNAYml1c3QuYWMuYnc=