 Xuankai Cheng
 Dong Wang1
 Renwei Ji
- 1Shanghai Merchant Ship Design and Research Institute, Shanghai, China
- 2School of Naval Architecture and Ocean Engineering, Jiangsu University of Science and Technology, Zhenjiang, China
The new regulations on ship energy efficiency proposed by the International Maritime Organization have had a significant impact on the shipping and shipbuilding industries. Improving the speed performance of ships was an effective approach to meet the requirements of energy conservation and emission reduction, reduce ship energy consumption and operating costs, and strengthen the market competitiveness of the ship enterprises. One method to improve ship speed performance was by mainly reducing the ship’s resistance. The main aim was to optimize the principal dimensions and hull lines of ships. Taking the research and development of a ship as an example, the application of the fully parametric optimization method in the optimization of ship hull lines was described in detail. The parent ship was selected from the ship database, which has excellent speed performance. The parent ship was simply transformed to meet the requirements of the target ship. The traditional optimization method was used to optimize the hull lines to reduce the hull resistance as much as possible, and a hull line with the best resistance performance was obtained. Based on the initial hull lines that met the requirements, the fully parametric model of the hull was established, and the fully parametric optimization method was used to optimize the hull with the best resistance performance. Experiments were carried out in the towing tank, and the resistance results of the two types of ships were found. The simulation of computational fluid dynamics (CFD) and model test had good consistency, and it was found that the hull lines optimized by the fully parameterization method had better performance than those optimized by the traditional method. The fully parametric hull line optimization method was effective in optimizing hull lines, and it could also reduce the excessive dependence of research personnel on the parent ship and design experience.
1 Introduction
The purpose of hull line optimization was to improve the speed performance of ships, which means getting a hull form with low resistance and high propulsion efficiency. Based on the excellent parent ship, the traditional optimization method was used to optimize and modify the target ship’s lines to meet the specification requirements through the methods of experience design and model tests.
The traditional hull optimization process was as follows: the first step was to get the geometry. In the database, there were a large number of ships with perfect speed performance. A similar ship was chosen as the parent ship for further optimization. The similar ship must meet the following three requirements: 1) the parameters of the ship, such as Lpp/B, B/T, and CB, must approximate to those of the target ship. 2) The ship must be tested in the towing tank, and test results must be obtained. 3) The speed performance of the parent hull must be perfect. This means that the residuary resistance coefficient (Cr) must be very low, and the propulsion efficiency must be very high. In addition, in NAPA systems, the parent ship was changed to the target ship, called the initial lines. The second step was to optimize and modify the target ship’s lines through several optimization methods in the optimization process, such as displacement distribution optimization, bulbous bow optimization, stern optimization, optimization of the fore-body and aft-body, and transom height optimization. When the fore-body was optimized, the wave resistance was focused. When the aft-body was optimized, the viscous resistance and propulsion efficiency were paid attention to. The last and most important step was to check the speed performance of the final ship using commercial software STARCCM+. The traditional optimization method was often characterized by low efficiency, and it was difficult to achieve the best speed performance. However, this kind of optimization method is the mainstream design method at present.
Scholars have conducted a lot of research work on global hull optimization.
Harries (1998); Harries et al. (2004); Harries et al. (2001); Valdenazzi et al., (2002) used the Lackenby method to optimize the hull lines using the scientific optimization algorithm, taking resistance and seakeeping performance as the objective functions for the first time in 1998. The optimization of hull lines achieved good performance in the engineering design. Markov and Suzuki (2001) used the B-spline patch to complete the global hull deformation, and a scientific optimization algorithm was used to optimize the hull lines with wave-making resistance coefficient as the objective function, and good results were obtained. Based on NURBS surfaces, Campana et al. (2016); Campana et al. (2009); Campana et al. (2006); Campana et al. (2015); Diez et al. (2017); Leotardi et al. (2015); Peri and Campana (2003); Peri and Campana (2003); Valorani et al. (2003) optimized many engineering ships using the scientific optimization algorithm, taking wave-making resistance and seakeeping as objective functions. In the model tests, good results were achieved. Grigoropoulos. (2004) optimized the peak value of the RAO curve and vertical acceleration in the wave using the S-T-F method and three-dimensional potential flow method, adopting an evolutionary algorithm, and taking seakeeping performance as the objective function. Huang etal. (2014); Huang etal. (2015); Kim et al. (2017); Kim et al. (2010); Wang et al. (2014); Yang and Huang (2016) proposed the translation method to change the longitudinal displacement distribution of the ship and the RBF method to accurately control the local deformation of the ship. Optimization was carried out on the DTMB 5415, KCS, and 5,279 ship models as well as S60 using the artificial ant colony algorithm, taking wave-making resistance as the objective function.
Based on a pure car and truck carrier, Chen et al. (2012) adopted the traditional optimization method to change the hull lines and finally obtained an optimized hull line using the scientific optimization algorithm, taking wave resistance as the objective function. A corresponding model test indicates that an approximately 2% reduction in total resistance can be achieved for the optimized lines in comparison with the prototype. QIAN et al. (2012) adopted the Lackenby transform method to reach the purpose of global hull deformation. The total resistance of the final optimization hull line was reduced by 9.42% using a combination of traditional and intelligent optimization algorithms. Based on the operation profile, Yi and Chen (2018) conducted research to optimize the resistance of a 2500 TEU container vessel under multiple operating conditions using a scientific optimization algorithm, taking total resistance as the objective function, and finally obtained design hull lines with excellent speed performance.
Scholars also used this theory to optimize parts of the hull.
Through the BEZIER PATCH methods, Peri et al. (2001) completed the optimization of the bulbous bow of an oil tanker using various traditional optimization algorithms, taking the total resistance as the objective function. The hull lines were optimized and verified by a model test. The resistance was reduced by approximately 3%. Tahara and Kobayashi, (2013); Tahara et al. (2008); Tahara and Tohyama, (2001) optimized the bow profile of a high-speed ship using the free deformation method, adopting a multi-objective genetic algorithm with hydrodynamic performance as the objective function. In the model tests, it was found that the hydrodynamic performance of the optimized ship was better than that of the parent ship. Compana et al. (2006) optimized the bulbous bow of the naval vessels by applying the NURBS modeling technology, using the scientific optimization algorithm, and taking the total resistance as the objective function with the help of the computational fluid dynamics (CFD) solution. The optimization effect was very good. Hochkirch and Bertram (2009) built the bulbous bow model in Friendship software and carried out optimization with eleven characteristic variables using a science optimization algorithm and taking the resistance as the objective function. The final resistance was reduced by 2.5% compared to that of the parent hull. According to the sensibility analysis of the objective function, Han et al. (2012) selected the proper characteristic variables for the full parametric model of the fore-body of the LNG ship. The science optimization algorithm was adopted to take the total resistance as the objective function. The final optimization reduced the total resistance by 5.7% at the scantling draught. Tampier and Salas (2014) optimized the bulbous bow of a ship in actual sailing conditions using the scientific optimization algorithm, taking calm water resistance and wave resistance as the objective functions, and applying OpenFOAM software. Based on the parameter model with four characteristic variables, Chrismianto and Kim, 2014; Kim et al. (2010) optimized the bulbous bow of a container vessel using commercial CFX software, taking the total resistance coefficient as the objective function. The results showed that the performance of the optimized bulbous bow was very good at all speeds.
Shan et al. (2017); Wang et al. (2014) took a medium-sized cruise ship as an example to carry out local optimization of its bulbous bow. The parametric method was applied to achieve bulbous bow deformation, and a scientific optimization algorithm was adopted to obtain a bulbous bow scheme with good resistance performance by taking wave-making resistance and total resistance as objective functions. Finally, the model test for the optimized lines was carried out in a towing tank at CSSRC, and the model test results showed that the optimized lines exhibited good resistance performance. Chao Wang et al. (2022) adopted the shape transformation method to transform the bulbous bow area of an inland container ship using the scientific optimization algorithm and taking wave-making resistance as the objective function. The optimized wave-making resistance of the hull was decreased significantly, and the total resistance was also decreased.
To address the shortcomings of the traditional optimization method, a fully parametric method was introduced. First, a full-parametric model, which was under the control of characteristic variables, was established. Under the constraints of wet surface area, volume, center of buoyancy, and others, the resistance or self-propulsion simulations were carried out by CFD using scientific optimization algorithms such as the exhaustive search method and uniform random sequence search method. Finally, the hull lines with the best speed performance were automatically optimized.
In this paper, the research and development of a ship were taken as examples. First, the hull line with excellent speed performance was selected as the parent ship in the database, and the initial hull line that met the requirements of the new main dimensions was obtained after transformation. Then, the traditional optimization method was applied to fully optimize the hull line, reduce the hull resistance as much as possible, and obtain the hull line with the best resistance performance. Next, based on the initial hull line obtained from the parent ship, a full-parametric hull model was established, and important characteristic variables were set. Taking the ship resistance performance as the objective function, the hull line with the best resistance performance was obtained using the scientific optimization algorithm. Finally, the model tests were carried out in the towing tank to verify the difference in the resistance performance of the two types of vessels, which verifies the optimization design of the fully parametric model.
2 Main dimensions of the ship
Based on a ship, this paper studied the effects of the traditional optimization method and fully parametric optimization method on hull resistance performance. The scale ratio of the ship model was 1/27.328, and the main dimensions of the ship model are shown in Table 1.
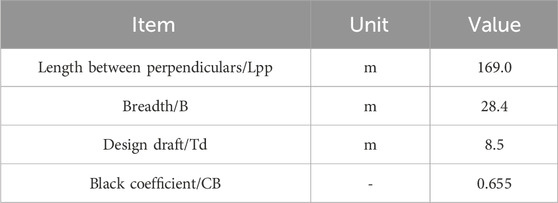
Table 1. Main dimensions of a ship.
3 Analysis based on the traditional optimization method
Traditional optimization methods included the following: displacement distribution optimization, bulbous bow optimization, stern optimization, UV degree optimization of the fore-body and aft-body, transom height optimization, appendage and energy-saving device optimization, and so on. Due to space limitations, in this paper, two typical optimization methods in the traditional optimization method were introduced, namely, displacement distribution optimization and UV degree optimization of the fore-body. Numerical simulation conditions were as follows: design draft Td was 8.5 m, calculation speed Vm was 1.821 m/s, corresponding Froude number Fr was 0.232, and real ship speed Vs. was 18.5 kn.
3.1 Optimization of displacement distribution
The Lackenby method was one of the classic methods in commercial software CAESES. The Lackenby method could change the longitudinal distribution of ship displacement by changing parameters such as the longitudinal position of the center of buoyancy and the amount of displacement. Then, commercial CFD software SHIPFLOW was used to calculate the wave resistance of each case, and the hull lines with good resistance performance were selected, as shown in Figure 1. This method was generally used 2–3 times in the whole optimization process.
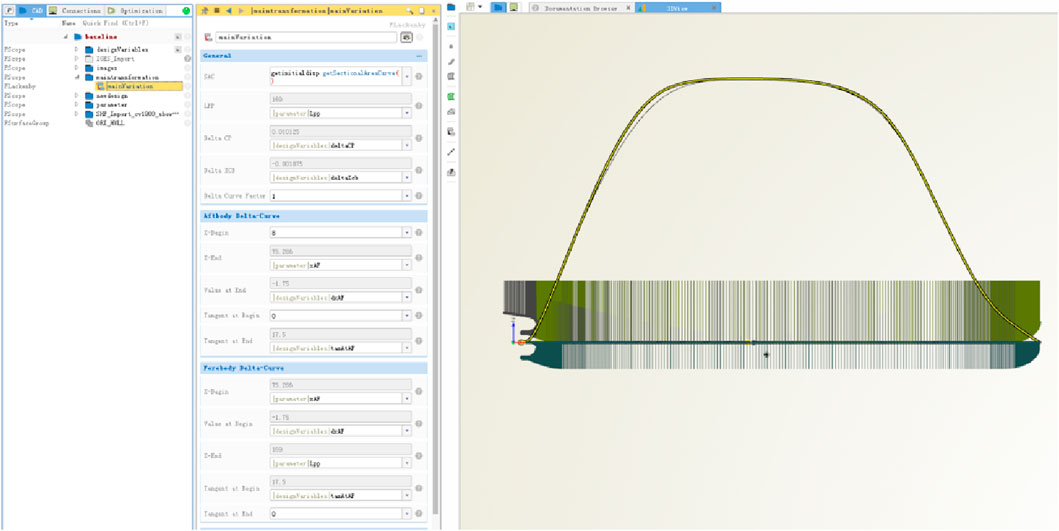
Figure 1. Lackenby optimization settings.
By optimizing the center of buoyancy position, widest transverse section position, and starting and ending angles of the widest transverse section position, a total of 400 design cases were generated, which were taken as the horizontal coordinate named run. The potential flow module of commercial CFD software SHIPFLOW was used to calculate the wave-making resistance CWTWC for each case, which was taken as the vertical coordinate. The calculation results are shown in Figure 2.

Figure 2. Calculation results of wave-making resistance of each case.
From the 400 cases, the case with the lowest wave-making resistance coefficient was selected, which is called the best case. The numerical calculation results indicated that the best case exhibited a noticeable reduction in the wave-making resistance compared to the initial case. Figure 3 shows the comparison of the wave pattern of the free surface between the best and initial cases. Figure 4 shows the longitudinal distribution of wave height on the side of 0.2 Lpp. From the comparison wave pattern, it could be seen that all the wave peak amplitudes of the best case had a certain amount of decrease, while the wave trough amplitudes had a certain amount of increase, and the wave pattern was flatter than that of the initial case, which was reflected in the reduction of wave-making resistance coefficient from 0.539 × 10⁻³ to 0.402 × 10⁻³.
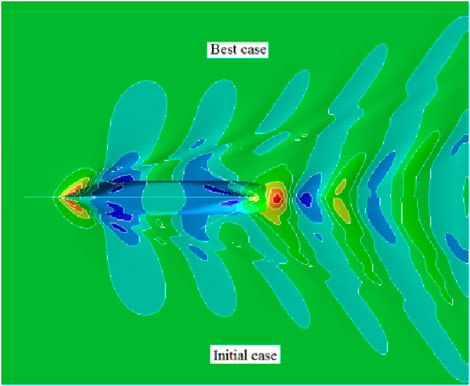
Figure 3. Comparison of free-surface wave patterns.
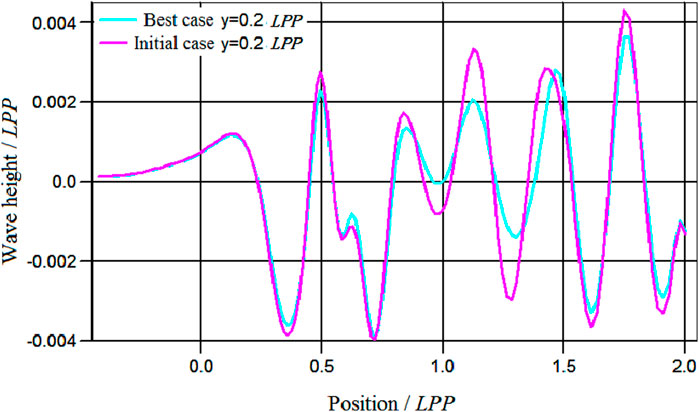
Figure 4. Comparison of longitudinal distribution of wave height at the side y = 0.2 Lpp.
Figure 5 shows the comparison of the partial hull lines before and after Lackenby optimization. At the fore-body, the waterlines were narrower for the best case than the initial case before station no.16, but they were opposite from station no.10 to 16. At the aft-body, the waterlines were wider from station no.2 to 10, but they were opposite from the transom to station no.2. In order to verify the resistance performance of the best case, commercial CFD software STAR-CCM+ was used to calculate the total resistance in calm water for the initial and best cases. The results showed that at the model scale, the total resistance decreased by approximately 1.05% for the best case compared to the initial case in Lackenby optimization. This was mainly because the inlet angle became smaller and the water flow became smoother when the waterlines of the fore-body were narrower. The middle part of the hull became wider, and that meant the displacement increased, which could facilitate the general arrangement. Perhaps pressure distribution at the fore-body was more reasonable, leading to reduced resistance. The waterlines of the aft-body were narrower, which reduced the low-pressure area of the aft-body, so the viscous pressure resistance was reduced.
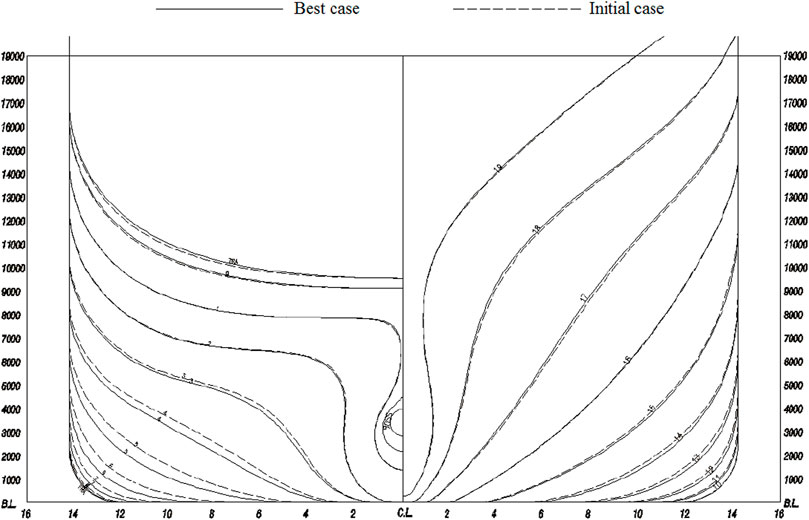
Figure 5. Hull line comparison before and after optimization.
3.2 UV degree optimization of the fore-body
Lackenby optimization using CAESES software improved the longitudinal distribution of displacement to be more reasonable, but the vertical distribution of displacement was not fully considered. Therefore, in order to obtain the hull lines with better performance, surface delta shift was used in this paper to optimize the vertical distribution of the displacement, called the UV degree optimization of the fore-body, as shown in Figure 6. This method was generally applied 2–3 times in the whole hull line optimization process.
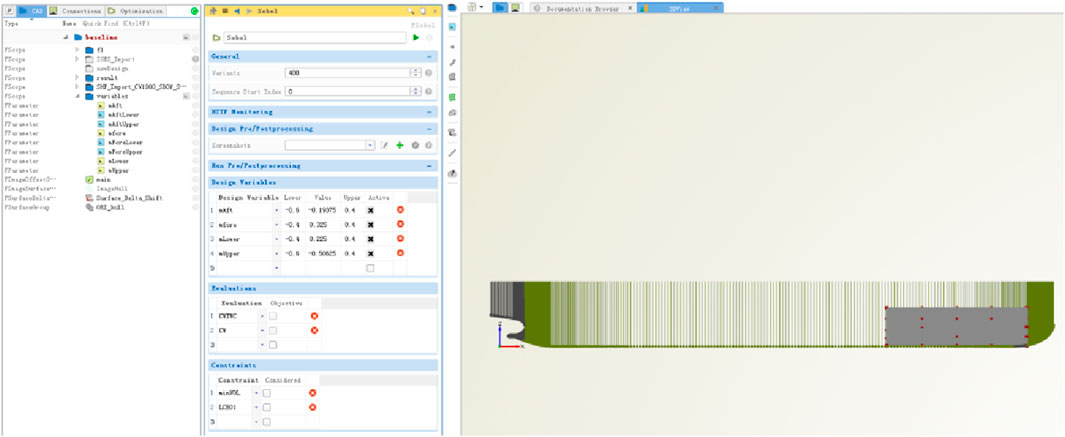
Figure 6. UV degree optimization settings.
The shape of the fore-body was changed through variable settings in software CAESES, where the vertical distribution of hull displacement was changed and a total of 400 design cases were generated, which were named run in the horizontal coordinate. The potential flow module of commercial CFD software SHIPFLOW was used to calculate the wave-making resistance CWTWC in each case, which was the longitudinal coordinate, which is shown in Figure 7.
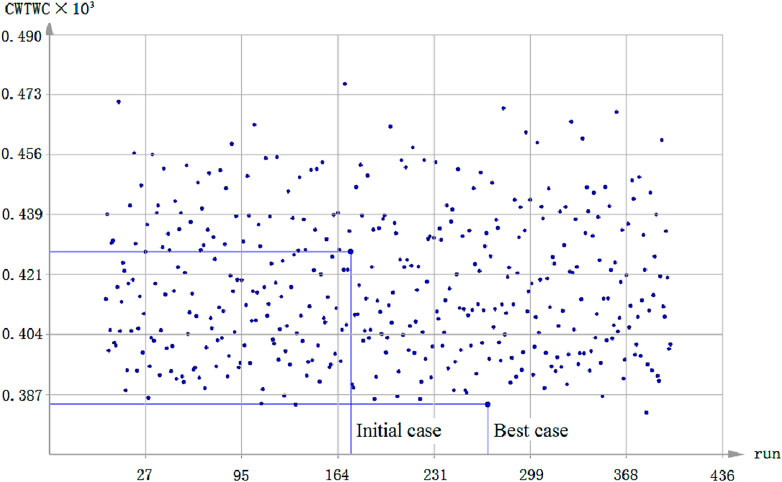
Figure 7. Wave resistance results.
The case with the lowest wave-making resistance coefficient was selected from 400 cases, which was called the best case. From the numerical calculation results, the best case had a certain degree of reduction in the wave-making resistance compared to the initial case. Figure 8 shows the comparison of the free surface wave pattern of the best and initial cases. It could be seen that the amplitude of the first wave peak in the best case had a certain amount of reduction, and the wave in the middle and aft was flatter than that in the initial case, which was also reflected in the numerical value as the wave-making resistance coefficient decreased from 0.423 × 10⁻³ to 0.374 × 10⁻³. Figure 9 shows the longitudinal distribution of wave height at the position that offset the middle line plane by 0.2 Lpp, and it could be seen that the wave height of the best case was flatter than that of the initial case.
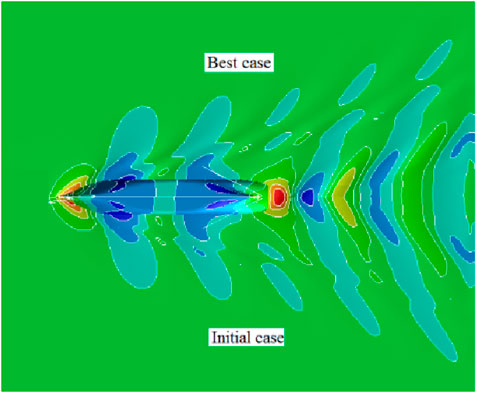
Figure 8. Comparison of free surface wave patterns.
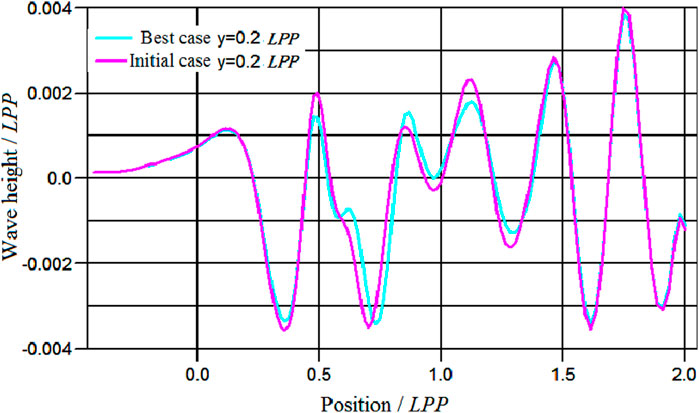
Figure 9. Comparison of longitudinal distribution of wave height at the side y = 0.2 Lpp.
Figure 10 shows the comparison of the partial hull lines before and after UV degree optimization. Compared with the initial case, the best case was narrower near the design draft and wider at the bilge. In order to verify the resistance performance of the best case, commercial CFD software STAR-CCM+ was used to calculate the total resistance of the initial case and the best case in calm water. The results showed that at the model scale, the total resistance decreased by approximately 0.95% for the best case compared to the initial case in UV degree optimization. The main reason was that the waterlines near the design draft at the fore-body were narrowed, the wave generated by the front part of the hull and the wave generated by the invisible bulbous bow produced more beneficial mutual interference, and the wave-making resistance was reduced. The lines of the bilge at the fore-body were wider, so the pressure distribution on the bilge was more uniform, and the viscous pressure resistance was reduced.
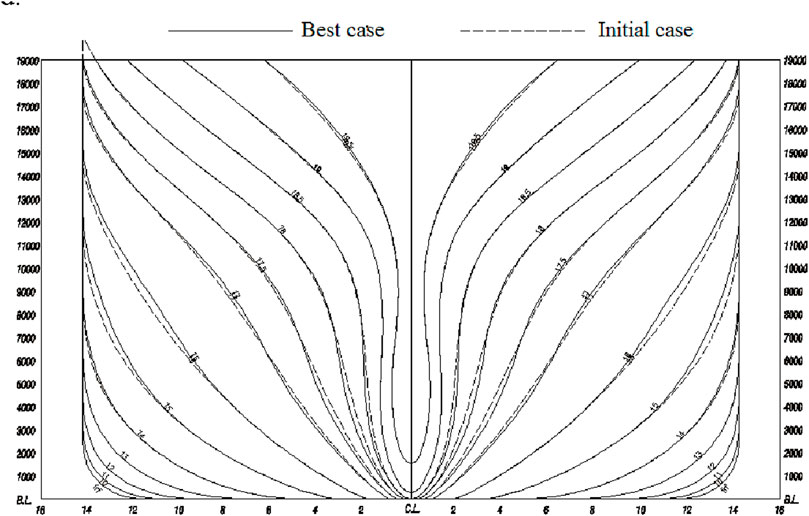
Figure 10. Comparison of hull lines before and after UV degree optimization.
3.3 Summary of hull line optimization by traditional methods
Based on the excellent parent ship, hull lines were transformed and met the requirements of the target ship. Then, the hull lines were optimized more than 20 times. In the optimization process, various optimization methods were used, such as displacement distribution optimization, bulbous bow optimization, stern optimization, UV degree optimization of the fore-body and aft-body, and transom height optimization. When the fore-body was optimized, the wave resistance was focused. When the aft-body was optimized, the viscous resistance and propulsion efficiency were paid attention to. In the optimization process, the resistance of each case was checked using STARCCM+, and the initial lines that met the requirements were obtained through the transformation in the NAPA system. Compared with the total resistance of the initial case, the total resistance of the final optimization case was reduced by 3.6% under the design draft of 8.5 m and the service speed of 18.5 kn, and the wake of the final lines was more uniform. In the traditional hull line optimization process, various methods were generally used 2–3 times. A good design case could be captured, but these methods continued to be used, and it was difficult to get a better design case. The final hull lines optimized based on the traditional method are shown in Figure 18. It usually took 6–7 weeks to optimize the hull lines based on the traditional optimization method.
4 Analysis based on the fully parametric optimization method
4.1 Establishment of the fully parametric model
Using the initial hull lines, which were the same as in the traditional optimization method, the fully parametric model was established. Several characteristic curves were obtained, which were the transverse section area curve, design waterline, flat edge line, flat bottom line, deck top line, mid line, tangential angle of design waterline, tangential angle of flat bottom line, and tangential angle of deck top line. They were used as the input conditions of the fully parameterized model. Figure 11 shows the sectional area curve (SAC) of the fully parametric model and the SAC of the initial hull lines. Other characteristic curves could be established one by one according to this method and used in the construction of the fully parametric hull surface, as shown in Figure 12. The characteristic curve of the fully parametric model tried to approximate the characteristic curve of the parent ship as much as possible, and there would still be some deviation, but it did not affect the optimization results because the fully parametric model established by approximating the characteristic curve of the parent ship was the initial model for optimization, and the final hull lines were the model with the best resistance performance after optimization.
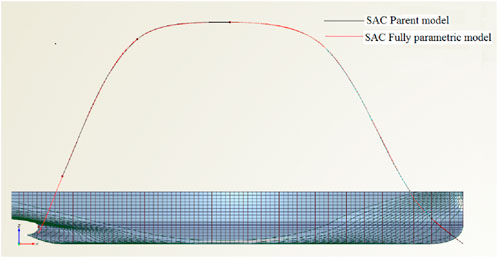
Figure 11. Comparison of SAC of the fully parametric model with SAC of the parent ship.
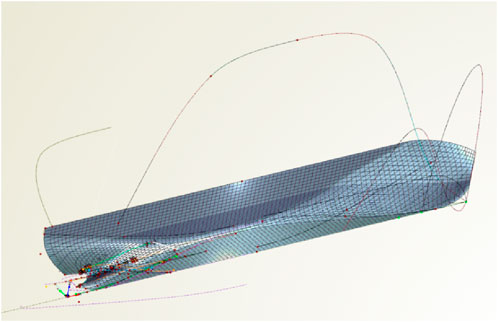
Figure 12. Fully parametric model.
Based on the set characteristic curves, the meta-surface function was used to establish the hull surface, the shape of which can be controlled by various relevant characteristic parameters, as shown in Figure 12.
4.2 Determination of characteristic variables, range, and constraints
The characteristic parameters were used to control the characteristic curves, and the characteristic curves formed the hull geometry. Then, the characteristic parameters could be used as the design variables of hull line optimization, and the hull resistance performance was taken as the objective function to conduct numerical simulation. Then, the important characteristic parameters affecting hull resistance performance were found through sensitivity research. To achieve the purpose of improving design quality, reducing design calculation, and improving design speed, the scope of the design variables was narrowed. In general, the characteristic parameters of the hull included the length between perpendiculars, breadth, design draft, bilge rise, bilge radius, the height of the propeller shaft, transom height, inlet angle of the design waterline at fore-body, fullness of the design waterline at fore-body, tangential angle of the design waterline at fore-body, area curve of the design waterline at fore-body, outlet angle of the stern design waterline, fullness of the stern design waterline, tangential angle of the stern design waterline, and area curve of the stern design waterline. There were more than 60 related control characteristic parameters for the fully parametric model. However, according to the design requirements and general arrangement, most of the characteristic parameters do not need to be changed, such as the length between the perpendiculars, breadth, design draft, displacement, and height of the propeller shaft. According to previous experience and sensitivity research, many characteristic variables, such as bilge rise, bilge radius, and stem rise, were not sensitive to the objective function, so characteristic variables could be reduced as much as possible to improve optimization efficiency. Finally, considering the design period and design experience, in this optimization, only eight characteristic variables were selected, which were essentially sufficient to meet the optimization requirements, as shown in Table 2.
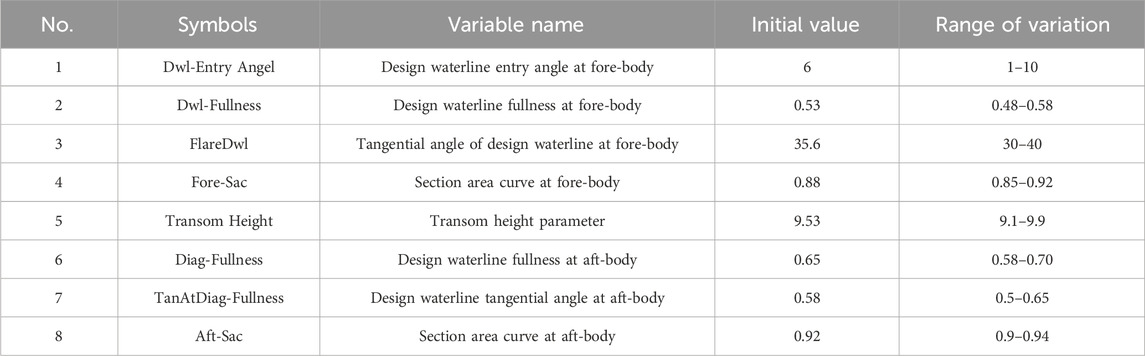
Table 2. Hull characteristic variables.
The main constraint conditions were that the displacement should not be less than 26,719 m3 and the change in the center of buoyancy should be limited by ±1%. Considering the requirements of the general arrangement and hard points, the appropriate value range of each characteristic variable was finally determined, as shown in Table 2.
4.3 Optimization algorithm
Eight characteristic variables were selected for hull line optimization based on the fully parametric model. First, the SOBOL algorithm, a random sequence algorithm with good convergence, was adopted. Under the given range of variables and the total number of models, a random orthogonal algorithm was adopted for uniform sampling. Finally, the best candidate case could be found by CFD simulation. Considering that there were only eight characteristic variables in this optimization, the software program recommended that 500 calculation cases were sufficient. After the best case was obtained in the SOBOL method, the tangent search method was used for a local search to get a better case, as shown in Figure 13. The tangent search method, a direct search method, was used to find the minimum value of any problem with more than one design variable and subject to nonlinear constraints of any equality or inequality.
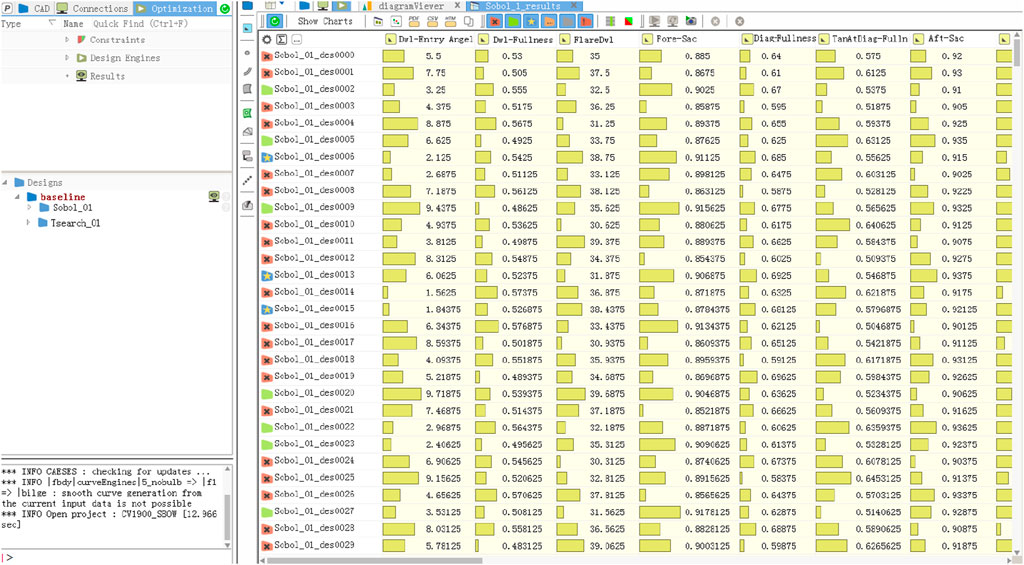
Figure 13. Schematic diagram of the optimization algorithm of the fully parametric model.
4.4 Numerical calculation and result analysis
After the fully parametric model was established and the characteristic variables were determined, the numerical simulation and optimization based on CFD could be carried out. The CFD numerical calculation used the SHIPFLOW full viscous flow solver, which was integrated using CAESES software. The speed Vm for the numerical simulation of each case was 1.821 m/s, and the total resistance coefficient (CT) of 500 cases was calculated, which took approximately 1 week, as shown in Figure 14.
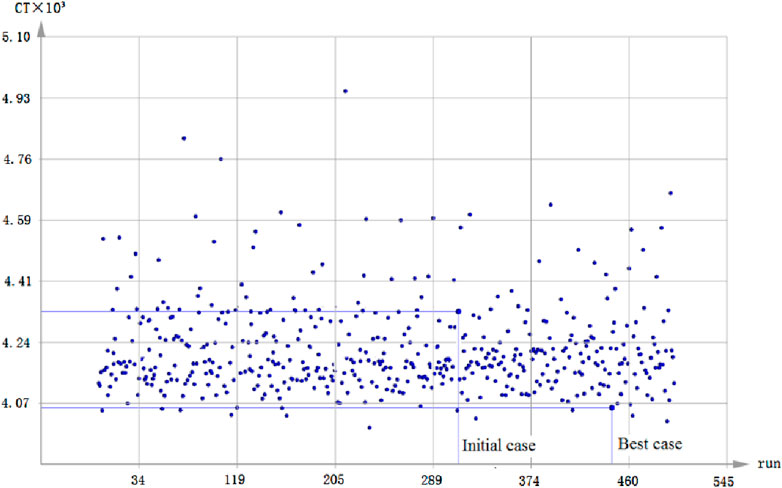
Figure 14. Calculation results of total resistance coefficient of each case.
From the 500 calculation results, the case with the lowest total resistance coefficient was selected as the best case, and it was the final hull line in the fully parameter model optimization. From the numerical calculation results, the total resistance of the best case was reduced by a certain extent compared to that of the initial case, which was reflected in the numerical value of the total resistance coefficient, which was reduced from 4.32 × 10⁻³ to 4.06 × 10⁻³. Figure 15 shows the comparison of the free surface wave pattern of the best and initial cases. It could be seen from the comparison wave pattern that at the fore-body, the range of the high-pressure area of the best case decreased, and the range of the low-pressure area of the free surface near station 19 also decreased. At the aft-body region, the low-pressure region of the best case was significantly reduced, and the high-pressure region was also significantly reduced. It can be seen that the wave pattern at the aft-body of the best case was flatter than that of the initial scheme. Figure 16 shows the pressure distribution of the hull surface. The low-pressure range at the stem of the best case was small, and the pressure distribution at the stern was more uniform. STARCCM+ was used to check the resistance of the initial and best cases. Under the design draft of 8.5 m and a service speed of 18.5 kn, the total resistance of the final optimized case was reduced by 6.6%, and its wake was also improved to a great extent.
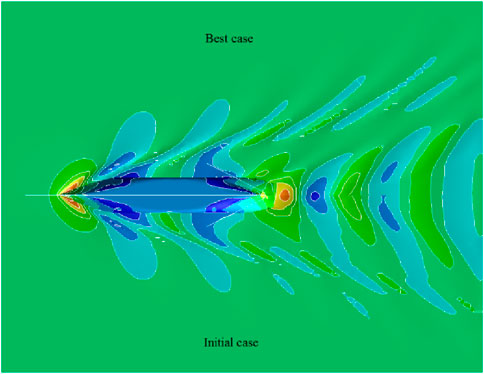
Figure 15. Comparison of free surface wave pattern.
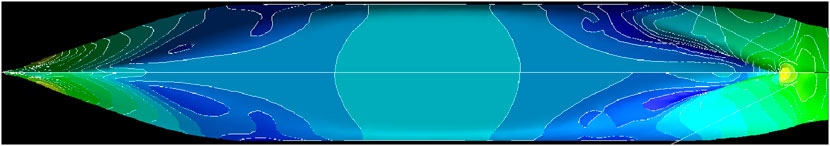
Figure 16. Comparison of pressure distribution on hull surface (top: optimal scheme; bottom: initial scheme).
4.5 Comparison of hull lines
The final hull lines optimized by the traditional method and the fully parametric method are shown in Figure 17. The comparison of the two hull lines showed that the fore-body before station no.17 was narrower near the design draft hull lines optimized by the fully parametric method than those optimized by the traditional method, and at the bilge, it was the opposite. At the aft-body, hull lines optimized by the fully parametric method were narrower those that optimized by the traditional method. So, the displacement remained the same. In order to verify that the resistance performance of the hull lines optimized based on the fully parametric model method was better than that of the traditional method, commercial CFD software STAR-CCM+ was used to calculate the full viscous flow of the calm water resistance of the ship at a design draft of 8.5 m and a service speed of 18.5 kn. The results showed that at the model scale, the resistance of the best case optimized by the fully parametric method was approximately 3.0% lower than that of the best case optimized by the traditional method. This was mainly due to the narrow waterlines near the design draft of the bow, which made the shoulder and the water flow smoother, and the widening of the bilge of hull lines, which made the pressure distribution on the bilge more reasonable and the viscous pressure resistance lower. After the aft-body was narrowed, the range of the low-pressure area was decreased, and the resistance was reduced. In summary, based on the same initial hull lines, the resistance of the ship optimized by the fully parametric optimization method was reduced by approximately 3.0% compared with that of the traditional optimization method, which fully reflected the superiority of the hull optimization based on the fully parametric model.
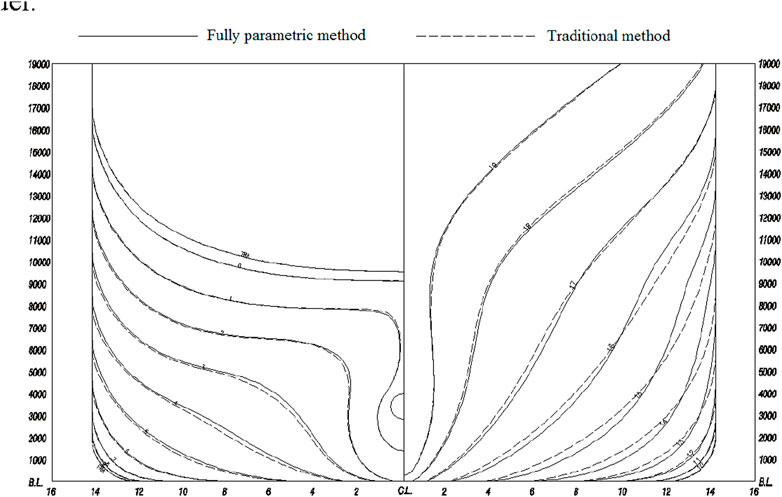
Figure 17. Comparison of optimized hull lines based on the traditional method and the fully parametric method.
4.6 Advantages and disadvantages of the two optimization methods
In the process of studing traditional optimization methods and the fully parametric method, we can find the following:
(1) With regard to the fully parametric method, it took time to establish the fully parametric model. In general, it took 1–2 days. However, for the traditional optimization method, the model could be obtained quickly.
(2) It took 3–4 weeks to complete the optimization task with the fully parametric method. However, the traditional optimization method required the cooperation of various methods that were repeatedly applied and strived to capture the best solution. Generally, it took approximately 6–7 weeks to complete the optimization task.
(3) Hull optimization based on the fully parametric model required no manual intervention in the CFD optimization calculation process, and the final calculation results of all cases could be uniformly analyzed. However, in the process of using traditional optimization methods, all kinds of optimization methods need to cooperate with manual analysis to carry out the next optimization, and during that period, it also needs to rely on the experience of designers to get the expected good results.
(4) According to the CFD calculation and model test results, the hull line obtained by the hull optimization based on the fully parametric model had better resistance performance than that obtained by the traditional optimization method. Advantages and disadvantages for the two optimization methods are summarized in Table 3.
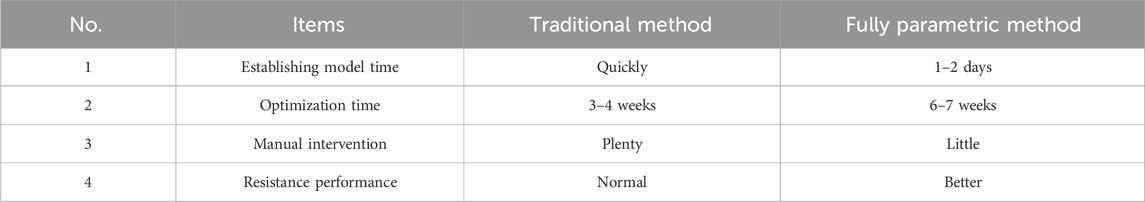
Table 3. Advantages and disadvantages for the two optimization methods.
5 Model test verification
Based on the traditional method and fully parametric method, the resistance performance of the two optimized types was verified by model tests. Model tests were carried out by Hilmar (2020), who was in charge of the model tests. The scale of the models was the same as that of the CFD numerical simulation, which was 1:27.328. The model A optimized by the traditional method and the model B optimized by the fully parametric method are shown in Figure 18.
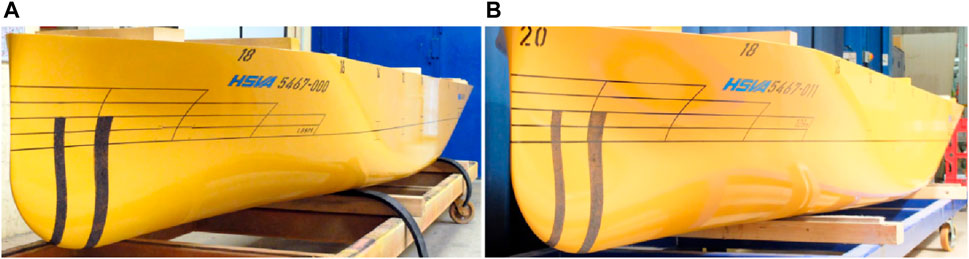
Figure 18. Ship models. (A) Optimized by the traditional method. (B) Optimized by the fully parametric method.
According to the test results, the resistance values under the model scale of the two ships were obtained, as shown in Figure 19. The resistance reduction ratio was obtained, as shown in Figure 20. The calculated formula was as follows: resistance reduction value/Δ = (Rt (fully parameterized method)/Rt (traditional method) −1)*100%. It could be seen that compared with the hull line optimized by the traditional method, the resistance of the hull optimized by the fully parametric method had a certain amount of reduction at different speeds, with an average reduction of approximately 2.66%. When the service speed was 18.5 kn, the resistance was reduced by 2.54%. Compared with the STARCCM + numerical simulation results shown in Section 3.6, the deviation was approximately 0.5%. So, the results had good trend consistency. Figures 21, 22 show the wave pattern of the two types of ships at a design draft of 8.5 m and a service speed of 18.5 kn. It could be seen that the hull lines optimized by the traditional method had a lower trough at the 14th station than the hull lines optimized by the fully parametric method. The hull lines optimized by the traditional method had obvious troughs at the fourth station at the aft-body, and the ship wave pattern obtained by the full parametric optimization was flatter.
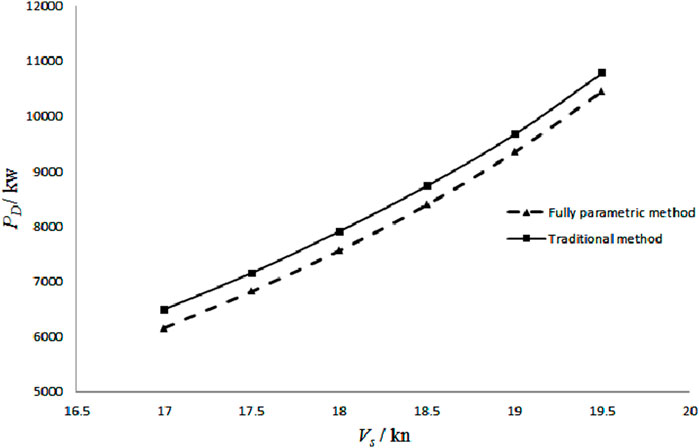
Figure 19. Comparison of resistance between he two types of ships.

Figure 20. Resistance reduction.
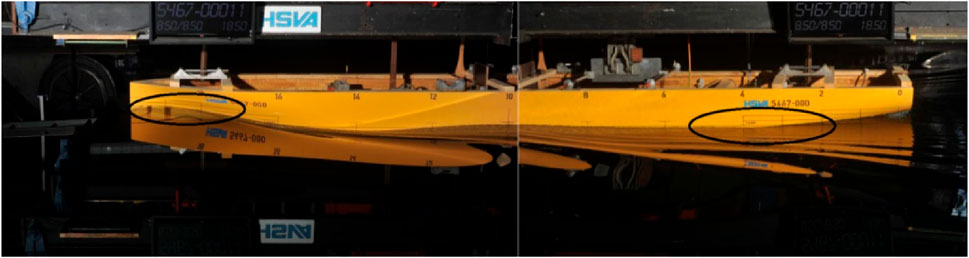
Figure 21. Wave pattern of the model optimized by the traditional method.
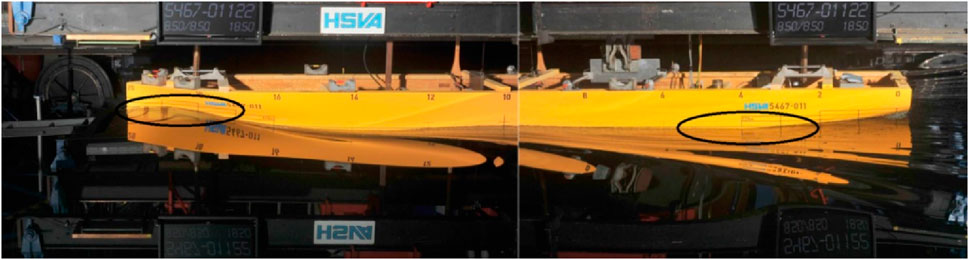
Figure 22. Wave pattern of the model optimized by the fully parametric method.
6 Conclusion
Taking hull lines of a ship research and development as examples, the application of the traditional method and fully parametric method in hull line optimization was described in detail. The research showed that the application of the hull optimization technology based on the fully parametric model was helpful in improving the optimization quality and design efficiency of the hull lines, and it also mitigated the excessive reliance of the research personnel on the parent ship and design experience so that an excellent ship form could be developed to meet market demand. The following conclusions could be drawn:
(1) After the establishment of the model, the hull line optimization based on the fully parametric method, through the scientific optimization algorithm and the application of CFD technology, could get the best hull lines without repeated iteration. Generally, it took 3–4 weeks to complete the optimization task. However, the traditional optimization method required the cooperation of various methods that were repeatedly applied and strived to capture the best solution. Generally, it took approximately 6–7 weeks to complete the optimization task. Therefore, the hull optimization based on the fully parametric model was more advanced, practical, and time-saving than the traditional optimization method.
(2) The hull optimization based on the fully parametric model required no manual intervention in the CFD optimization calculation process, and the final calculation results of all cases could be uniformly analyzed. However, in the process of using traditional optimization methods, all kinds of optimization methods need to cooperate with manual analysis to carry out the next optimization, and during that period, it also needs to rely on the experience of designers to get the expected good results. Therefore, the hull optimization based on the fully parametric model was more scientific and economical than the traditional optimization method, with less manual intervention and more saving of human resources.
(3) According to the CFD calculation results and model test results, the hull line obtained by the hull optimization based on the fully parametric model had better resistance performance than that obtained by the traditional optimization method, and the performance was improved by approximately 3%.
(4) The CFD numerical simulation results were in good agreement with the model test results, indicating that CFD numerical simulation could indicate the optimization direction for hull line design and meet the actual needs of engineering design.
In summary, the application of the hull optimization technology based on the fully parametric model was helpful in improving the optimization quality and design efficiency of the hull lines and shortening the design time.
Data availability statement
The raw data supporting the conclusion of this article will be made available by the authors, without undue reservation.
Author contributions
XC: methodology, software, validation, writing–original draft, and writing–review and editing. DW: conceptualization, investigation, and writing–original draft. XH: conceptualization, investigation, and writing–original draft. XY: conceptualization, investigation, and writing–original draft. PD: funding acquisition, software, and writing–review and editing. RJ: investigation, methodology, software, writing–original draft, and writing–review and editing.
Funding
The author(s) declare that financial support was received for the research, authorship, and/or publication of this article. This research was financially supported by the Special Foundation of Department of Natural Resources of Guangdong Province [GDNRC(2024)020].
Conflict of interest
The authors declare that the research was conducted in the absence of any commercial or financial relationships that could be construed as a potential conflict of interest.
Publisher’s note
All claims expressed in this article are solely those of the authors and do not necessarily represent those of their affiliated organizations, or those of the publisher, the editors, and the reviewers. Any product that may be evaluated in this article, or claim that may be made by its manufacturer, is not guaranteed or endorsed by the publisher.
References
Campana, E. F., Diez, M., Iemma, U., Liuzzi, G., Lucidi, S., Rinaldi, F., et al. (2016). Derivative free global ship design optimization using global/local hybridization of the DIRECT algorithm. Optim. Eng. 17 (1), 127–156. doi:10.1007/s11081-015-9303-0
Campana, E. F., Liuzzi, G., Lucidi, S., Peri, D., Piccialli, V., and Pinto, A. (2009). New global optimization methods for ship design problems. Optim. Eng. 10 (4), 533–555. doi:10.1007/s11081-009-9085-3
Campana, E. F., Peri, D., Tahara, Y., and Stern, F. (2006). Shape optimization in ship hydrodynamics using computational fluid dynamics. Comput. methods Appl. Mech. Eng. 196 (1), 634–651. doi:10.1016/j.cma.2006.06.003
Campana, E. F., Stern, F., and Diez, M. (2015). “Hydrodynamic ship design optimization considering uncertainty,” in 18th International Conference on Ships and Shipping Research, Lecco, Italy, 26 Jun 2015 (IEEE).
Chen, J., Sun, H., and Yang, Yi (2012). Lines optimization with experimental verification for a PCTC. Shipbuild. China (53), 19–23.
Chrismianto, D., and Kim, D. J. (2014). Parametric bulbous bow design using the cubic Bezier curve and curve-plane intersection method for the minimization of ship resistance in CFD. J. Mar. Sci. Technol. 19 (4), 479–492. doi:10.1007/s00773-014-0278-x
Diez, M., Serani, A., Campana, E. F., et al. (2017). “CFD based stochastic optimization of a destroyer hull form for realistic ocean operations,” in 14th International Conference on Fast Sea Transportation (FAST), Nantes, France, June-13-2017 (FAST).
Grigoropoulos, G. J. (2004). Hull form optimization for hydrodynamic performance. Mar. Technol. 41 (4), 167–182. doi:10.5957/mt1.2004.41.4.167
Han, S., Lee, Y. S., and Choi, Y. B. (2012). Hydrodynamic hull form optimization using parametric models. J. Mar. Sci. Technol. 17 (1), 1–17. doi:10.1007/s00773-011-0148-8
Harries, S. (1998). Parametric design and hydrodynamic optimization of ship hull forms. Berlin: Technische Universität.
Harries, S., Abt, C., and Hochkirch, K. (2004). Modeling meets simulation-process integration to improve design[C]//Honorary Colloquium for Prof. Univ. Duisburg-Essen.
Harries, S., Valdenazzi, F., Abt, C., et al. (2001). “Investigation on optimization strategies for the hydrodynamic design of fast ferries,” in 6th International Conference on Fast Sea Transportation, Southampton, 4th - 6th September 2001, (IEEE).
Hochkirch, K., and Bertram, V. (2009). Slow steaming bulbous bow optimization for a large containership[C]//8th Conf. Computer and IT Applications in the Maritime Industries (COMPIT). Budapest.
Huang, F., Wang, L., and Yang, C. (2014). Ship hull form optimization using artificial bee colony algorithm. Houston TX: SNAME Maritime Convention.
Huang, F., Wang, L., Yang, C., et al. (2015). “Hull form optimization of a Tri SWACH for reduced drag,” in The 13th International Conference on Fast Sea Transportation, Washington DC, USA, September 02, 2015 (IEEE).
Kim, H., Yang, C., et al. (2009). “Application of a practical multi-objective optimization tool to hydrodynamic design of a surface combatant ship,” in Proceedings of the 2009 Grand Challenges in Modeling and Simulation Conference, Istanbul, Turkey, July 13 - 16, 2009 (IEEE).
Kim, H., Yang, C., and Noblesse, F. (2010). “Hull form optimization for reduced resistance and improved seakeeping via practical designed-oriented CFD tools,” in Conference on Grand Challenges in Modeling and Simulation, Ottawa, Canada, July 7-10 2013 (IEEE).
Leotardi, C., Campana, E. F., and Diez, M. (2015). “Resistance reduction of a military ship by variable-accuracy meta model-based multidisciplinary robust design optimization,” in VI International Conference on Computational Methods for Coupled Problems in Science and Engineering, COUPLED PROBLEMS, Venice, Italy, 5-7-June-2023 (IEEE).
Markov, N. E., and Suzuki, K. (2001). Hull form optimization by shift and deformation of ship sections. J. ship Res. 45 (3), 197–204. doi:10.5957/jsr.2001.45.3.197
Peri, D., and Campana, E. F. (2003). High fidelity models in global optimization. Global Optimization and Constraint Satisfaction. Berlin Heidelberg: Springer.
Peri, D., and Campana, E. F. (2003). High fidelity models in the multi-disciplinary optimization of a frigate ship. Comput. Fluid and Solid Mech., 2341–2344.
Peri, D., Rossetti, M., and Campana, E. F. (2001). Design optimization of ship hulls via CFD techniques. J. Ship Res. 45 (2), 140–149. doi:10.5957/jsr.2001.45.2.140
Qian, J., Mao, X., Wang, X., et al. (2012). Ship hull automatic optimization of minimum resistance via CFD and RSM technique. Ship Mech. 16 (1), 36–43.
Shan, WANG, Wang, Y., Zhao, Q., et al. (2017). Bulbous bow optimization for a medium-sized luxury cruise based on parametric design method. J. Jiangsu Univ. Sci. Technol. 31 (5), 646–649.
Tahara, Y., and Kobayashi, H. (2013).CFD-Based multi-objective robust design optimization of delft catamaran, 12th International Conference on Fast Sea Transportation, 23-27 September 2007, Amsterdam, Netherlands. CSSRC.
Tahara, Y., Peri, D., Campana, E. F., and Stern, F. (2008). Computational fluid dynamics-based multi-objective optimization of a surface combatant using a global optimization method. J. Mar. Sci. Technol. 13 (2), 95–116. doi:10.1007/s00773-007-0264-7
Tahara, Y., and Tohyama, S. (2001). CFD-based multi-objective optimization of a Trimaran. SNAME, Trans. 109, 185–196.
Tampier, G., and Salas, M. (2014). Hydrodynamic ship design for service conditions. Ocean. Eng. 75, 23–29. doi:10.1016/j.oceaneng.2013.10.006
Valdenazzi, F., Harries, S., Viviani, U., et al. (2002). Seakeeping optimization of fast vessels by means of parametric modeling. Naples: HSMV02.
Valorani, M., Peri, D., and Campana, E. F. (2003). Sensitivity analysis methods to design optimal ship hulls. Optim. Eng. 4 (4), 337–364. doi:10.1023/b:opte.0000005391.23022.3b
Wang, L., Huang, F., and Yang, C. “Grid generation on NURBS surfaces developed for ship hull form optimization,” in Proceedings of the Twenty-fourth International Ocean and Polar Engineering Conference, Busan, Korea, June 15-20, 2014 (IEEE).
Wang, C., Ran, R. A. O., and Zheng, R. (2022). Hydrodynamic performance optimization of hull bow line based on CFD. Guangdong Shipbuild. (2), 29–31.
Yang, C., and Huang, F. (2016). An overview of simulation-based hydrodynamic design of ship hull forms. J. Hydrodynamics 28 (6), 947–960. doi:10.1016/s1001-6058(16)60696-0
Keywords: hull line optimization, traditional method, fully parametric method, computational fluid dynamics simulations, model test, green ship, saving energy
Citation: Cheng X, Wang D, Huang X, Yan X, Dou P and Ji R (2024) Comparative investigations on hull line optimization based on traditional and fully parametric methods for saving energy. Front. Energy Res. 12:1359957. doi: 10.3389/fenrg.2024.1359957
Received: 22 December 2023; Accepted: 22 March 2024;
Published: 06 May 2024.
Edited by:
Joshuva Arockia Dhanraj, Hindustan Institute of Technology and Science, IndiaReviewed by:
Baoyu Ni, Harbin Engineering University, ChinaAnitha Gopalan, Saveetha University, India
Copyright © 2024 Cheng, Wang, Huang, Yan, Dou and Ji. This is an open-access article distributed under the terms of the Creative Commons Attribution License (CC BY). The use, distribution or reproduction in other forums is permitted, provided the original author(s) and the copyright owner(s) are credited and that the original publication in this journal is cited, in accordance with accepted academic practice. No use, distribution or reproduction is permitted which does not comply with these terms.
*Correspondence: Renwei Ji, cmVud2VpLmppQGp1c3QuZWR1LmNu