 Jianli Yu
 Shanmao Gu1*
- 1Weifang University, Weifang, China
- 2School of Electrical Engineering and Automation, Wuhan University, Wuhan, China
The lightning-induced voltage in 10-kV overhead distribution lines was calculated and analyzed using the Agrawal coupling model and second-order finite difference-time domain (FDTD) method. The influence of lightning position on lightning-induced voltage was analyzed using the concept of indirect lightning withstanding levels. To achieve the limiting effect on lightning-induced voltage in 10-kV lines, the installation density of surge arresters should not be less than 1 group per 200–300 m.
1 Introduction
Power grid safety has attracted considerable research attention (Yang et al., 2022a; Yang et al., 2022b; Zhang et al., 2023). Considering that users are in close contact with distribution networks, the safe operation of these networks is crucial (Li et al., 2023; Li et al., 2024). Distribution lines have low insulation level and dense line corridors. In addition to direct lightning, other safety hazards may exist under the influence of lightning-induced voltage (Zeng et al., 2016; Chen et al., 2018; Gao et al., 2020). The systematic and comprehensive understanding of lightning-induced voltage characteristics of overhead distribution lines through accurate calculations is crucial to the lightning protection of distribution lines (Tatematsu and Noda, 2014; Thang et al., 2015). The lightning-induced voltage in overhead lines is theoretically investigated through two key methods: analytical and numerical methods. The analytical method is based on electrostatic theory, according to which the electric field between a thunder cloud and the ground has a binding effect on the charges of a distribution line. The bound charges move to both ends of the line in the form of traveling waves, generating overvoltage after the discharge between the thunder cloud and the ground. Although several studies have attempted to improve this method, only the amplitude of lightning-induced voltage can be calculated through this method, with large calculation errors (Yu et al., 2022). The numerical method is based on the electromagnetic theory, which has been adopted by Western scholars since the late 1960s. This theory assumes lightning electromagnetic pulse (LEMP) excited by return-stroke current as an excitation source. Accordingly, the lightning-induced voltage is evaluated by solving the coupling equation between LEMP and the conductors. Based on this theory, scholars have proposed a variety of field–line coupling models, which are currently used (Taylor et al., 1965; Agrawal et al., 1980; Rachidi, 1993).
Based on the electromagnetic theory, studies have extensively examined the lightning-induced voltage in overhead lines and obtained effective results. Zhang et al. investigated the influence of the topographic slope and stratified conductivity structure of mountains on lightning-induced voltage by using the two-dimensional finite-difference time-domain (2D FDTD) method. The results indicated that overvoltage amplitude primarily depends on the conductivity of surface soil when the thickness of surface soil is greater than 5 m, and the influence of soil stratification can be neglected (Zhang J. B. et al., 2019). Liu et al. established a macro-model based on the Agrawal field–line coupling model and calculated the lightning-induced flashover rate of 10-kV overhead lines in North China (Liu and Fan, 2019). Based on the Agrawal model, Rizk et al. analyzed the protection effects of shield wires and surge arresters on lightning-induced voltage using a transient model representing those components by determining points of discontinuity on overhead lines (Rizk et al., 2020). Zhang et al. analyzed the effects of overhead shielding wires on the lightning-induced voltage of multi-conductor lines with different earth conductivities based on the Agrawal model and 2-D FDTD method (Zhang L. et al., 2019). Because the effective intensity of the horizontal electric field varies with the angle between the electric field propagation direction and the conductor, the lightning-induced voltage amplitude of the point nearest to the lightning position (point N) is not necessarily the highest (Yu et al., 2019; Yu et al., 2020). However, the study did not consider the influence of different lightning positions on lightning-induced voltage in overhead lines. Yu et al. analyzed the influence of return-stroke current amplitude on the lightning-induced voltage of overhead lines but did not investigate the bearing capacity of overhead lines to lightning-induced voltage (Yu et al., 2022). Wang et al. evaluated the waveform and statistical characteristics of the lightning-induced voltage in overhead distribution lines with surge arresters. In addition, the waveforms and amplitudes of the lightning-induced overvoltage in 10-kV distribution lines with different numbers of surge arresters were compared and analyzed (Wang et al., 2012). However, the study assumed that the lightning-induced voltage amplitude is the highest at point N, and the distribution characteristics of the lightning-induced voltage amplitude along the lines was not fully considered. Based on a genetic algorithm and considering the safety and economy of the overhead lines, Massague et al. proposed a heuristic method to optimize the number and position of surge arresters (Massague et al., 2015). However, this method does not quantitatively analyze the improvement in the lightning performance of the overhead lines after the configuration of surge arresters. The aforementioned studies have not considered the occurrence of negative-polarity oscillations due to the influence of surge arresters and the superposition of the oscillations on the negative pulse of lightning-induced voltage.
Previous studies on the lightning-induced voltage in overhead distribution lines mostly focused on waveforms and amplitudes (Cai et al., 2013; Zhang et al., 2015; Borghetti et al., 2021; Santos and Piantini, 2021), and few studies have reported on the lightning performance of overhead lines. This is because the industry’s understanding of the lightning performance of overhead lines is primarily based on direct lightning strike (Vasconcellos et al., 2022). The performance of overhead lines under lightning-induced voltage has yet to be explored systematically and comprehensively. To this end, the present paper proposes the concept of indirect lightning withstanding level of overhead lines under the influence of lightning-induced voltage, based on the calculation of the lightning-induced voltage in overhead lines. The results indicated that lightning position has notable effects on the amplitude distribution and polarity reversal position of lightning-induced voltage. The lightning-induced voltage characteristics of overhead lines with different lightning positions should be determined to realize lightning protection. In addition, because the installation of surge arrester is crucial to the lightning protection of overhead lines, this study performed systematic and quantitative analysis on the amplitude distribution of the lightning-induced voltage and the indirect lightning withstanding level of overhead lines with different surge-arrester configurations. Considering high lightning failure rates and direct contact with users, 10-kV single circuit overhead lines were regarded as the research object. The research results may provide effective theoretical support for the systematic understanding of the lightning-induced voltage characteristics of overhead lines and the rational allocation of lightning protection resources.
2 Computing method
2.1 Field-line coupling model
The lightning-induced overvoltage of overhead lines excited using LEMP can be described mathematically using field-line coupling equations. Among the field–line coupling models reported in the literature, the Agrawal model was adopted in this study to calculate the lightning-induced voltage in overhead lines because the model presents an easy understanding of the physical concept and facilitates the solution of excitation sources (Taylor et al., 1965).
where Vi, Vs, and I denote the incident voltage, scattered voltage, and total current, respectively. The scattered voltage and incident voltage are induced by the scattered field and the incident field, respectively. The incident field is generated by the lightning channel and the ground-reflected field in the absence of line conductors. The scattered field is generated by the reaction of the overhead conductors to the incident field. L and C denote the line inductance and the line capacitance per unit length, respectively. ξg denotes ground impedance. Ex and EZ denote the horizontal and vertical components of the return-stroke electric field, respectively; i and j denote the wire serial number, and h and t denote the wire height and time, respectively. The second-order FDTD method was used to discretize Eqs 1, 2. The discrete matrices of [Vis] and [Ii] were obtained (Paolone, 2001). The two ends of the lines were applied as boundaries for the numerical calculations. The scattered voltages were calculated using the following expressions (Paolone, 2001):
where RO and RL denote the grounding impedance of both ends of the lines, and Vg is the sum of Vi and Vs representing the total voltage across the differential points on the lines. Matching grounding impedance is connected at the two ends of the line to prevent wave reflection.
This work use Agrawal coupling model and 2D FDTD method to calculate the lightning-induced voltage in overhead distribution lines, which is a very mature calculation method in trade. The specific implementation process will not be repeated in this article. In addition, the computational accuracy verification of this method has been described in detail in document (Rachidi, 1993), and will not be discussed in detail in here.
2.2 Computational model with surge arresters
The corresponding positions on the lines that the pole equipped with surge arresters were considered “discontinuous points” (Paolone, 2001). The scattered voltage at each discontinuous point can be calculated using the following expression:
where k is the node serial number on the line, F denotes the voltage of the surge arrester when the impulse current flows through it (F(Ig) = Rg. Ig), and Ig denotes the impulse current.
This study assumed that the poles were grounded with a resistance Rg = 30 Ω. The volt–ampere characteristics of the surge arrester valve plates are listed in Table 1.

Table 1. Volt–ampere characteristics of the surge arrester valve plate.
2.3 Computing method of LEMP
Calculated using the FDTD method, Ex and EZ were considered the two excitation sources of the Agrawal coupling model. The FDTD method, which considers geoelectric parameters, has superior computational performance (Yu et al., 2017). This study used this method to evaluate the characteristics of LEMP.
The return-stroke current is the excitation source of LEMP. Studies have combined the base-current and return-stroke models to mathematically describe the physical process of return stroke. This study approximated the base current of the return-stroke channel by adding a double exponential function and a Heidler function (Nucci et al., 1990):
where I01 and I02 denote the amplitudes of the base current, τ1 and τ4 denote the rise times of the base current, and τ2 and τ3 denote the decay times of the base current. The modified transmission-line model with linear current decay with height (MTLL) offers concise expression, easy implementation, fewer variables, and high degree of consistency with the measured data. Therefore, the return-stroke process was simulated using the MTLL model (Rakov and Uman, 1998; Gomes and Cooray, 2000):
where z’ denotes the height of any point in the return-stroke channel, i (z’, t) represents the current at the height of z’ in the channel at time t, v denotes the return-stroke speed, and H denotes the height of the return-stroke channel.
Figure 1 illustrates the lightning-induced voltage in 220-V civil overhead lines. One end of the lines was accessible to the user, and the other end was an S11 series 10-kV/0.4-kV fully sealed S11-M-50/10 distribution transformer with a capacity of 50 kVA. The observation point was located 5 m away from the building. The lightning position was approximately 400 m away from the conductor, equidistant from both ends of the conductor. The amplitude of the return-stroke current was approximately 20 kA. Figure 2 illustrates a comparison between the calculated lightning-induced voltage in overhead lines and the measured values. The numerically obtained results in this study are consistent with the measured voltage, confirming the accuracy of the proposed calculation method.
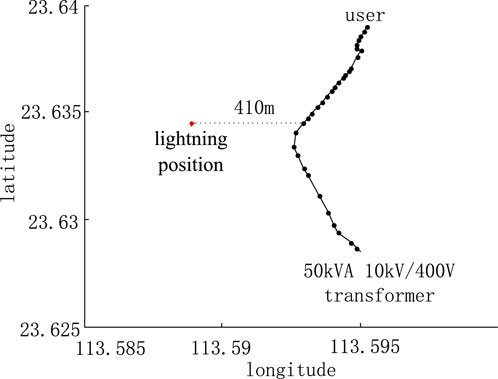
Figure 1. Top view of overhead lines and lightning position.
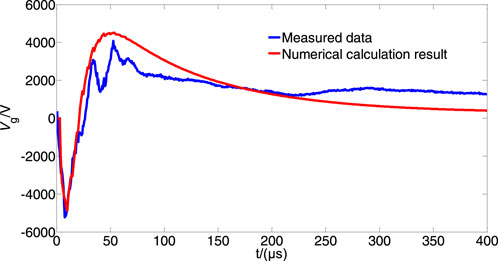
Figure 2. Comparison between the numerically calculated lightning-induced voltage in overhead lines and the measured data.
3 Indirect lightning performance
3.1 Calculation conditions
This study performed calculations to evaluate 10-kV overhead distribution lines. The erection conditions of the pole are illustrated in Figure 3. The height of the conductors from the ground was 10 m.
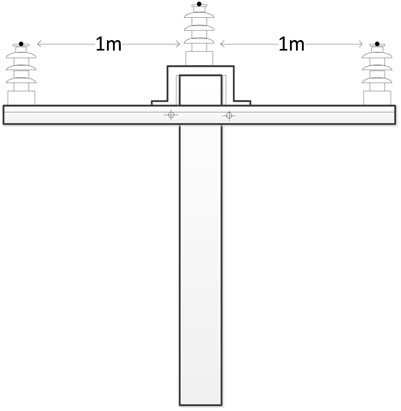
Figure 3. Pole erection condition of the10 kV overhead distribution lines.
Figure 4 shows the relationship between lightning positions and overhead lines. The length of the lines was 6 km, and the span was 100 m. The distance between two adjacent observation points was 500 m, with a total of 13 observation points. In addition, the influence of conductor sag was not considered in the calculations because of the small span of the 10-kV line. The return-stroke current was calculated using Eqs 8, 9, and the following parameter values were used: I01 = 4.2 kA, I02 = 7.27 kA, τ1 = 0.072 µs, τ2 = 10 µs, τ3 = 20 µs, τ4 = 0.5 µs, H = 7 km, v = 1.5 × 10⁸ m/s, and σ = 2.0 × 10⁻³ S/m and ε = 10 (σ denotes earth conductivity, ε denotes earth relative permittivity). The return-stroke current amplitude was 10 kA. Figure 5 shows the Channel base current waveform.
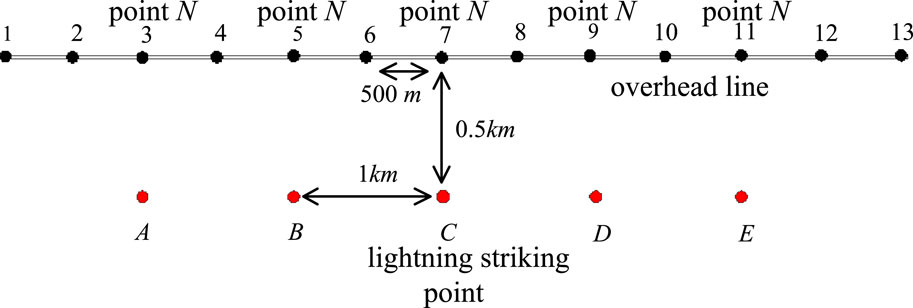
Figure 4. Relationship between the lightning positions and overhead lines.
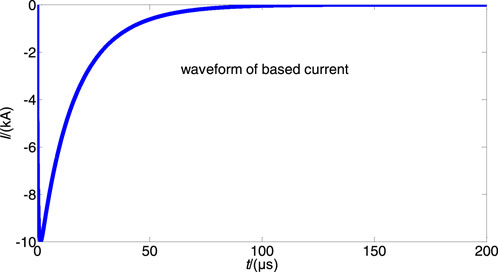
Figure 5. Channel base current waveform.
3.2 Influence of lightning position on lightning-induced voltage
The probability of insulator string breakdown under a certain impulse voltage is 50%, and the corresponding impulse voltage is denoted as U50%. The impulse flashover of the overhead lines was determined by comparing the amplitude of the overvoltage pulse with the U50% of the insulator string (IEEE Guide for Improving, 2011). If the amplitude of the overvoltage pulse was lower than U50%, the flashover of the insulator string did not occur. Therefore, accurately determining the position of the highest amplitude pulse of lightning-induced voltage on the line is necessary for calculating the indirect lightning withstanding level. The influence of the lightning position on the amplitude distribution of the lightning-induced voltage pulse in overhead lines is stronger than that of other factors. Figure 6 shows the distribution conditions of the pulse amplitude of lightning-induced voltages when the lightning positions were points A–E depicted in Figure 4.
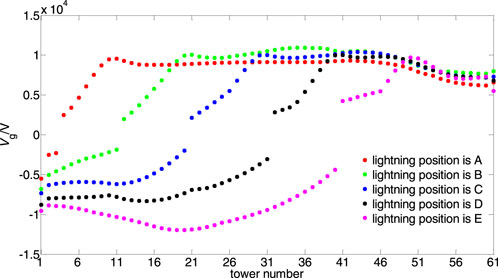
Figure 6. Distribution conditions of lightning-induced voltage pulse amplitude at lightning positions A–E.
The amplitude distribution of lightning-induced voltage pulse was considerably different when the lightning position was different. The overall distribution trend indicated that the pulse amplitude was higher in the area close to point N. The pulse amplitude on the wire extending along both sides of point N gradually decreased, and the decline speeds of the pulse amplitude in the two directions were different. Considering the non-stationary charge in the wire, the directional motion of the charge generates a “wave,” which serves as a circuit connected to the two ends of the wire. Under the action of waves, the lightning-induced voltage on the wire exhibits a symmetrical distribution, and the two ends exhibit opposite polarities. Consequently, a “polarity reversal” occurs in the wire.
At lightning positions A–E, the difference in maximum amplitude of the positive lightning-induced voltage pulse was negligible. Neglecting the differences in pulse polarity, the maximum amplitudes of the lightning-induced voltage pulse corresponding to the five lightning positions from high to low were as follows: E > B ≈ C ≈ D > A. The polarity of the lightning-induced voltage pulse changed on the side close to the observation point 1, resulting in different pulse polarities at both ends of the wires; this is consistent with the observation results (Barker et al., 1996; Michishita et al., 2003; Yang et al., 2003). As reported in the literature (Yang et al., 2003), the charges with opposite polarities accumulated at both ends of the wires, resulting in opposite potentials at the two ends of the wires.
Comparative analysis revealed that the position where the polarity of the lightning-induced voltage pulse changed exhibited the same change trend as that at the lightning position. The lightning-induced voltage at both ends of the wire (points 1 and 13) exhibited a change trend that was different from those at other observation points. This is because the matching grounding was adopted for the calculations to minimize the influence of the refraction and reflection of traveling waves. Terminal voltage largely varied with the value of grounding resistance. The pole numbers at point N corresponding to the five lightning positions were 11, 21, 31, 41, and 51. However, the pole numbers corresponding to the maximum amplitude of the lightning-induced voltage pulses were 11, 35, 43, 41, and 20. Although the overall distribution trend of the lightning-induced voltage pulse amplitude on the wire was closer to that at point N, the lightning-induced voltage pulse amplitude of point N does not necessarily increase. In addition, the variation trend of the lightning-induced voltage pulse amplitude on both sides of point N were inconsistent, resulting in an asymmetric distribution of the pulse amplitude. At lightning positions A–D, the maximum amplitude of the lightning-induced voltage pulse was in the positive pulse region, and some peak amplitudes were located at or near point N. At lightning position E, the maximum amplitude of the lightning-induced voltage pulse did not appear in the adjacent area of point N but appeared in the negative pulse region.
The aforementioned phenomena can be represented using the Agrawal coupling model. The lightning-induced voltage of a conductor is determined by Ex and EZ, which are the excitation sources of Vs and Vi, and the intensity of Ex is higher than that of EZ (Michishita et al., 2003; Yang et al., 2003). The intensity of EZ was the highest at N, but the effective value of Ex varied with the angle between the electric field propagation direction and the conductor (Yu et al., 2019; Yu et al., 2020). Therefore, the total excitation intensity of Ex and EZ at point N was not necessarily the highest. Meanwhile, because of the influence of traveling waves on the conductor, the pulse amplitude of point N was not necessarily the highest. Furthermore, the pulse amplitude of lightning-induced voltage at the symmetrical positions on both sides of point N did not exhibit a symmetrical distribution. In addition, the smaller the distance from the “polarity-reversal” position, the lower the amplitude of the lightning-induced voltage pulse. At the lightning position E, the polarity reversal occurred in the region of poles 40 and 41. The lightning-induced voltage to the left of pole 40 was relatively weak because of the polarity reversal, and the maximum amplitude of the negative-polarity pulse exceeded that of the positive-polarity pulse.
3.3 Indirect lightning withstanding level
The lightning withstanding level of the transmission line is defined as the maximum lightning current amplitude of insulation without impulse flashover when lightning directly strikes the overhead line. Conventionally, a lightning strike refers to the direct striking of lightning on the line, for example, striking at the pole, shielding wire, and wire. The present study analyzed indirect lightning withstanding. The maximum return-stroke current amplitude of insulation without impulse flashover when the lightning position is near the overhead lines. Because the lightning-induced voltage pulse amplitude of point N was not the highest in all cases (Yu et al., 2019; Yu et al., 2020), unnecessary human error is caused when the pulse amplitude at point N is used to calculate the indirect lightning withstanding level.
Pin-type insulators of ceramic materials are mostly used in 10-kV overhead lines, and U50% of the insulators is assigned 170 kV according to test measurements. Figure 7 displays the indirect lightning withstanding levels corresponding to the five lightning positions. The five lightning positions in the decreasing order of indirect lightning withstanding levels can be arranged as follows: A > D ≈ C ≈ B > E; this is consistent with the calculation results illustrated in Figure 6. The distribution range of the indirect lightning withstanding level corresponding to the five lightning positions was 147–176 kA. At lightning positions B, C, and D, the indirect lightning withstanding levels were relatively close, and the difference between the indirect lightning withstanding levels at B and D was approximately 10 kA. The difference between the indirect lightning withstanding levels at A and E was approximately 30 kA.
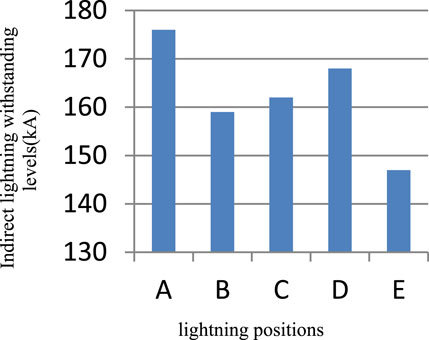
Figure 7. Indirect lightning withstanding levels at the five lightning positions.
4 Influence of surge arresters on indirect lightning withstanding level
Because of the superior performance of overvoltage limiting devices, surge arresters are widely used and offer effective lightning protection to transmission lines (IEEE Guide for Improving, 2011). Using the computational model discussed in Section 2.2, this study evaluated the lightning-induced voltage characteristics and the effects of different surge arrester configurations on the indirect lightning withstanding level of 10-kV single circuit lines. The polarity of lightning-induced voltage pulses in distribution lines change with lightning positions. To comprehensively and intuitively analyze the influence of different surge arresters configurations on lightning-induced voltage, one observation point was selected in the positive-pulse region and another one was selected in the negative-pulse region. Poles 15 and 30 poles were taken as observation points on the line. Many working conditions were derived from the combination of different simulation configurations. The surge arresters were evenly distributed: one group of surge arresters was configured for every 2, 3, 4, 5, and 10 poles, and the total numbers of surge arresters in the groups were 31, 21, 16, 13, and 7, respectively. In addition, excluding the situation without surge arresters (0 group), six types of surge arrester configurations were applied. The lightning position was C, and other calculation parameters were consistent with those discussed in Section 3.1. To highlight the difference between the effects of different surge arrester configurations, a high return-stroke current amplitude was selected. Figure 8 shows the pulse amplitude distribution of the lightning-induced voltage of six surge arrester configurations. As illustrated in Figure 8, y-axis represents the pulse amplitude of the lightning-induced voltage. The line is protected by surge arresters in the first five scenarios, but not in the last scenario. Figure 9 shows the lightning-induced voltage waveforms at two observation points when the return stroke-current amplitudes were 50 and 100 kA.
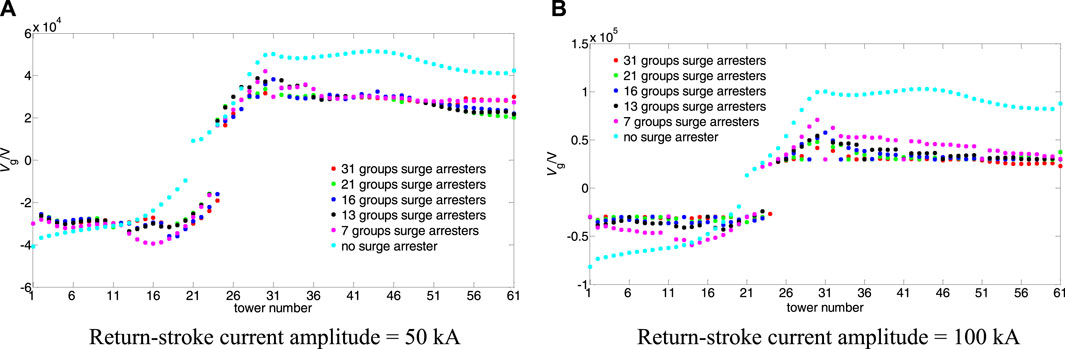
Figure 8. Lightning-induced voltage pulse amplitude distribution for six surge arrester configurations.
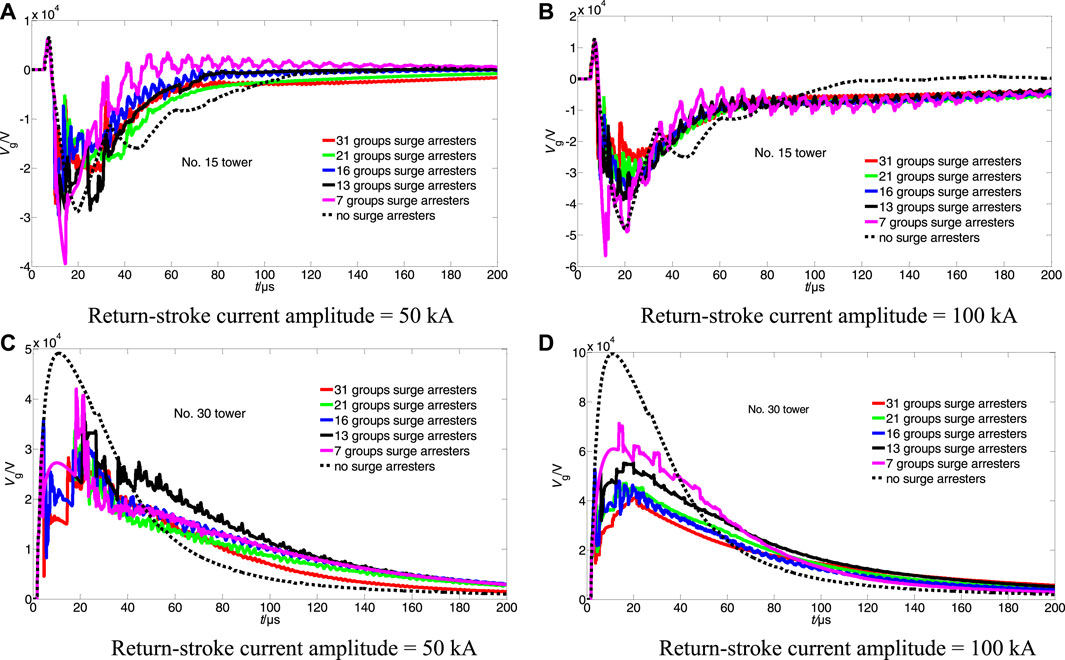
Figure 9. Lightning-induced voltage waveforms at two observation points for six surge arrester configurations.
As illustrated in Figure 9, the influence of the surge arresters considerably changed the pulse amplitude distribution of lightning-induced voltage. Typically, the clamping effect on the lightning-induced voltage in the line improves with the density of surge arresters, but the two parameters do not have a linear relationship.
In the configuration with 31 groups of surge arresters, the overall pulse amplitude of the lightning-induced voltage was relatively low; when the number of surge arrester groups was 21, 16 and 13, the influence on the corresponding pulse amplitude distribution was negligible. The voltage limiting effect of 21 surge arrester groups was slightly stronger than that of the other two, and the pulse amplitude at point N and its vicinity in the three cases (21, 16, and 13 groups) was considerably higher than that for 31 surge arrester groups. When the number of surge arrester groups was 7, the inhibition effect on the lightning-induced voltage pulse amplitude of the entire line decreased substantially. Thus, the lightning-induced overvoltage of overhead lines can be effectively limited if the installation density of surge arresters is not less than one group per 200–300 m, consistent with the results reported by Yokoyama (Yokoyama et al., 1989).
The lightning-induced voltage pulse amplitude with surge arresters was higher than that without surge arresters in poles 13–21. This phenomenon was more prominent when the configuration density of surge arresters was lower because negative-polarity oscillations occur because of the action of surge arresters, resulting in an abrupt increase in lightning-induced voltage in nearby lines. The oscillations become stronger with the increasing intervals between the surge arresters. A lightning-induced negative voltage pulse is superimposed with the oscillation pulse to produce a high-amplitude pulse voltage, consistent with the conclusions reported by Paolone (Paolone, 2001). To reflect the negative-polarity oscillations, a larger based current peak value is adopted (50 and 100 kA), ensuring that the surge arresters function desirably. At pole 15 (Figures 9A–B), the maximum amplitude of the induced voltage pulse was higher than that without any surge arresters when the installation density of surge arrester was lower than 1 group for every 5 poles (13 groups in total). For the same surge arrester configuration, the oscillations were stronger when the return-stroke current amplitude was 50 kA than that when the amplitude was 100 kA. This is because the number of surge arresters decreased with the decrease in the return-stroke current amplitude, indirectly reducing the configuration density of the surge arresters. Figure 10 shows the indirect lightning withstanding level of 10-kV overhead distribution lines with different surge arrester configurations.
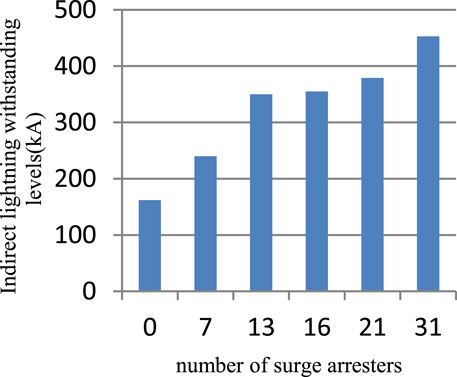
Figure 10. Indirect lightning withstands level of 10-kV overhead distribution lines with different surge arrester configurations.
As shown in Figure 10, the indirect lightning withstanding level increased nonlinearly with the increase in the installation density of the surge arrester. When the installation density of the surge arrester was lower than 1 group for every 2 poles, the indirect lightning withstanding level decreased considerably. The effects of a group of surge arresters every 3–5 poles were negligible. For 1 group of surge arresters for every 4 and 5 poles, the number of surge arresters in the 4-pole group was >20% higher than that in the 5-pole group, while the indirect lightning withstanding level increased by only approximately 1%. When the installation density of surge arresters was reduced to 1 group every 10 poles, the improvement of the indirect lightning withstanding level was considerably small.
5 Conclusion
This study calculated the lightning-induced voltages of 10-kV overhead distribution lines based on the Agrawal coupling model. The concept of indirect lightning withstanding level was defined, and the effects of different lightning positions and surge arrester configurations on lightning-induced voltage and indirect lightning withstanding level were analyzed. Based on the research and analysis, the following conclusions were obtained.
The lightning position has notable influence on the distribution of the lightning-induced voltage pulse amplitudes in overhead lines. The lightning-induced voltage at symmetrical positions on both sides of point N does not exhibit symmetrical distribution, and the pulse amplitude at point N is not necessarily the highest.
The lightning-induced voltage pulse in the conductor exhibits polarity reversal, and the position of polarity reversal is significantly affected by the lightning position. The amplitude of the lightning-induced voltage pulse decreases with the decrease in distance from the polarity-reversal position. The maximum amplitude pulse in the positive-polarity pulse region may likely be located at or near point N.
The lightning position has a relatively strong influence on indirect lightning withstanding level. Under the same conditions, the difference in the indirect lightning withstanding level is large when the lightning positions are close to both ends of the line, and the difference in the indirect lightning withstanding level is relatively small when the lightning positions are close to the middle of the line.
The configuration of surge arresters has notable influence on reducing lightning-induced voltage and improving indirect the lightning withstanding level. When the installation density is relatively low, the maximum amplitude of the induced voltage pulse is higher than that without the surge arrester because of the superposition of negative-polarity oscillation generated by the surge arrester and negative-polarity lightning-induced voltage pulse. For 10-kV overhead lines, the lightning-induced overvoltage can be effectively limited if the installation density of surge arresters is not less than 1 group per 200–300 m.
Data availability statement
The original contributions presented in the study are included in the article/supplementary material, further inquiries can be directed to the corresponding author.
Ethics statement
Written informed consent was obtained from the individual(s) for the publication of any potentially identifiable images or data included in this article.
Author contributions
JY: Conceptualization, Data curation, Funding acquisition, Software, Writing–original draft. SG: Writing – original draft. JL: Writing–original draft, Writing–review and editing. HL: Writing–review and editing.
Funding
The author(s) declare financial support was received for the research, authorship, and/or publication of this article. This work was supported by the Natural Science Foundation of Shandong Provincial ZR2022ME155.
Conflict of interest
The authors declare that the research was conducted in the absence of any commercial or financial relationships that could be construed as a potential conflict of interest.
Publisher’s note
All claims expressed in this article are solely those of the authors and do not necessarily represent those of their affiliated organizations, or those of the publisher, the editors and the reviewers. Any product that may be evaluated in this article, or claim that may be made by its manufacturer, is not guaranteed or endorsed by the publisher.
References
Agrawal, A. K., Price, H. J., and Gurbaxani, S. H. (1980). Transient response of multiconductor transmission lines excited by a nonuniform electromagnetic field. IEEE Trans. Electromagn. Compat. 22 (2), 119–129. doi:10.1109/temc.1980.303824
Barker, P. P., Short, T. A., Berard, A. R. E., and Berlandis, J. (1996). Induced voltage measurements on an experimental distribution line during nearby rocket triggered lightning flashes. IEEE Trans. Power Deliv. 11 (2), 980–995. doi:10.1109/61.489360
Borghetti, A., Ishimoto, K., Napolitano, F., Nucci, C. A., and Tossani, F. (2021). Assessment of the effects of the electromagnetic pulse on the response of overhead distribution lines to direct lightning strikes. IEEE Open Access J. Power Energy 8, 522–531. doi:10.1109/oajpe.2021.3099596
Cai, L., Wang, J., Zhou, M., Li, X., and Zhang, Y. (2013). Effects of surge protective devices on overhead power line induced voltage from natural lightning. IEEE Trans. Electromagn. Compat. 55 (6), 1201–1209. doi:10.1109/temc.2013.2255131
Chen, H. C., Du, Y. P., Yuan, M. Q., and Liu, Q. H. (2018). Lightning-induced voltages on a distribution line with surge arresters using a hybrid FDTD–SPICE method. IEEE Trans. Electromagn. Compat. 33 (5), 2354–2363. doi:10.1109/tpwrd.2017.2788046
Gao, Y., Han, Y., Xiao, F., Chen, C., Zhang, J., Zhang, J., et al. (2020). Study on lightning protection scheme of multi-terminal MMC-MVDC distribution system. High. Volt. 5 (5), 605–613. doi:10.1049/hve.2019.0256
Gomes, C., and Cooray, V. (2000). Concepts of lightning return stroke models. IEEE Trans. Electromagn. Compat. 42 (1), 82–96. doi:10.1109/15.831708
IEEE Guide for Improving (2011). IEEE Guide for improving the lightning performance of electric power overhead distribution lines. IEEE Stand., 1410–2010.
Li, Z., Xu, Y., Wang, P., and Xiao, G. (2023). Coordinated preparation and recovery of a post-disaster multi-energy distribution system considering thermal inertia and diverse uncertainties. Appl. Energy 336, 120736. doi:10.1016/j.apenergy.2023.120736
Li, Z., Xu, Y., Wang, P, and Xiao, G. (2024). Restoration of multi energy distribution systems with joint district network recon figuration by a distributed stochastic programming approach. IEEE Transactions on Smart Grid, 1. doi:10.1109/TSG.2023.3317780
Liu, X., and Fan, Z. W. (2019). Macromodel of lightning induced overvoltages on overhead lines and calculation of lightning flash-over rate. J. North China Electr. Power Univ. 46 (2), 69–75.
Massague, E. B., Sumper, A., He, J. L., and Rull-Duran, J. (2015). Optimization of surge arrester locations in overhead distribution networks. IEEE Trans. Power Deliv. 30 (2), 674–683. doi:10.1109/tpwrd.2014.2312077
Michishita, K., Ishii, M., Asakawa, A., Yokoyama, S., and Kami, K. (2003). Voltage induced on a test distribution line by negative winter lightning strokes to a tall structure. IEEE Trans. Electromagn. Compat. 45 (1), 135–140. doi:10.1109/temc.2002.808044
Nucci, C. A., Diendorfer, G., Uman, M. A., Rachidi, F., Ianoz, M., and Mazzetti, C. (1990). Lightning return stroke current models with specified channel-base current: a review and comparison. J. Geophys. Res. Atmos. 95 (D12), 20395–20408. doi:10.1029/jd095id12p20395
Paolone, M. (2001). Modeling of lightning-induced voltages on distribution networks for the solution of power quality problems and relevant implementation in a transient program. Ph.D. dissertation (Emilia, Romagna: Bologna University).
Rachidi, F. (1993). Formulation of the field-to-transmission line coupling equations in terms of magnetic excitation field. IEEE Trans. Electromagn. Compat. 35 (3), 404–407. doi:10.1109/15.277316
Rakov, V. A., and Uman, M. A. (1998). Review and evaluation of lightning return stroke models including some aspects of their application. IEEE Trans. Electromagn. Compat. 40 (4), 403–426. doi:10.1109/15.736202
Rizk, M. E. M., Lehtonen, M., Baba, Y., and Ghanem, A. (2020). Protection against lightning-induced voltages: transient model for points of discontinuity on multiconductor overhead line. IEEE Trans. Electromagn. Compat. 62 (4), 1209–1218. doi:10.1109/temc.2019.2940535
Santos, M. N. N., and Piantini, A. (2021). Characteristics of lightning-induced voltages based on experimental data. High. Volt. 6, 555–561. doi:10.1049/hve2.12055
Tatematsu, A., and Noda, T. (2014). Three-dimensional FDTD calculation of lightning-induced voltages on a multiphase distribution line with the lightning arresters and an overhead shielding wire. IEEE Trans. Electromagn. Compat. 56 (1), 159–167. doi:10.1109/temc.2013.2272652
Taylor, C. D., Satterwhite, R., and Harrison, C. (1965). The response of a terminated two-wire transmission line excited by a nonuniform electromagnetic field. IEEE Trans. Antennas. Propag. 13 (6), 987–989. doi:10.1109/tap.1965.1138574
Thang, T. H., Baba, Y., Piantini, A., and Rakov, V. A. (2015). Lightning-induced voltages in the presence of nearby buildings: FDTD simulation versus small-scale experiment. IEEE Trans. Electromagn. Compat. 57 (6), 1601–1607. doi:10.1109/temc.2015.2457951
Vasconcellos, F. D., Alípio, R., and Moreira, F. (2022). Evaluation of the lightning performance of transmission lines partially protected by surge arresters considering the frequency-dependent behavior of grounding. IEEE Lat. Am. Trans. 29 (2), 352–360.
Wang, X., Wang, S. C., He, J. L., and Zeng, R. (2012). Lightning induced overvoltage characteristics of 10 kV overhead distribution lines with surge arresters. Power Syst. Technol. 36 (7), 149–154.
Yang, J., Xiu-Shu, Q., Jian-Guo, W., Yang, Z., Qi-Lin, Z., Tie, Z., et al. (2003). Observation of the lightning_induced voltage in the horizontal conductor and its simulation. Acta. Phys. Sin. 57 (3), 1968–1975. doi:10.7498/aps.57.1968
Yang, N., Dong, Z. Q., Wu, L., Zhang, L., Shen, X., Chen, D., et al. (2022a). A Comprehensive review of security-constrained unit commitment. J. Mod. Power Syst. Clean Energy 10 (3), 562–576. doi:10.35833/mpce.2021.000255
Yang, N., Qin, T., Wu, L., Huang, Y., Huang, Y., Xing, C., et al. (2022b). A multi-agent game based joint planning approach for electricity-gas integrated energy systems considering wind power uncertainty. Electr. Power Syst. Res. 204, 107673–107713. doi:10.1016/j.epsr.2021.107673
Yokoyama, S., Miyake, K., and Fuki, S. (1989). Advanced observations of lightning induced voltage on power distribution lines (II). IEEE Trans. Power Deliv. 4 (4), 2196–2203. doi:10.1109/61.35647
Yu, J. L., Geng, Y. B., Fan, Y. D., Wang, J. G., Lu, Z. W., and Cai, X. J. (2019). Lightning induced voltage characteristics of overhead single wire. High. Volt. Eng. 45 (9), 2911–2918.
Yu, J. L., Fan, Y. D., Wang, J. G., Cai, L., and Zhou, M. (2020). Effect of earth conductivity and length of line on lightning induced voltage of 10kV overhead distribution lines. Proc. CSEE 40 (2), 672–683.
Yu, J. L., Fan, Y., Wang, J., Qi, R., Zhou, M., Cai, L., et al. (2017). Characteristics of the horizontal electric field associated with nearby lightning return strokes. J. Atmos. Solar-Terrestrial Phys. 154, 207–216. doi:10.1016/j.jastp.2016.02.017
Yu, J. L., Zhang, Y. D., Cheng, L., and Lu, Z. W. (2022). Characteristics of lightning induced voltage on overhead distribution lines and performance analysis of analytical algorithm. Control Theory and Appl. 39 (5), 941–949.
Zeng, R., Zhuang, C., Zhou, X., Chen, S., Wang, Z., Yu, Z., et al. (2016). Survey of recent progress on lightning and lightning protection research. High. Volt. 1 (1), 2–10. doi:10.1049/hve.2016.0004
Zhang, J. B., Wang, L., Liang, S. B., Peng, X. Y., Zhang, Q. L., and Tang, Y. L. (2019a). Influence of mountain topographic slope and stratified conductivity structure on lightning induced voltages. High. Volt. Eng. 45 (9), 2936–2944.
Zhang, L., Wang, L., Yang, J., Jin, X., and Zhang, J. (2019b). Effect of overhead shielding wires on the lightning-induced voltages of multiconductor lines above the lossy ground. IEEE Trans. Electromagn. Compat. 61 (2), 458–466. doi:10.1109/temc.2018.2825287
Zhang, Q. L., Tang, X., Hou, W. H., and Zhang, L. (2015). 3-D FDTD simulation of the lightning-induced waves on overhead lines considering the vertically stratified ground. IEEE Trans. Electromagn. Compat. 57 (5), 1112–1122. doi:10.1109/temc.2015.2420653
Keywords: lightning-induced voltage, agrawal model, indirect lightning withstanding level, lightning position, negative-polarity oscillation, surge arrester
Citation: Yu J, Gu S, Liu J and Liu H (2024) Indirect lightning performance of 10-kV overhead distribution lines. Front. Energy Res. 12:1367183. doi: 10.3389/fenrg.2024.1367183
Received: 08 January 2024; Accepted: 13 March 2024;
Published: 26 March 2024.
Edited by:
Zhengmao Li, Aalto University, FinlandReviewed by:
Yan Zhang, Hebei University of Science and Technology, ChinaDongxin He, Shandong University, China
Copyright © 2024 Yu, Gu, Liu and Liu. This is an open-access article distributed under the terms of the Creative Commons Attribution License (CC BY). The use, distribution or reproduction in other forums is permitted, provided the original author(s) and the copyright owner(s) are credited and that the original publication in this journal is cited, in accordance with accepted academic practice. No use, distribution or reproduction is permitted which does not comply with these terms.
*Correspondence: Shanmao Gu, MjAxMTExNzhAd2Z1LmVkdS5jbg==; Jianli Yu, eXVfamlhbmxpQGZveG1haWwuY29t