 Zekai Qiu1*
 Chenjie Tong
 Yufan Lu
- 1Power Research Institute of State Grid Shaanxi Electric Power Co., Ltd., Xi’an, China
- 2School of Electrical and Electronic Engineering, North China Electric Power University, Beijing, China
Along with the increasing low-carbon demand of the power system, the access of a high percentage of renewable energy resources to the distribution network has a large impact on the voltage fluctuation of the system and reduces the operational reliability. In this paper, we consider utilizing the reactive capacity of distributed resources to participate in system voltage regulation to reduce node loss of load probability (LOLP) caused by node overvoltage faults and propose an overvoltage risk regulation strategy for the interaction between distribution network operators (DSOs) and distributed users in the framework of the Stackelberg game. First, the nodes are clustered and analyzed based on the two-dimensional indexes of node voltage regulation ability, and different voltage regulation compensation tariffs are assigned. Second, the cost-benefit model of voltage regulation for the leader and follower sides and the node LOLP model are constructed to measure the reliability of the system. The Stackelberg game is used to co-optimize the two parties’ compensation tariffs and voltage regulation strategies. The optimal solution of voltage regulation under the equilibrium of the game is obtained by solving using the particle swarm optimization (PSO) algorithm. Based on the IEEE-33 node system, a case study is carried out to verify that the proposed overvoltage risk regulation strategy can maximize the benefits of the regulator participants while enhancing the operational reliability of the system.
1 Introduction
Under the guidance of the “double carbon” policy and the demand for reducing carbon emissions, the country is fully developing renewable energy generation technology and significantly increased distributed photovoltaic (PV) capacity. By the end of June 2023, the total installed PV capacity in China reached 470 million kilowatts, of which distributed PVs accounted for 42.12%. When large-scale distributed PV resources access a distribution system, the variety of distributed resources supply varied levels of energy and power, and the grid voltage distribution is affected, which can lead to voltage fluctuations or even overvoltage and bring challenges to stable grid operations (Sun et al., 2023).
To address the randomness and volatility of distributed resources, studies have proposed the use of distributed photovoltaic power as a voltage regulator to participate in voltage regulation. However, the strategy has certain shortcomings due to the limitation of photovoltaic inverter voltage regulation capacity. Currently, distributed energy storage (DES) is one of the main flexible scheduling grid resources under the background of a high penetration rate of distributed PVs, and its charging and discharging process can realize the mutual conversion of AC and DC. The addition of energy storage resources to the distribution network is an inevitable trend in the future development of the grid. Therefore, it is important to study the collaboration of multiple distributed energy storage resources to reduce the probability of overvoltage in the distribution network and enhance the reliability of the system operation and the revenue of voltage regulation and control (Sun et al., 2005). Zhang et al. (2019) used a combination of DES and traditional energy storage, reactive power, and active charge and discharge control to completely optimize and regulate network node voltage. Another approach constructs voltage state awareness indicators to provide accurate detection of the distribution network voltage states and uses DES to participate in the auxiliary conventional regulation and dynamic reactive power support, providing rapid response to the demand for regulating the voltage (Huang et al., 2020; Niu et al., 2022). Cai et al. (2019) put forward a method of centralized and local two-stage voltage control with an inverter that ensures the optimization of the whole network voltage on the time scale of minutes with real-time monitoring of the local voltage and dynamic adjustment of the reactive power output. In addition, considering the independent autonomy and flexible control capability of the microgrid, the DES resources are used to establish a voltage optimization and control model for coordinating the microgrid with the distribution network at a hierarchical level (Sun, 2019; Ren, 2022; Li et al., 2023; Yang et al., 2023).
Hu et al. (2022) considered the risk of overvoltage faults and economic benefits, effectively improving the reliability of system operations. The current methods for using multiple distributed resources to manage voltage regulation can be mainly categorized into two means of reactive power compensation (Ye, 2021) and active reactive synergy (Hu et al., 2020) voltage regulation. Ye (2021) considered the stochasticity of multi-generation systems in microgrids and constructed a microgrid reactive-voltage regulation model based on fuzzy chance constraint planning for hydropower-wind power-PV to reduce voltage offset and network loss. Hu et al. (2020) regulated voltage for distributed PV resources and utilized PV inverters to coordinate the active and reactive outputs to satisfy the regulating reactive power demand of each node.
Existing studies mainly consider two strategies to efficiently use distributed resources to solve the overvoltage faults: direct and indirect control. The former generally models the optimization problem as a multi-objective optimal power flow problem with the objective of minimizing the network loss and the distribution network nodes’ voltage offset (Li Cuiping et al., 2021; Li Yanjun et al., 2021). Indirect control considers the market policy or incentive tariffs, etc., utilizes distributed resources to participate in the distribution network regulation and auxiliary service market, and optimizes the incentive tariff and voltage regulation power strategy through a game between multiple subjects in the distribution system to achieve the purpose of distribution network overvoltage regulation and control (Yu et al., 2022).
The above literature has investigated different methods and strategies for a single distributed resource subject to participate in grid overvoltage fault regulation, but some remaining problems need to be investigated. First, the current research on the high penetration of distributed PVs includes certain limitations in considering only the single subject of distributed PV or energy storage to participate in voltage regulation, and it is difficult to adapt to the future trend of multi-distributed resource synergism. Second, after evaluating the system’s regulating characteristics of benefits under the condition of DES at each node to participate in voltage regulation, few studies have considered the system operational reliability assessment metrics under the probability of system overvoltage and loss of loads (Xiong and Xu, 2018; Xie et al. 2023) or how to construct a suitable model to achieve the synergistic optimization of a wide range of distributed resources participating in distribution network voltage regulation, which is a new direction and trend of current research.
To address these shortcomings, this paper takes distributed resource clusters and distribution network operators as research objects, utilizing DES reactive resources to compensate for the reactive power demand of distributed photovoltaic voltage regulation, which can be seen as voltage-var control. A risk regulation strategy based on the Stackelberg game framework for multi-distributed resources is proposed that focuses on the problem of multi-distributed resources cooperatively participating in distribution network voltage regulation to enhance the reliability of system operation. The main contributions of this paper include the following:
1) Taking distributed resource clusters and distribution network operators as research objects, a distribution network overvoltage regulation and operation reliability improvement strategy considering the collaboration of multiple distributed renewable resources is developed, which is realized through the Stackelberg game between two subjects, namely, DSOs and distributed resource users.
2) The reactive-voltage sensitivity and voltage regulation capacity of nodes are used as two-dimensional indicators, and the nodes are clustered to classify nodes and assign different compensation tariffs.
3) The costs of voltage regulation and voltage offset are considered to construct the objective function of both based on the Stackelberg game and, at the same time, establish the voltage-based node loss of load probability (LOLP) model to assess the operational reliability of the system. Finally, the traditional particle swarm optimization (PSO) algorithm is used to solve the large-scale nonlinear problem under the framework of the Stackelberg game because the PSO approach is relatively simple and has a better solution and convergence speed under the demand of solving accuracy.
The remainder of the article is structured as follows: Section 2 establishes the basic framework and control of distributed photovoltaic capacity and energy storage; Section 3 gives the regulating performance indexes and performs the cluster analysis; the construction of the cooperative regulating model of multiple renewable resources based on the Stackelberg game is presented in Section 4; Section 5 gives the proof of game equilibrium solution of the proposed Stackelberg game model; the solution method based on the PSO algorithm is introduced in Section 6. The case studies and the conclusions are provided in Sections 6 and 7, respectively.
2 Basic framework and control of distributed photovoltaic and energy storage
2.1 System framework
The system framework for distribution network voltage regulation considering distributed resources is shown in Figure 1 below. The energy management system (EMS) of the distribution system operator (DSO) on the leader side is used to collect distribution system parameters and operation data and calculate the power flow accordingly. The distributed resources, that is, the distributed PV and DES resources, are managed and operated by the follower side. Distributed PVs adopt the main operation mode of “self-generation and self-consumption and on-grid storage,” which improves the self-generation and self-consumption rate of the PV system. At the same time, the PV system can switched between selling electricity or storing it in the DSO system according to the price of the electricity from the distribution grid, and the two participate in and interact with the DSO to regulate the voltage process. The PV and energy storage synergistically participate in the interactive voltage regulation process with the DSO. The corresponding user energy management system (UEMS) is installed, which is used to receive signals from the distribution grid and calculate and modify its active or reactive-voltage regulation strategy.
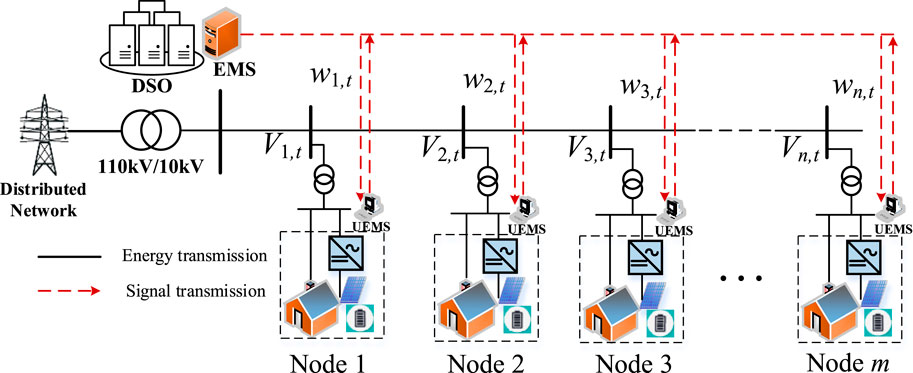
Figure 1. Overall framework.
In addition, the above EMS collects distributed PVs and energy storage parameters to grade different distributed resources and determine their voltage regulation compensation tariffs, respectively. The follower responds to the DSO’s compensation tariffs at all levels to allow their distributed PVs and energy storage to participate in voltage regulation power strategy based on their respective optimization objectives under the premise of ensuring the overall safe operation of the distribution network to achieve the coordinated and optimized choice of voltage regulation strategy.
2.2 Distributed PVs and DES cooperative control mode
DES is considered in the traditional distributed PV distribution network voltage regulation method, and the reactive compensation of energy storage is utilized to enhance the active output capability of distributed PVs (Saboori et al., 2015).
Distributed PV voltage regulation generally adopts two main modes: reactive power regulation and joint active reactive power regulation. Usually, reactive power regulation of distributed PV is used, using the reactive capacity of the grid-connected converter of the PV device to absorb or release reactive power, change the injected power of the node, and then regulate the voltage of each node of the distribution network according to the change of the system power flow. In the case of a severe overvoltage problem, reactive power regulation alone cannot meet the demand for voltage regulation. Such a situation requires reducing the active output capacity of the PV inverter to support reactive power regulation, but this approach also reduces the PV power generation revenue.
The addition of DES to user-side distributed PVs can solve the problem of reduced revenue due to PV active reduction. The energy storage converter can be used to provide reactive power and meet the overall demand for voltage regulation of the distribution network, effectively reducing the use of the PV inverter’s active output channel. However, the cost of energy storage equipment must also be considered.
3 Nodal hierarchical model considering voltage support and regulation capacity
3.1 Voltage regulation performance indicators
A distributed PV and energy storage system collaboratively participates in the voltage regulation process through reactive power regulation, which can directly regulate the node voltage without affecting the PV active power output. In practice, in the case of low-voltage distribution lines, resistance is not much less than the reactance. Although the active power has an impact on the node voltage, the cost of active voltage regulation is high, which means only considering reactive-voltage regulation is much more economical. Geng (2023) pointed out that the greater the reactive power support provided by the new energy unit, the greater the active power margin at the nodes of the distribution network system. That is, in the case of only relying on reactive power to meet the demand for voltage regulation, reducing the active participation in regulating the voltage can improve the system voltage regulation capability and reduce costs. This paper focuses on the relationship between reactive power and the system node voltage and participation in the auxiliary services market.
Considering the sensitivity index of power to node voltage, based on the assumptions mentioned above, the effect of reactive power support of distributed PVs and DES on the sensitivity of node voltage is investigated as Eqs (1)–(2):
where Spv,I,j,t and Sdes,i,j,t are reactive-voltage sensitivity for distributed PVs and DES, respectively, and ΔUi,t、ΔQpv,j,t, and ΔQdes,j,t are voltage magnitude increment at node i and the reactive power increment at node j provided by distributed PVs and DES, respectively.
To study the reactive-voltage regulation capability of distributed resources, considering the different mechanisms of providing reactive power for both distributed PVs and DES, it is considered that the amount of voltage variation at node i can be expressed by the voltage-reactive sensitivity of the two voltage-reactive sensitivities of distributed PVs and DES as Eq. (3):
Because the reactive-voltage sensitivity of each node is different, the support degrees of their respective node voltages are also different. For the system node overvoltage problem, the reactive-voltage support that each node can provide under different overvoltage severities is considered (Ji et al., 2020). The reactive-voltage support degree ξi,t of node i at moment t is defined as Eqs (4)–(5):
where sevivolt is the voltage crossing severity of node i, Kivolt denotes the set of all situations that cause node i overvoltage fault, and vub and vlb are the upper and lower bounds of the normal operating voltage allowed for node i, respectively. Exceeding the range results in a voltage collapse or low-voltage instability, which can affect the reliability of the distribution system.
The reactive-voltage sensitivity provided by the node through distributed PVs and DES under different overvoltage severities defines the index of support degree. A higher support degree indicates that the distributed PVs and storage reactive power provided by the node can effectively support the node overvoltage faults, corresponding to a higher reactive-voltage regulation benefit.
The total reactive power capacity that can be provided by distributed PVs and DES at each node is further considered. For distributed PV inverters, there is the following constraint between apparent power and active reactive power as Eq. (6):
where Ppv,i,t is the active power of the distributed PVs at node i at time t, Q0,i,t is the initial reactive power of the PVs before voltage regulation, and Sapp pv,i is the total capacity of the PV inverter at node i.
When using distributed PV and DES in a reactive-voltage regulation target, the energy storage equipment operations and maintenance costs are relatively high. Therefore, two operating modes are specified for the first full use of the reactive capacity of the PVs, when the PV nodes can provide the maximum value without cutting the active PV output. Through the reactive regulator storage, the total reactive capacity of each node in the time of t and the lower and upper bounds of ΔQmax, i,t and ΔQmin, i,t are as Eq. (7):
where Qdes,t is the reactive capacity available for energy storage for each node.
3.2 Hierarchical modeling of distributed PVs and DES
For the multi-node voltage regulation demand of the distribution system, the DSO incentivizes the participation of customer-side DES in the voltage regulation auxiliary service market through the voltage regulation compensation tariff. To reduce the investment cost, the DSO dynamically sets the respective compensation tariffs based on the voltage regulation performance of each node.
Using reactive-voltage support ξi,t and node reactive regulating capacity ΔQ as regulating performance indicators mentioned above, DSO takes these two indicators as two-dimensional variables, utilizes the K-means++ clustering algorithm to realize the similarity clustering purpose, and classifies the user nodes with similar reactive regulating performance into the same class. Compared with the traditional K-means clustering method, which optimizes the selection of initial cluster centers, the K-means++ clustering algorithm improves the clustering accuracy and reasonableness and avoids the influence of clustering when the initial cluster centers are in the same cluster. The clustering results can be changed to meet practical needs by adjusting the weights of the two-dimensional parameters.
The similarity index of the regulator performance after parameter normalization is expressed by the Euclidean distance as follows:
where in Eq. (8), dij,k denotes the deviation value of the regulation similarity index of nodes i and j determined by the two-dimensional parameters; ||·||k 2 denotes the solved two-paradigm number, and k1 and k2 are the weights of the two-dimensional parameters of reactive power support and reactive power regulation capacity, respectively, and k1+k2 = 1. Eq. 9 denotes the normalization and unification of the two-dimensional parameters, which is convenient for the computation of the parameters with different scales.
From the definition of the deviation value, the smaller the similarity index, the smaller the regulating variability between nodes i and j, the higher the probability of being classified into the same class, and the same initial regulating compensation tariff provided by the DSO to each node within the same classification.
4 Stackelberg game model for hierarchical voltage regulation
4.1 Leader and followers benefit model
Through the above hierarchical strategy, the multi-distributed resources on the user side are integrated to realize the regulated compensation tariff given by level. On this basis, we analyze the coordination and optimization process between the DSO and the distributed photovoltaic storage users and establish a Stackelberg game model between the DSO and the distributed photovoltaics with storage. The leader side for the DSO issues the regulation compensation tariff information to the follower side according to the real-time state of the distribution network proposed regulation demand, which incentivizes the follower side to participate in the distribution network regulation process. The distributed photovoltaic storage user level responds to the leader side of the compensation tariff by giving a specific distributed PV and energy storage coordination regulation strategy to participate in the auxiliary services market. The leader–follower interaction principle is shown in Figure 2 below. Both sides complete the optimization process of distribution network voltage regulation through the interaction of the compensation tariff and voltage regulation strategies.
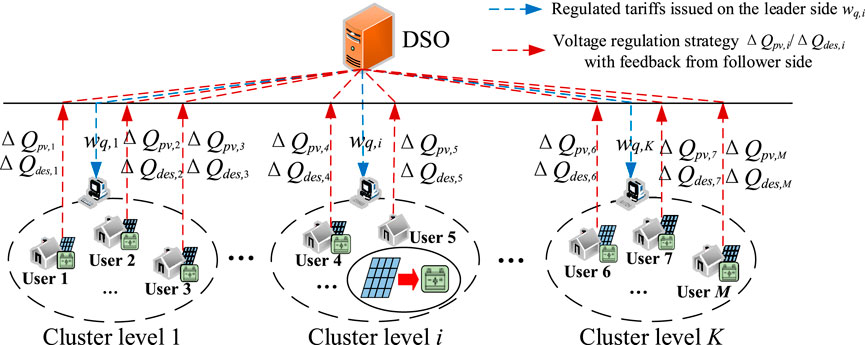
Figure 2. Principle of leader and follower interactions.
In the figure, the regulated compensation tariff for distributed photovoltaic storage class k is denoted as wk,t, and the regulated strategy for node i in the distribution network is denoted as ΔPi,t, ΔQi,t.
The benefit functions of different subjects in the Stackelberg game are different. The optimization objectives of both the leader and the follower are analyzed below and are also shown in Figure A1 in the appendix.
4.1.1 Optimization of the distributed service organization
The DSO on the leader side pursues the minimization of the overall regulation cost with respect to the system regulation objective under the premise of ensuring the safe operation of the system, i.e., the voltage deviation at each node is as small as possible within the permissible range. The objective function is as follows:
where wk,t is the DSO regulation compensation tariff of the optical storage users in the k-th grading at the time t, which needs to be optimally adjusted according to the regulation strategy of the follower-side response; K is the total number of hierarchical levels of the user-side grading strategy, and nk is the total number of distributed PVs and energy storage users in the k-th grade; δ is the cost coefficient for the voltage deviation constraints; and Ui,t and Ui,ref are the voltage magnitude and the reference voltage value of the node i at time t, respectively.
Meanwhile, based on the voltage regulation strategy of the distributed users on the follower side, the leader side calculates the system branch power flow and thus optimizes the compensation tariffs. During system operation, the AC power flow is commonly used to describe the electric power flow distribution in the distribution network (Zhang et al., 2023a; Zhang et al., 2023b). Therefore, it is necessary to ensure that the variables such as node voltages and branch active and reactive power flows in the voltage regulation process satisfy the following constraints as Eqs (11)–(17):
where Pi,t and Qi,t are the active and reactive power injected by node i at moment t, respectively; θij is the phase difference of the electrical angle between nodes i and j at time t; Gij and Bij are the conductance and the susceptance of the branch ij, respectively; Pij,t is the active power flow through the branch ij at moment t; Ui,t is the voltage corresponding to the node i at time t; and Umax,i,t and Umin,i,t are the upper and lower bounds of the node’s voltage. Similarly, Pmax,ij,t and Pmin,ij,t are the upper and lower bounds of the active power flow currents of the branch, respectively.
4.1.2 Distributed PV and DES on the user side
The benefits of the distributed PV and ES on the user side mainly include the benefits of participating in the distribution network’s auxiliary voltage regulation services from the user side, the operation and maintenance costs of the distributed PVs and DES equipment, and the degradation cost of the storage equipment over time:
where in Eqs (18)–(19), Ri,t is the net benefit of node i at time t, Rreg,i,t is the auxiliary service benefit of the user side participating in voltage regulation, and Csum,i,t is the sum of the costs at node i at time t.
According to the severity of the overvoltage, the utilization of DES can be mainly categorized into two types of voltage regulation, in which the DES participates in the reactive-voltage regulation process as a PV backup.
1) Distributed PV reactive power regulation only
When the network’s overvoltage condition is mild and acceptable, the amount of reactive power regulation required for voltage regulation does not exceed the upper limit of distributed PV regulation on the user side, i.e., ΔQi,t≤ΔQPV,i,t,max, and at this time, the active output of PV is normal, and there is no need to invoke the storage reactive power. At the same time, due to the distributed PVs, reactive power does not produce direct revenue. The main consideration of reactive power demand on the active output capacity use is the potential loss of output caused by the part of the originally available active power used for reactive-voltage regulation. The cost is expressed as follows:
where cpv is the feed-in tariff for distributed PV trading with the grid, and α is the utilization rate of the capacity occupied by the PV inverter for reactive regulation, that is, the ability of the PV inverter to generate active output. The higher the utilization rate of the same capacity, the greater the loss of active output, and the higher the cost of reactive regulation. Si is the rated apparent power of the distributed PVs, Qi,t,ini is the initial reactive power, and ΔQi,t is the reactive power participating in voltage regulation.
The total user-side gain out of node i at time t for this reactive power regulation is expressed as follows:
2) Cooperative regulation between distributed PV and DES
When the network’s overvoltage condition is severe, the reactive capacity required for voltage regulation exceeds the upper limit of PV regulation, i.e., ΔQi,t>ΔQPV,I,t,max. In this case, the reactive power from DES is called upon to cooperate with the PVs to regulate the distribution network voltage. The reactive capacity of the PVs is used first, and then, the missing part is provided by the energy storage equipment, which effectively compensates for the active reduction of PV output. The costs of operation and maintenance, degradation, and other costs of calling energy storage must be considered:
where in Eq. (22), β is the utilization rate of the energy storage converter, which is generally greater than the utilization rate of the PV inverter α because the energy storage converter takes into account the conversion of AC and DC; cdes,q is the cost coefficient of reactive power occupancy of the distributed storage capacity, and the portion of the distributed PVs that exceeds the maximum amount of reactive power compensation that can be provided by the storage is supplied by the energy storage.
Because calling on DES resources entails a certain amount of losses on the energy storage device, the consideration of annual equivalent investment costs involving the degradation and maintenance of the energy storage device is as Eqs (23)–(24):
where N is the total number of nodes in the system; cq is the cost of reactive power allocation per unit of energy storage; cm is the fixed cost per unit of energy storage capacity; Qdes,j is the amount of reactive power used by the energy storage at node j to compensate for the support of distributed PV voltage regulation; r is the discount rate; and mdes is the service life of the energy storage equipment (Wu et al., 2018; Li et al., 2023). This paper takes 1 year as the time scale for the calculation of the operation and maintenance cost.
In summary, when distributed PVs and DES are synergistically involved in the reactive-voltage regulation process, the total benefit to users is expressed as Eq. (25):
Because distributed storage provides reactive compensation for the regulation gap, PVs do not need to meet the regulation demand by curtailing active output. The amount of reactive power absorption involved in voltage regulation is constrained by the regulation capacity as Eq. (26):
At the same time, the following constraints of Eqs (27)–(28) exist on the state of charge of the energy storage device:
where SoCmax,i and SoCmin,i are the upper and lower limits of the charge state of the energy storage device, respectively. cdes,i is the upper limit of the DES capacity at node i. η0 is the charging and discharging efficiency of the energy storage, and Eq. 27 is the relationship of the charge state at adjacent times at the same node.
4.2 Stackelberg game model
Based on the above objective functions of the distribution network operator and the user-side distributed storage, the compensation tariff provided by the DSO to incentivize the users to participate in voltage regulation is adjusted according to the actual participation strategy of the user-side voltage regulation. The relationship aligns with the Stackelberg game model, i.e., the DSO is the leader, the user-side distributed storage is the follower, and a “leader and multiple followers” cooperative voltage regulation model is constructed.
The objective functions of the different sides in the Stackelberg game are not completely opposite but have a certain order of priority. The primary consideration of the leader side is the DSO’s objectives, and then, the leader and follower sides must adjust their own strategies according to the other side’s strategy. When the leader side of the compensation tariff is too low, it is difficult to incentivize user-side optical storage to participate in the distribution network regulator auxiliary services market. In contrast, insufficient user-side participation in regulating reactive power can affect the reliability of the distribution network operation and prompt the DSO to adjust the compensation tariff. The two sides interact to reach equilibrium solutions. Let the Stackelberg game be ψ, and then, it can be expressed as follows:
where F is the follower, i.e., the user-side distributed PVs and DES system; S is the interaction strategy of the Stackelberg game parties; and R is the gain of the game parties, which can be expressed as follows:
Among Eqs (29)–(31), the strategy set of the leader side is the voltage regulation compensation tariff of each hierarchical subject and that of the follower side is the reactive power of each distributed node participating in voltage regulation. Meanwhile, the leader-side DSO benefit–cost relationship can be deduced from the objective function of the leader and follower sides in Section 4.1. The benefit set of the user side under different voltage crossing severities is constructed, which corresponds to the objective functions Eqs 10, 20; Eq. 24. Based on the above strategies and revenue sets, the Stackelberg game is used to optimize the voltage regulation strategy of voltage regulation compensation tariff and user-side distributed PVs and energy storage.
4.3 Voltage-based model of node loss of load probability
Based on the above Stackelberg game optimization model considering the respective benefits of the DSO and the user side, a system LOLP model considering the node voltages is introduced for assessing the operational reliability of the system.
In the case of high or low distribution network node voltage, the system's low-voltage protection or overvoltage load-shedding device operates to shut down the system node failure. Combined with the actual operation logic, when the node voltage varies within the normal operating range, the node LOLP should be almost unaffected by the voltage and be a small value. When the node voltage exceeds the setting limit value of the protection device, and the system is shut down, the node LOLP will be 1. When the node voltage fluctuates between the rated value and the limit value, the node LOLP will be 100%. When the nodal voltage fluctuates between the rated value and the limit value, the voltage-based nodal LOLP model is established by the linear fitting method as Eq. (32):
where Pab(V) is the node failure LOLP associated with the node voltage; P0 ov is the historical statistical value of the node equipment failure rate where the node voltage is in the normal operating range; VN,max and VN,min are the upper and lower bounds of the node voltage rating, respectively; and Vmax and Vmin are the upper and lower bounds of the node voltage’s limit value, respectively.
5 Equilibrium solution uniqueness proof and method
5.1 Proof of uniqueness of game equilibrium solutions
The game in the model above reaches a Stackelberg equilibrium when both the leader and follower reach the optimal response according to their respective strategies at the same time. Let the set of strategies at the equilibrium point of the game be {w*k,t; ΔQ*1,t,ΔQ*i-1,t,ΔQ*i,t}, under which the Stackelberg game achieves the optimal coordination result. In other words, the equilibrium solution of the regulation response strategy for the fixed follower side is available for any compensation tariff wk,t of the leader-side distribution network operator.
The energy storage operator plans the storage configuration capacity at each node on the grid side with the objective function of minimizing the total cost, where the total cost consists of the total investment cost, the operations and maintenance costs, and the operator’s arbitrage revenue, whose objective function over the planning horizon is expressed as
Similarly, the equilibrium solution of the compensation tariff for a fixed DSO for any regulation strategy ΔQi,t of the user-side distributed PVs and DES cooperative regulation is
The uniqueness conditions for the existence of a Stackelberg equilibrium solution to guarantee the existence of the model are as follows:
1) In the Stackelberg game framework, the respective strategy sets of the leader and follower sides are non-empty tight convex sets.
2) When the leader-side voltage regulation compensation tariff is determined, there must exist a unique optimal solution in the user-side voltage regulation strategy.
(3) When the follower-side voltage regulation strategy is determined, there exists a unique corresponding optimal strategy in the leader-side compensation tariff.
The following is a brief proof of the existence and uniqueness of the equilibrium solution of the interaction game between the leader-side voltage regulation tariff and the follower-side voltage regulation strategy proposed in this paper.
For the given premise of the leader-side DSO regulation compensation tariff, all follower sides exist and have a unique optimal solution. Taking negative values for the benefit function of the user-side distributed solar storage and transforming it into a cost minimization objective, the existence of a unique optimal solution for the follower side can be proved by the property that the local minimum point of the convex function coincides with the global minimum point by using the positivity and negativity of the first- and second-order derivatives.
When ΔQi,t≤ΔQPV,i,t,max, obtain the first-order derivatives of the regulation strategy ΔQi,t for a negative follower-side regulation cost function:
When Eq. 33 is set to equal 0, the follower-side regulation strategy ΔQi,t for the corresponding case can be obtained as follows:
Then, solving the cost function for the second-order partial derivatives of the voltage regulation strategy becomes
Because the second-order derivative is constant greater than 0, the first-order derivative is monotonically increasing, and there is a zero point of the first-order derivative. Then, the cost function has a unique minimum, and there is a unique optimal solution for the revenue. The same is true when ΔQi,t>ΔQPV,i,t,max.
At the same time, under the circumstance that the distributed photovoltaic storage voltage regulation strategy of the follower side is given, there exists a unique optimal solution for the leader-side compensation tariff. The first- and second-order derivatives of the compensation tariff wk,t are found as follows:
where λQ,t(i) is a 0–1 variable indicating whether the cooperative distributed PVs and DES at node i participate in reactive-voltage regulation service or not. λQ,t = 0 indicates that the user side of the node does not participate in reactive power absorption voltage regulation, and λQ,t = 1 is the opposite and corresponds to the unique optimal processing strategy. At this time, we can know that the reactive-voltage sensitivity has a relation as follows:
At this point, the Hessian matrix of the leader-side cost objective function is shown in matrix (41), and the value of its corresponding determinant |H|>0, which means that the Hessian matrix is positive definite, so the leader-side objective function is convex. Therefore, for a given follower-side regulation strategy, there exists a unique equilibrium solution for the DSO to optimize the objective function.
In summary, there exists a unique equilibrium solution for the Stackelberg game model proposed in this article to Eqs (34)–(41) listed above.
5.2 Solving methodology for the Stackelberg game
Solving the large-scale nonlinear planning problems of the leader and follower sides of Eqs. 10, 20; Eq. 24 achieves the equilibrium solution of the distributed optimization objectives of both. To ensure the reliability of the distribution network operation, the fast response and decision-making requirements of the system are higher than the accuracy of the calculation. Heuristic algorithms have obvious advantages compared with the traditional nonlinear optimization solution methods. For general heuristic algorithms, such as the common genetic algorithm (GA) and the differential evolution algorithm (DE), etc., inter-individual selection, mutation, and crossover operations are used to search for the population. However, because the crossover operation has more randomness, the global search is good, but the iteration speed is slow. In contrast, the PSO algorithm is simple and operable, and the particles evolve independently and can be computed in parallel to accelerate the convergence of the algorithm. The global optimal solution can be found quickly through inter-particle cooperation and information interaction, and the global search capability is strong, which is suitable for optimizing continuous variables. Li et al. (2022) introduced inertia weights of the adaptive mechanism to dynamically adjust its convergence speed to avoid PSO getting into a local optimal solution, which can lead to premature convergence. Song (2020) and Ning et al. (2022) considered the complexity of a non-convex planning reactive-voltage optimization model solution, using a highly robust PSO algorithm to solve the model without analyzing the nature of the model itself. In this paper, the PSO algorithm is used to solve the optimization problem model under the proposed Stackelberg game framework, and the solution process is shown in the algorithm flowchart shown in Figure A2 in the appendix.
The PSO algorithm is used to solve the Stackelberg game model, considering the coupling relationship between the leader-side cost and the follower-side voltage regulation strategy, and the specific solution process is as follows:
(1) According to the two voltage regulation performance indicators mentioned in Section 2.1, the distributed photovoltaics and energy storage nodes are clustered and graded, and the voltage regulation compensation tariff wk,t is given to each level based on the clustering results.
(2) The particle swarm initializes the position and speed information on each particle, and the distributed photovoltaics and energy storage nodes find the optimal reactive power regulation strategy {ΔQ*1,t,…,ΔQ*i-1,t,ΔQ*i,t} based on the initial regulating tariffs, regulating demand, and the corresponding revenue objective functions and constraints;
3) The leader side receives the reactive power strategy solved by the follower side and calculates its own gain RDSO,t according to Eq. 21;
4) The particles within the particle swarm iterate, based on the learning factor and their respective velocities, and update the new particle swarm velocity and position information based on the following relationship as Eq. (42), i.e., corresponding to the generation of the new voltage regulation compensation tariff w’k,t:
where ω is the velocity inertia weight of the particle; c1 and c2 are the individual learning factor and the social learning factor; r1 and r2 are the respective corresponding inertia weights; pkbest_i and gkbest_i are the individual and global optimal position coordinates of the ith particle of the kth iteration, respectively.
5) Based on the regulator compensation tariff after the above iterative optimization, perform steps 2 and 3.
6) Continuously iterate and compare the gains before and after each iteration of the main side DSO; if R’DSO,t>RDSO,t, then update the compensation tariff to w’k,t; otherwise, keep the original tariff unchanged;
7) When the maximum number of iterations is reached or the minimum deviation |δ|<ε is satisfied, the algorithm converges, and the iteration ends; otherwise, the iteration continues.
6 Case study
6.1 Case setup
In this paper, the proposed distributed PVs and DES cooperative participation in the optimization strategy of reactive power regulation between the distribution network operator and the user side is simulated and verified based on the IEEE 33-node standard system. For the proposed strategy, the respective configured capacities of distributed PV and storage at each node of the system are given below.
Meanwhile, the model parameters, K-means++ clustering algorithm, and PSO algorithm parameters involved in the modeling process for the leader and follower sides are uniformly given in Table 3
6.2 Optimized results
1) Clustering and cluster segmentation
This article used the clustering algorithm “elbow law” to determine the optimal number of six clusters using the K-means++ algorithm clustering nodes of the IEEE 33-node system and the sum of squares for error (SSE) indicators as the basis for division (Figure 3).
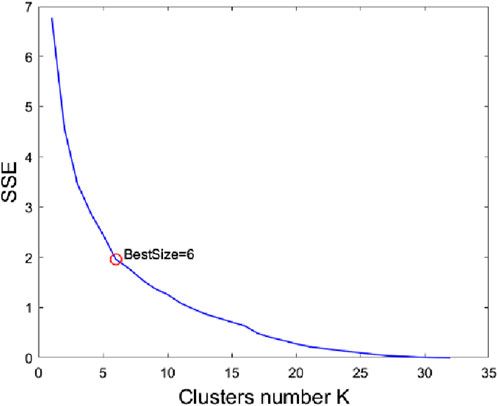
Figure 3. Relationship between the cluster and sum of squared errors (SSE).
Consider a typical overvoltage situation in a distributed PV access node of the distribution grid system, taking into account the relationship between voltage fluctuation with PV output and the output with the light intensity. Ignore the weak influence of weather and other factors, and use 12:00 noon as the example time of day. Based on reactive regulator performance indicators divided into six levels and access to the node of the distribution grid system for sorting, the sorting results corresponding to the various levels of voltage regulator compensation tariffs follow.
In the actual hierarchical process, clustering based on two-dimensional indicators can effectively balance the limitations and differences of a single indicator. Nodes with similar reactive-voltage support and similar reactive-voltage regulation capacity are effectively divided to ensure correct results while improving the solution and convergence speed.
2) Distributed resources synergistic voltage regulation strategy
The distributed PV and energy storage capacity of each node and the model and algorithm parameters are given in Tables 1, 2, based on the hierarchical clustering of system nodes in Table 3. According to the Stackelberg game user-side cooperative optimization basic strategy based on distributed photovoltaic and storage regulating capacity, priority is given to the selection of photovoltaic regulation. When the regulating reactive demand exceeds the photovoltaic capacity, the storage reactive capacity is invoked to continue to support the demand, which effectively avoids the revenue loss caused by the reduction of the photovoltaic active output only to satisfy the reactive power.
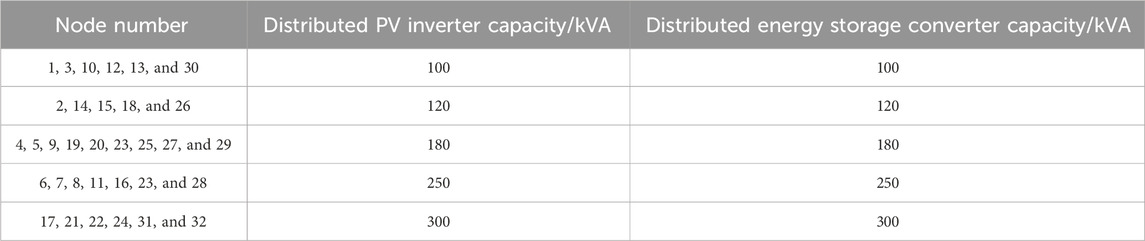
Table 1. PV and DES parameters in an IEEE 33-node system.
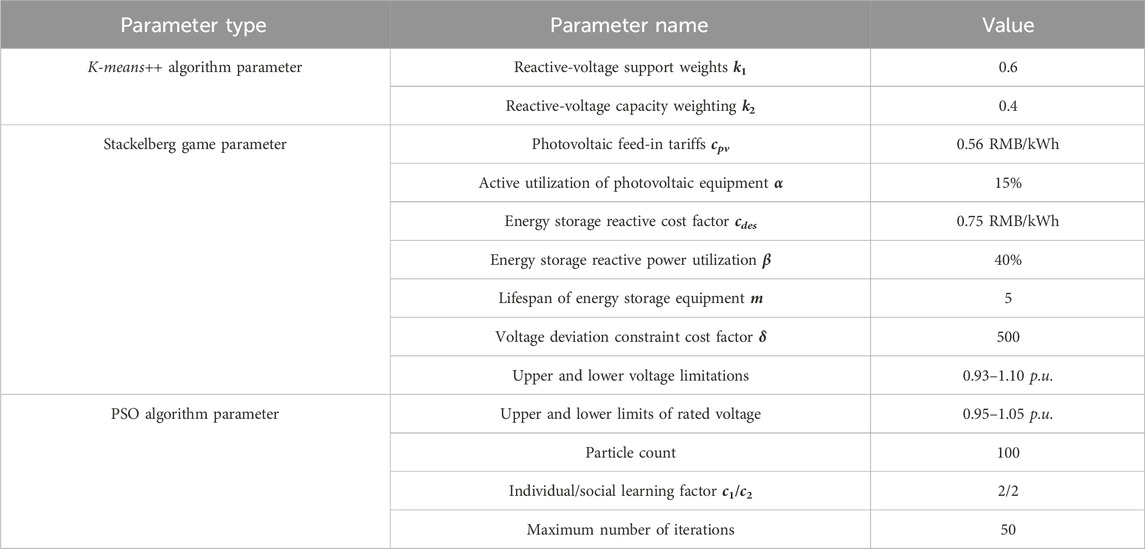
Table 2. Case study parameter settings.
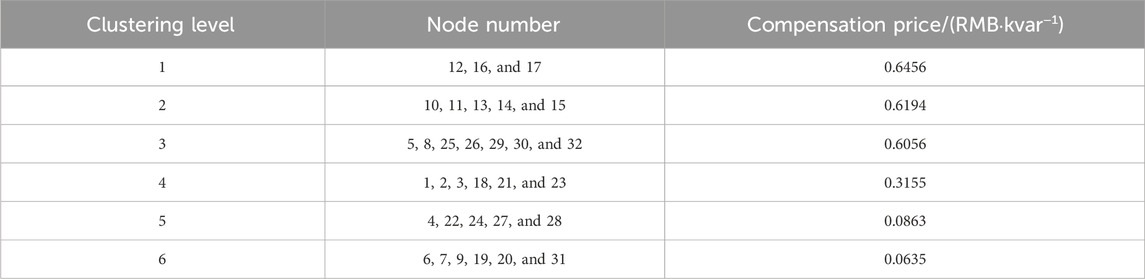
Table 3. Node cluster and compensation price.
Taking the Stackelberg game model in which the leader and follower sides correspond to the optimal objective function as the solution object, the distributed photovoltaics and energy storage voltage regulation strategies of each user node and its corresponding DSO regulation compensation tariff are shown in Figure 4. In this figure, the leader-side compensation tariff is correlated with the node’s total participation in regulating reactive power, which confirms that the leader-side tariff is able to guide and incentivize the follower side to participate in the market of reactive regulating auxiliary services. However, due to the clustering hierarchy, some nodes with similar regulating performance are assigned the same compensation tariff, which has some deviation from the full positive correlation. At the same time, compared with assigning different compensation tariffs to each node, the relative speed of solving is reduced, and the comprehensive benefit is not high even though the reactive-voltage regulation support capacity of each node can be accurately classified.
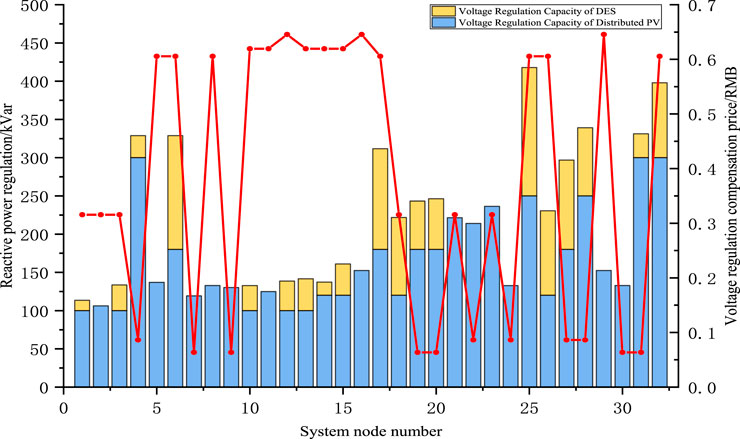
Figure 4. Regulation strategy of PVs, DES, and node prices.
In addition, the energy storage utilization rate of each node is also related to the voltage regulation demand and compensation tariff. The distributed storage reactive power called by each node of the distribution network system in this time period is negotiated with the total storage capacity of the system. The average storage utilization rate of the 33-node distribution network system is calculated to be 16.86%, which is related to the coordinated optimization strategy among distributed PV storage, i.e., the distributed PV reactive capacity is prioritized, and the storage reactive power is used to participate in the voltage regulation later. At some nodes, such as nodes 17, 25, and 26, the energy storage utilization rate can reach 42.25% or even 47.95%, and the corresponding voltage regulation compensation tariffs at these nodes are also relatively high, which shows the effect of the compensation tariff on the user side to incentivize participation through the dual advantages of user income and enhancement of voltage regulation participation.
The above strategy can effectively reduce and eliminate the system node overvoltage problem. The effect of voltage regulation is shown in the figure below. The dashed orange lines indicate the upper and lower limits of the node voltage limits, and the dotted blue lines indicate the upper and lower limits of the node ratings. In the system, the allowable range of voltage is 0.93–1.10 p.u. This is compared with the condition of not adding distributed resources system node voltage fluctuations, and it is shown that adding distributed photovoltaics and energy storage resources through a reasonable reactive-voltage regulation strategy can effectively reduce the overall voltage regulation amplitude.
3) Node loss of load probability reliability and sensitivity analysis
The probability of failure in the distribution system within the normal voltage operation range is selected as P0 ov = 1.67 × 10⁻² as that in Eq. 40, and the mean value of the probability of node loss of load and the proportion of node failure under the three voltage regulation strategies mentioned in Figure 5 are calculated:
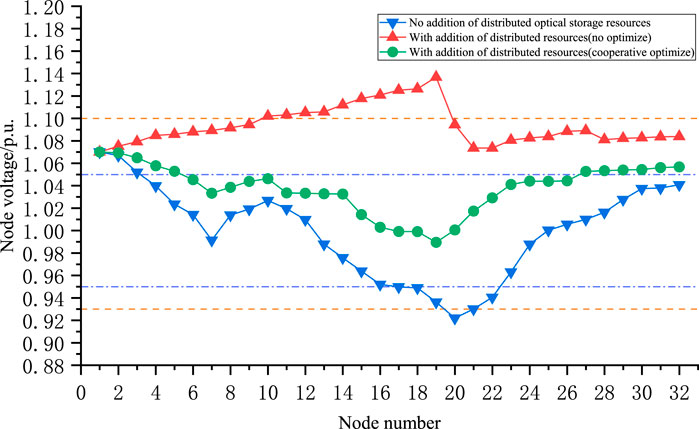
Figure 5. Comparison of system node voltages.
For each operating node within the system, for those nodes with 100% LOLP, node voltage exceeding the upper and lower limits of the limit value is considered the loss of load or node failure (Table 4).
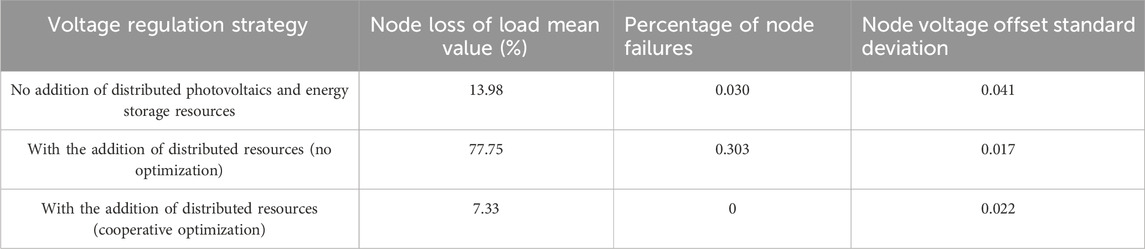
Table 4. Node’s average LOLP and proportion of failure.
Analysis of the results shows that the initial node LOLP without the addition of distributed optical storage resources is 13.98%, but the node voltage magnitude fluctuates greatly within the normal operating range, and the standard deviation of the voltage offset is 0.041. The risk of overvoltage in the background of accessing a high proportion of distributed renewable energy is also relatively high. Using only distributed PV and DES resources to participate in voltage regulation without optimization coordination can reduce the standard deviation of node voltage offset by 58.53%. However, access to distributed resources will increase the node voltage amplitude and enhance the voltage even beyond the upper limit of the node voltage limitation, directly leading to an increase in the proportion of node failures in the system. The average probability of loss of load increased by 3.5 times. Compared with the previous two voltage regulation strategies, the access to distributed photovoltaic storage resources and co-optimization according to the Stackelberg game strategy proposed in this paper can make full use of the voltage regulation capabilities of distributed PVs and DES to reduce the standard deviation of voltage offset up to 46.34%. At the same time, it can also stabilize the node voltages in the system, reducing the node LOLP by 47.58%.
4) Voltage regulation benefit analysis
The leader-side DSO must ensure that the system node voltage does not exceed the limit under the premise of keeping the voltage regulation costs as low as possible. The user side considers the compensation tariff incentives to determine whether the nodes of the user’s distributed photovoltaic storage resources will participate in regulating the voltage. Compared with the direct control of a single distributed photovoltaic resource, this distributed PVs and DES synergistic strategy can enhance the overall return on the user side to a certain extent.
As shown in Figure 6 above, when the node regulating reactive demand is greater than the maximum value of its reserved reactive capacity, the direct control of distributed PV resources participating in the reactive regulation auxiliary service market, due to only distributed PV resources, must reduce its activity to send out more reactive power. The cost of the activity reductions ultimately leads to negative revenue. As shown in the above figure, nodes 12, 17–18, and nodes 27–28 have this phenomenon. Under the control method of distributed PVs and DES, the DSO provides the same compensation tariff for nodes at the same level, and the revenue of some nodes with high reactive capacity but relatively low reactive power support decreases. Meanwhile, for some nodes that need to cut active power for direct control, the distributed PVs and DES synergy strategy utilizes the reactive power of the storage energy to directly support the voltage regulation demand. After removing the costs of the storage equipment, the gain is still higher than that under the direct control strategy.
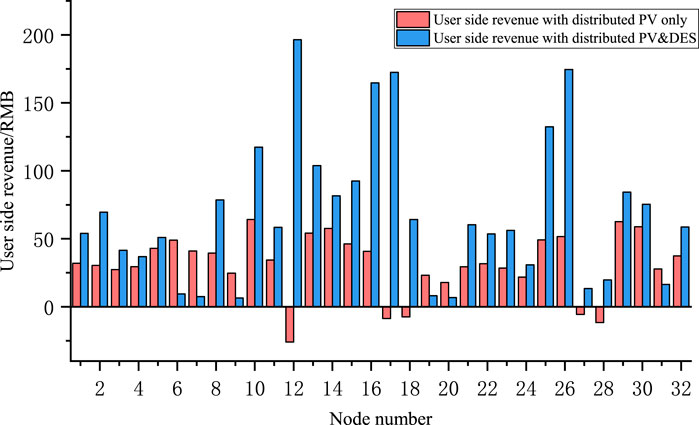
Figure 6. Comparison of user-side benefits.
According to the analysis, compared with the distributed photovoltaic voltage regulation strategy, the distributed PVs and DES synergistic reactive-voltage regulation method can enhance the system nodes and the overall revenue. For nodes with strong reactive power support capacity, revenue can be enhanced nearly 3.04 times and even realize a transformation from negative to high revenue. Overall, the difference shifts from the original 993.8 yuan to 2196.4 yuan, which is an enhancement rate of 121.01%.
7 Conclusion
A high proportion of distributed resources, such as distributed photovoltaics, in a distribution network system may lead to node overvoltage, cause loss of load faults, and reduce the reliability of the system. In this article, we put forward a multi-distributed resources cooperative reactive-voltage risk regulation strategy according to the Stackelberg game framework and verify that the proposed strategy can effectively reduce the node overvoltage risk and improve the reliability of the system in the IEEE 33-node system. The case study analysis of the conditions before and after joining the DES resources to regulate the overvoltage risk shows that the deviation of the node voltage is reduced by 58.53%. However, without the optimization and coordination of the distributed photovoltaics and DES, the average value of node LOLP and the proportion of faults do not decrease. Through the distributed resource coordination strategy under the Stackelberg game framework proposed in this paper, the deviation of the node voltage is reduced by 46.34% compared to only distributed PVs participating in voltage regulation, and the node LOLP is reduced by 47.58%. Meanwhile, comparing the situation before and after the coordination of distributed PVs and DES, the reliability of the distribution network operations increased by 121.01%. In addition, the reactive power utilization of energy storage in some nodes with high reactive regulating demand can be up to 47.95%, which indicates that the multi-distributed resource coordination overvoltage risk regulation strategy proposed in this article is effective. Stackelberg game optimization can ensure that the system probability of load loss due to overvoltage risk is reduced, the reliability of system operations is improved, and the benefits of both operators of voltage regulation are optimized.
Data availability statement
The original contributions presented in the study are included in the article/Supplementary material; further inquiries can be directed to the corresponding author.
Author contributions
ZQ: conceptualization, funding acquisition, writing–review and editing, and writing–original draft. JW: funding acquisition, supervision, validation, writing–review and editing, and writing–original draft. XZ: funding acquisition, supervision, visualization, writing–review and editing, and writing–original draft. YhL: funding acquisition, investigation, resources, writing–review and editing, and writing–original draft. CT: data curation, investigation, methodology, software, writing–original draft, and writing–review and editing. YfL: conceptualization, methodology, software, validation, writing–review and editing, and writing–original draft. XC: funding acquisition, resources, writing–review and editing, and writing–original draft.
Funding
The author(s) declare financial support was received for the research, authorship, and/or publication of this article. This study was supported by the Science and Technology Project of State Grid Shaanxi Electric Power Company Limited (5226ky230006).
Conflict of interest
Authors ZQ, JW, XZ, YhL, and XC were employed by the Power Research Institute of State Grid Shaanxi Electric Power Co., Ltd.
The remaining authors declare that the research was conducted in the absence of any commercial or financial relationships that could be construed as a potential conflict of interest.
The authors declare that this study received funding from State Grid Shaanxi Electric Power Company Limited. The funder had the following involvement in the study: study design, data collection and analysis, decision to publish, and preparation of the manuscript.
Publisher’s note
All claims expressed in this article are solely those of the authors and do not necessarily represent those of their affiliated organizations, or those of the publisher, the editors, and the reviewers. Any product that may be evaluated in this article, or claim that may be made by its manufacturer, is not guaranteed or endorsed by the publisher.
References
Cai, Y., Tang, W., Zhang, B., Li, T., Wang, Z., and Gao, B. (2019). Centralized - local two-stage voltage-reactive power control for photovoltaic low-voltage distribution network with high proportion of users. Power Syst. Technol. 43 (04), 1271–1280. doi:10.1016/j.ijepes.2021.106852
Geng, Z. (2023). Research on reactive power and voltage control strategy under high penetration renewable energy. Beijing, China: North China Electric Power University.
Hu, J., Ye, C., Ding, Y., Tang, J., and Liu, S. (2022). A distributed MPC to exploit reactive power V2G for real-time voltage regulation in distribution networks. IEEE Trans. Smart Grid 13 (1), 576–588. doi:10.1109/tsg.2021.3109453
Hu, X., Liu, Z. W., Wen, G., Yu, X., and Liu, C. (2020). Voltage control for distribution networks via coordinated regulation of active and reactive power of DGs. IEEE Trans. Smart Grid 11 (5), 4017–4031. doi:10.1109/tsg.2020.2989828
Huang, J., Huang, K., Yang, J., Huang, Z., Zhang, B., and Zeng, L. (2020). Energy storage participates in the coordinated control strategy of power grid voltage regulation and dynamic reactive power support. Electr. Energy Manag. Technol. (10), 77–83+89. doi:10.16628/j.cnki.2095-8188.2020.10.012
Ji, G., Yuan, F., Fan, X., Yuan, R., Ling, K., and Li, X. (2020). Risk assessment of distribution network voltage over limit based on Cornish-Fisher. Acta Energiae Solaris Sin. 41 (01), 358–366. doi:10.19912/j.0254-0096.2020.01.050
Li, S., Xu, Q., Hua, K., and Xiong, J. (2023a). Application research on energy storage in power grid supply and demand regulation based on differentiated electricity prices. Energy Rep. 9 (10). doi:10.1016/j.egyr.2023.05.080
Li, C., Dong, Z., Li, J., Li, H., Zhou, H., and Jin, Q. (2021a). Optimization control strategy of distributed energy storage cluster to improve new energy consumption capacity of distribution network. Automation Electr. Power Syst. 45 (23), 76–83. doi:10.1016/j.epsr.2022.109012
Li, J., Sun, D., Zhu, X., Yu, H., Li, C., and Dong, Z. (2023b). Voltage regulation strategy for distributed energy storage considering coordination among clusters with high penetration of photovoltaics. Automation Electr. Power Syst. 47 (10), 47–56. doi:10.1016/j.ijepes.2023.108995
Li, Y., Pei, W., Xiao, H., and Liu, Y. (2021b). Microgrid demand response characteristic encapsulation and distribution network optimization operation based on deep learning. Automation Electr. Power Syst. 45 (10), 157–165. doi:10.1016/j.jclepro.2020.121247
Li, Z., Li, X., and Yan, D. U. (2022). Modeling and simulation of optimal operation of distribution network based on Particle Swarm Optimization. Electron. Des. Eng. 30 (18). doi:10.14022/j.issn1674-6236.2022.18.037
Ning, X., Wang, T., and Chen, H. (2022). Reactive power voltage optimization of distribution network based on goal planning. Power Capacitor React. Power Compens. 43 (03), 1–7. doi:10.14044/j.1674-1757.pcrpc.2022.03.001
Niu, F., Xu, G., Zhang, J., Liu, Y., and Wang, W. (2022). Research on active and reactive power coordination control strategy for overvoltage of PV distribution network in high penetration area. Guangzhou, China: ICPEA.
Ren, Y. (2022). Distribution network optimization for distributed energy access[D]. Beijing, China: North China Electric Power University.
Saboori, H., Hemmati, R., and Ahmadi Jirdehi, M. (2015). Reliability improvement in radial electrical distribution network by optimal planning of energy storage systems. Energy 93, 2299–2312. doi:10.1016/j.energy.2015.10.125
Song, Q. (2020). A bi-level optimization planning method for a distribution network considering different types of distributed generation. Power Syst. Prot. Control 48 (11), 53–61. doi:10.19783/j.cnki.pspc.191240
Sun, W., He, G., Liu, C., and Feng, S. (2023). Research review on the solution of voltage overlimit in distribution network with high permeability distributed PV[J/OL]. Mod. Electr. Power 1-8. doi:10.19725/j.cnki.1007-2322.2022.0253
Sun, X. (2019). Hierarchical coordinated voltage control of active distribution network with multiple microgrids. Jinan, China: Shandong University.
Sun, Y., Cheng, L., and Liu, H. (2005). Power system operating reliability evaluation based on real-time operating state. Power Syst. Technol. 52 (15), 6–12. doi:10.1109/IPEC.2005.207002
Wu, W., Hu, Z., and Song, Y. (2018). Optimal sizing of energy storage system for wind farms combining stochastic programming and sequential Monte Carlo simulation. Power Syst. Technol. 42 (04), 1055–1062. doi:10.13335/j.1000-3673.pst.2017.2421
Xie, K., Zhao, Y., Hu, B., Shao, C., Liu, C., and Sun, K. (2023). Operational reliability assessment of power system considering active participation of wind power in frequency control. Power Syst. Technol. 47 (01), 41–54. doi:10.13335/j.1000-3673.pst.2022.1308
Xiong, M., and Xu, H. (2018). Study on the maximum acceptance capacity of PV integrated into distribution network with different voltage regulation strategies. Distribution Util. 35 (03), 80–85. doi:10.19421/j.cnki.1006-6357.2018.03.014
Yang, J., Wang, W., Zhang, M., Wang, L., Zhang, Q., Li, C., et al. (2023). A hierarchical voltage control method considered distribution network involving distributed photovoltaic and energy storage[J/OL]. J. Electr. Power Sci. Technol. 1-10. doi:10.19781/j.issn.1673-9140.2023.05.011
Ye, H. (2021). Water-wind-light microgrid voltage regulation model and active and reactive power cooperative optimization method. Guangdong, China: Guangdong University of Technology.
Yu, S., Liu, N., and Zhao, B. (2022). Multi-agent classified voltage regulation method for user group with photovoltaic. Automation Electr. Power Syst. 46 (05), 20–41. doi:10.1016/j.apenergy.2023.121743
Zhang, S., Gu, W., Wang, J., Zhang, X. P., Meng, X., Lu, S., et al. (2023a). Steady-state security region of integrated energy system considering thermal dynamics. IEEE Trans. Power Syst., 1–15. doi:10.1109/TPWRS.2023.3296080
Zhang, S., Gu, W., Zhang, X. P., Lu, H., Yu, R., Qiu, H., et al. (2023b). Dynamic modeling and simulation of integrated electricity and gas systems. IEEE Trans. Smart Grid 14 (2), 1011–1026. doi:10.1109/TSG.2022.3203485
Zhang, J., Zhuang, H., Liu, J., Gao, H., Zhang, L., and Xia, Y. (2019). Two-stage voltage coordination control strategy of active distribution network with distributed energy storage system participating in voltage regulation. Electr. Power Autom. Equip. 39 (05), 15–21+29. doi:10.16081/j.issn.1006-6047.2019.05.003
Appendix A
FIGURE A1. Flowchart of the Stackelberg game framework.
FIGURE A2. Flowchart of the improved PSO algorithm.
Keywords: distributed system operator, distributed resource, reactive power voltage regulation, K-means++ clustering algorithm, Stackelberg game, PSO algorithm
Citation: Qiu Z, Wang J, Zhang X, Lei Y, Tong C, Lu Y and Chang X (2024) Overvoltage risk regulation strategy with distributed energy application in a distribution network based on the Stackelberg game. Front. Energy Res. 12:1367287. doi: 10.3389/fenrg.2024.1367287
Received: 08 January 2024; Accepted: 31 January 2024;
Published: 03 May 2024.
Edited by:
Zhengmao Li, Aalto University, FinlandReviewed by:
Suhan Zhang, Hong Kong Polytechnic University, Hong Kong SAR, ChinaXiaodong Zheng, South China University of Technology, China
Copyright © 2024 Qiu, Wang, Zhang, Lei, Tong, Lu and Chang. This is an open-access article distributed under the terms of the Creative Commons Attribution License (CC BY). The use, distribution or reproduction in other forums is permitted, provided the original author(s) and the copyright owner(s) are credited and that the original publication in this journal is cited, in accordance with accepted academic practice. No use, distribution or reproduction is permitted which does not comply with these terms.
*Correspondence: Zekai Qiu, cXprQHRqdS5lZHUuY24=