 T. D. Awoyinka
 T. W. David
 T. E. Somefun
 C. T. Somefun2
- 1Department of Physics, Olabisi Onabanjo University, Ago Iwoye, Nigeria
- 2Department of Electrical and Information Engineering, Covenant University, Ota, Nigeria
This work investigates the discrepancies in electrical parameters of mono-crystalline solar panels between Ago-Iwoye weather conditions and the manufacturer’s specified ideal conditions. Manufacturer’s specifications are typically based on 1,000 W/m2 global solar irradiance, AM 1.5, and 25°C operating temperature, while actual weather conditions at installation sites can vary significantly. Mono-crystalline (single-crystal) silicon solar panels of capacities 60, 80, 100, and 150 W were evaluated through current-voltage (I-V) response tests at an installation site in Ago-Iwoye, Nigeria, with solar irradiance exposure from 11 a.m. to 3 p.m. The analysis of I-V and P-V curves revealed a significant reduction in maximum power output by 28.6%, 25.9%, 28.9%, and 19.36%, respectively, compared to the manufacturer’s stated values. This deviation underscores the importance of considering local weather conditions during solar PV projects, and we recommend adding an additional 20%–30% of the total solar panel capacity during installations to account for variations in solar irradiance and operating temperatures, ensuring optimal performance and effective solar power generation in Ago-Iwoye and similar areas.
1 Introduction
The electrical parameters and specifications of the solar panel provided by the manufacturer cannot be used to effectively determine the performance of the solar panel at the installation site because those electrical parameters do not always correspond to the actual parameters obtained at the installation site (Osanyinpeju et al., 2018). The manufacturer’s specifications are usually obtained under a standard test condition of 1,000 W/m2 irradiance, 25°C cell temperature, and an AM 1.5 global spectrum. This is not the exact weather condition the solar panels are constantly exposed to on the installation site (Adaramola et al., 2011; Hachicha et al., 2019; Jiang et al., 2019). Hence, for better performance of a PV system and for appropriate solar panel capacity sizing, it is important to know the actual electrical parameters of the solar panel before installation by subjecting it to testing at the installation site.
When a solar panel is subjected to actual solar irradiance, temperature, and wind at the installation site, ensuring that the solar panel does not reduce performance as specified by the manufacturer is a major problem for researchers and solar PV professionals (Hachicha et al., 2019). Environmental factors such as temperature, varying solar irradiance, humidity, wind speed, and direction all contribute to the performance reduction of solar panels at the installation site (Yedidi et al., 2022). Furthermore, parameters such as fill factor, Isc, and Voc determine the maximum power of a solar panel (Wilson et al., 2020). Various studies have revealed that the issue of solar panel performance reduction at the installation site is global (Ahmed et al., 2022). As a result, some major factors that contribute to this issue have been revealed. Factors such as encapsulant discoloration, corrosion, and cracked cells are among the widely reported issues that can cause a reduction in solar panel performance at the installation site.
Encapsulant discoloration hinders sunlight irradiance from interacting efficiently with the solar cells, thereby reducing the solar panel’s performance (Gopalakrishna et al., 2022a). Encapsulant discoloration can cause a large decrease in VoC, ISC, Imp, and other solar panel electrical parameters (Li et al., 2021; Gopalakrishna et al., 2022b). Factors that can contribute to encapsulant discoloration are an inadequate bond between the solar panel cell and its glass, high ultraviolet radiation, high temperatures, and high ambient humidity (Dolia et al., 2022; Naskar and Meena, 2022; Dare et al., 2023). Solar panel corrosion is another common cause of performance reduction in outdoor solar panels, especially in humid climates. Environmental factors at the installation site, and other factors such as deterioration of module back-sheets, inadequate encapsulating components, and insufficient lamination can cause solar panel corrosion (Hamdi et al., 2018; Kim et al., 2021). In Silicon wafer solar panels, cracking is another common challenge, especially during installation and the transportation process to the installation site. Cracks can also occur because of mechanical and thermal stresses (Dubey et al., 2022).
The investigation of some studies has also revealed that solar panel parameters on the field are different from the manufacturer’s parameters due to factors like plane of array irradiance, ambient temperature, and module temperature (Sinan Rashid and Safari, 2021; Somefun et al., 2020; Adewale et al., 2018/01). According to the authors in reference (Ugwuoke and Okeke, 2012), an assessment of the performance of 55 W monocrystalline, 50 W polycrystalline, and 10 W amorphous silicon solar panels under the influence of global and diffuse irradiance at the University of Nigeria, Nsukka, discovered that the maximum power output and efficiencies of the modules tested were significantly lower than their rated performances, which was also ascertained in reference (Alilu, 2021). At an irradiance of 1,000 W/m2, the power output was reduced by about 31.88%, 42.32%, and 30.6% of the manufacturer’s specifications for the monocrystalline, polycrystalline, and amorphous silicon PV modules, respectively. Maximum efficiencies of 12.97%, 9.67%, and 4.94% were achieved at an irradiance of 600 W/m2 for the monocrystalline, polycrystalline, and amorphous silicon modules, respectively. However, at an irradiance of 1,000 W/m2, the efficiencies dropped to 9.61%, 7.65%, and 3.62% for the monocrystalline, polycrystalline, and amorphous silicon PV modules, respectively (Ugwuoke and Okeke, 2012).
Expanding on crystalline solar panels, there are two primary types: mono-crystalline and poly-crystalline. Monocrystalline solar panels, more often called single-crystal silicon, are made of solar cells based on crystalline silicon wafers, manufactured from pure crystalline Silicon.
The most common monocrystalline photovoltaic cells are composed primarily of silicon, phosphorus, and boron. If phosphorous as a doping agent, which has five valence electrons, is added to a group of silicon atoms, it produces a crystalline structure with a “free” valence electron, called N-type material. Similarly, when boron, an element with only three valence electrons, is doped with Silicon, “holes” begin to develop within the material structure, thereby forming P-type material. When both P-type and N-type materials are connected, it produces what is referred to as a “p-n junction” (Kasera and Khan, 2019). The PN-junction is typically 0.2 μm to 0.5 μm deep (Movahedian and Tavakoli-Anbaran, 2020). Once photons are absorbed by these two materials, electricity begins to flow through the P-N junction to the connected load. The brighter the photons that interact with the photovoltaic cell, the more electricity is generated (Kapsalis et al., 2021).
In reference (Osanyinpeju et al., 2018), a study evaluating the performance of six 80-W mono-crystalline photovoltaic panels revealed variations in maximum output power compared to the manufacturer’s at STC. The maximum output power obtained from the tested panels ranged from 53.1 to 59.4 W, with normalised output power efficiency ranging from 66.4% to 74.3%. The total output power from the six solar panels (480 W) was 335 W, representing 69.8% of the manufacturer’s total output power.
In the study (Ibrahim et al., 2021), experimental findings concerning a 100 W silicon PV module in outdoor conditions indicated varying efficiencies across seasons. The efficiencies of the 100 W solar PV module obtained in winter, spring, summer, and autumn were 4.29%, 3.78%, 7.56%, and 4.58%, respectively. The maximum power point (Pmax) was calculated in July, yielding a value of 45.98 W at solar noon, while the minimum power point (Pmin) was calculated in October, with a value equal to 18.56 W at solar noon.
The author in (Tress et al., 2019) delineates various testing methodologies utilised to derive solar panel parameters, including Responsivity, External Quantum Efficiency (EQE), and IV response. Responsivity and external Quantum Efficiency assess how solar cells respond to diverse broadband light wavelengths, whereas I-V response examines photovoltaic solar cells reactions under varying electrical conditions. This study specifically employed an IV response test to capture the actual electrical parameters of four distinct monocrystalline or single-crystal silicon solar panels installed at a site in Ago-iwoye.
The wattages of the investigated solar panels were 60 W, 80 W, 100 W, and 150 W. The I-V response test was conducted to specifically capture key parameters, including Short-circuit current (Isc), Open-circuit voltage (Voc), Current at maximum power (Imp), and voltage at maximum power (Vmp). Subsequently, the result of these parameters were analysed using the I-V curve and P-V curve to ascertain the maximum power output, efficiency, and fill factor of each solar panel. The objective of this study is to elucidate the variation or deviation in electrical parameters of solar panels between those obtained at the installation site under Ago-Iwoye weather conditions and the manufacturer s specification. Justifying this deviation will ensure appropriate sizing of solar panel capacity for effective solar power generation, and optimal performance during solar PV project in Ago-Iwoye.
Ago-Iwoye is within the rainforest region of Nigeria, at latitude 6.942359 and longitude 3.921554. Ago-Iwoye has two alternating air masses, which are the tropical continental air mass and the tropical maritime air mass. The tropical continental air mass is dry and dusty and originates from the northern Africa wind, commonly known as the harmattan season. It dominates during the dry season between early November and Mid-March. The tropical maritime air mass is warm and wet and originates from the south; it dominates in the rainy season from March to early November. Ago-Iwoye records of humidity are high, ranging from 80% to 87% for the afternoon and 100% during and after rainfalls (Olusola et al., 2018). The mean wind speed ranges between 3.6 m/s (for dry) and 3.5 m/s (for wet), and there is a record of constantly high temperatures (Nze-Esiaga and Emmanuel, 2014). It has a high global radiation level ranging from 5.83 kw/m2 to 6.94 kw/m2 per day (Oluwaseun et al., 2023).
Conducting the solar panel test under Ago-iwoye weather conditions will bridge the knowledge gap regarding the deviation of solar panel parameters compared to manufacturer specifications. This will equip solar engineers with the necessary insights to design and size solar panels appropriately for specific locations in Ago-iwoye and nearby areas in western Nigeria.
2 Materials and methods
2.1 Materials
The materials utilized in this study include:
(a) Solar Panels: Four mono-crystalline photovoltaic panels were used with ratings of 60, 80, 100, and 150 W. The manufacturer specification for the solar panel are detailed in Table 1.
(b) A variable power resistor: A, high power potentiometer rated 150 W with a resistance of 50 Ω was used as a resistance load to determine the voltage and current output of each panel. The potentiometer terminals (1,2,3) are labelled accordingly.
(c) Digital Multimeters: Digital multimeters were utilized for real-time measurement of voltage, current and solar panel temperature during testing enabling swift and simultaneous data acquisition.
(d) Cable: 2.5 mm D.C. cable was utilized to facilitate the interconnection of circuit.
(e) Switch: Five switches were incorporated to facilitate easier connection and disconnection required for parameter measurements procedures.
(f) Digital Solar Power Metre: This instrumentation device, capable of measuring of measuring solar radiation digitally, was used to capture the solar irradiance.
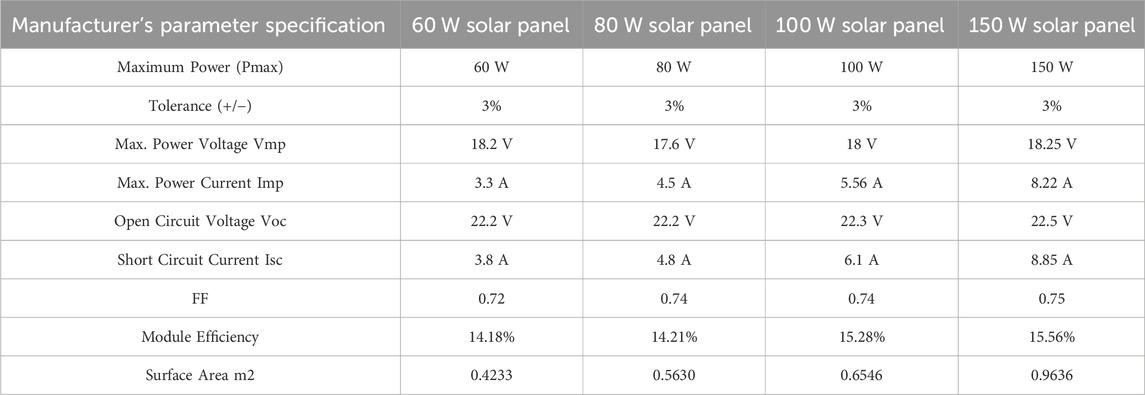
Table 1. Manufacturer’s parameter specification of 60, 80, 100, and 150 W.
2.2 Data collection
To ensure optimal accuracy, the test for each solar panel was repeated multiple times, spaced at a 6-min interval. The test with the highest power output for each solar panel was selected from a total of 72 tests conducted over 2 days from 11 a.m. to 3 p.m. Tables 6–9 itemise the key parameters obtained for the 72-test. The parameters are short circuit current Isc, open circuit voltage Voc, voltage at maximum power Vmp, current at maximum power Imp, and maximum power Pmax. The highest maximum power output Pmax for each solar panels, revealing performance deviation was detailed in Section 3. Solar irradiance and solar cell temperature were recorded alongside each test. Figure 1 depicts the average solar irradiance obtained hourly between the hours of 11 a.m. and 3 p.m. The average cell temperature per hour was also recorded as shown in Figure 2. The solar panels were positioned at the optimal tilt angle towards the Sun during testing.
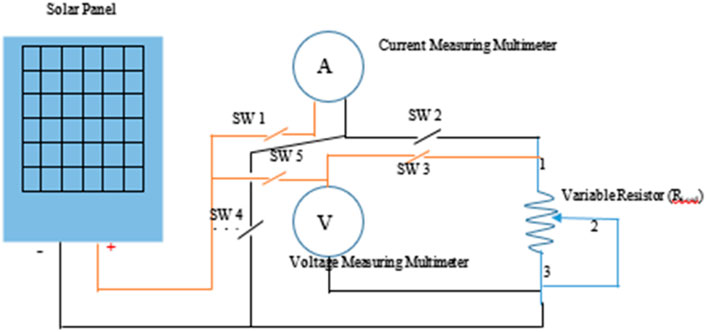
Figure 1. Average solar irradiance obtained during testing.
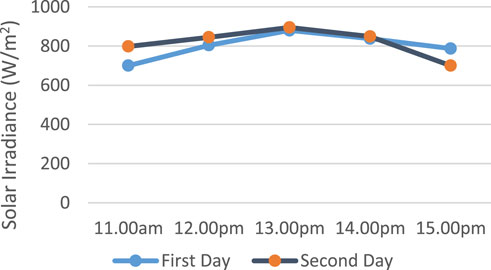
Figure 2. Average solar cell temperature obtained between 11a.m. and 3p.m.
2.3 Method
Figure 3 illustrate the methodology utilized and the connection procedure employed. The test was conducted using a four-wire measurement technique, ensuring that the current from the ammeter side passes through a distinct wire, seperate from the probe wires transmitting voltage to the voltmeter side. This setup minimizes the current passing through the voltmeter and eliminates any voltage error caused by the probe wires themselves.
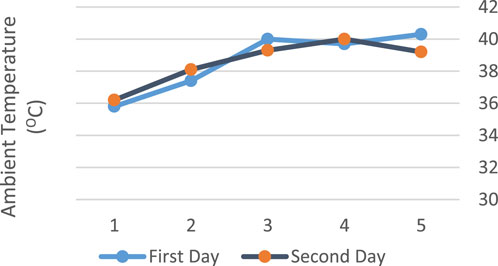
Figure 3. Test connection setup of four wire measurement.
A 50-Ω, 150-W variable resistor or potentiometer (RLoad) was connected across the four wires to obtain a range of current and voltage measurements from each of the solar panels under test. The resistance value of RLoad was adjusted incrementally from zero to 50 Ω to capture the voltage and current data at each resistance setting, thereby obtaining points along the I-V curve from short circuit current to open circuit voltage. The short-circuit current (Isc) was determined when voltage (V) equalled 0, achieved by closing switch 1 (SW1) and 4 (SW4) while leaving the remaining switches open. Conversely, the open-circuit voltage (Voc) was measured when current (I) equalled 0, attained by closing switch 5 (SW5) only. Subsequently, with switch 1, 2, and three closed and switch 4, and 5, open, the current and voltage across the potentiometer (RLoad) were recorded, as RLoad varied from zero to 50 Ω. The resistance value was calculated by dividing the measured voltage by its corresponding current. To ensure accuracy, the testing process was repeated multiple times in batches for each solar panel, and the batch yielding the highest power output was selected for analysis. The testing spanned 2 days, commencing at 11 a.m., when solar irradiance was at its peak, and ending at 3 p.m. The solar panels were positioned at the optimal tilt angle to maximize exposure to sunlight. Current and voltage responses were measured, recoded, and repeated intermittently between 11 a.m. and 3 p.m. on each testing day.
2.4 Measured parameters
The measured parameters for I-V responses of the solar panels are the following: open-circuit voltage (Voc), short-circuit current (Isc), voltage at maximum power (Vmax), current at maximum power (Imax), maximum power (Pmax), Efficiency (Eff), and fill factor (FF).
2.4.1 Open circuit voltage
The open circuit voltage is the maximum voltage generated when there is zero current, i.e., I = 0, indicating that the load (RLoad) is not connected. Switch 5 is Closed, while the remaining Switches are open to obtain the open circuit voltage in this setup.
2.4.2 Short circuit current
This refers to the maximum current generated when there is zero voltage (V = 0), achieved by shorting together the positive and negative terminals of the solar panel are shorted together. In this setup, Switch 1 and 4 are closed, while Switch 2, 3, and five are open to get the short circuit current.
2.4.3 Maximum power output
The maximum power output (Pmax) measured in watts is determine by multiplying the maximum output current by the maximum output voltage.
Maximum Power (Pmax) = Imp × Vmp
Where, Imp = Maximum output current and Vmp = Maximum output voltage.
2.4.4 Maximum power point
This represent the point on the I-V curve where the product of current and voltage reaches its maximum value. The calculation of the maximum power point also the fill factor, open circuit voltage, and short circuit current, expressed as follows:
Maximum Power Point = FF × Isc × Voc.
Where FF denotes the fill factor, Voc represent open circuit voltage, and Isc signifies short circuit current.
2.4.5 Fill factor
This parameter serves as an indicator of the solar cell’s efficiency, defined as the ratio of the actual maximum obtainable power to the product of short circuit current and open circuit voltage.
Imp represents the current at maximum point, Vmp denotes the voltage at the maximum power point, Isc signifies the short circuit current, and Voc represents the open circuit voltage.
Efficiency: This metric quantifies the solar cell’s ability to converts sunlight into energy and is calculated using the following equation:
Pmax = maximum power output in watts.
E = Solar irradiance in W/m2
A = surface area of the solar cell on which light falls, or surface area, m2.
2.5 Captured data
3 Result and discussion
The response parameters for each solar panel are individually presented and discussed under the following sections: Measured Field Response Parameter; I-V Curve, Maximum Power, and Fill Factor; P-V Curve and Efficiency; and Percentage Deviation.
3.1 Measured field response parameter for 60 W panel
Table 2 shows all the response parameters obtained for the 60-W solar panel across each batch of test or experimental points, while Table 3 indicates deviation percentage of the 80 W solar panel from the manufacturer. The highest maximum power that was attained during the tests was further depicted in Figures 4, 5. For the highest maximum power attained, the short circuit current was 3.2 A, and the measured open circuit voltage was 21.87 V.
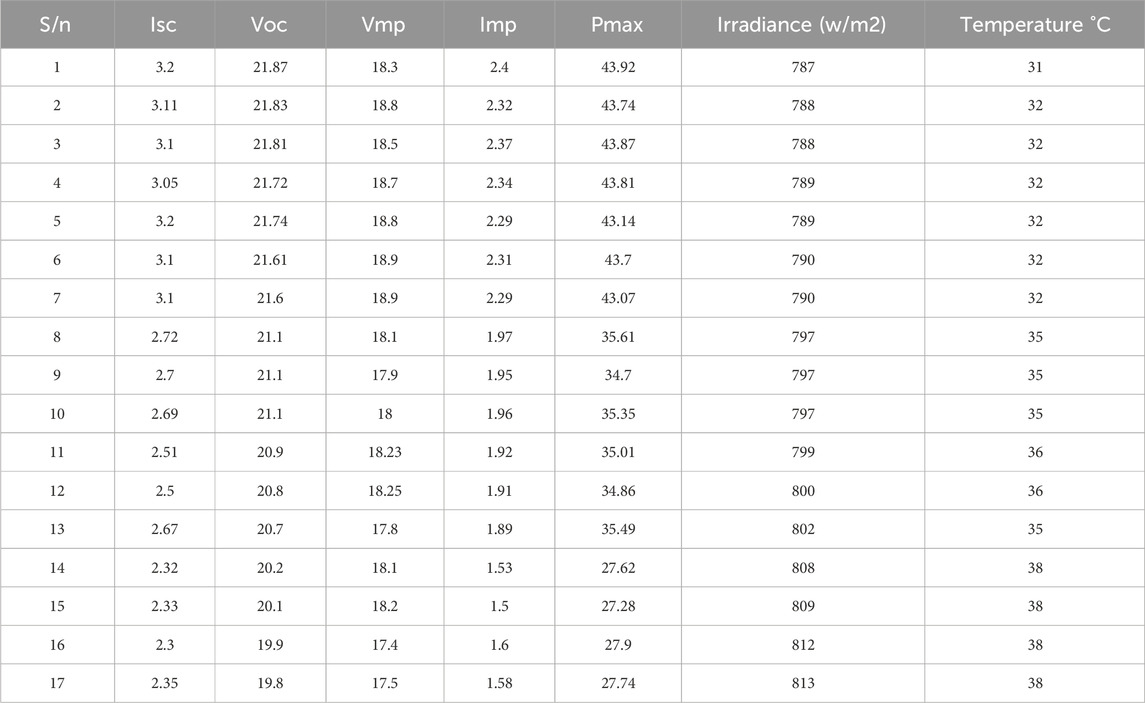
Table 2. Response parameters obtained for the 60 W solar panel under specified solar irradiance and temperature conditions.
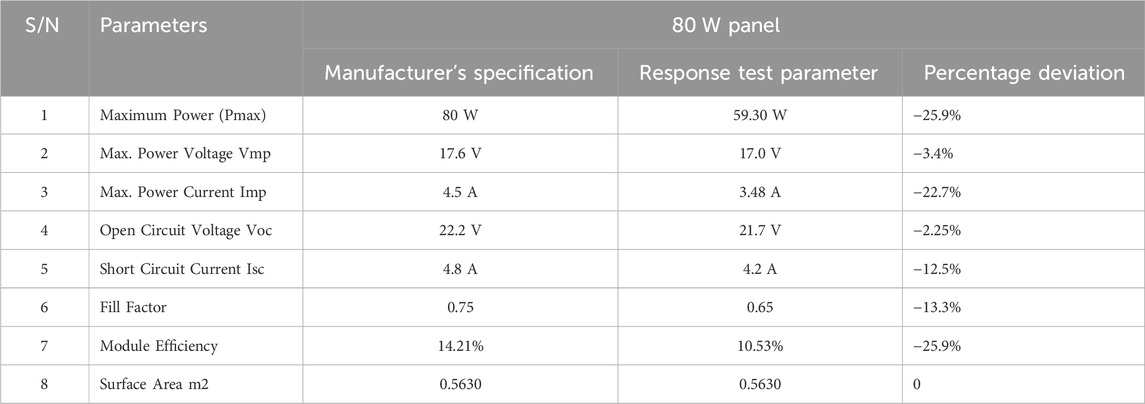
Table 3. Deviation percentage of the 80 W solar panel from the manufacturer.
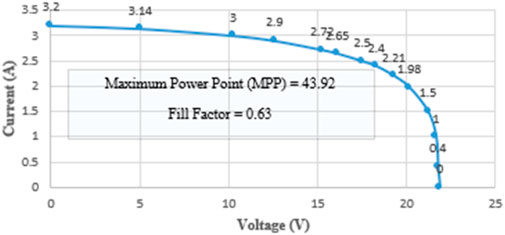
Figure 4. I-V curve of 60 W solar panel.
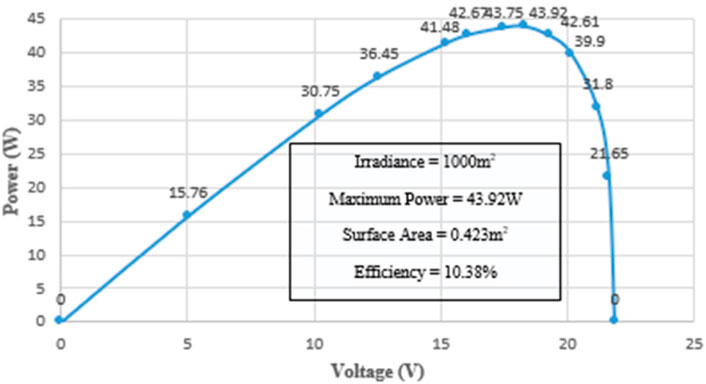
Figure 5. P-V curve of 60 W panel.
3.2 I-V curve, P-V curve, maximum power, efficiency and fill factor for 60 W panel
Figures 4, 5 depict the I-V curve, P-V Curve, maximum power point, fill factor, and efficiency drop for the highest maximum power obtained with the 60 W solar panel. The highest maximum power attained for the 60-W solar panel was 43.92 W, observed at a solar irradiance of 787w/m2 and a temperature of 31°C. This output was 16.08 W lower than the manufacturer’s specified maximum power, indicating a deviation of 26.8% from the manufacturer’s. The fill factor obtained was 0.63, which was 0.08 less than the manufacturer’s specification, representing an 11.3% deviation. The efficiency drop was calculated using a solar irradiance of 1,000 w/m2 at STC, resulting in an efficiency of 26.8% lower than the specified value. Table 4 shows the percentage deviation for the 60-W solar panel.

Table 4. Deviation percentage of the 60-W solar panel from the manufacturer.
3.3 Measured field response parameter for 80 W panel
Table 5 displays all the response parameters obtained for the 80-W solar panel across each batch of test or experimental points. For the highest maximum power obtained, the short circuit current was 4.2 A, and the measured open circuit voltage was 21.74 V. The highest maximum power that was obtained during the tests was further presented in Figures 6, 7.
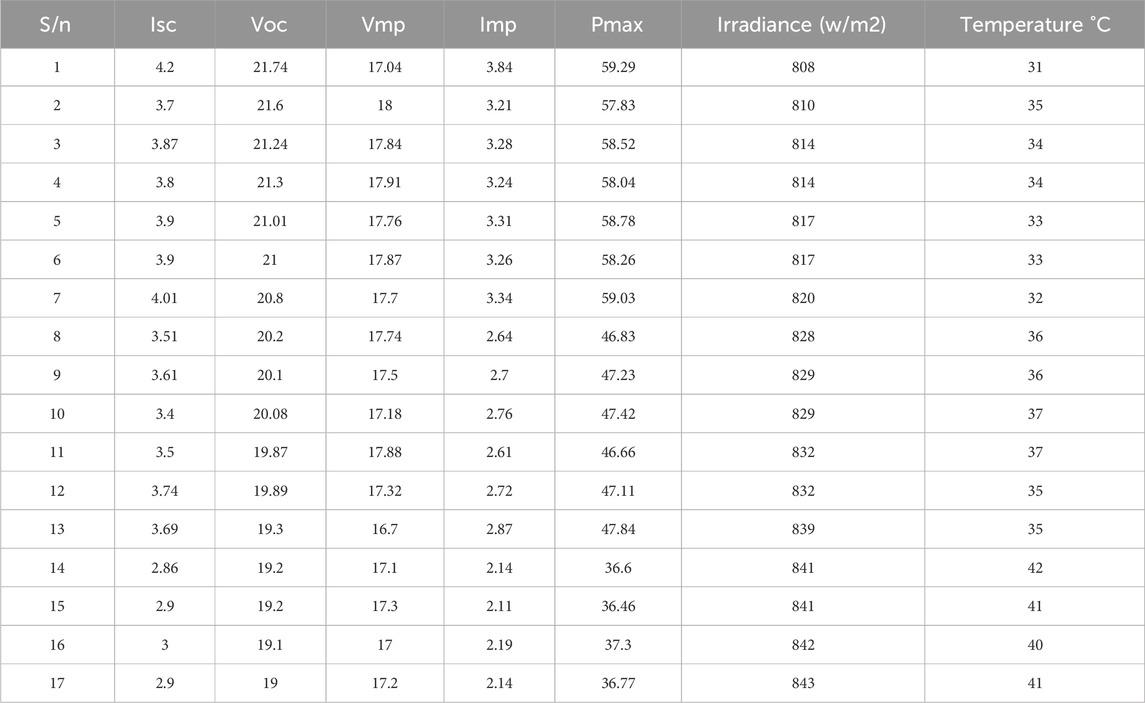
Table 5. Response parameters obtained for the 80 W solar panel under specified solar irradiance and temperature conditions.
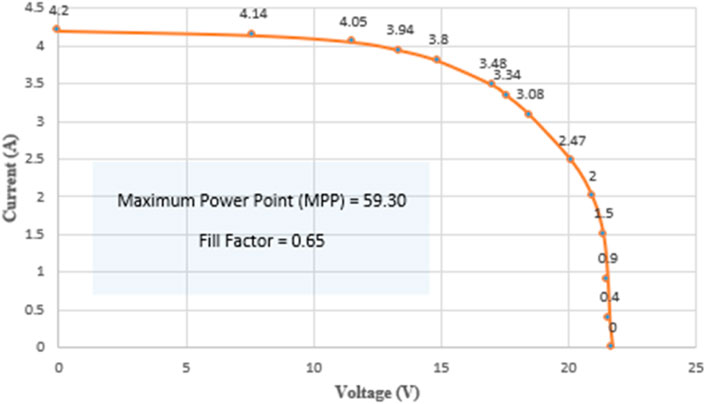
Figure 6. I-V curve of 80 W solar panel.
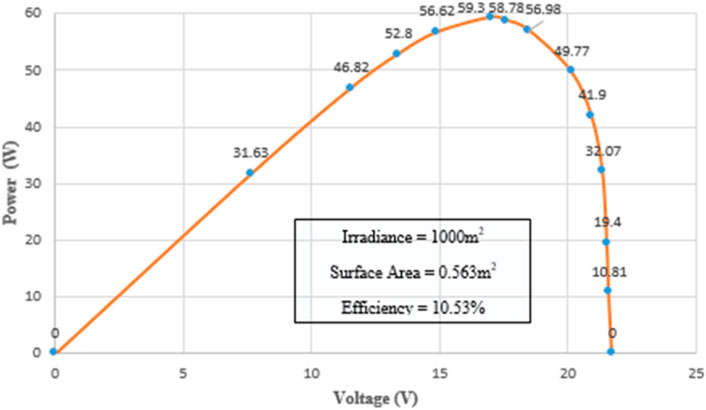
Figure 7. P-V curve of 80 W solar panel.
3.4 I-V curve, P-V curve, maximum power, efficiency and fill factor for 80 W panel
Figures 6, 7 present the I-V curve, P-V Curve, maximum power point, fill factor, and efficiency fall for the highest Maximum Power obtained with the 80 W solar panel. The highest obtained Maximum Power for the 80-W solar panel was 59.3 W, observed at a solar irradiance of 808 w/m2 and a temperature of 31°C respectively. This output was 20.7 W lower than the manufacturer’s, specified maximum power, signifying a deviation of 25.9% from the manufacturer’s specification. The fill factor obtained was 0.65, which was 0.1 less than the manufacturer specification, representing an 13.3% deviation. The efficiency drop was calculated using a solar irradiance of 1,000 w/at STC, resulting in an efficiency of 25.9% lower than the specified value. Table 4 shows the percentage deviation for the 60-W solar panel.
3.5 Measured field response parameter for 100 W panel
Table 6 is the response parameters obtained for the 100-W solar panel across each batch of test. For the highest maximum power obtained, the short circuit current (Isc) and open circuit voltage was 5.17A and 21.4 V respectively. Figures 8, 9 shows the graphs illustrating the highest maximum power obtained during the tests.
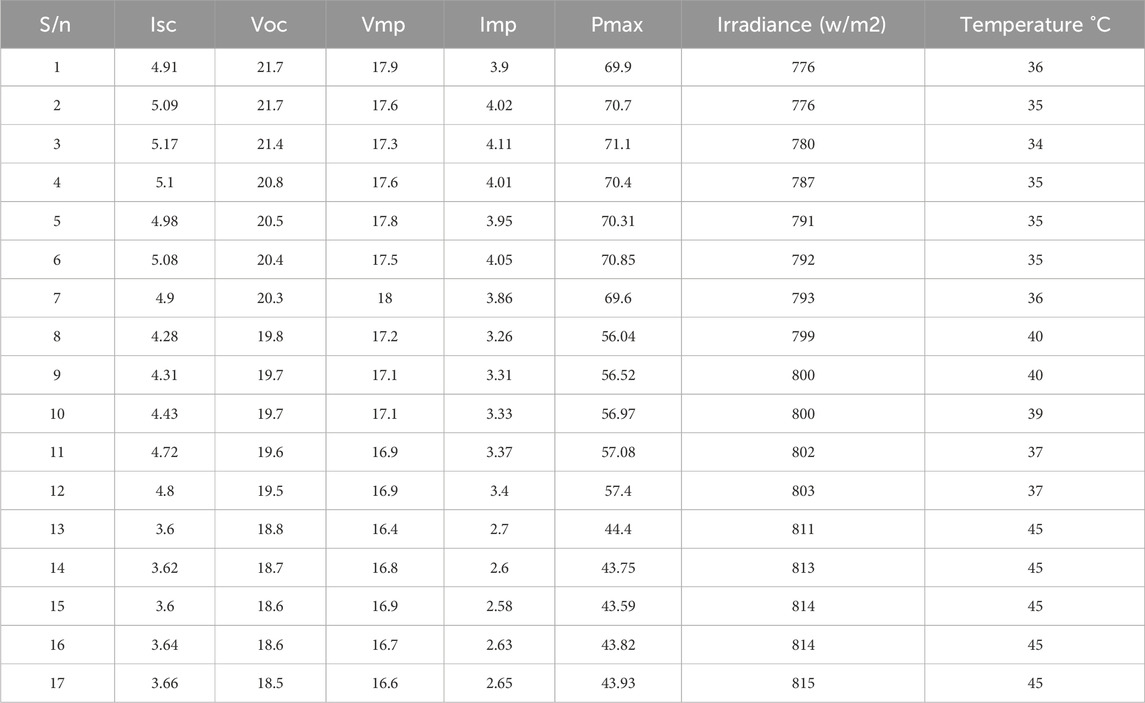
Table 6. Response parameters obtained for the 100 W solar panel under specified solar irradiance and temperature conditions.
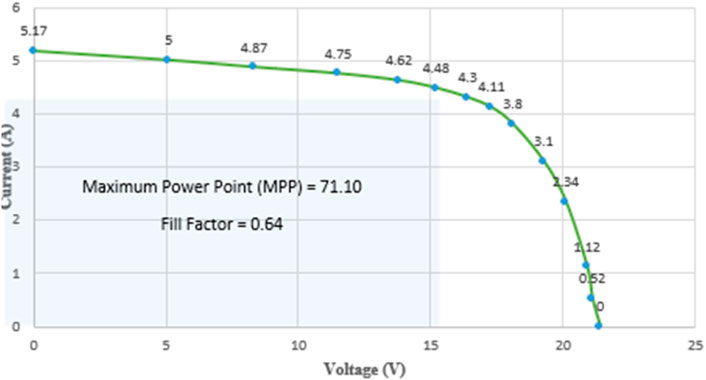
Figure 8. I-V curve of 100 W solar panel.
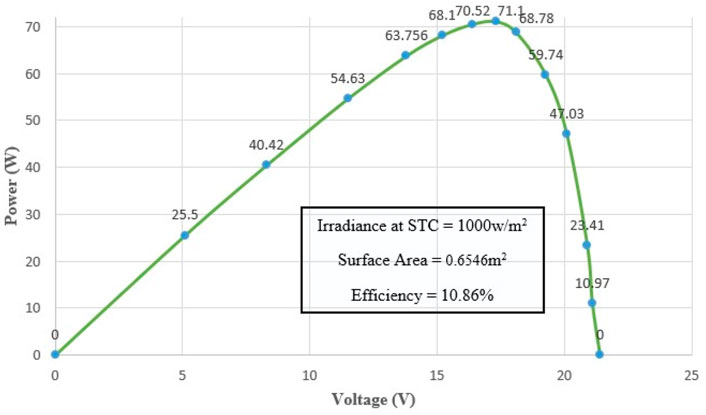
Figure 9. P-V curve of 100 W solar panel.
3.6 I-V curve, P-V curve, maximum power, efficiency and fill factor for 100 W panel
Figures 8, 9 present the I-V curve, P-V Curve, maximum power point, fill factor, and efficiency fall for the highest Maximum Power obtained with the 100 W solar panel. The 100 W solar panel yielded a highest maximum current (Imp) of 13.48 A and a highest maximum voltage (Vmp) of 17.04 V resulting in a highest maximum power output of 71.1 W under the solar irradiance of 780w/m2 and temperature of 34°C. However, this obtained maximum power output fell short by 28.9 W compared to the manufacturer’s specification, denoting a deviation of 28.9% from the specified maximum power output. Additionally, the fill factor obtained was 0.64, which was 0.1 lower than the manufacturer’s specification, equating to a 13.5% deviation from the specified fill factor. The efficiency drop was calculated using 1,000 w/m2 of solar irradiance at STC. The resulting conversion efficiency was 10.86%,representing a deviation of 28.9% from its specified value. Table 7 shows the percentage deviation for the 100-W solar panel.
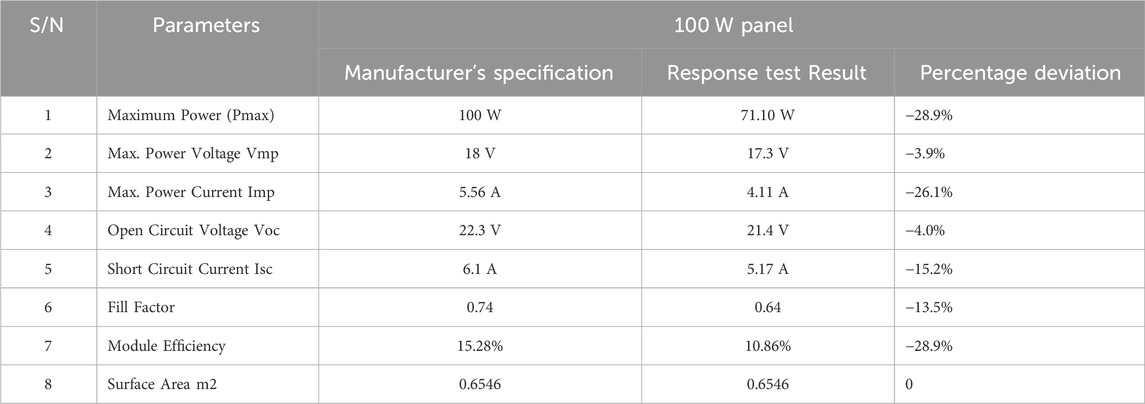
Table 7. Deviation percentage of the 100 W solar panel from manufacturer.
3.7 Measured field response parameter for 150 W panel
Table 8 is the response parameters obtained for the 150-W solar panel across each batch of test. Figures 10, 11 further shows the graph depicting the highest maximum power attained. For the highest maximum power obtained, the short circuit current was 8.3A, while the measured open circuit voltage was 21.7 V
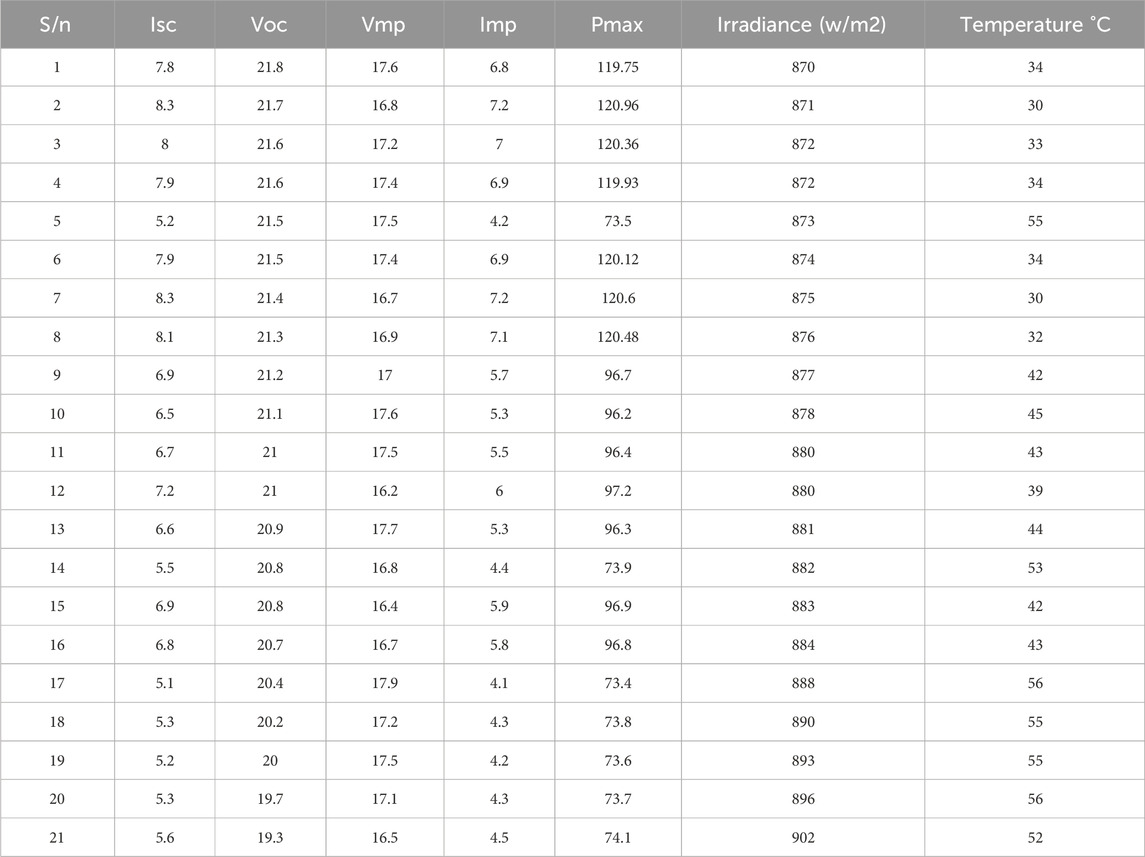
Table 8. Response parameters obtained for the 150 W solar panel under specified solar irradiance and temperature conditions.
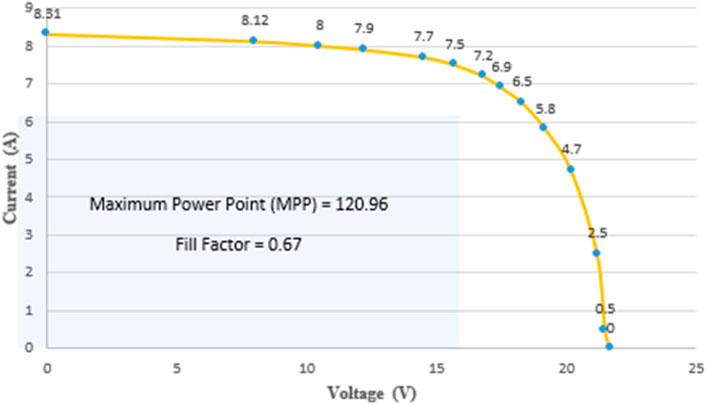
Figure 10. I-V curve for 150 W solar panel.
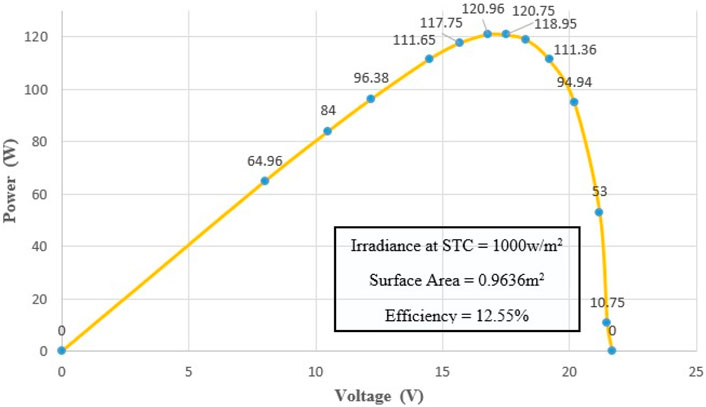
Figure 11. P-V curve of 150 W solar panel.
3.8 I-V curve, P-V curve, maximum power, efficiency and fill factor for 150 W panel
Figures 10, 11 present the I-V curve, P-V Curve, maximum power point, fill factor, and efficiency drop for the highest Maximum Power obtained with the 150 W solar panel. The 150 W solar panel generated a highest maximum current (Imp) and maximum voltage (Vmp) of 7.2 A and 16.8 V, respectively, resulting in a highest maximum power output of 120.96 W, under solar irradiance of 871w/m2 and a temperature of 30°C. This obtained maximum power output was 29.04 W lower than the manufacturer’s specification, representing a 19.36% deviation from specified maximum power output. The fill factor obtained was 0.67, which was 0.08 lower than the manufacturer’s specification, corresponding to a 10.7% deviation from specified fill factor. The efficiency achieved was 12.55%, representing a deviation of 19.3% from its specified value. Table 9 illustrate the percentage deviation for the 150-W solar panel.

Table 9. Percentage deviation of the 100 W solar panel from manufacturer.
4 Evaluation and discussion
As evident from the results, the weather condition of Ago-Iwoye does not align with the required standard test conditions. Solar irradiance levels were consistently below 1000w/m2 and cell temperature remained above 25°C even during peak sunlight hours. It is worth noting that Ago-Iwoye is situated at a latitude close to 7°, resulting in an AM1.0 instead of AM1.5 at STC.
The AM 1.5 spectrum provides a more realistic representation of the solar spectrum under typical daylight conditions compared to the AM 1.0 spectrum. Different wavelengths of light in the AM 1.0 and AM 1.5 solar spectra have varying levels of energy and distribution on the solar panel and are absorbed differently by the semiconductor materials in the solar cells, which influence their efficiency. The AM 1.5 spectrum, unlike AM 1.0, covers a broader range of wavelengths, including visible and near-infrared light, which are important for solar cell performance. The deviation in AM led to a shift in the maximum power point (MPP) of the solar panels, thereby affecting their performance and power output.
The deviations in temperature and solar irradiance were consistent during testing. These deviations adversely impacted the solar panel’s performance, resulting in reduced efficiency. This reduction can be attributed to increased resistive losses and a decrease in the open-circuit voltage of the solar cells. The solar irradiance obtained at the site during the test varied between 600 w/m2 and 1,000 w/m2, with the highest recorded irradiance reaching 895 w/m2 solar cell temperature of 54°C. This can be a result of the AM 1.0 conditions in Ago-iwoye. Under clear sky conditions with the Sun directly overhead, solar irradiance levels are closely below or around 1,000 w/m2, which indicates that obtaining a constant 1,000 w/m2 solar irradiance at AM 1.0 and maintaining a 25°C temperature to achieve the peak rated performance is not realistic under Ago-iwoye weather conditions.
Ultimately, the installation site in Ago-iwoye deviates from the 25°C, 1,000 W/m2, and AM 1.5 spectrum during solar panel operation and testing, and this deviation leads to some factors that cause the electrical parameters of the solar panels to deviate from the manufacturer’s specifications. The factors include a shift in maximum power point, reduced efficiency, temperature-related performance losses, and spectral mismatch. This deviation in parameters highlights the importance of considering installation site atmospheric conditions before installation and optimising solar panel designs for the specific environment in which they will be deployed.
5 Conclusion
The I-V response test was conducted on four different monocrystalline solar panels, ranging from 60 W to 150W, at an installation site in Ago-Iwoye to assess the deviation in their electrical parameters compare to the manufacturer’s specifications. The aim was to determine the appropriate sizing of solar panel capacity for this location.
The electrical parameters evaluated were open circuit voltage Voc, short circuit current Isc, maximum output voltage Vmp, maximum power output Pmax, fill factor FF, and efficiency Eff.
The result revealed that the electrical parameters of all the four solar panels were lower than the manufacturer’s specifications. For the 60 W solar panel, the results revealed a maximum power output 43.92 W at solar irradiance of 787 w/m2 and a temperature of 31°C, indicating a 26.8% deviation from the manufacturer’s rated maximum power output specification. Similarly, for the 80 W solar panel, the maximum power output was 59.3 W at solar irradiance of 808 w/m2 and a temperature of 31°C, representing a 25.9% deviation from the manufacturer’s specification.
Additionally, for the 100 W solar panel, the maximum power output was 71.1 W at solar irradiance of 780 w/m2 and a temperature of 34°C, representing a 28.9% deviation from the manufacturer’s specification. For the 150 W solar panel, the maximum power output was 120.96 W at solar irradiance of 871 w/m2 and a temperature of 30°C, representing a 19.36% deviation from the manufacturer’s specification. This indicates that the percentage deviation of all the four solar panels ranges from 19% to 30% less than their rated power output specified by manufacturer. The fill factor and efficiency for each panel, were also lower than the manufacturer’s specification, ranging from 0.63 to 0.67 for fill factor, and from 10.38% to 12.55% for efficiency.
These deviations in electrical parameters were attributed to variation in solar irradiance, temperature, and spectral mismatch at the installation site. This highlights the importance of considering atmospheric conditions before installation and optimising solar panel designs and sizing for the specific environment in which they will be deployed. Therefore, for solar installation in Ago-iwoye localities, it is recommended to add an additional 20%–30% of each solar panel or the total solar panel capacity during solar PV projects ensure appropriate sizing, effective solar power generation and optimal performance.
To validate findings of this study, the results were compared with three other relevant studies. The parameters used for comparison include maximum power (Pmax), deviation in maximum power (Pmax deviation) and efficiency. Table 10 shows the comparison.
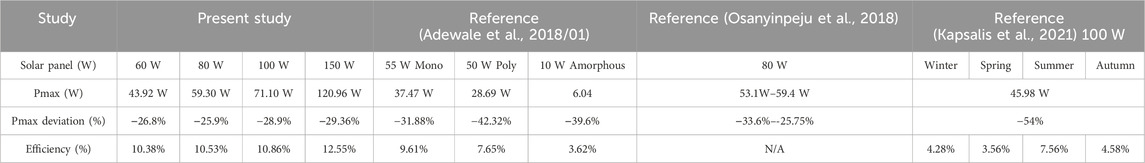
Table 10. Comparison of result between the current study and previous related research.
Data availability statement
The original contributions presented in the study are included in the article/Supplementary Material, further inquiries can be directed to the corresponding author.
Author contributions
TA: Data curation, Investigation, Methodology, Software, Writing–original draft, Writing–review and editing. TD: Conceptualization, Formal Analysis, Supervision, Writing–original draft, Writing–review and editing. TS: Validation, Writing–original draft, Writing–review and editing. CS: Validation, Visualization, Writing–original draft, Writing–review and editing. HO: Validation, Visualization, Writing–original draft, Writing–review and editing.
Funding
The author(s) declare that no financial support was received for the research, authorship, and/or publication of this article.
Acknowledgments
The authors appreciate Olabisi Onabanjo University for providing enabling environment for the research and Covenant University for her financial support.
Conflict of interest
The authors declare that the research was conducted in the absence of any commercial or financial relationships that could be construed as a potential conflict of interest.
Publisher’s note
All claims expressed in this article are solely those of the authors and do not necessarily represent those of their affiliated organizations, or those of the publisher, the editors and the reviewers. Any product that may be evaluated in this article, or claim that may be made by its manufacturer, is not guaranteed or endorsed by the publisher.
References
Adaramola, M., Paul, S., and Oyedepo, S. (2011). Assessment of electricity generation and energy cost of wind energy conversion systems in north-central Nigeria. Energy Convers. Manag. 52, 3363–3368. doi:10.1016/j.enconman.2011.07.007
Adewale, A. A., Adekitan, A. I., Idoko, O. J., Agbetuyi, F. A., and Samuel, I. A. (2018/01/01 2018). Energy audit and optimal power supply for a commercial building in Nigeria. Cogent Eng. 5, 1546658. doi:10.1080/23311916.2018.1546658
Ahmed, B., Necaibia, A., Slimani, A., Dabou, R., Ziane, A., and Sahouane, N. (2022) “A demonstrative overview of photovoltaic systems faults,” in Proceedings of the 2019 1st Global Power, Energy and Communication Conference (GPECOM),, Nevsehir, Turkey, 12–15 June 2019 (IEEE), 281–285.
Alilu, S. O. (2021). Determination of yearly performanceand degradation rate of electrical parameters of a monocrystalline pv module in minna, central Nigeria.
Dare, A. T., Wemimo, D. T., Emmanuel, S. T., Titilayo, S. C., and Joseph, D. (2023). Design methodology and implementation of stand-alone solar photovoltaic power system for daily energy consumption of 9.16 kWh. Eng. Res. Express 5 (4), 045033. doi:10.1088/2631-8695/acfdf5
Dolia, K., Sinha, A., Tatapudi, S., Oh, J., and TamizhMani, G. (2022) “Early detection of encapsulant discoloration by UV fluorescence imaging and yellowness IndexMeasurements,” in Proceedings of the 2018 IEEE 7thWorld Conference on Photovoltaic Energy Conversion (WCPEC) (A Joint Conference of 45th IEEE PVSC, 28th PVSEC and 34th EU PVSEC), Waikoloa, HI, USA, 10–15 June 2018 (IEEE), 1267–1272.
Dubey, R., Kottantharayil, A., Shiradkar, N., and Vasi, J. (2022) “Effect of mechanical loading cycle parameters on crack generation and power loss in PV modules,” in Proceedings of the 2021 IEEE 48th Photovoltaic Specialists Conference (PVSC), USA, 20–25 June 2021 (FL), 799–802. Fort Lauderdale.
Gopalakrishna, H., Arularasu, P., Dolia, K., Sinha, A., and Tamizhmani, G. (2022a) “Characterization of encapsulant degradation in accelerated UV stressed mini-modules with UV-cut and UV-pass EVA,” in Proceedings of the 2019 IEEE 46th Photovoltaic Specialists Conference (PVSC), Chicago, IL, USA, 16–21 June 2019 (IEEE), 1961–1964.
Gopalakrishna, H., Sinha, A., Oh, J., Dolia, K., Tatapudi, S., and Tamizhmani, G. (2022b)“Novel accelerated UV testing of field-aged modules: correlating EL and UV fluorescence images with current drop,” in Proceedings of the 2018 IEEE 7th World Conference on Photovoltaic Energy Conversion (WCPEC) (A Joint Conference of 45th IEEE PVSC, 28th PVSEC and 34th EU PVSEC), Waikoloa,HI, USA, 10–15 June 2018 (IEEE), 1603–1608.
Hachicha, A. A., Al-Sawafta, I., and Said, Z. (2019). Impact of dust on the performance of solar photovoltaic (PV) systems under United Arab Emirates weather conditions. Renew. Energy 141, 287–297. doi:10.1016/j.renene.2019.04.004
Hamdi, R. T., Hafad, S. A., Kazem, H. A., and Chaichan, M. T. (2018). Humidity impact on photovoltaic cells performance: a review. Int. J. Recent Eng. Res. Dev. 3, 27–37.
Ibrahim, A., Ramadan, M. R., Elsebaei, A., Elgohary, H., and AbdEldayem, A. E. (2021). Performance analysis of a Silicon PV module (100W) in outdoor conditions: experimental and Simulation study. Egypt. J. Solids 43, 192–210. doi:10.21608/ejs.2021.100187.1025
Jiang, Y., Qiu, L., Juarez-Perez, E. J., Ono, L. K., Hu, Z., Liu, Z., et al. (2019). Reduction of lead leakage from damaged lead halide perovskite solar modules using self-healing polymer-based encapsulation. Nat. Energy 4, 585–593. doi:10.1038/s41560-019-0406-2
Kapsalis, V., Kyriakopoulos, G., Zamparas, M., and Tolis, A. (2021). Investigation of the photon to charge conversion and its implication on photovoltaic cell efficient operation. Energies 14, 3022. doi:10.3390/en14113022
Kasera, R., and Khan, M. (2019). Semiconductor devices and electronic world. J. Pure Appl. Industrial Phys. 9, 29–39. doi:10.29055/jpaip/342
Kim, J., Rabelo, M., Padi, S., Yousuf, H., Cho, E.-C., and Yi, J. (2021). A review of the degradation of photovoltaic modules for life expectancy. Energies 14, 4278. doi:10.3390/en14144278
Li, F., Buddha, V. S. P., Schneller, E. J., Iqbal, N., Colvin, D. J., Davis, K. O., et al. (2021). Correlation of UV fluorescence images with performance loss of field-retrieved photovoltaic modules. IEEE J. Photovolt. 11, 926–935. doi:10.1109/jphotov.2021.3075865
Movahedian, Z., and Tavakoli-Anbaran, H. (2020). Design and optimization of Si-35S betavoltaic liquid nuclear battery in micro dimensions in order to build. Ann. Nucl. Energy 143, 107483. doi:10.1016/j.anucene.2020.107483
Naskar, M., and Meena, H. D. K. (2022)“Effect of UV ageing on thermo-mechanical properties of ethylene-vinyl acetate nanocomposite encapsulant,” in Proceedings of the 2021 IEEE International Conference on the Properties and Applications of Dielectric Materials (ICPADM), Johor Bahru, Malaysia, 12–14 July 2021 (IEEE), 278–281.
Nze-Esiaga, N., and Emmanuel, O. (2014). Assessment of wind energy potential as a power generation source in five locations of south western Nigeria. J. Power Energy Eng. 2, 1–13. doi:10.4236/jpee.2014.25001
Olusola, A., David, O., and Durowoju, O. (2018). Analysis of organic matter and carbonate mineral distribution in shallow water surface sediments. 1. 106–110.
Oluwaseun, K., Oyedepo, S., Dirisu, J., Richard, L., Babalola, P., Abraham, A., et al. (2023). Typical meteorological year data analysis for optimal utilization of energy systems at six selected locations in Nigeria. Int. J. Low-Carbon Technol. 18. doi:10.1093/ijlct/ctad014
Osanyinpeju, K. L., Aderinlewo, A. A., Adetunji, O. R., and Ajisegiri, E. (2018). Performance evaluation of mono-crystalline photovoltaic panels in Funaab, Alabata, Ogun State, Nigeria weather condition. Perform. Eval. 5, 8–20.
Sinan Rashid, A., and Safari, G. (2021). Technical performance evaluation of solar photovoltaic systems: a case study of eight PV systems on the Swedish market installed at RISE research facilities.
Somefun, T., Awosope, C., Abdulkareem, A., Ojo, J., Amuta, E., and Sanni, T. (2020). Cost implications analysis of grid supplied electricity and solar source of electricity in Nigeria. TELKOMNIKA 18, 3258–3265. doi:10.12928/telkomnika.v18i6.13558
Tress, W., Domanski, K., Carlsen, B., Agarwalla, A., Alharbi, E. A., Graetzel, M., et al. (2019). Performance of perovskite solar cells under simulated temperature-illumination real-world operating conditions. Nat. energy 4, 568–574. doi:10.1038/s41560-019-0400-8
Ugwuoke, P., and Okeke, C. (2012). Performance assessment of three different pv modules as a function of solar insolation in South Eastern Nigeria. Int. J. Appl. Sci. Technol. 2, 319–327.
Wilson, G. M., Al-Jassim, M., Metzger, W. K., Glunz, S. W., Verlinden, P., Xiong, G., et al. (2020). The 2020 photovoltaic technologies roadmap. J. Phys. D Appl. Phys. 53, 493001. doi:10.1088/1361-6463/ab9c6a
Yedidi, K., Tatapudi, S., Mallineni, J., Knisely, B., Kutiche, J., and TamizhMani, G. (2022) “Failure and degradation modes and rates of PV modules in a hot-dry climate: results after 16 years of field exposure,” in Proceedings of the 2014 IEEE 40th Photovoltaic Spe-cialist Conference (PVSC), Denver, CO, USA, 8–13 June 2014 (IEEE), 3245–3247.
Keywords: monocrystalline, solar panel, weather condition, electrical parameters, current, voltage
Citation: Awoyinka TD, David TW, Somefun TE, Somefun CT and Orovwode HE (2024) I-V response test of 60–150 W mono-crystalline solar panel. Front. Energy Res. 12:1375854. doi: 10.3389/fenrg.2024.1375854
Received: 24 January 2024; Accepted: 17 April 2024;
Published: 09 May 2024.
Edited by:
Qian Chen, Tsinghua University, ChinaReviewed by:
Muhammad Wakil Shahzad, Northumbria University, United KingdomMuhammad Burhan, King Abdullah University of Science and Technology, Saudi Arabia
Copyright © 2024 Awoyinka, David, Somefun, Somefun and Orovwode. This is an open-access article distributed under the terms of the Creative Commons Attribution License (CC BY). The use, distribution or reproduction in other forums is permitted, provided the original author(s) and the copyright owner(s) are credited and that the original publication in this journal is cited, in accordance with accepted academic practice. No use, distribution or reproduction is permitted which does not comply with these terms.
*Correspondence: T. E. Somefun, dG9iaS5zb21lZnVuQGNvdmVuYW50dW5pdmVyc2l0eS5lZHUubmc=