 Nan Zhu
 Xiaoning Ma1,2
- 1State Grid Liaoning Electric Power Supply Co., Ltd. Branch Materials, Shenyang, China
- 2State Grid Corporation of China, Beijing, China
- 3School of Electrical Engineering, Shenyang University of Technology, Shenyang, China
Green storage plays a key role in modern logistics and is committed to minimizing the environmental impact. To promote the transformation of traditional storage to green storage, research on the capacity allocation of wind-solar-storage microgrids for green storage is proposed. Firstly, this paper proposes a microgrid capacity configuration model, and secondly takes the shortest payback period as the objective function, and uses the improved sparrow search algorithm (ISSA) for optimization. Firstly, the Logistic-Tent compound chaotic mapping method is added to the population initialization of the sparrow search algorithm (SSA). Secondly, the adaptive t-distribution mutation is used to improve the discoverer, and the overall optimization ability of the algorithm is improved. Finally, the hybrid decreasing strategy is adopted in the process of vigilance position update. The ISSA can improve the search efficiency of the algorithm, avoid premature convergence and enhance the robustness of the algorithm, which is helpful to better apply to the optimal configuration of wind-solar-storage microgrid capacity in green storage. By analyzing the optimal capacity allocation results of two typical days, the system can better adapt to the dynamic storage requirements and improve the flexibility and sustainability of the supply chain.
1 Introduction
With the growing global concern for environmental sustainability, green storage, as an important component of modern logistics systems, has attracted extensive research interest (Jiang, 2021). In traditional storage systems, the high dependence on energy and the increase in environmental load has become a problem that cannot be ignored (Ma, 2023). Green energy and energy structure transformation are important changes in the current and future development of logistics parks. Rational use of clean energy is the key to achieving carbon neutrality (Liu, 2023). Therefore, researchers have turned to the search for more environmentally friendly and efficient storage solutions, among which wind-solar-storage systems have attracted much attention as a potential green energy solution (Li et al., 2023).
As the main renewable energy, wind energy and solar energy have been widely used and studied in various fields (Lazaroiu et al., 2023; Xu et al., 2024). In the logistics park, the use of the wind-solar-storage system can effectively deal with the instability and security problems that may be brought to the power system when renewable energy is introduced (Saxena et al., 2021; Jiang J. et al., 2023). This system not only helps to improve the stability of the power system, but also significantly reduces the energy consumption and carbon emissions of the logistics park, to achieve the goal of sustainable development (Kumar et al., 2019; You, 2024). With the dynamic change in storage demand, how to accurately and efficiently configure the capacity of wind and solar energy storage systems in the change has become an urgent problem to be solved (Li et al., 2016; Dulău, 2023). At present, there are few studies on the optimal allocation of wind-solar-storage capacity for green storage at home and abroad, but most of the optimal allocation of wind-solar-storage capacity is distributed in demand response and energy management (Nan, 2023).
Demand response plays an important role in optimizing the capacity configuration of wind-solar-storage system. Through the reasonable introduction and implementation of a demand response mechanism, the efficient, stable and sustainable operation of the power system can be realized, and the wide application and development of clean energy can be promoted (Chen, 2023a). In the problem of demand response, Jiang Z. et al. (2023) considered several demand response mechanisms with flexible load participation and established an energy storage economic configuration model, which effectively reduced system costs and improved energy consumption. Guo et al. (2022) added the electric vehicle model to the microgrid model based on the time-of-use electricity price and made full use of the flexible charging and discharging characteristics of electric vehicles to configure the capacity of the microgrid. Lei et al. (2024) proposed a two-layer optimal configuration method of microgrid based on stepped carbon trading and price-based demand response. Through two-layer optimization, the impact of carbon trading and demand response on system performance is fully considered, to realize the comprehensive optimization of microgrid system. The above literature covers several studies in the field of demand response, aiming to improve the economy and efficiency of the system by optimizing the capacity of different energy systems, and to promote the consumption level of renewable energy.
However, in the face of increasing energy demand and environmental protection pressure, effective energy management can not only improve energy efficiency but also achieve stable and sustainable development of system operation (Yan, 2024). Kumar et al. (2020) proposed a novel adaptive control technology AM-MKF (Adaptive Maximise-M Kalman Filter) and a novel MPPT technology L-HC (Learning-based Hill Climbing) for solar PV grid integrated system, to alleviate the oscillation problem of the system under steady-state conditions and improve the response speed of the system to dynamic changes. In the problem of energy management, Wu et al. (2023) optimized the configuration of the wind-solar power generation coupled hydrogen energy storage model from the aspects of economic and social benefits, which not only realized the efficient utilization of energy resources but also took into account the impact and benefits on society. Xu et al. (2024) not only considered the economy and reliability of the system, but also considered the environmental benefits. By introducing the carbon trading mechanism, the carbon emission reduction capacity of the microgrid was improved. In order to improve the economic and environmental benefits of microgrid systems, Wang et al. (2023) established the carbon emission measurement and carbon trading mechanism of microgrid systems, and effectively improved the economy of microgrid systems on the premise of reducing carbon emissions as much as possible. The above research aims to improve system reliability, improve the utilization efficiency of clean energy reduce energy consumption costs, and take into account the impact on the environment and society.
Aiming at the research of microgrid capacity optimization configuration algorithm, swarm intelligence algorithm has been widely used. Wang et al. (2022) used the particle swarm optimization algorithm to solve the model, but the algorithm is easy to fall into the local optimal solution. Zhao et al. (2022) adopted the improved grey wolf optimization algorithm. By combining a variety of improvement strategies, the problem that the grey wolf optimization algorithm is easy to fall into local optimum is improved. Yang (2010) adopts the bat algorithm and compares the improved particle swarm optimization algorithm with the genetic algorithm. However, the bat algorithm has some defects in the process of solution exploration, that is, the lack of an effective mutation mechanism, which leads to a certain probability of bat individuals falling into the local optimal solution. To solve the problem that the algorithm is easy to falls into the local optimal solution and the convergence accuracy is insufficient when dealing with the non-zero solution objective function, this paper proposes an improved sparrow search algorithm.
In summary, based on the consideration of time-of-use electricity price, this paper optimizes the capacity configuration model of microgrid systems for green storage. The improved sparrow search algorithm (ISSA) is used to optimize the microgrid capacity configuration model, including the introduction of a Logistic-Tent composite chaotic mapping strategy, adaptive t-distribution variation strategy, and mixed decreasing strategy. Two typical days are selected to solve the model to verify the effectiveness of the proposed model and the improved algorithm.
2 Microgrid capacity optimization configuration model for green storage
2.1 Structure and model of wind-solar-storage system
2.1.1 Wind-solar-storage system structure
Yang et al. (2023) proposed that the core concept of green storage is to realize the recycling of resources and energy inside and outside the storage system by imitating the operation principle of the natural ecosystem, to achieve the economic, efficient, and environmentally friendly operation objectives. In the configuration of the wind-solar-storage system, the generation of electric energy and the satisfaction of the storage power demand are regarded as part of the internal cycle. At the same time, selling excess electricity back to the power grid and interacting with the power grid constitutes another part of the external cycle. These two aspects work together to build a comprehensive application of wind-solar-storage in the green storage system. The structure of the wind-solar-storage microgrid system proposed in this paper is shown in Figure 1.

Figure 1. Green storage of wind-solar-storage microgrid system structure.
2.1.2 Photovoltaic power generation output model
In this paper, the photovoltaic power (PV) generation model proposed by Gao et al. (2023) and Diaf et al. (2007) is adopted. The output power of the PV generation system of this model can be calculated by Eq. 1.
Where
2.1.3 Wind power generation output model
In this paper, the wind power generation output model proposed by Justus (1978) and Borhanazad et al. (2014), and Su et al. (2023) is adopted. The output power of the wind turbine (WT) of this model can be calculated by Eq. 2.
Where
Where
2.1.4 Energy storage system model
Considering the advantages of mature battery energy storage technology, fast response speed, and relatively low price, this paper chooses centralized battery energy storage as the focus of research to optimize the capacity of wind-solar-storage microgrid systems.
The mathematical energy model of the battery in the state of charge is:
The mathematical energy model of the battery in the discharged state is:
Where
2.2 Optimization objective function and constraints
2.2.1 Objective function
In this paper, considering the economy, reliability, and environmental protection of the system, the shortest payback period is taken as the objective function, and the Equation is shown below:
Where
(1) Investment costs
Where
(2) Government subsidies
Where
(3) Revenue from electricity sales
The system sells the excess electricity generated by the PV and the WT, and the revenue earned is the revenue from the sale of electricity, which is expressed as:
Where
(4) Recovery of benefits
Where
(5) Operation and maintenance costs
During the operation of the system, regular maintenance and management of the power generation units is required to ensure that the PV panels, WTGs, and batteries can operate in a stable and normal manner. The cost incurred by these maintenance activities is known as the maintenance cost, expressed as:
Where
2.2.2 Constraints
(1) System power balance constraints
Setting the limiting conditions for the output power of the wind-solar-storage microgrid systems at any moment is shown in the following Equation:
Where
(2) Battery storage charging and discharging power, depth of discharge
Where
(3) Photovoltaic and wind turbine installation quantity constraints
Where
3 Microgrid capacity optimization algorithm for green storage
3.1 Sparrow search algorithm (SSA)
The sparrow search algorithm (SSA) originates from observing the survival behavioral patterns of a sparrow population, which contains discoverers, early warners, and followers. The discoverer searches for food while guiding the follower to access resources, and the less adapted sparrows forage around and even compete for the discoverer’s food, but the population share of both remains stable in the competition. Marginal individuals tended to move to relatively safe positions, while central individuals reduced the risk of predation. Alerts are issued when predators are detected, and when warnings exceed a safety threshold, the discoverer leads the follower to move toward a safe area. This algorithm can be applied to solve a variety of optimization problems by modeling the collaborative, competitive, and adaptive behavior of groups of organisms.
Discoverer location update strategy is:
Where
The formula for updating the position of the followers is as follows:
Where
The updating formula for an early warning person’s position is as follows:
Where
Although the SSA is superior to traditional heuristic algorithms such as particle swarm optimization (PSO) and grey wolf optimization (GWO) in terms of optimization ability and convergence speed, some solutions of SSA will gather near the origin in the later stage of iteration, which reduces the diversity of sparrow population and increases the possibility of ' premature ' convergence. To deal with these problems, this paper proposes an improved sparrow search algorithm.
3.2 ISSA for optimal configuration of microgrid capacity for green storage
3.2.1 Chaos mapping strategy
To solve problems such as the lack of diversity of sparrow populations in later iterations, this paper introduces chaotic mapping to generate the initial sparrow populations to increase their diversity and improve the quality of the initial solution of the algorithm. The particle distribution scatter plot and histogram are shown in Figure 2. Chaotic variables are random, so in the search optimization problem, it is used to increase the population diversity of the algorithm and improve the ability of the algorithm to jump out of the local optimal solution, thereby enhancing the global search performance of the algorithm.

Figure 2. Comparison of scatter plot and histogram of particle distribution. (A) SSA Initial Particle Distribution Plot. (B) SSA Initial Particle Distribution Histogram. (C) Chaos Algorithm Initial Particle Distribution Plot. (D) Chaos Algorithm Initial Particle Distribution Histogram.
Gao (2021) created a Logistic-Tent composite chaotic system by combining the classical one-dimensional Logistic chaotic system and the Tent chaotic system. This chaotic system combines the complex chaotic dynamics of the Logistic system with a faster iteration speed, more autocorrelation, and applicability to a large number of sequences of the Tent system, which is defined by the following mathematical formula:
Where
3.2.2 Adaptive t-distribution variation strategy
Because the t-distribution combines the robustness of the Cauchy-distribution and the smoothness of the Gaussian-distribution, the adaptive t-distribution variation strategy for the leading discoverers in the population can allow the discoverers to search for the best point faster. The adaptive t-distribution variation strategy aims to make the algorithm show strong global development ability in the early stage of iteration, and show good local exploration ability in the later stage of iteration, and improve the convergence speed of the algorithm. In this way, the advantages of global search and local search can be comprehensively utilized throughout the iteration process to optimize the SSA more effectively. The improved discoverer‘s location update method is as follows:
Where
The purpose of introducing the adaptive parameter
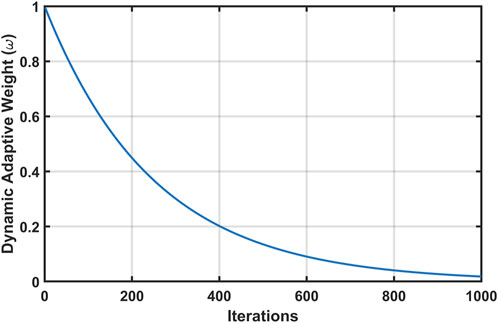
Figure 3. Dynamic adaptive weight change curve.
Where
3.2.3 Mixed decreasing strategy
In the SSA, the step control parameters
This strategy can dynamically adjust the search strategy according to the changes in the number of iterations, gradually shifting from a global search to a more focused local search, and the mathematical representation of this strategy is shown in the following Equation. With this strategy, the behavior of the algorithm can be flexibly adjusted at different stages to better adapt to the complexity of the problem and the characteristics of the search space.
Where
The step control parameter
Where
The hybrid decrementing strategy cleverly combines two different decrementing methods to adapt the search behavior of the algorithm more flexibly and efficiently. Such a strategy makes it possible to find an appropriate balance between global and local search, ensuring a better adaptation to the nature of the problem at different stages of the algorithm, thus improving the efficiency and accuracy of the search.
Based on the proposed improvement strategy, the pseudo-code of the ISSA is shown in Figure 4, and the process of solving the capacity optimization configuration of the ISSA is shown in Figure 5.
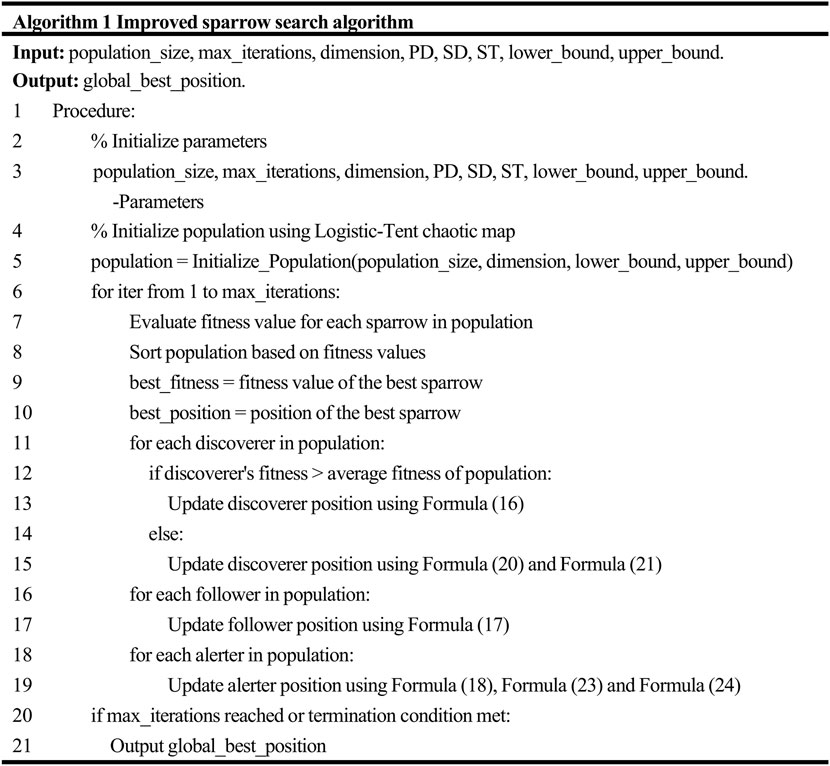
Figure 4. Pseudo-code of ISSA.
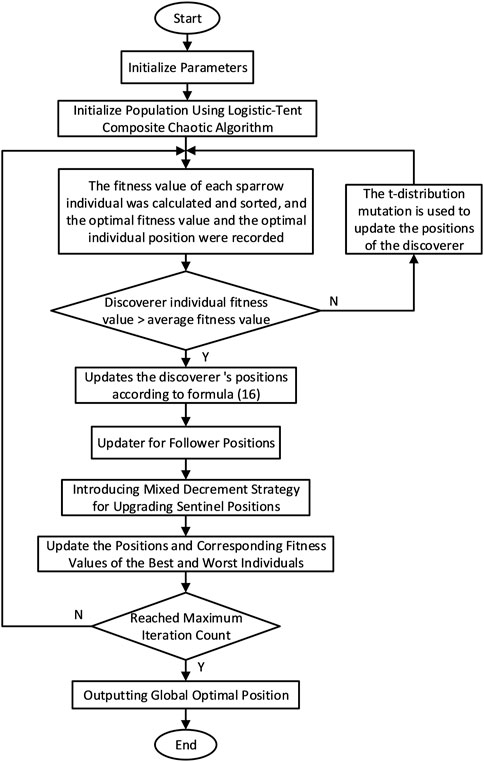
Figure 5. Flow chart of ISSA.
Step 1: Initialization parameters: the population size is n, the maximum number of iterations is, the spatial dimension is J, the number of discoverers is PD, the number of alerts is SD, the alarm threshold is ST, the initial upper and lower bounds are lb and ub, and the fitness function is;
Step 2: Population initialization: generate the initial population according to Eq. 19;
Step 3: Calculates and sorts the fitness value of each sparrow individual, and records the optimal fitness value and the optimal individual position;
Step 4: Determines whether the individual fitness value of the discoverer is greater than the average fitness value. If it is greater than, the location of the discoverer is updated according to Eq. 16. If the conditions are not met, the location of the discoverer is updated according to Eqs 20–22;
Step 5: Update the follower position according to Eq. 17;
Step 6: Update the follower position according to Eqs 18–24;
Step 7: Update the position of the best and worst individuals and the corresponding fitness value;
Step 8: Until the maximum number of iterations is reached, the global optimal position is output.
In summary, the SSA itself has a certain global search ability. Introducing the Logistic-Tent chaos mapping strategy and the adaptive t-distribution variation strategy, can not only further enhance the global search ability of the algorithm, but also help the algorithm to perform more effectively in the search process. These two strategies help to explore potential optimization solutions more extensively in the search space and fine-tune the performance of solutions. The mixed decreasing strategy is introduced to the step size control parameters of the early warning, and the decreasing step size strategy makes the algorithm less sensitive to the choice of initial parameters. Even if the initial parameter setting is not good, the algorithm still can achieve good optimization results by gradually adjusting the step size in the later stage, which enhances the robustness of the algorithm. Therefore, the ISSA can improve the search efficiency of the algorithm, avoid premature convergence, and enhance the robustness of the algorithm, which is helpful for better application to solve the problem of optimal capacity allocation of wind-solar-storage microgrid.
4 Case study
4.1 Date settings
Taking the storage in a certain area as an example object, according to the proposed capacity optimization allocation model and optimization strategy, the ISSA is used to optimize the capacity of the wind-solar-storage system in a microgrid. The total electricity consumption of the storage load for the whole year (8760 h) is 1.004 MWh, and the average load is 114.59 kWh, while the average annual wind speed of the region is 8.43 m/s, and the average light intensity is 234W/m2, and the data of the storage is shown in Figure 6.

Figure 6. Annual data for this storage. (A) Hourly light intensity throughout the year. (B) Hourly wind speed throughout the year. (C) Hourly loads throughout the year.
To capture the performance characteristics of the system under seasonal extreme conditions, the performance characteristics of the system under high wind speed, low wind speed, high light intensity, and low light intensity are considered, and two typical days are selected and their data are analyzed; the typical days are July in summer when the wind speed is high and the light intensity is high, and December in winter when the wind speed is low and the light intensity is low, as shown in Figure 7. The economic parameters of the configured wind-solar storage equipment are shown in Table 1. The electricity price between the microgrid system and the power grid in different periods is shown in Table 2.
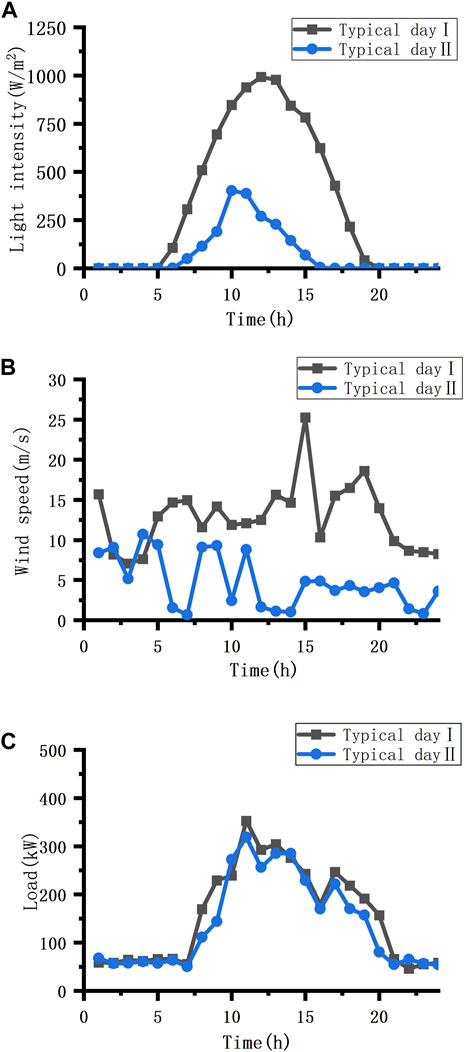
Figure 7. Weather conditions and load demand under two typical days. (A) Light intensity. (B) Wind speed. (C) Load demand.
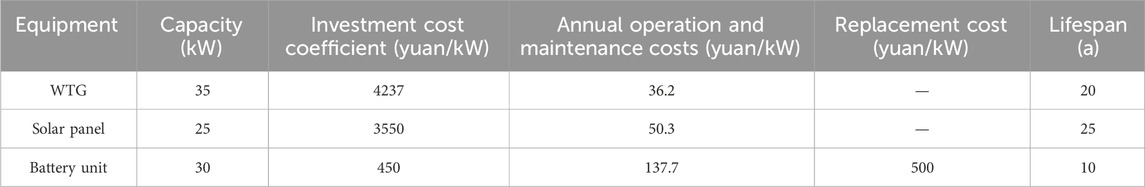
Table 1. Distributed power economy parameters.
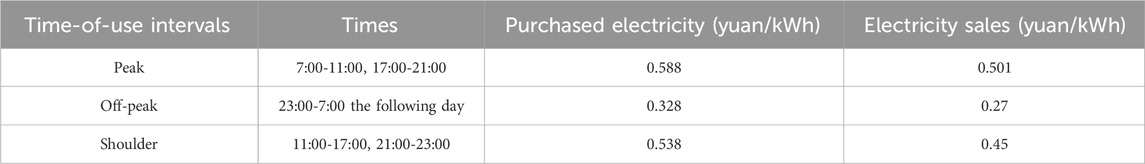
Table 2. Time-share electricity purchase and sale tariffs.
In Figure 7, the light intensity of typical day I was larger from 10:00 to 15:00, and there was no light at about 19:00, and the wind speed was larger in the whole period. On the typical day II, the light intensity was larger during the period of 10:00–12:00, and there was no light at 17:00. The wind speed was larger during 1:00–5:00 and 8:00–11:00.
4.2 Microgrid capacity configuration results in green storage
To verify the optimal configuration model of power capacity of a wind-solar-storage microgrid in this paper, simulation analysis is carried out in two typical days. The capacity configuration results of the wind-solar-storage microgrid for green storage are in Table 3. The operation of the two typical days under the optimal capacity configuration results is shown in Figure 8.
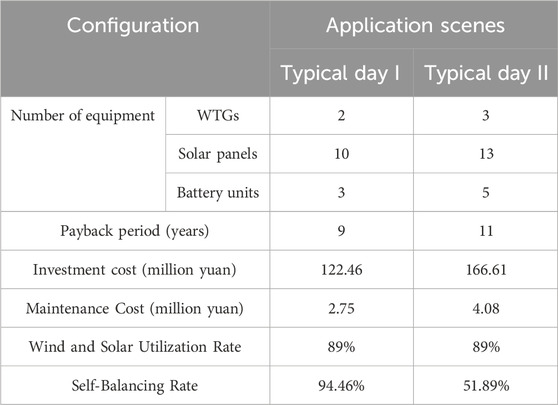
Table 3. Capacity allocation results.
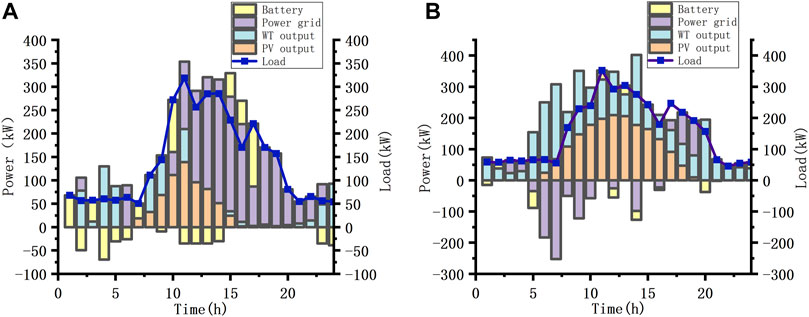
Figure 8. The operation of two typical days under the optimal capacity configuration results (A) Operation of typical day I. (B) Operation of typical day II.
Table 3 shows that the investment cost of typical day I is less than that of typical day II, the payback period is also shorter than that of typical day II, and the number of PV panels and wind turbines connected is less than that of typical day II. This shows that the economy of the system is superior under the climate conditions of typical day I. Under different climate conditions, the number of PV panels and wind turbines need to be adjusted to ensure that the system can operate efficiently under various weather conditions and to improve the overall economy, and better climate conditions make the system require less investment in equipment under the condition of obtaining the same amount of power generation. Such a comparison illustrates that the wind and solar storage capacity configuration must take full account of local climatic conditions and that different wind and solar weather will directly affect the capacity configuration of the system, and thus the economics. Under better wind and solar climatic conditions, the system is more likely to obtain higher power generation efficiencies, which reduces the need for equipment, lowers the cost of investment, and shortens the payback period.
The wind and light utilization rates of typical day I and typical day II are both higher, indicating that the system can convert solar and wind energy into electricity more efficiently and maximize the use of renewable resources, which is of great significance for improving the economy and sustainability of the system. In Figure 9, there is no need to purchase electricity from the power grid on the typical day I from 8:00 to 16:00 during the peak period of electricity consumption, and electricity can be sold to the power grid from 7:00 to 10:00 and 11:00 to 13:00. The self-balancing rate of the system is high, which reduces the dependence on the external power grid, increases the independence of the system, and improves the comprehensive utilization rate of the system energy. In contrast, the self-balancing rate of typical day II is low, and power is purchased from the power grid from 10:00 to 19:00 during the peak period of power consumption, indicating that the system is more dependent on the external power grid to meet the power demand, thus increasing the operating cost and reducing the self-sufficiency of the system.
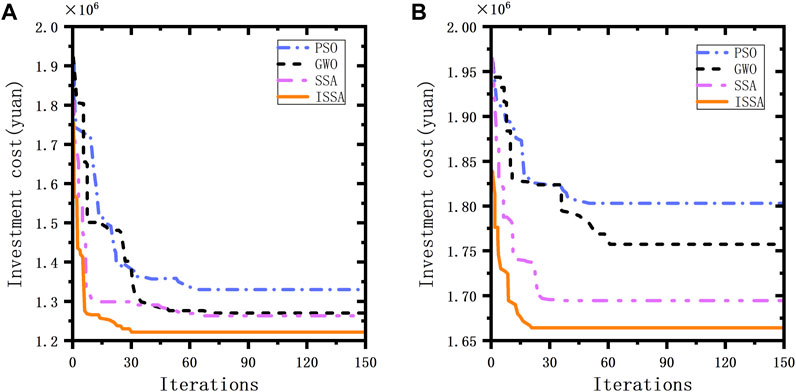
Figure 9. Comparison of iterative optimization curves of four optimization algorithms (A) Comparison of iterative optimization curves of typical day I. (B) Comparison of iterative optimization curves of typical day II.
4.3 Comparison of algorithms
In this paper, ISSA, SSA, PSO and GWO are used to analyze the investment cost of the two typical days of the wind-solar-storage model. The algorithm parameters are set as shown in Table 4, the population size is uniformly set to 100, and the number of iterations is uniformly set to 150. The simulation experiment is run under the Matlab 2023a simulation platform. The comparison of the four algorithms is shown in Table 5, and the iterative optimization curve is shown in Figure 9.
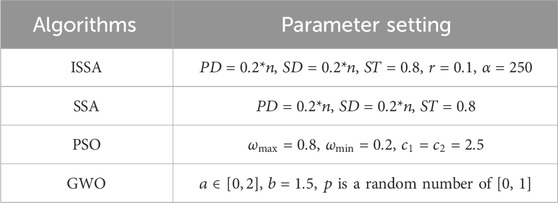
Table 4. Algorithm parameter settings.
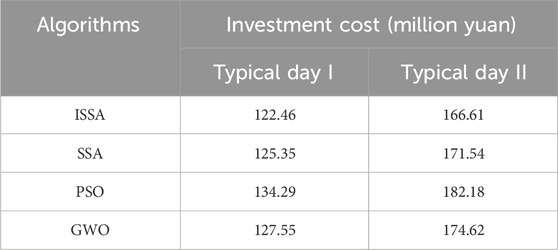
Table 5. Comparison of capacity configuration results of four algorithms.
It can be seen from Table 5 that the ISSA algorithm has achieved the minimum investment cost in two different typical days. Compared with the other three algorithms (SSA, PSO and GWO), ISSA decreased by 2.36%, 9.66% and 4.16% on typical day I, and decreased by 2.96%, 9.34% and 4.81% on typical day II, respectively. This shows that the ISSA algorithm has a lower cost than other algorithms in the wind-solar-storage investment cost allocation model. Further analysis of Figure 9 shows that the ISSA adopts the Logistic-Tent composite chaotic mapping strategy, which makes it have a faster convergence speed at the initial stage of iteration. In contrast, the other three algorithms (SSA, GWO, PSO) fall into the local optimal solution. This shows that the ISSA has better global search ability in optimizing the objective function, and can more effectively avoid falling into the local optimal solution. The improvement of this global search ability makes the ISSA algorithm better find the optimal solution for investment cost.
In summary, ISSA not only achieves better results in the cost allocation model of wind-solar-energy storage investment but also shows faster convergence speed and better global search ability in the optimization process.
5 Conclusion
In this paper, aiming at the premature convergence of SSA to local optimal solution in the later stage of iteration, ISSA is adopted, including three improved strategies: Logistic-Tent composite chaotic map, adaptive t-distribution mutation and mixed decreasing. Compared with the standard SSA, PSO and WGO, ISSA not only achieves better results in the configuration model but also shows faster convergence speed and better global search ability in the optimization process. It is proved that ISSA effectively improves the global optimization performance of the algorithm. Based on the establishment of the microgrid capacity configuration model for green storage, the shortest payback period is proposed as the objective function, and the influence of time-of-use electricity price and different weather conditions on the system is fully considered. For the problem of optimal configuration of microgrid capacity for green storage, ISSA provides an important reference value for the optimal configuration of the model.
Data availability statement
The original contributions presented in the study are included in the article/Supplementary material, further inquiries can be directed to the corresponding author.
Author contributions
NZ: Conceptualization, Funding acquisition, Supervision, Writing–original draft, Writing–review and editing. XM: Conceptualization, Methodology, Writing–original draft, Writing–review and editing. ZG: Investigation, Project administration, Writing–review and editing. CS: Data curation, Validation, Visualization, Writing–review and editing. JL: Conceptualization, Data curation, Writing–review and editing.
Funding
The author(s) declare that financial support was received for the research, authorship, and/or publication of this article. This work was financially supported by the State Grid Liaoning Electric Power Co, Ltd. Science and Technology Project (2023YF-160).
Conflict of interest
Authors NZ, XM, ZG, and CS were employed by State Grid Liaoning Electric Power Supply Co., Ltd. Branch Materials. Authors NZ, XM, ZG, and CS were employed by State Grid Corporation of China.
The remaining author declares that the research was conducted in the absence of any commercial or financial relationships that could be construed as a potential conflict of interest.
The authors declare that this study received funding from State Grid Liaoning Electric Power Co, Ltd. The funder had the following involvement in the study: Supervision, Conceptualization, Methodology, Investigation, Date curation, Validation, Visualization.
Publisher’s note
All claims expressed in this article are solely those of the authors and do not necessarily represent those of their affiliated organizations, or those of the publisher, the editors and the reviewers. Any product that may be evaluated in this article, or claim that may be made by its manufacturer, is not guaranteed or endorsed by the publisher.
References
Borhanazad, H., Mekhilef, S., Ganapathy, V. G., Modiri-Delshad, M., and Mirtaheri, A. (2014). Optimization of micro-grid system using MOPSO. Renew. energy 71, 295–306. doi:10.1016/j.renene.2014.05.006
Chen, C., Wang, Y., Xie, X., Wang, J., and Xiao, B. (2023b). Improved chaotic seagull optimisation algorithm incorporating sparrow search mechanism. Sci. Technol. Eng. 23 (10), 4259–4271.
Chen, R. (2023a). Two-layer optimization of power capacity in microgrid considering demand response. Guangxi: Guangxi University. master’s thesis. doi:10.27034/d.cnki.ggxiu.2023.000765
Diaf, S., Diaf, D., Belhamel, M., Haddadi, M., and Louche, A. (2007). A methodology for optimal sizing of autonomous hybrid PV/wind system. Energy policy 35 (11), 5708–5718. doi:10.1016/j.enpol.2007.06.020
Dulău, L.-I. (2023). Power cost and CO2 emissions for a microgrid with hydrogen storage and electric vehicles. Sustainability 15, 15750. doi:10.3390/su152215750
Gao, J., Yan, W., Pau, G., Lin, L., and Wen, Y. (2023). Multi-objective capacity optimization configuration of independent wind-photovoltaic- hydrogen-battery system based on improved MOSSA algorithm. Front. Energy Res. 10, 1077462. doi:10.3389/fenrg.2022.1077462
Gao, Y. (2021). Pseudo-random sequence IP design based on logistic chaos algorithm. Heilongjiang: Heilongjiang University. master’s thesis. doi:10.27123/d.cnki.ghlju.2021.000474
Guo, Y., Zhang, J., He, Y., Liu, Y., Deng, K., and Long, B. (2022). Hybrid energy storage configuration of micro-grid considering charge-discharge response of EVs. Power Grid Clean Energy 38 (08), 82–93.
Jiang, J., Fu, S., Qi, X., Zhang, X., and Wang, D. (2023a). Research on energy storage capacity optimization and operation control strategy of wind-solar-storage system in the park. Electr. Technol. And Econ. 10, 110–112.
Jiang, X. (2021). Research on the development path and countermeasures of green logistics in China. Logist. Eng. Manag. 11, 16–18.
Jiang, Z., Xiang, Y., Tan, Z., Guo, Y., Wang, Y., and Zhou, K. (2023b). Optimal configuration of energy storage capacity in high-proportion clean energy parks considering demand response. China Electr. 56 (12), 147–155+163.
Justus, C. G. (1978). Wind energy statistics for large arrays of wind turbines (New England and Central US Regions). Sol. Energy 20 (5), 379–386. doi:10.1016/0038-092x(78)90153-6
Kumar, N., Singh, B., and Panigrahi, B. K. (2019). Grid synchronisation framework for partially shaded solar PV-based microgrid using intelligent control strategy. IET Generation, Transm. Distribution 13 (6), 829–837. doi:10.1049/iet-gtd.2018.6079
Kumar, N., Singh, B., Wang, J., and Panigrahi, B. K. (2020). A framework of L-HC and AM-MKF for accurate harmonic supportive control schemes. Circuits Syst. I Regul. Pap. IEEE Trans.67 (99), 5246–5256. doi:10.1109/tcsi.2020.2996775
Lazaroiu, A. C., Gmal Osman, M., Strejoiu, C.-V., and Lazaroiu, G. (2023). A comprehensive overview of photovoltaic technologies and their efficiency for climate neutrality. Sustainability 15, 16297. doi:10.3390/su152316297
Lei, W., Jun, P., Wei, J., and Yu, L. (2024). Bi-level optimization configuration method for microgrids considering carbon trading and demand response. Front. Energy Res. 11, 1334889. doi:10.3389/fenrg.2023.1334889
Li, Q., and Hu, R. (2023). Analysis of the development status of green logistics under the background of double carbon. Logist. Eng. And Manag. 45 (06), 1–3.
Li, R., and Zhang, W. (2016). Energy demand forecasting of logistics industry based on RBF neural network. Resour. Sci. 38 (03), 450–460.
Lin, L. (2021). Research on multi-objective optimal scheduling and shared energy storage capacity allocation of micro-energy networks based on typical scenarios. Zhejiang: Zhejiang University. master’s thesis.
Liu, S. (2023). The planning scheme of the development path of the logistics park under the background of double carbon is constructed. Time-honored Brand Mark. (24), 44–46.
Lv, X., Mu, X., Zhang, J., and Wang, Z. (2021). Chaotic sparrow search optimisation algorithm. J. Beijing Univ. Aeronautics Astronautics 47 (08), 1712–1720. doi:10.13700/j.bh.1001-5965.2020.0298
Ma, G. (2023). Low-carbon economy promotes the transformation and upgrading of logistics industry. Public Invest. Guide 13, 191–193.
Nan, B., Dong, S., Tang, K., Zhu, M., Zhang, X., and Chen, W. (2023). Optimal configuration of energy storage in PV-storage microgrid considering demand response and uncertainties in source and load. Power Grid Technol. 47 (04), 1340–1352. doi:10.13335/j.1000-3673.pst.2022.0798
Saxena, V., Kumar, N., Singh, B., and Panigrahi, B. K. (2021). An MPC based algorithm for a multipurpose grid integrated solar PV system with enhanced power quality and PCC voltage assist. IEEE Trans. Energy Convers. 36 (2), 1469–1478. doi:10.1109/tec.2021.3059754
Su, W., Zheng, W., Li, Q., Yu, Z., Han, Y., and Bai, Z. (2023). Capacity configuration optimization for green hydrogen generation driven by solar-wind hybrid power based on comprehensive performance criteria. Front. Energy Res. 11, 1256463. doi:10.3389/fenrg.2023.1256463
Wang, J., Miao, S., Yao, F., Wang, Y., Lin, S., and Wei, W. (2023). Multi-objective capacity optimization configuration in microgrid considering life cycle carbon metering and carbon trading mechanism. Mod. Electr., 1–10.
Wang, X., Chen, Z., Bian, Z., Wang, Y., and Wu, Y. (2022). Optimal allocation of a wind‒PV‒battery hybrid system in smart microgrid based on particle swarm optimization algorithm. Integr. Smart Energy 44 (06), 52–58.
Wang, Y., and Chen, J. (2023). Optimal allocation of hybrid energy storage capacity for optical storage microgrid based on ISSA. Intell. Power 51 (04), 23–29+53.
Wu, M. (2023). Capacity optimization configuration model for Wind-Photovoltaic power generation coupled with hydrogen energy storage system under carbon emission reduction. Beijing: North China Electric Power University. master’s thesis. doi:10.27140/d.cnki.ghbbu.2023.001113
Xiong, X., Hu, X., and Guo, H. (2021). A hybrid optimized grey seasonal variation index model improved by whale optimization algorithm for forecasting the residential electricity consumption. Energy 234, 121127. doi:10.1016/j.energy.2021.121127
Xu, Y., and Hu, Z. (2024). Source-grid-load cross-area coordinated optimization model based on IGDT and wind-photovoltaic-photothermal system. Sustainability 16, 2056. doi:10.3390/su16052056
Xu, Z., Chen, F., Yang, X., and Lu, Q. (2024). Optimal configuration of hybrid energy storage capacity in a grid-connected microgrid considering laddering carbon trading and demand response. Energies 17, 139. doi:10.3390/en17010139
Yan, Q., Jia, Y., Ma, Y., and Song, X. (2024). Two-layer energy management strategy of microgrid based on Stackelberg master-slave game. J. Sol. Energy, 1–9.
Yang, X. (2010). A new met heuristic bat-inspired algorithm. Nat. Inspired Coop. Strategies Optimiza- tion, 66–73.
Yang, X., Zi, C., Han, W., and Yang, Y. (2023). A review of green warehousing research. Environ. Prot. Circular Econ. 43 (09), 4–6+94.
You, B. (2024). Research on green development strategy of logistics enterprises in low carbon economy environment. Mall. Mod. (01), 21–23. doi:10.14013/j.cnki.scxdh.2024.01.001
Zhang, P., Lu, X., and Meng, Q. (2023). Optimal allocation of microgrid capacity based on multi-strategy sparrow search algorithm. Electr. Technol. 24 (01), 1–9.
Keywords: green storage, microgrid, capacity configuration, wind-solar-storage system, sparrow search algorithm
Citation: Zhu N, Ma X, Guo Z, Shen C and Liu J (2024) Research on the optimal capacity configuration of green storage microgrid based on the improved sparrow search algorithm. Front. Energy Res. 12:1383332. doi: 10.3389/fenrg.2024.1383332
Received: 07 February 2024; Accepted: 08 April 2024;
Published: 03 May 2024.
Edited by:
Chixin Xiao, University of Wollongong, AustraliaReviewed by:
Linfei Yin, Guangxi University, ChinaNishant Kumar, Indian Institute of Technology Jodhpur, India
Copyright © 2024 Zhu, Ma, Guo, Shen and Liu. This is an open-access article distributed under the terms of the Creative Commons Attribution License (CC BY). The use, distribution or reproduction in other forums is permitted, provided the original author(s) and the copyright owner(s) are credited and that the original publication in this journal is cited, in accordance with accepted academic practice. No use, distribution or reproduction is permitted which does not comply with these terms.
*Correspondence: Nan Zhu, Njc3NDIxMjNAcXEuY29t