 Xiaoyu Cui
 Zhewei Chen1
 Zhengdong Lei
- 1Research Institute of Petroleum Exploration and Development, PetroChina, Beijing, China
- 2PetroChina Daqing Oilfield Co., Ltd., Daqing, China
- 3School of Energy Resources, China University of Geosciences (Beijing), Beijing, China
This study investigates the shale oil drainage characteristics from the Gulong Sag, The objective is to clarify the development method for effective recovery enhancement of terrestrial shale oil. The investigation employs elastic depletion, CO2 displacement, and CO2 huff and puff coupled with nuclear magnetic resonance (NMR) measurements and numerical simulation methods. The study found that the elastic depletion, CO2 displacement, and CO2 huff and puff utilization efficiencies were 17.4%, 18.87%, and 21%, respectively. The study evaluated the oil drainage efficiency of different pore sizes in elastic depletion and CO2 huff and puff modes. The results demonstrated a clear trend in the order of micropore, mesoporous and macropore, with micropores exhibiting the highest oil drainage efficiency due to gas channeling during CO2 displacement. The use of CO2 huff and puff has been shown to improve oil drainage efficiency by 6.02%∼9.2% for different pore sizes. The numerical simulation optimization results suggest an injection volume of 3,000 t per round per well, an injection rate of 100 t/d, and a soaking time of 20 d for optimal CO2 huff and puff injection. This will increase oil production by 65,000 m³, resulting in an overall improvement of 24%. The study results provide a strong theoretical foundation for improving the recovery rates of terrestrial shale oil and gas through injection.
1 Introduction
China’s terrestrial shale oil is mainly distributed in the Songliao Basin, Ordos Basin, Junggar Basin, Sichuan Basin and Jianghan Basin, etc., which are widely distributed and have huge resources, The use of natural energy development suffers from rapid pressure drop and diminishing producation. Gulong shale oil is the most typical in situ terrestrial shale oil and the reservoir is characterised by tight lithology and high clay mineral content compared to domestic and foreign shales dominated by marine or saline lake basin deposits; The storage space is a nano-matrix pore with a pore throat diameter of 10 nm–50 nm; Porosity ranges from 2.1% to 12.0% and permeability is less than 0.01 mD (Wang et al., 2021; He et al., 2023). Due to the characteristics of tight lithology, low porosity and low permeability, effective development is a major challenge and studies have shown that unconventional reservoirs can be effectively developed by gas injection to improve recovery (Fu et al., 2023).
Tao conducted an experimental study of cyclic gas injection in the Eagle Ford Shale using a simulation method, and the results showed that cyclic gas injection in hydraulically fractured shale reservoirs can increase the total oil recovery rate by 29% (Tao et al., 2013). Ao carried out high pressure PVT tests and long thin tube alternation flooding experiments to carry out the indoor evaluation study of gas injection and CO2 flooding to improve recovery. Through the analysis of crude oil physical properties and oil displacement efficiency, it shows that the continuous injection of rich gas and alternating injection can improve the recovery rate by more than 28% (Ao et al., 2016). Zhao carried out CO2–formation crude oil contact experiments, core seepage experiments and indoor displacement experiments to describe the two-phase seepage characteristics of CO2–formation crude oil, to analyse the CO2 flooding mechanism and displacement characteristics, and to conduct mine experiments in the Jingbian extra-low permeability oil reservoir. Research has shown that the gas injection capacity of extra-low permeability reservoirs is twice that of water injection, and that gas injection can quickly and effectively replenish formation energy and increase oil production, with daily liquid and oil production in the test area increasing overall (Zhao et al., 2018). Yao carried out an experimental study of CO2 displacement using one-dimensional and two-dimensional nuclear magnetic resonance (NMR) technology evaluation methods with Ordos Basin Chang 7 Shale core samples. The results show that the relative volume fraction of free oil in the replacement is over 50% (Yao et al., 2023). Kong took Hailar oilfield as the research object to carry out CO2 injection gravity oil repulsion experiments, and the CO2 flooding efficiency could reach 55.9% when injecting 1.2 PV of CO2 at the original formation pressure of 10.57 MPa (Kong et al., 2023). In recent years, many scientists at home and abroad have conducted research on different injection media, influencing factors and the degree of shale oil recovery.
In this paper, the core samples of the Gulong Sag were taken as the research objects, and the indoor experiments of elastic depletion, CO2 displacement and CO2 huff and puff were carried out based on the formation temperature and pressure conditions, so as to clarify the degree of utilization of different pore spaces and the efficiency of different development methods. The effect of different huff and puff parameters on enhanced recovery were further investigated with numerical simulation methods to provide a theoretical basis for the efficient development of shale oil in the Gulong Sag.
2 Materials and methods
The indoor experiments in this paper are based on NMR experimental methods with elastic depletion, CO2 displacement and CO2 huff and puff co-examination. In order to simulate the actual reservoir conditions, the experimental temperatures and pressures were consistent with the formation, and the oil used for the experiments was wellhead degassed crude oil. The utilization efficiency and the percentage of utilization pores of different sizes under different development methods were quantitatively characterised by NMR T2 spectral analysis. Numerical simulation experiments were carried out to determine the optimum values of each parameter by optimising the design of the three main parameters.
2.1 Sample information
The mineral composition of the shale in the Gulong Sag is mainly dominated by clay minerals, quartz and feldspar, followed by calcite and dolomite. The specific parameters of the core samples are given in Table 1.

Table 1. Parameters of shale cores in the Gulong Sag.
2.2 Experimental setup
The experimental setup includes a MesoMR3-060H-I NMR instrument, drying apparatus, saturation device, loading device, high temperature and high pressure MR-dd displacement device, data acquisition and RF device, and hand pump. Where the NMR experiments have an echo interval of 0.2 ms and a waiting time of 3,000 ms.
2.3 Experimental methods
The following three experimental scenarios are based on the parameters of 41 MPa boundary pressure, 35 MPa pore pressure, 118.5°C actual reservoir temperature, 38 MPa reservoir pressure, 30% RH humidity and CO2 with a purity of 99.95% or more as the displacement/huff and puff medium.
2.3.1 Elastic depletion experiments
The samples were vacuumed and saturated with formation crude oil after deoiling and drying, and then the sample pore pressure was increased by injecting crude oil at both ends of the sample under 41 MPa confinement pressure conditions, and the depletion pressure were set to 5 MPa, 15 MPa, 25 MPa, and 35 MPa, respectively. During the oil-saturation process, the confinement pressure was maintained unchanged and the T2 spectrum of the NMR signal was monitored in real time, and when the NMR T2 spectrum was stable, the saturation pressure was stopped and the pore pressure released. Once the pore pressure had been completely released and the NMR T2 spectrum had stabilized, the T2 spectrum of the sample’s NMR signal was measured at this point and the experiment was terminated.
2.3.2 CO2 displacement experiments
The dried core samples were vacuumed and saturated with formation crude oil until the cores were fully saturated with formation crude oil to test the NMR T2 spectra at this point. The confinement pressure was kept constant by the core holder and the T2 spectra of the NMR signals were measured at displacement pressures of 5 MPa, 10 MPa, 15 MPa, and 20 MPa respectively and the NMR maps were plotted and the results analysed.
2.3.3 CO2 huff and puff experiments
After deoiling and drying, samples were treated with evacuated, saturated formation crude oil and tested for NMR signals at this point. The T2 spectrum of the NMR signal was tested under 35 MPa pore pressure and reservoir temperature conditions for 10 h, followed by pressure release and oil drainage for 5 h. The steps of CO2 huff and puff, soaking and pressure release and oil drainage were repeated to test the NMR T2 spectra with different rounds and to analyse the experimental results.
2.4 Numerical simulation methods
The results of the indoor experiments demonstrate that the CO2 huff and puff mode has a high utilization efficiency. A CO2 huff and puff mode was established based on the real reservoir characteristics in the Gulong Sag to investigate the impact of individual CO2 huff and puff parameters on recovery improvement. The CO2 huff and puff mode is presented in the table below. The numerical simulation model parameters were formulated based on the optimised design of the single-round injection volume of a single well, the injection rate, the soaking time, and the three main parameters (as shown in Table 2), using the basic parameters from Table 3. The analysis of huff and puff oil production was conducted under various parameter conditions with confidence.
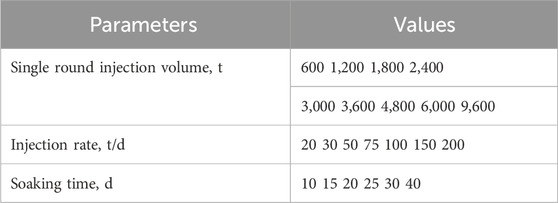
Table 2. Range of optimisation parameters.
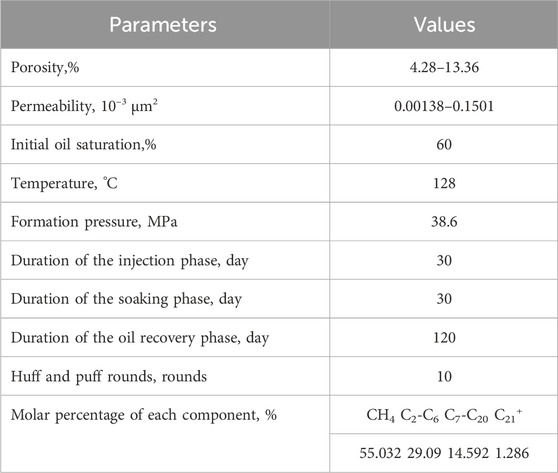
Table 3. Basic model parameters.
3 Results and discussion
Figures 1A–C clearly demonstrates the NMR T2 spectra for different conditions: elastic depletion mode, CO2 displacement mode, and CO2 huff and puff mode. The results unequivocally indicate that the degree of oil drainage varies depending on the pore size and elasticity. Pores with greater elasticity are significantly more effective in promoting oil drainage. The spectral samples clearly demonstrate that the pore structure of core samples (a) is relatively simple, while that of core samples (b) and (c) is relatively complex, as evidenced by their classification into single-peak and double-peak states.
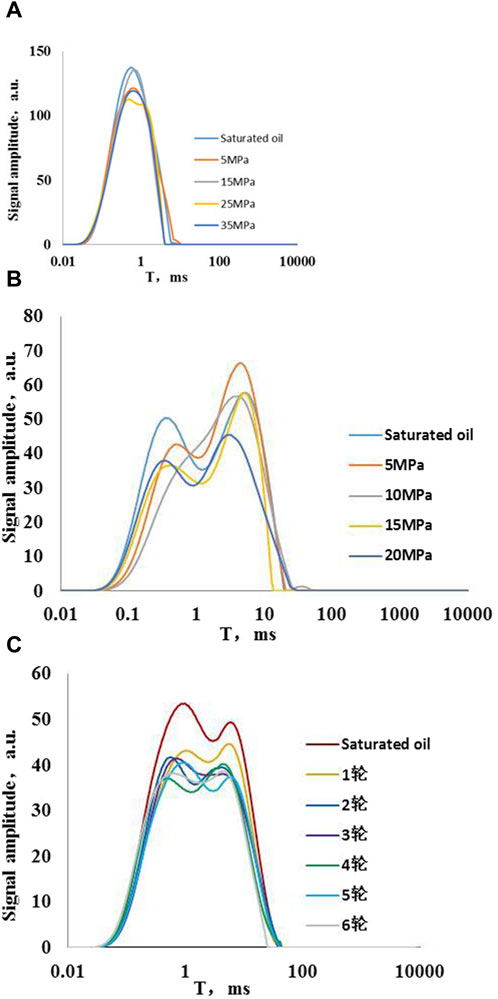
Figure 1. (A–C) show the NMR T2 spectra of the samples during elastic depletion, displacement, and huff and puff modes, respectively.
3.1 Utilization efficiency in utilizing various development models
Figure 2 displays the utilization efficiency of four samples exhibiting the elastic depletion mode under different differential pressures. The figure clearly demonstrates that all four samples exhibit an increasing trend in utilization efficiency with increasing differential pressure of the depletion. This indicates that as the differential pressure of the depletion increases, the compressed fluid’s expansion energy in the pore space also increases, thereby promoting oil discharge. The results demonstrate that the utilisation efficiency of the samples varies significantly with differential pressure. The lowest efficiency was observed at 5 MPa, while the highest was achieved at 35 MPa, reaching an impressive maximum of 21.2%. Notably, utilisation efficiency increased rapidly as the differential pressure increased from 5 MPa to 15 MPa, and continued to gradually increase from 15 MPa to 25 MPa. Although the increase in utilisation efficiency was slower and less pronounced when the differential pressure increased from 25 MPa to 35 MPa, the overall trend indicates a clear relationship between differential pressure and utilisation efficiency. The elastic depletion mode resulted in an average utilization efficiency of 17.4% at a differential pressure of 35 MPa.
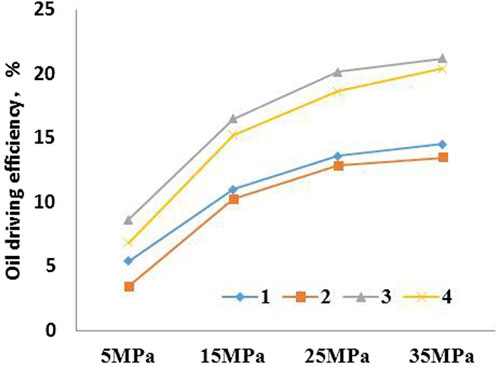
Figure 2. Shows the utilization efficiency of four core samples in the elastic depletion mode at differential pressures.
As shown in Figure 3, the utilization efficiency of CO2 displacement mode samples increases with the differential pressure. All four samples exhibit an increase in utilization efficiency, with a maximum of 24.94%. Specifically, the efficiency increases by 8.55% at 10 MPa, 4.81% at 15 MPa, and 1.73% at 20 MPa. Increasing the differential pressure of the displacement from 5 MPa to 20 MPa results in a significant increase in average utilization efficiency. Notably, the CO2 displacement mode with a 20 MPa differential pressure achieves an impressive average utilization efficiency of 18.87%. Overall, these findings demonstrate the clear benefits of increasing differential pressure in displacement processes.
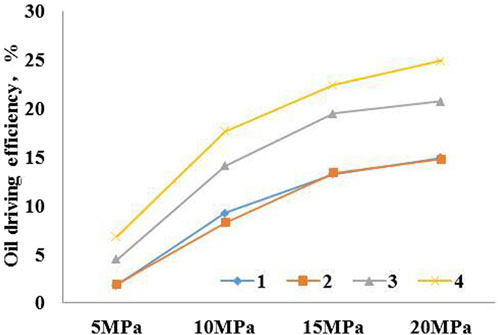
Figure 3. Shows the utilization efficiency of four core samples in CO2 displacement mode at differential pressure of the displacement.
Figure 4 displays the utilization efficiency of CO2 huff and puff mode samples during various rounds. The figure illustrates a gradual increase in utilization efficiency during huff and puff rounds 1–4, with an average increase of 7.3%. Utilization efficiencies for rounds 5 and 6 are slightly higher or lower. It is evident that increasing the number of huff and puff rounds can expand the swept volume and effectively improve the recovery rate. However, after a certain number of rounds, a small amount of oil in the pore is displaced, and the remaining oil becomes difficult to use or may not be used at all. The average utilization efficiency was 21.67% for 4 rounds and 21.84% for 6 rounds.
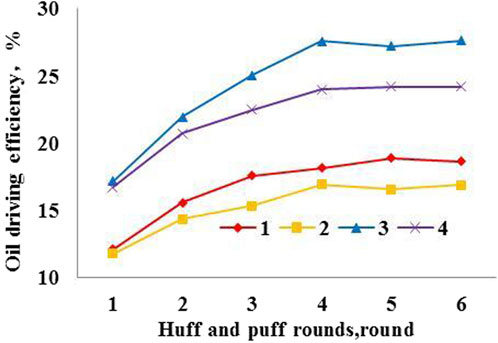
Figure 4. Shows the utilization efficiency of four core samples in CO2 huff and puff mode with different huff and puff rounds.
3.2 Utilization efficiency of utilising pores of different sizes under various development modes
Numerous studies have shown that NMR T2 values correspond well with pore size distribution (Maniesh et al., 2019; Sun et al., 2022; Du et al., 2023). Liu analysed the frequency of pore throat distribution in Gulong shale cores using nuclear magnetic and mercury intrusion methods. They calculated a conversion factor of 0.008 μm/ms between shale nuclear magnetic T2 value and pore throat radius through statistical analysis (Liu et al., 2023). The experimental core pores were classified using the pore classification method of the International Union of Pure (Chemical) and Applied Chemistry (IUPAC). This method defines pore sizes of less than 2 nm as micropore, 2 nm–50 nm as mesoporous, and greater than 50 nm as macropore (Gregg and Sing, 1983; Sing, 1985), with a conversion factor of 0.008 μm/ms. Figure 5 the utilization efficiency of pores of different sizes follows the order of macropore > mesoporous > micropore, from large to small. The higher percentage of free crude oil in the large aperture pore is due to smaller capillary resistance and comparable thickness of the adsorption layer in the large and small aperture pores. The free oil is able to release elastic energy during compression, which facilitates effective discharge.
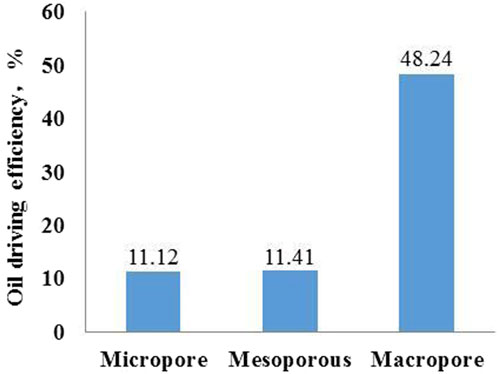
Figure 5. Pore utilization efficiency of different pore sizes in elastic depletion mode.
Figure 6 demonstrates that macropores are the primary contributors to oil drainage during CO2 displacement, followed by micropores and mesoporous, according to the pore classification basis. The oil discharge contribution rate is expected to increase in the order of micropores, mesoporous, and macropores. However, the gas channeling effect prevents oil discharge under air pressure. As a result, the inefficiency of oil discharge increases with pore size, In fact, in some cases, the discharge efficiency of oil from micropores is even higher than that of mesoporous. In the T2 spectrum shown in Figure 1B, the signal of the peak on the right for a 5 MPa displacement pressure difference is higher than that of saturated oil, This confirms the occurrence of gas channeling.
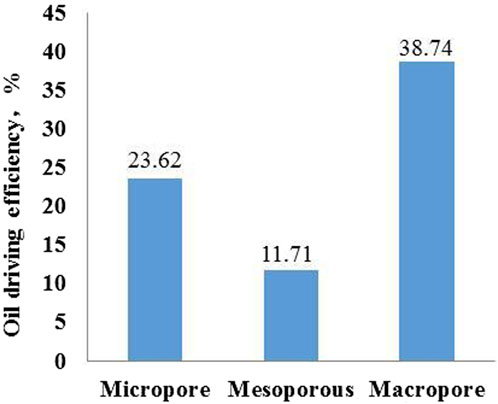
Figure 6. Pore utilization efficiency of different pore sizes in CO2 displacement mode.
Figure 7 in CO2 huff and puff mode, the utilization efficiencies of different pores are in descending order: macropore > mesoporous > micropore. In CO2 huff and puff mode, the driving force of crude oil discharge relies on the elastic force generated by the expansion of compressed fluid in the pore space. The efficiency of oil discharge in different pore space sizes increases significantly by 6.02%, 9.2%, and 8.16%, respectively, compared to that of the elastic depletion mode. This is due to the expansion of crude oil volume and the decrease in fluid viscosity caused by CO2 dissolution.
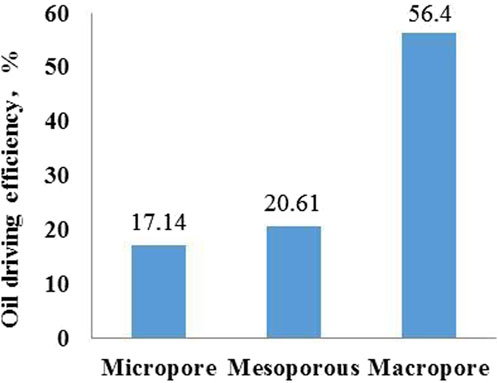
Figure 7. Pore utilization efficiency of different pore sizes in CO2 huff and puff mode.
3.3 Optimisation of parameters for the numerical simulation of CO2 huff and puff
3.3.1 Optimisation of the injection volume
Tang took the Jimusar shale as a research object and used numerical simulation method to optimise the CO2 huff and puff scheme, and the results showed that there is an optimum value which can both improve the oil production and maximise the economic benefits (Tang et al., 2022). Figure 8 clearly demonstrates the relationship between injection volume and cumulative oil production and oil exchange rate for a single well. The data shows that increasing injection volumes from 600 t to 9,600 t results in a corresponding increase in both cumulative oil production and oil exchange rate. The graph of cumulative oil production clearly shows that increasing the injection volume leads to an increase in oil production. This indicates that a higher injection volume results in more gas being dissolved in the crude oil, leading to improved gas swept efficiency and supplementing formation energy. As a result, huff and puff oil production is significantly increased. However, there is a turning point at 2,400 t ∼3,000 t for single injection volume of a single well, and the increase slows down after that. The oil change rate curve shows that the oil change rate decreases as the injection volume increases, and the combined oil production and oil change rate suggests a single injection volume of 3,000 t for a single well in a single round.
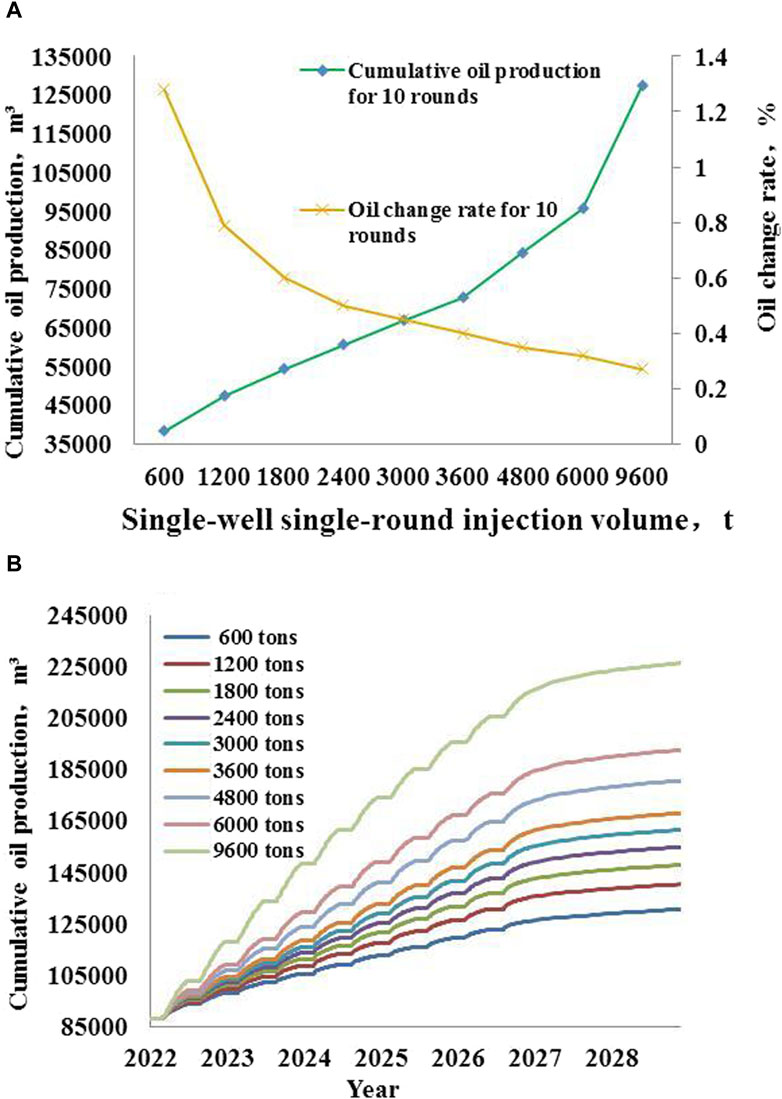
Figure 8. (A) Relationship between different injection volumes and oil production and oil change rate (B) Cumulative oil production curves at different injection volumes.
3.3.2 Optimising the injection speed
Accelerating the injection rate can significantly improve oil production by enhancing injection pressure, shortening injection time, and increasing the efficiency of smaller hole slit waves. It is important to note that a very high injection rate may lead to gas scrambling, which should be avoided. Cao analyzed different injection rates and recovery rates by simulation, and the results showed that as the injection rate increased, the recovery factor showed a tendency to increase and then decrease (Cao et al., 2017). In this paper, seven different injection rates are set to compare and analyse with the corresponding oil production. As seen from Figure 9A, as the injection rate increases, the oil production shows a sharp increase and then a stable increase or slight decrease. The oil yield sharply increases and then stabilises before reaching an injection rate of 100 t/days. However, beyond this point, the oil yield plateaus or slightly decreases. Figure 9B shows that the oil production curve does not exhibit a significant increase beyond an injection rate of 100 t/days. Additionally, it is not expected that the oil production will increase after 2027, and an injection rate of 200 t/days displays a decreasing trend. Compared the cumulative oil production at different stages, it is suggested that the injection rate is 100 t/days, which corresponds to 30 days of gas injection time.
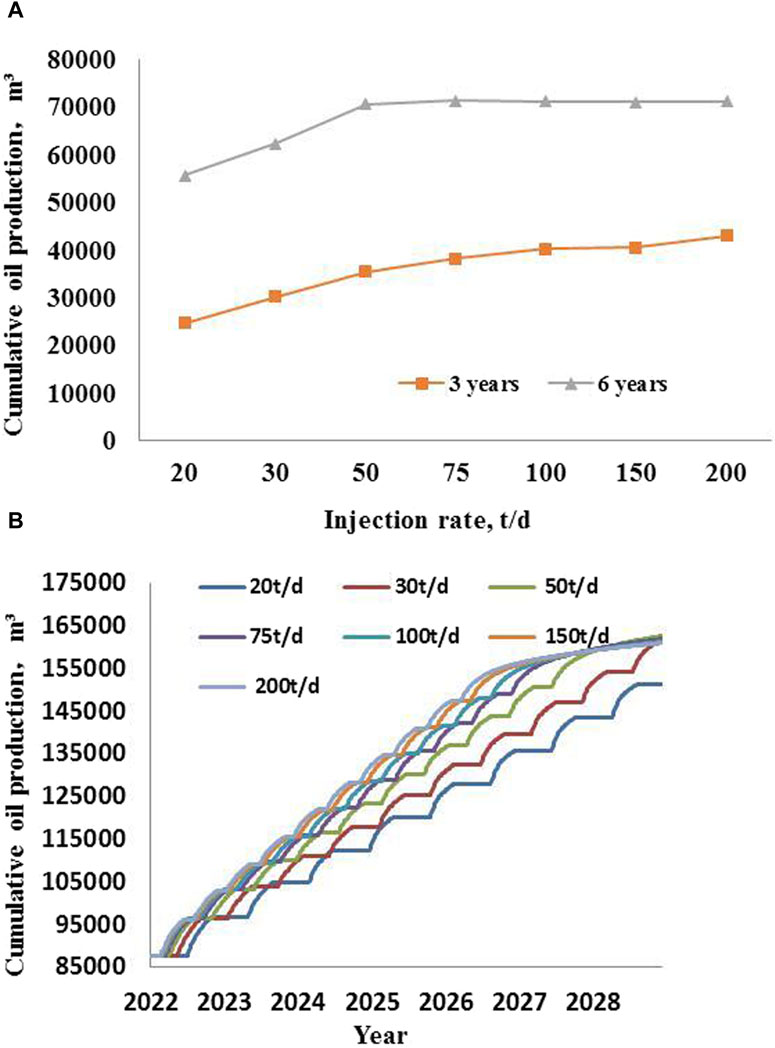
Figure 9. (A) Relationship between different injection rates and oil production (B) Cumulative oil production curves at different injection rates.
3.3.3 Optimising soak time
The soaking time is a crucial aspect of huff and puff production, the purpose of which is to bring the injected gas into full contact with the crude oil on the one hand, and to increase the gas coverage on the other, and the appropriate soaking time can effectively improve oil production. As can be seen in Figure 10A, oil production tends to increase as the soaking time of the well increases, but after a certain node is reached, production no longer increases. Based on the data, it is clear that oil production experiences an increase before 20 days of well soaking time, but reaches a turning point at 20 days. Beyond this point, the increase in cumulative oil production slows or declines (Figure 10B). The production progress and oil production indicators strongly suggest that the optimal well soaking time is 20 days.
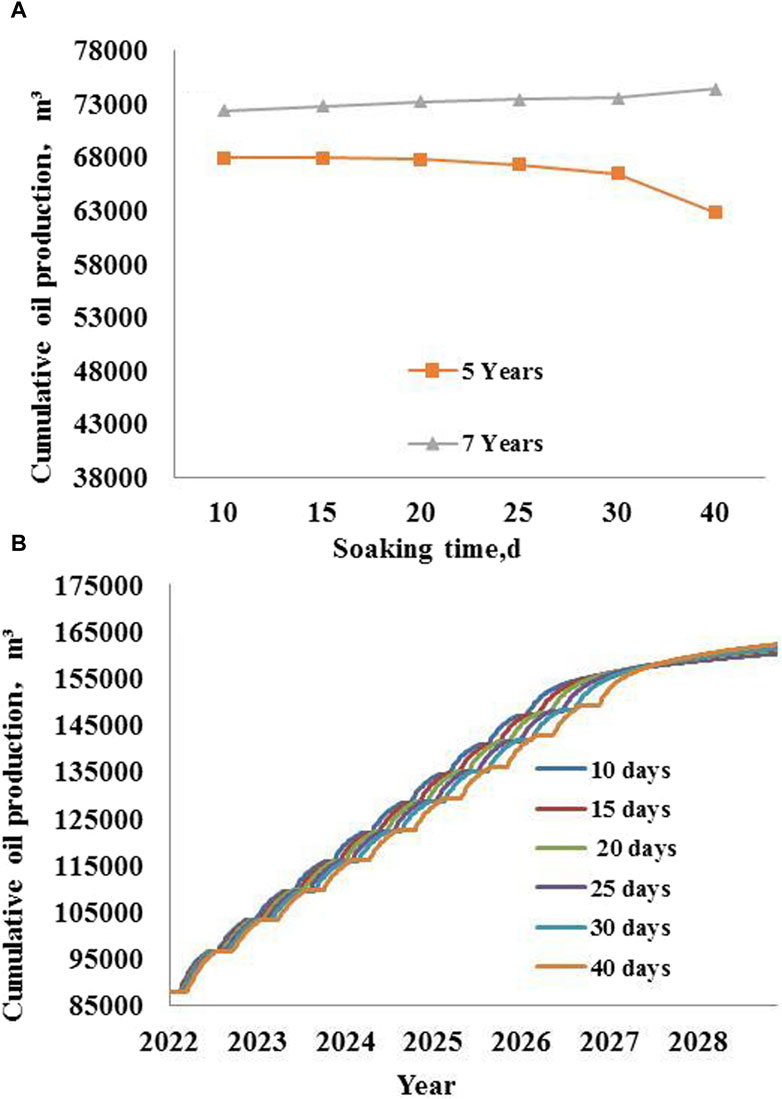
Figure 10. (A) Relationship between different well soaking times and oil production (B) Cumulative oil production curve under different well soaking times.
3.3.4 Predicting the impact of huff and puff on development
The overall injection and extraction parameters were optimised for a single well with a single round injection volume of 3,000 t, an injection rate of 100 t/days and a soaking time of 20 days (Table 4).
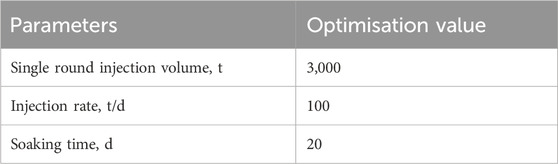
Table 4. Parameter optimisation results.
Optimisation results in a 3% improvement in oil production compared to elastic depletion in the first year, as shown in Figure 11. After 5 years, oil production can be increased by 36,000 m³ compared to depletion with CO2 huff and puff, resulting in an overall improvement of 24%. It is expected that CO2 huff and puff will increase oil production by a total of 65,000 m³. This method can extend the gas reach and effectively supplement formation energy, leading to improved recovery. Additionally, the combination of CO2 flooding and geological storage is expected to be a future development trend, CO2 injection strengthens oil and gas extraction while also promoting carbon capture, utilization, and storage (CCUS).
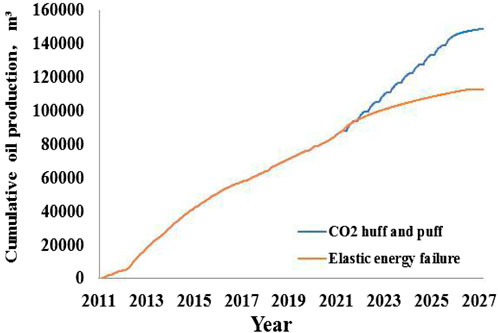
Figure 11. Comparison of oil production between elastic depletion and CO2 huff and puff mode.
4 Conclusion
The study clearly elucidated the exploitation efficiencies of various development modes through indoor experiments and numerical simulations. Additionally, it quantitatively characterized the exploitation efficiencies of pores of different sizes and investigated the impact of key parameters on huff and puff oil production. Based on the findings, the study established optimal injection and extraction parameters and drew definitive conclusions.
(1) The average utilization efficiency of 35 MPa depletion pressure in elastic depletion mode is 17.4%, the average utilization efficiency of 20 MPa differential pressure in CO2 displacement mode is 18.87%, and the average utilization efficiency of 6 rounds in CO2 huff and puff mode is 21.84%, which is comparatively higher among the three modes.
(2) Macropores exhibit the highest oil discharge efficiency in elastic depletion mode, followed by mesoporous and micropores. Similarly, in CO2 displacement mode, macropores have the highest oil discharge efficiency, followed by micropores and mesoporous. It is worth noting that micropores have a greater oil discharge efficiency than mesoporous due to gas channeling. The study confidently recommends adopting CO2 huff and puff mode for reservoirs with more developed mesoporous. This mode increases the utilization efficiency of different pore sizes by 6.02%–9.2% compared to elastic depletion. The contribution of different pore sizes to oil discharge is in the order of macropore > mesoporous > micropore, with the utilization efficiency of mesoporous being 9.2% higher than that of elastic depletion.
(3) Among the injection volume, injection rate and soaking time, the single-well single-round injection volume has the greatest influence on cumulative huff and puff oil production. In this study, the optimum single-well single-round injection volume is 3,000 t, the injection rate is 100 t/days and the soaking time is 20 days.
(4) Compared with depletion development, the total oil production of CO2 huff and puff can be increased by 24%, and it is estimated that the oil can be increased by 65,000 m³, and the huff and puff can effectively improve the recovery rate.
Data availability statement
The raw data supporting the conclusion of this article will be made available by the authors, without undue reservation.
Author contributions
XC: Writing–original draft, Data curation, Methodology. ZC: Writing–review and editing, Data curation. RW: Investigation, Writing–review and editing. YH: Methodology, Data curation, Writing–review and editing. XH: Writing–review and editing, Investigation. ZL: Methodology, Writing–review and editing.
Funding
The author(s) declare that financial support was received for the research, authorship, and/or publication of this article. This work was supported by the National Natural Science Foundation of China (No. U22B2075).
Conflict of interest
Author XC, ZC, XH, and ZL were employed by PetroChina. Author RW was employed by PetroChina Daqing Oilfield Co., Ltd.
The remaining author declares that the research was conducted in the absence of any commercial or financial relationships that could be construed as a potential conflict of interest.
Publisher’s note
All claims expressed in this article are solely those of the authors and do not necessarily represent those of their affiliated organizations, or those of the publisher, the editors and the reviewers. Any product that may be evaluated in this article, or claim that may be made by its manufacturer, is not guaranteed or endorsed by the publisher.
References
Ao, W. J., Kong, L. P., Wang, C. S., Chen, S. J., Tian, J. J., and Kan, L. (2016). Study on enhanced oil recovery in high water-cut reservoir by gas flooding (in Chinese). Complex Hydrocarb. Reserv. 9 (4), 52–57. doi:10.16181/j.cnki.fzyqc.2016.04.012
Cao, M. J., Wu, X. D., An, Y. S., Zuo, Y., and Wang, R. H. (2017). “Numerical simulation and performance evaluation of CO2 Huff-n-Puff processes in unconventional oil reservoirs,” in Proceedings of the USA carbon management technology conference, Houston, TX, USA.
Du, H. F., Hou, R. Q., Sun, X., Dong, Y. H., and Wang, C. W. (2023). Study on pore characteristics of shale based on NMR (in Chinese). Unconv. Oil gas 10 (5), 38–47. doi:10.19901/j.fcgyq.2023.05.06
Fu, J., Chen, H. Q., Yao, C. Q., Sakaida, S., Kerr, E., Johnson, A., et al. (2023). “Field application of a novel multi-resolution Multi-Well unconventional reservoir simulation: history matching and parameter identificationn,” in USA unconventional resources technology conference (Denver, CO: SPE/AAPG/SEG).
Gregg, S. J., Sing, K. S., and Salzberg, H. W. (1983). Adsorption, surface area, and porosity. J. Electrochem. Soc. 114, 279C. doi:10.1149/1.2426447
He, W. Y., Liu, B., Zhang, J. Y., Bai, L. H., Tian, S. S., and Chi, Y. A. (2023). Geological characteristics and key scientific and technological problems of Gulong shale oil in Songliao Basin (in Chinese). Earth Sci. 48 (1), 49–62. doi:10.3799/dqkx.2022.320
Kong, F. S., Li, Y. J., Guo, T. J., Liu, J. D., and Nan, J. H. (2023). Applicability of CO2 gravity drainage technology for high⁃dip fault block reservoirs in Hailar Oilfield (in Chinese). Petroleum Geol. Oilfield Dev. Daqing. 42 (6), 75–81. doi:10.19597/J.ISSN.1000-3754.202302026
Liu, Y. S., Chen, Z. W., Ji, D. Q., Peng, Y. F., Hou, Y. N., and Lei, Z. D. (2023). Pore fluid movability in fractured shale oil reservoir based on Nuclear Magnetic Resonance. Processes. 11 (12), 3365. doi:10.3390/pr11123365
Maniesh, S., Swapan, K. D., Umer, F., and Ei, S. R. (2019). “A case study on reducing uncertainty by using correct procedure & desaturated reservoir fluid on NMR Core T2 bound fluid Cut-Off analysis for gaint Abu Dhabi onshore carbonate to compute reliable field wide swirr analysis from NMR Logs,” in Proceedings of the Abu Dhabi International Petroleum Exhibition and Conference (Abu Dhabi, United Arab Emirates: SPE), Abu Dhabi, UAE.
Sing, K. S. (1985). Reporting physisorption data for gas/solid systems with special reference to the determination of surface area and porosity (Recommendations 1984). Pure Appl. Chem. 57 (4), 603–619. doi:10.1351/pac198557040603
Sun, Z. L., Li, Z. M., Shen, B. J., Zhu, Q. M., and Li, C. X. (2022). NMR technology in reservoir evaluation for shale oil and gas. Petroleum Geol. Exp. 44 (5), 930–940. doi:10.11781/sysydz202205930
Tang, W. Y., Huang, Z. Y., Chen, C., Ding, Z. H., Sheng, J. P., Wang, X. K., et al. (2022). Optimization of CO2 huff and puff scheme for Jimsar shale oil and evaluation of test effect. Spec. Oil Gas. Reserv. 29, 131–137. doi:10.3969/j.issn.1006-6535.2022.03.019
Tao, W., James, J., and Sheng, M. Y. (2013). “Evaluation of the EOR potential in shale oil reservoirs by cyclic gas injection,” in New orleans 54th annual logging symposium (Louisiana, New Orleans: One petro).
Wang, F. L., Fu, Z. G., Wang, J. K., Tang, Z. G., and Jiang, R. G. (2021). Characteristics and classification evaluation of Gulong shale oil reservoir in Songliao Basin (in Chinese). Petroleum Geol. Oilfield Dev. Daqing. 40 (5), 144–156. doi:10.19597/J.ISSN.1000-3754.202107017
Yao, L. L., Yang, Z. M., Li, H. B., Zhou, T. Y., Zhang, Y. P., Du, M., et al. (2023). CO2 displacement characteristics of interbedded shale reservoir: a case study of Chang 7 shale in Ordos Basin (in Chinese). Petroleum Geol. Oilf. Dev. Daqing, 1–7. doi:10.19597/J.ISSN.1000-3754.202302017
Zhao, Y. P., Zhao, X. S., Yao, Z. J., and Zhao, Y. (2018). Indoor experiment and field application of CO2 flooding in ultra-low permeability oil reservoirs (in Chinese). Petroleum Geol. Oilfield Dev. Daqing. 37 (1), 128–133. doi:10.19597/J.ISSN.1000-3754.201706040
Keywords: terrestrial shale oil, gas injection, nuclear magnetic resonance (NMR), enhanced oil recovery, numerical simulation
Citation: Cui X, Chen Z, Wang R, Han Y, He X and Lei Z (2024) Optimal design of gas injection development method for enhanced recovery in terrestrial shale oil reservoir. Front. Energy Res. 12:1397417. doi: 10.3389/fenrg.2024.1397417
Received: 07 March 2024; Accepted: 25 March 2024;
Published: 11 April 2024.
Edited by:
Yan Peng, China University of Petroleum, Beijing, ChinaCopyright © 2024 Cui, Chen, Wang, Han, He and Lei. This is an open-access article distributed under the terms of the Creative Commons Attribution License (CC BY). The use, distribution or reproduction in other forums is permitted, provided the original author(s) and the copyright owner(s) are credited and that the original publication in this journal is cited, in accordance with accepted academic practice. No use, distribution or reproduction is permitted which does not comply with these terms.
*Correspondence: Zhengdong Lei, bGVpemhlbmdkb25nQHBldHJvY2hpbmEuY29tLmNu