Abstract
To fully explore the potential low-carbon and economic advantages of a virtual power plant (VPP) that aggregates multiple distributed resources, the paper proposes a VPP scheduling model that considers the carbon emission flow (CEF) and demand response (DR), which is characterized by electro-carbon coupling and source-load interaction. First, the electric-carbon characteristics of each distributed resource under VPP are modeled, and the source-load electric-carbon coupling characteristic model is modeled through the CEF theory. On this basis, a load-side multi-type DR model is established to achieve the purpose of source-load synergy to reduce carbon emissions from VPP. To this end, a two-stage scheduling model of VPP considering the source-load electro-carbon coupling relationship is established, and the implementation of the model can reduce power generation costs, carbon emissions and promote clean energy, and the simulation results of the improved IEEE-14 node system verify the effectiveness of the proposed model.
1 Introduction
In the face of growing global awareness surrounding environmental preservation, the shift towards a low-carbon economy and sustainable development has emerged as a predominant global trend. Within the energy sector, conventional fossil energy sources like coal-fired and fuel oil have evolved into significant contributors to environmental pollution (Li et al., 2020). Therefore, in the context of low-carbon power, the increasing development of distributed resources has become an unavoidable trend, and the scale of development is expanding and the level of utilization is increasing (Li et al., 2019; Li et al., 2021). How to ensure the safe and stable operation of the power grid while realizing the access and optimal operation of distributed resources is a problem that needs to be solved at present (Huang et al., 2022). The virtual power plant (VPP) is a new type of energy supply model that can effectively aggregate multiple distributed resources with the advantages of low carbon, high efficiency and flexibility. Therefore, virtual power plants have received extensive attention in both theoretical and practical research areas in recent years.
The VPP achieves the synergy and complementarity of diverse energy types through the integration of multiple energy sources. This not only caters to the energy demands of various load types but also significantly diminishes the carbon footprint of the system. The scheduling problem of the VPP is one of the keys and bases to realizing its efficient operation and optimal control, and its main purpose is to formulate a reasonable scheduling strategy to improve its operation efficiency and economic benefits (Liu et al., 2023). Extensive research efforts have been dedicated to this issue. For example, in (Naughton et al., 2021; Nguyen and Nguyen, 2021; Wang and Wu, 2021), a VPP scheduling model considering distributed resources aggregation such as distributed wind power (WT), photovoltaic (PV) and energy storage constructed, (Cao et al., 2016), established a VPP economic scheduling model, with the objective function being to minimize the cost of power generation. (Wang and Teng, 2023) established a VPP economic scheduling model incorporating the carbon trading mechanism. Based on this, (Sun et al., 2023; Tang et al., 2023) proposed a demand response (DR) taking into account the carbon trading mechanism and the low-carbon economic scheduling method for VPP, which improves the capacity of renewable energy consumption. It is worth noting that these references seldom analyze the electro-carbon coupling relationship of distributed resources, and there is a single means of carbon reduction and a lack of effective interaction between low-carbon means on both the source and load sides. As an effective analytical tool for the development of low-carbon electricity, the carbon flow emission (CEF) theory has been further developed and improved. (Zhou et al., 2012; Kang et al., 2015) elaborated on the concept of CEF theory, improving its theoretical framework and proposing corresponding calculation methods. (Cheng et al., 2019; Cheng et al., 2019; Cheng et al., 2020) applied the CEF theory to the integrated energy system, which significantly reduces the carbon emission of the system, and offers a fresh perspective and guiding principle for the virtual power plant to realize the low-carbon scheduling.
To further improve the low-carbon properties of VPPs, enhance the usage of clean energy sources and decrease energy expenses, research on load-side DR under VPPs has attracted increasing interest. For example, in (Li et al., 2022), flexible resources were designated as controllable units extensively situated on the distribution grid side. These units can be agilely controlled and regulated, facilitating a bidirectional and synergistic interaction between the main grid and the distribution grid. (Liu et al., 2022) conducted further research on electricity trading methods for electric vehicles. (Zahra et al., 2021) proposed an optimal VPP scheduling method taking DR into account, which coordinates the utilization of VPP storage and DR resources through a time-sharing tariff strategy to improve energy consumption while achieving peak-to-valley regulation. (Li et al., 2022) introduced a demand-side satisfaction coefficient, which significantly improves the motivation of users to participate in DR. (Li et al., 2020; Zhang et al., 2022) further classified loads into transferable loads and curtailable loads, and established a scheduling model for multiple types of loads to participate in DR. The above research works have achieved significant results in improving the motivation of users to participate in DR. However, the time period division of traditional time-sharing tariffs is relatively rigid and lacks sufficient flexibility, which has limited incentives for users. There are few tariff models that take into account the differences in carbon emissions of electricity consumption at different nodes, and few studies that classify loads according to their characteristics and develop DR models accordingly.
Addressing the issues above, this study centers on the electric-carbon coupling problem under VPP scheduling, proposes a source-load electric-carbon coupling relationship model founded on the principles of CEF theory, and subsequently establishes a two-stage VPP scheduling model incorporating participation in the carbon trading market and DR. Its main contributions and salient features are summarized below.
1) To comprehensively analyze the effect of electricity demand on carbon emissions, the CEF theory is utilized to track the carbon emissions from power generation measurement up to power consumption measurement. Additionally, investigate the potential low-carbon capacity of the load side to gain a better understanding of its contribution towards carbon reduction efforts.
2) To effectively integrate low-carbon means into both the supply and demand sides, and to promote the deep interaction and synergy between supply and demand, a multi-type load DR model that considers the relationship between load electricity consumption and carbon emissions is established.
3) A two-stage optimized scheduling model for VPP is established, based on a designed low-carbon dispatch strategy. The model takes into account both economic and low-carbon factors in making system operation decisions. The optimal scheduling results were obtained by iteratively optimizing the upper economic model and the lower low-carbon model.
The remaining portion of this paper is structured in the following manner. Section 2 introduces the structure of VPP and the CEF theory. In Section 3, the electric-carbon relation of distributed resources is modeled, and in Section 4, a multi-type DR model is based on the relationship between load electricity use and carbon emissions and develops a two-stage scheduling model for VPP. Section 5 presents a case study that illustrates the proposed model’s effectiveness, while Section VI provides a concluding summary of the entire paper.
2 VPP basic structure and CEF theory
2.1 VPP physical structure
The structure of the VPP is illustrated in Figure 1 and it consolidates four resource types, controllable distributed power supply, new energy, energy storage, and load. Each resource type functions as a subsystem, allowing for optimal resource allocation across a broad spectrum through information transmission and energy interaction. This facilitates the reduction of carbon emissions, enhancing the system’s new energy consumption capacity and increasing overall revenue (Kang et al., 2022).
FIGURE 1

Physical structure diagram of VPP.
2.2 Definition and calculation of CEF
Due to the consumption characteristics of power resources, the carbon emissions generated by the power system are commonly referred to as off-site carbon emissions. Specifically, the loads themselves do not produce carbon emissions, electricity production is often accompanied by the release of carbon dioxide resulting from the utilization of non-renewable energy sources. To better track the carbon footprint of the load side and analyze the carbon characteristics of electricity from this perspective, it is necessary to introduce the concept of CEF. This allows for tracing the transfer of carbon emissions from power generation to the load side, providing a more accurate understanding of carbon emissions. As depicted in Figure 2, this model can calculate carbon flow indicators, such as emission flow rate and flow density, for each node and time period based on the existing distribution.
FIGURE 2
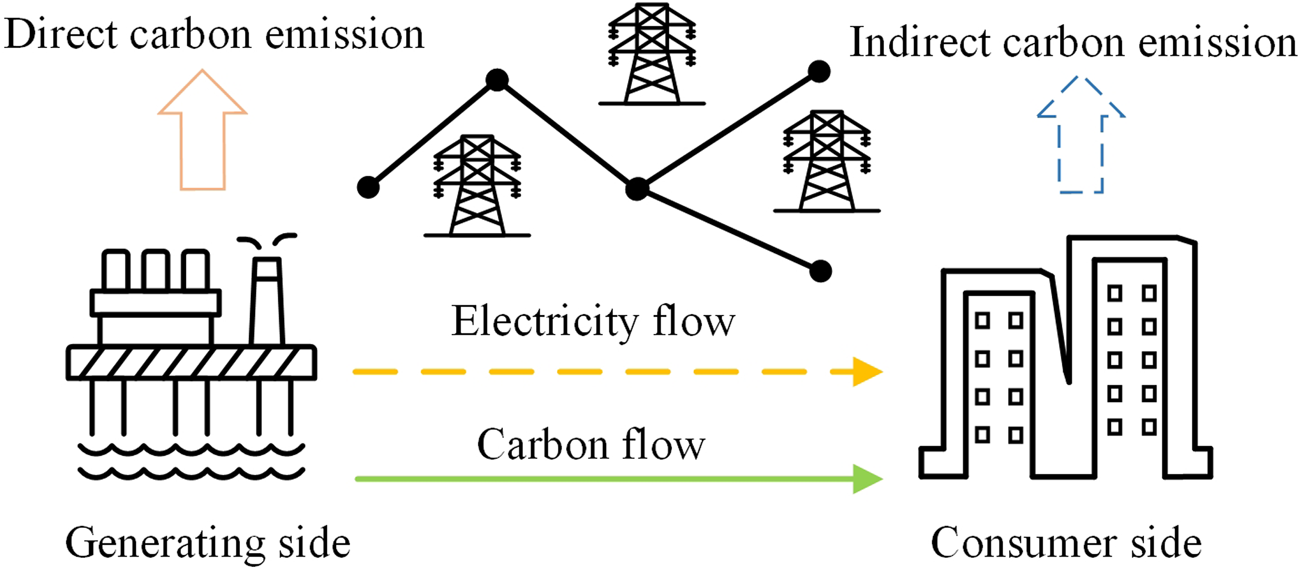
Schematic diagram of power system currents and CEF.
2.2.1 Carbon emission flow rate
Define the carbon emission resulting from the flow of energy through the network’s nodes or branches per unit of time as the carbon flow emission rate in , and the computational expression is Eq. (1).
Where is the carbon flow emission rate of the network node or branch and is the time.
2.2.2 Carbon density
Branch carbon density refers to the amount of carbon emissions produced by a single unit of electricity transmitted through a branch of a power system, i.e., it is the ratio of branch carbon flow emission rate to the active tidal current streaming through that branch and is denoted by .
Where donates the active current of the associated network.
2.2.3 Nodal carbon intensity
The nodal carbon flow density encompasses both the carbon flow density at generator nodes and the carbon flow density at load nodes. The generator node carbon flow density, referred to as carbon intensity, is denoted by . Meanwhile, the load node carbon flow density, known as load node carbon intensity, describes the carbon emission associated with the load’s consumption unit of electrical energy and is represented by . Therefore, the carbon intensity at the node can be utilized for analyzing the relationship between electricity consumption and carbon emissions of the load side.
3 Modeling the electro-carbon characteristics of distributed resources
The “electric-carbon characteristic” is defined as the correlation between the net external power output and the net carbon emissions of a distributed generating unit. Presently, the prevailing approach in studies involves utilizing carbon intensity to articulate the electric-carbon characteristic of a unit. Carbon intensity quantifies the emissions produced per unit of electricity supplied to the grid by a unit.
3.1 Unit electro-carbon characterization model
The fuel carbon emissions of fossil fuel producing units are the main source of carbon emissions from the VPP’s power generation source. Carbon emissions from the operation and production processes of clean energy generating units, such WT and PV, are estimated to be zero. As such, in research investigations, their carbon intensity is usually set to 0.
Where is the carbon intensity of WT and PV.
The electrical carbon characteristics of a fuel unit are influenced by several factors, and its carbon intensity can usually be obtained from Eq. (4). Eq. (5).
Where and , , are the fuel consumption per unit of electrical energy and the characteristic parameters of the unit , respectively, is the carbon intensity of the fuel unit, is the correction factor, , are the molar mass of carbon dioxide and carbon, and are the carbon content of the unit’s fuel and carbon oxidation rate, respectively.
The above model applies to coal-fired, gas-fired, and other fuel-fired units, and the size of the parameters varies among different types of units.
3.2 Energy storage electro-carbon characterization model
The energy storage device operates in two concurrent states: charging and discharging. When in the charging state, it functions like a special load that can absorb a portion of carbon emissions. On the other hand, when in the discharging state, it operates like special power generation equipment, resulting in the release of some carbon emissions. In conclusion, based on the CEF model, the electric-carbon characteristic model can be outlined as follows.
When the energy storage device is being charged, carbon emissions accompany the electrical energy charged into the energy storage device, at this time the energy storage charging carbon intensity is equivalent to the carbon intensity of the node where the element is located.
When the energy storage device is in a discharged state, carbon emissions are released from the energy storage device along with electricity.
Where , represents the amounts of carbon emission changes during the period of charging and discharging the energy storage device, , represents the power associated with the charging and discharging, and is the discharging efficiency.
The carbon intensity of discharge emissions from energy storage devices is expressed as:
Where is the values of the capacity of the energy storage equipment at moment t.
3.3 Load electro-carbon characterization model
Carbon emissions from electricity consumption by power users are closely related to the quality and amount of the electricity they consume, where “quality” refers to the carbon content of the source of electricity, and “amount” as the name implies, pertains to the amount of electricity.
Reference (Da, 2016; Yang et al., 2023) demonstrates that the load node carbon intensity size is equivalent to the sum of all tributary carbon flow densities streaming into the node and the carbon intensity of the generators connected to the node concerning the tidal current weighted average. therefore, the load node CEF model is in Eq. (9).where represent the carbon intensity of load node j, , are the power and carbon flow density of the branches connected to node i and node j, respectively, and are the generating power and carbon intensity of the generators connected to the node j, respectively, and is the number of network nodes.
The definition of load carbon intensity is the same as that of generating unit carbon intensity. Consequently, nodal carbon intensity can be used to express the electrical carbon properties of the load. As the load uses power per unit of time, the higher the carbon intensity of a load node, the more output the high carbon intensity unit produces relative to the load, increasing the value of carbon emissions. Users can independently participate in low-carbon DR by evaluating the variations in nodal carbon intensity throughout the day, as long as they stay within the parameters of load control capacity. They can then choose to individually increase or decrease loads and actively participate in low-carbon emission reduction activities, modifying their power consumption behaviors accordingly.
4 Low-carbon scheduling strategy considering source-load electro-carbon characteristics
4.1 Carbon market trading model
The carbon trading market system is currently the mainstream market mechanism to limit carbon emissions from the system at source by trading the carbon emission rights formulated. In the carbon trading market, it is necessary to determine the carbon trading volume of the VPP participating in the market based on the initial carbon emission amount, combined with the actual carbon emissions of the VPP (Lei et al., 2020). Among them, there are various ways to determine the initial carbon emission amount, such as the annual power generation method, baseline historical emissions and power generation intensity. For the output of the VPP units, the intensity of power generation is utilized to define the initial carbon quota of the VPP as in Eq. (10).
Where is the given unit carbon allowance, is the carbon emission rights allocation factor.
4.2 DR modeling based on load electro-carbon characteristics
As the carbon intensity of each load node increases, the value of carbon emissions associated with its unit of power consumption also increases. Leveraging this insight can optimize load scheduling to increase electricity consumption during low carbon intensity periods and decrease consumption during high carbon intensity periods. This strategic load scheduling can diminish the carbon emission value per unit of electricity over a cycle, resulting in energy savings and emission reduction.
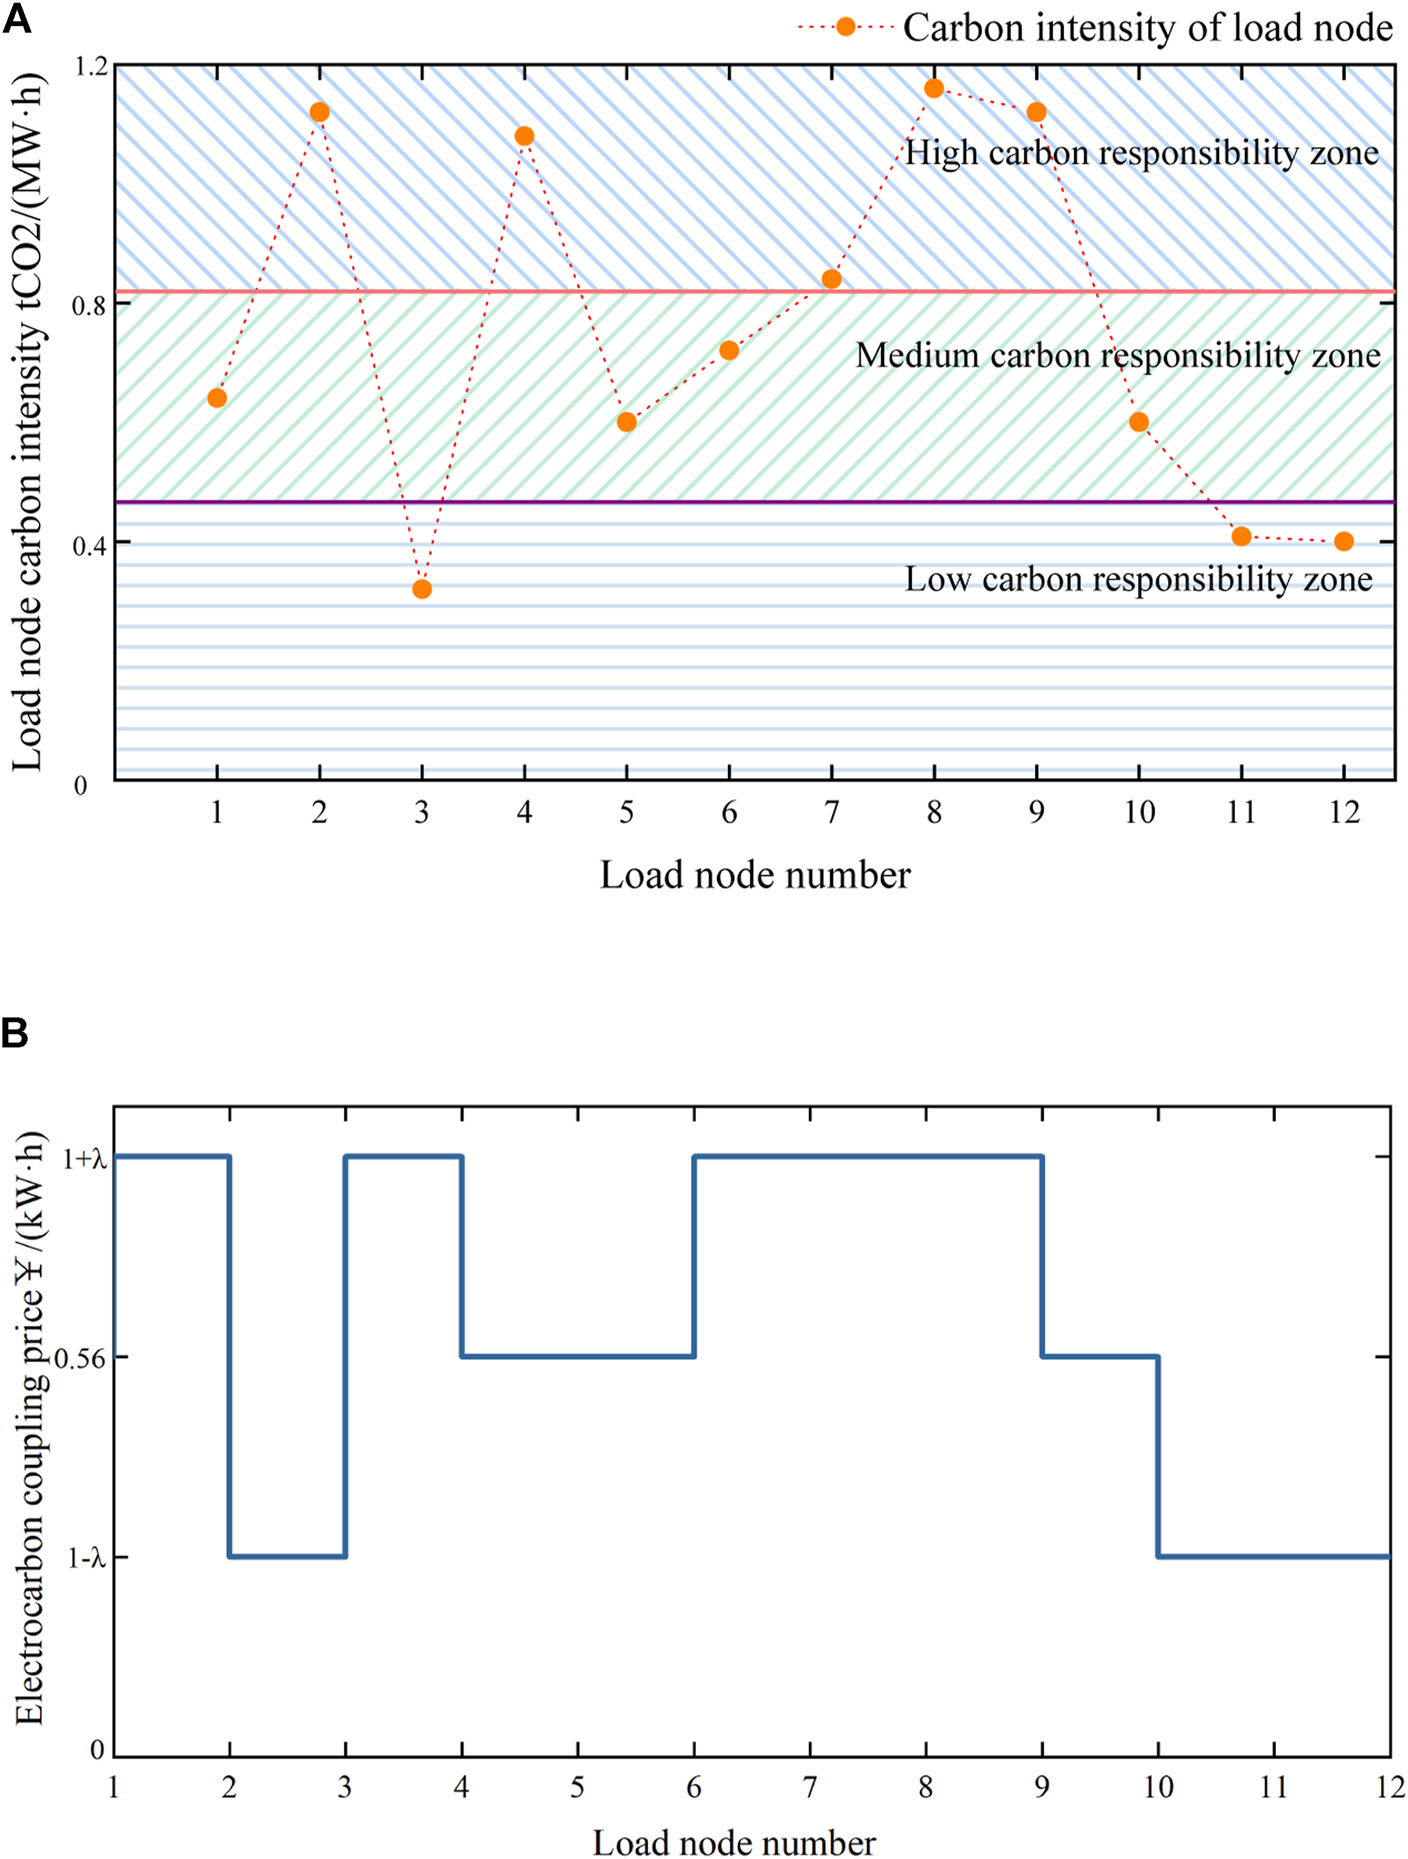
According to the principle of consumer psychology, price-based DR guides users to carry out reasonable electricity consumption behavior through the change of electricity price (Liu et al., 2023), and China has achieved remarkable results in guiding users to peak shaving and valley filling through the establishment of DR model of peak-valley leveling time-sharing electricity price. However, the traditional electricity pricing strategy is usually based on electricity supply and demand and cost considerations, and its pricing mechanism is relatively fixed, often without sufficient consideration of carbon emissions in the process of electricity production and use. Such strategies are usually simple and straightforward to implement, but may lack incentives for energy efficiency and environmental protection. In this paper, with reference to the time-sharing electricity pricing model, we analyze it from a low-carbon perspective, divide the low, medium and high carbon responsibility zones according to the carbon intensity, and establish the time-sharing electricity-carbon coupling price model for different carbon responsibility zones. The steps of the electricity-carbon coupling price model are shown in Figures 3A,B.
FIGURE 3
Schematic diagram of the steps in the coupled electro-carbon price modeling.
The specific steps are as follows:
1) As shown in Figure 3A, following the load node carbon intensity solution formula in Eq (9), the magnitude of carbon intensity at each load node at the current t time is calculated, and the low, medium and high carbon responsibility intervals are divided. The specific division method is shown in Eq. (11).
where
and
are the minimum and maximum load node carbon intensity at time
t,
is the average of all load node carbon intensity at time
t, and
is the carbon intensity of load node
j.
2) As shown in Figure 3B, the low, medium and high time-sharing carbon prices are set with reference to the peak, valley and level time-sharing prices, and the specific carbon price is shown in Eq. (12).
where
is the carbon price difference between loads in the high and low responsibility zones,
is the carbon value of load
j.
where
is the basic price.
4.3 Multi-type load DR modeling
Within a defined time frame, industrial and residential load users have the flexibility to shift a portion of their load without disrupting overall production plans and daily life demands. The primary aim is to execute load shedding during specific scheduling periods to mitigate demand peaks. To realize this goal, this paper introduces two forms of load-side DR through the electro-carbon coupling price acting as the pricing signal. This is achieved through the development of segmented prices, facilitating load transfer. Subsequent to implementation, the load of industrial and residential users for each time period can be represented using Eq. (14).
Where is the load value of the node before the response at the moment t, is the load value of the node after the response at the moment t, is the response value of the load.
During demand response implementation, the two load types previously mentioned need to adhere to the following restrictions: 1) the user’s total electricity consumption stays constant during the entire scheduling cycle; 2) the user’s load adjustment during each scheduling time period must fall within a predefined permissible range. The permitted range for demand response, given the context of this study, is [-12.5%, +7.5%] of the predicted load for the relevant time period.
Commercial loads including large shopping malls, schools and hospitals, are deemed rigid in this paper due to inherent industry limitations. These loads possess limited capacity for load transfer and face challenges in utilizing time-sharing prices for load shifting. In operational scenarios, users of such loads can receive instructions for load reduction, empowering them to voluntarily cut a portion of their load. In exchange for their responsive actions, users receive compensation. The load reduction model is depicted in Eqs. 16, 17.
Where is the commercial load reduction at the time t, is the maximum value of reduction at the time t, and is the time period that can be reduced, and during the time span that allows for reduction, the maximum value of reduction at time t is set to be no more than 10% of the load in that time period.
4.4 Two-stage VPP low-carbon economic scheduling model
4.4.1 First stage scheduling model
The primary objective of the first stage economic scheduling model is to reduce the generation cost of the VPP to its minimum. This objective function includes the power generation costs of thermal, WT and PV, along with the start-up (shut-down) cost of thermal units and the associated carbon trading costs. The detailed expression is depicted in Eq. (18).
Where denotes the fuel cost of thermal power units, is the generation cost of WT, is the generation cost of PV, is the start-up (shut-down) cost of thermal power units, refers to the operation and maintenance cost of energy storage equipment, and is the cost of carbon trading.
Where , , signifies the cost coefficients of coal consumption for the unit, , are the cost coefficients of WT and PV, , , are the output power of thermal power, WT and PV in the time period t. is the start-up (shut-down) variable of the thermal power unit h in the time period t, which takes the values of 0 and 1, is the start-up (shut-down) cost of the unit h, , , are the numbers of various types of units, is the cost coefficient of operation and maintenance of the storage equipment, is the power of the storage energy in time period t, and is the price of the carbon trade, is the carbon emission.
The constraints are as follows:
1) Thermal unit capacity and ramping constraints.
Where
,
are the maximum and minimum values of active output from thermal power units,
and
represent the maximum and minimum values of climbing power.
2) WT and PV capacity constraints.
Where
,
and
,
represent the maximum and minimum values of the active output of WT and PV, respectively.
3) Energy storage capacity and charge/discharge state constraints.
Where
and
are the maximum and minimum values of the capacity of the energy storage equipment, suggest that the energy storage is undergoing a charging process, and similarly
suggest that the energy storage is undergoing a discharging process.
4) Power balance constraints.
Where denotes the load power.
4.4.2 Second stage scheduling model
This paper employs the first stage model to derive the start-up (shut-down) plan and unit output for generating units within the carbon trading market. The resulting data, encompassing both start-up (shut-down) plans and unit outputs, are subsequently transmitted to the second stage model. In the second stage, the load-side electricity and carbon coupling price function as the pricing signal, accounting for multiple load types in DR. The load amounts for responsive nodes are fed into the first stage scheduling model, and these steps are iteratively executed until the discrepancy in load-side DR changes falls below the critical value. The second stage low-carbon scheduling model is designed to minimize the combined cost of customer power purchases and DR, as depicted in Eq. (25).
Where is the industrial and residential load node price DR cost, is the commercial load node load curtailment compensation cost, and is the customer’s power purchase cost.
Where is the number of load nodes, , and are industrial loads, commercial loads, residential loads node-set, is the industrial and residential loads DR cost price per unit of load volume, is the commercial and residential loads to cut down the cost of compensation per unit of load volume, and is the power consumption of j node at t moment.
4.4.3 Flowchart for solving the two-stage scheduling model
Figure 4 displays the flowchart outlining the two-stage VPP low-carbon economic scheduling model.
FIGURE 4
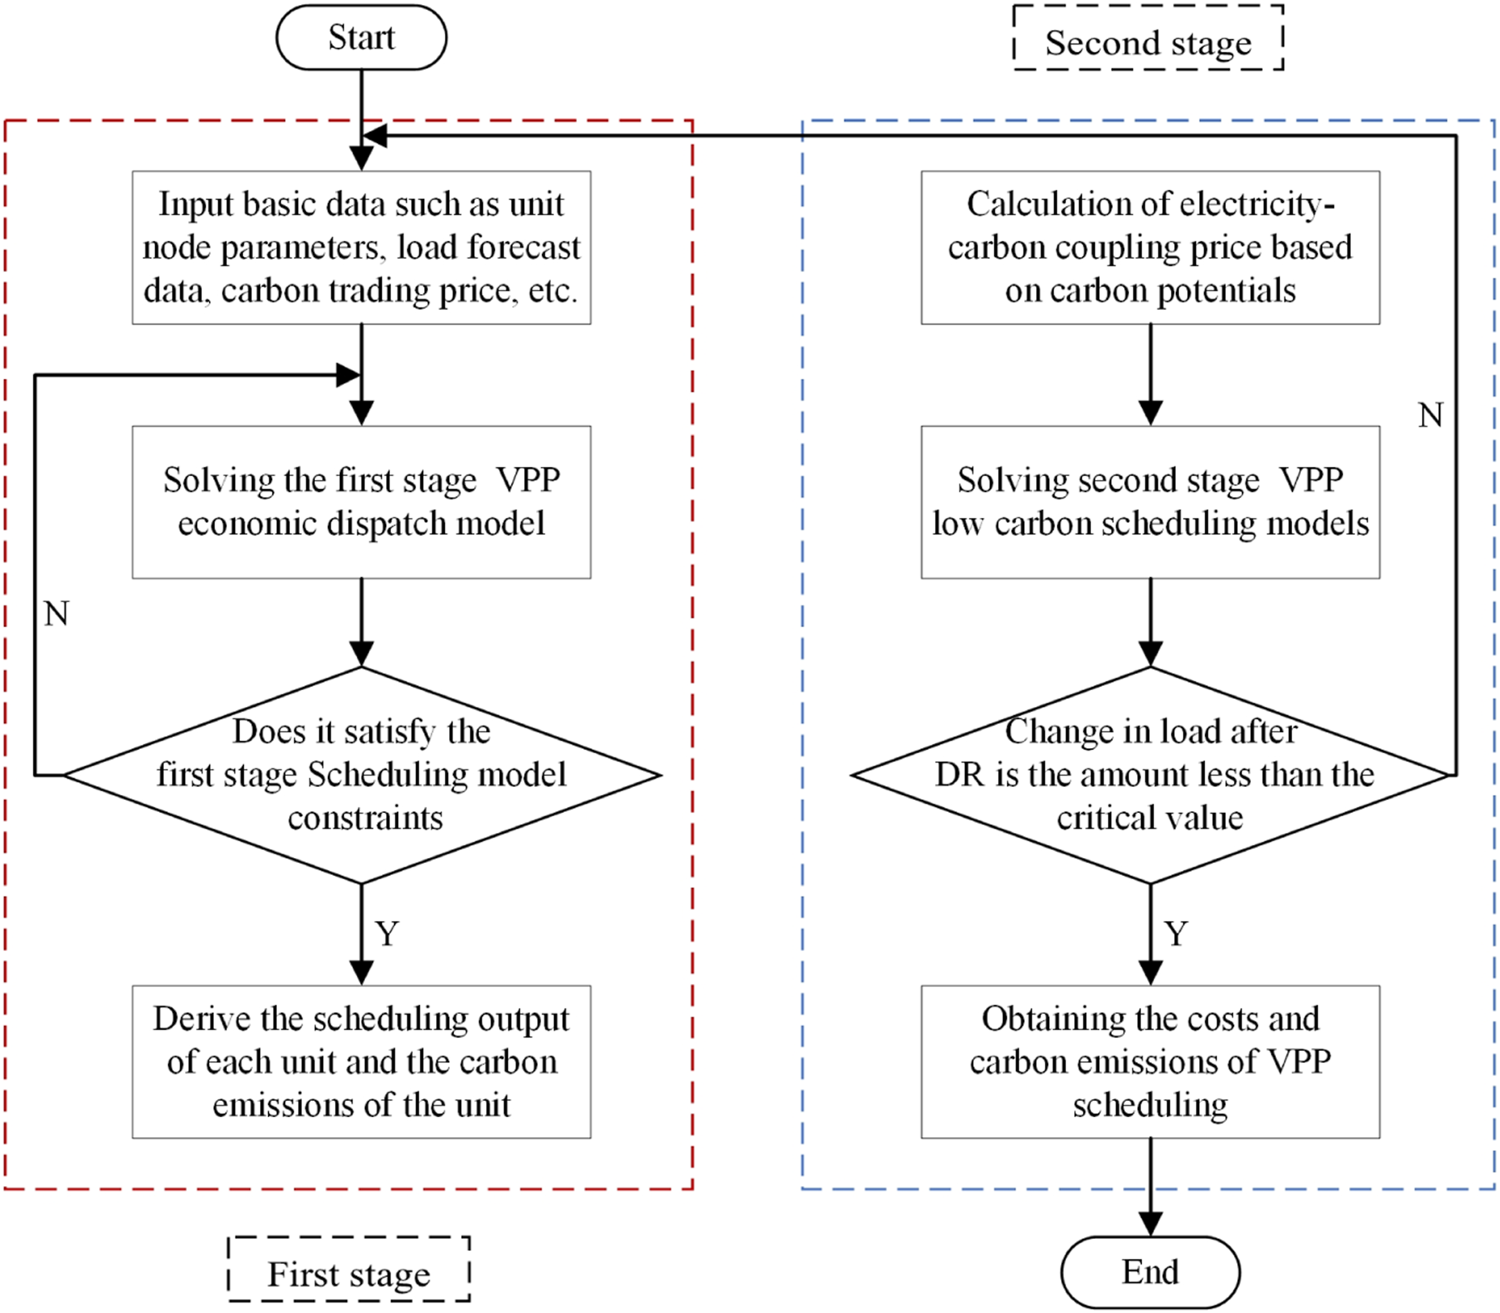
VPP two-stage optimized scheduling flowchart.
The model workstream is as follows:
1) Commence the process by inputting unit node parameters, load forecast data, carbon quota parameters and other essential example-based data.
2) Solve the first stage VPP economic scheduling model to obtain the output, carbon emissions, active power data transmitted by each line during the unit scheduling cycle. Simultaneously, calculate the carbon intensity of each node by utilizing the CEF method.
3) Develop electric-carbon coupling prices grounded in the carbon intensity for each node.
4) Enter the second stage virtual power plant low carbon scheduling model to solve for the optimized loadings.
5) The optimized load quantity is resubstituted into the upper model to re-do the day-ahead scheduling. The above process is repeated until the difference in the load-side demand response change between the two processes is less than the critical value, then the optimal scheduling scheme and results are outputted.
In this particular instance, the dichotomy is employed as a means of imposing constraints that effectively prevent the emergence of oscillatory non-convergence. Dichotomous iteration addresses oscillation issues by adopting a heuristic strategy known as equipartitioning. Its core principle lies in establishing a practical load-interval that consistently encompasses the optimal operational state. Subsequently, through iterative adjustments to either the lower or upper bounds, this interval range is progressively narrowed, until it converges to or falls below the predefined convergence threshold. This methodical narrowing process ensures that the system stabilizes and converges to an optimal solution. To further clarify the process, Figure 5 provides a schematic diagram that illustrates the steps involved in the dichotomous iteration process.
FIGURE 5
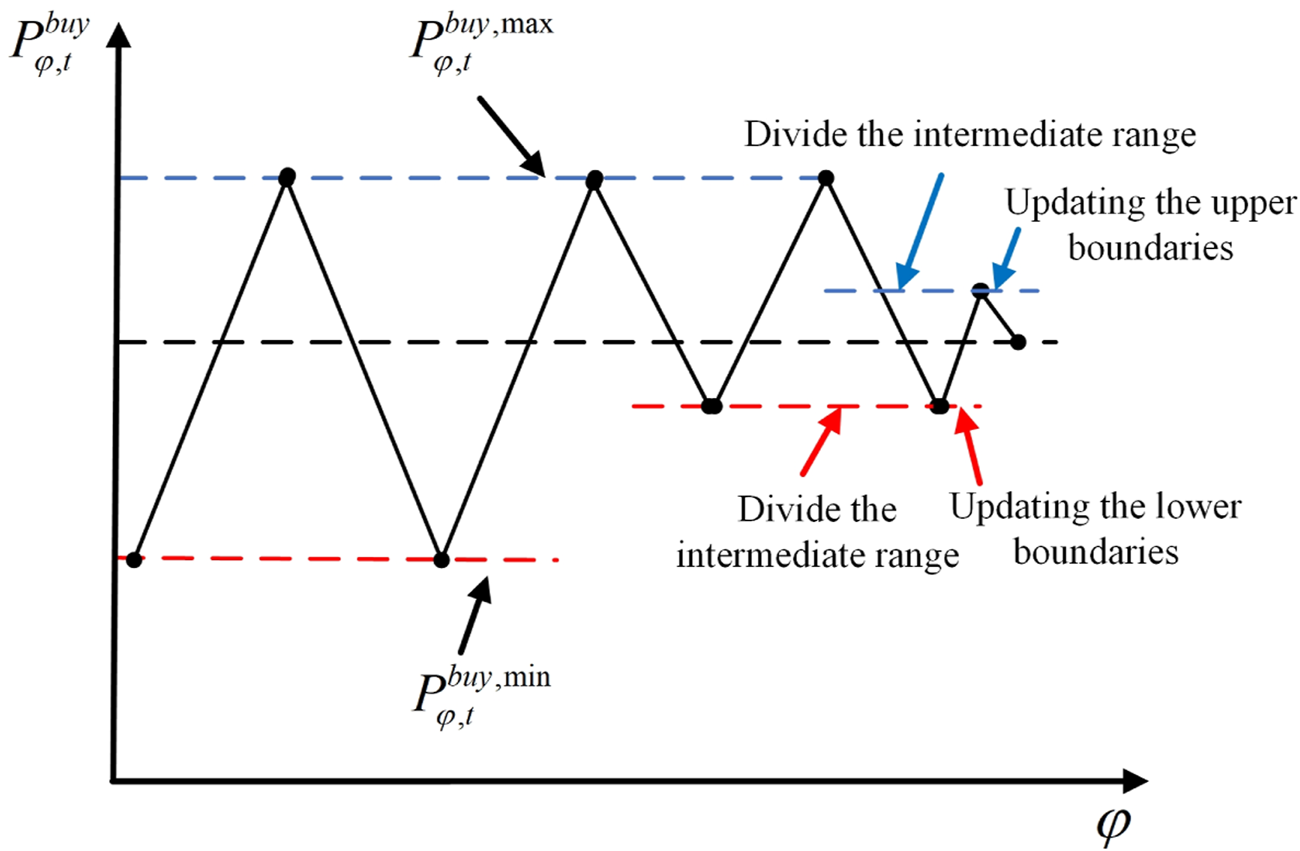
Schematic diagram of dichotomous iteration.
The detailed procedure for the dichotomy method is outlined below: if the
kth iteration oscillates, the load corresponding to the electricity demand is
, set as the maximum value of the power demand at time
tas
, and the minimum value of the electricity demand at time
tas
, which will be set to be the load operation interval, and the optimal operational condition lies within this range.
Step 1: The average value of electricity consumption at moment t is , .
Step 2: Adding constraints: , solving the two-layer model. This step splits the current running interval into two-halves and terminates the iteration if the convergence condition is satisfied. Otherwise , perform step 3.
Step 3: Adding constraints: , solving the two-layer model. This step obtains a new run interval containing the optimal state. If the convergence condition is satisfied, the iteration is terminated. Otherwise, perform step 4.
Step 4: If , the optimal state is within , Update the lower bound, let ; if , update the upper bound, let . Then return to step 1 until the convergence condition is satisfied.
5 Case study
5.1 Basic data
The improved IEEE-14 node system is used for the arithmetic example analysis, the distribution of units is shown in Figure 6, and the distribution of multiple types of load nodes is shown in Table 1. The predicted power of WT and PV is shown in Figure 7. A period of 24 h and a step size of 1 h is set to solve the problem using the CPLEX simulation platform.
FIGURE 6
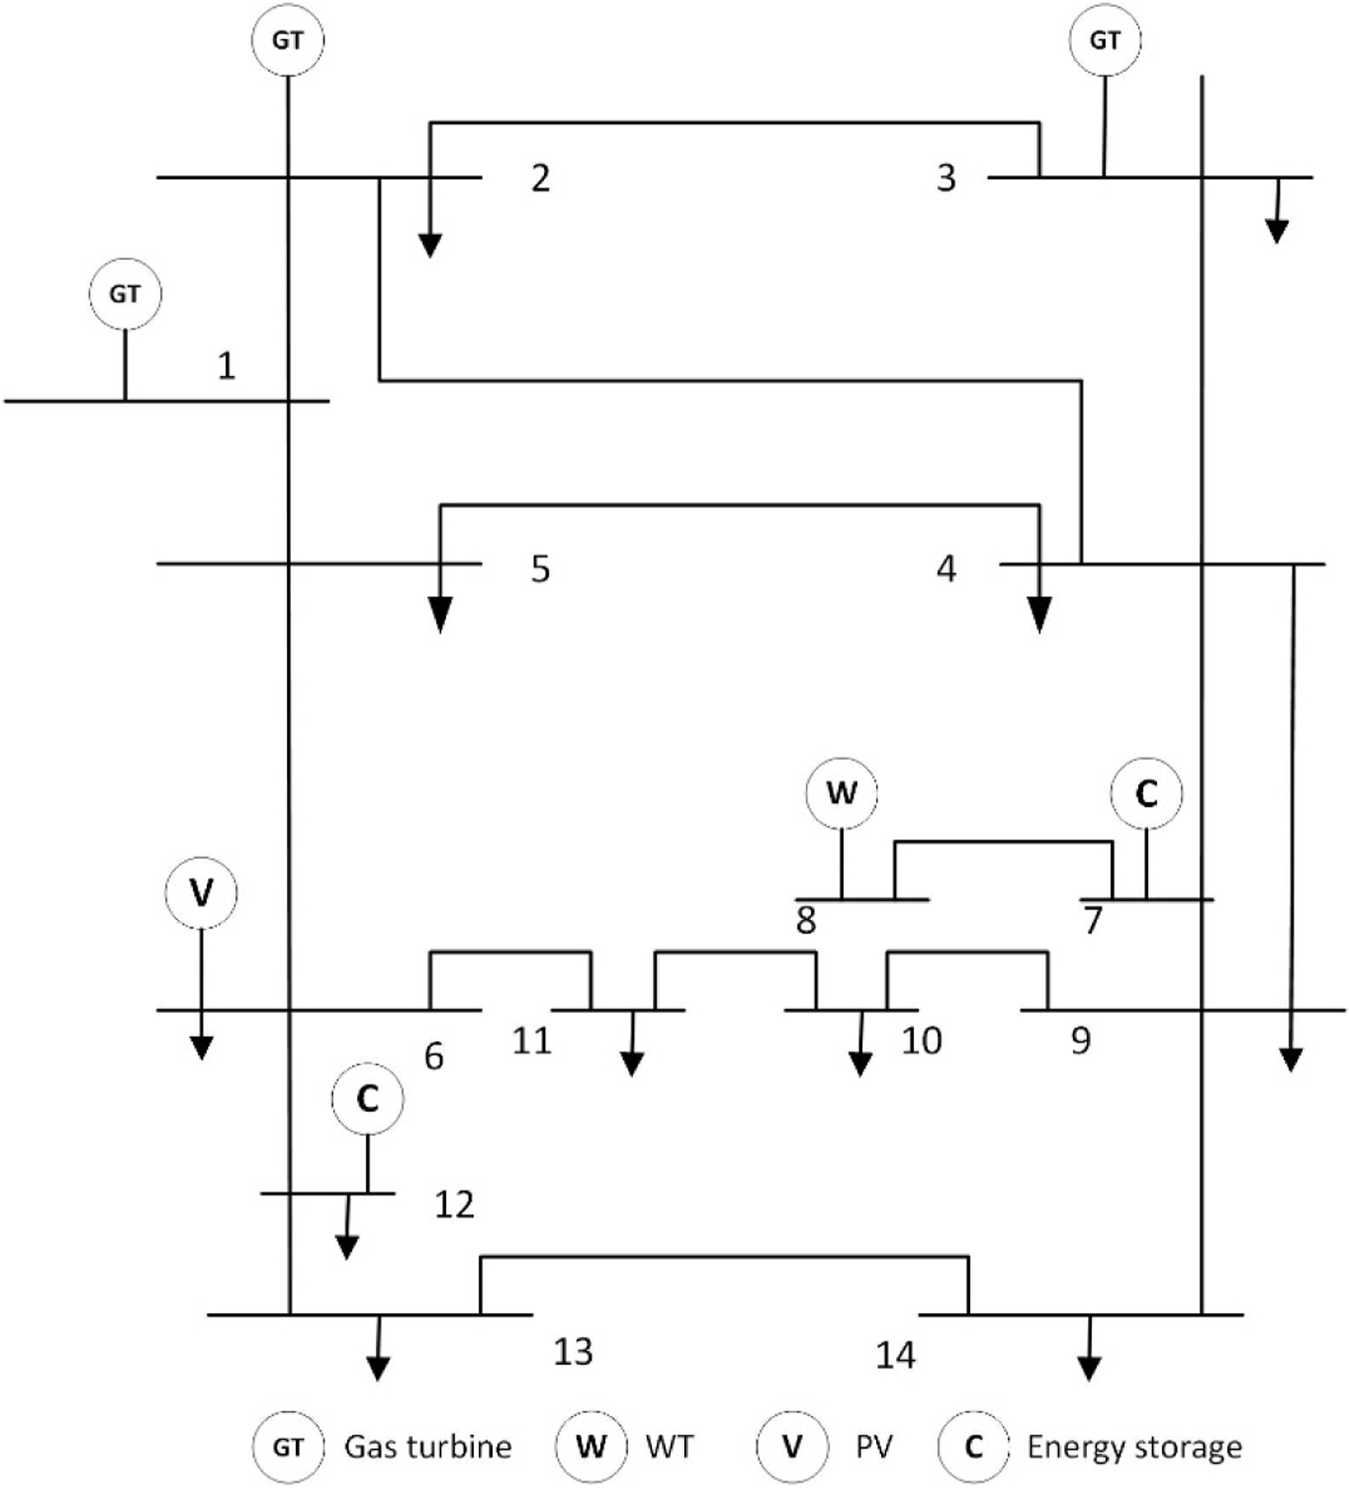
IEEE-14 system node diagram.
TABLE 1
| Form | Nodal load | ||
|---|---|---|---|
| Type | Commercial load | Industrial load | Residential load |
| Nodal | 6, 11–14 | 2–5 | 8–10 |
Multi-type load distribution.
FIGURE 7
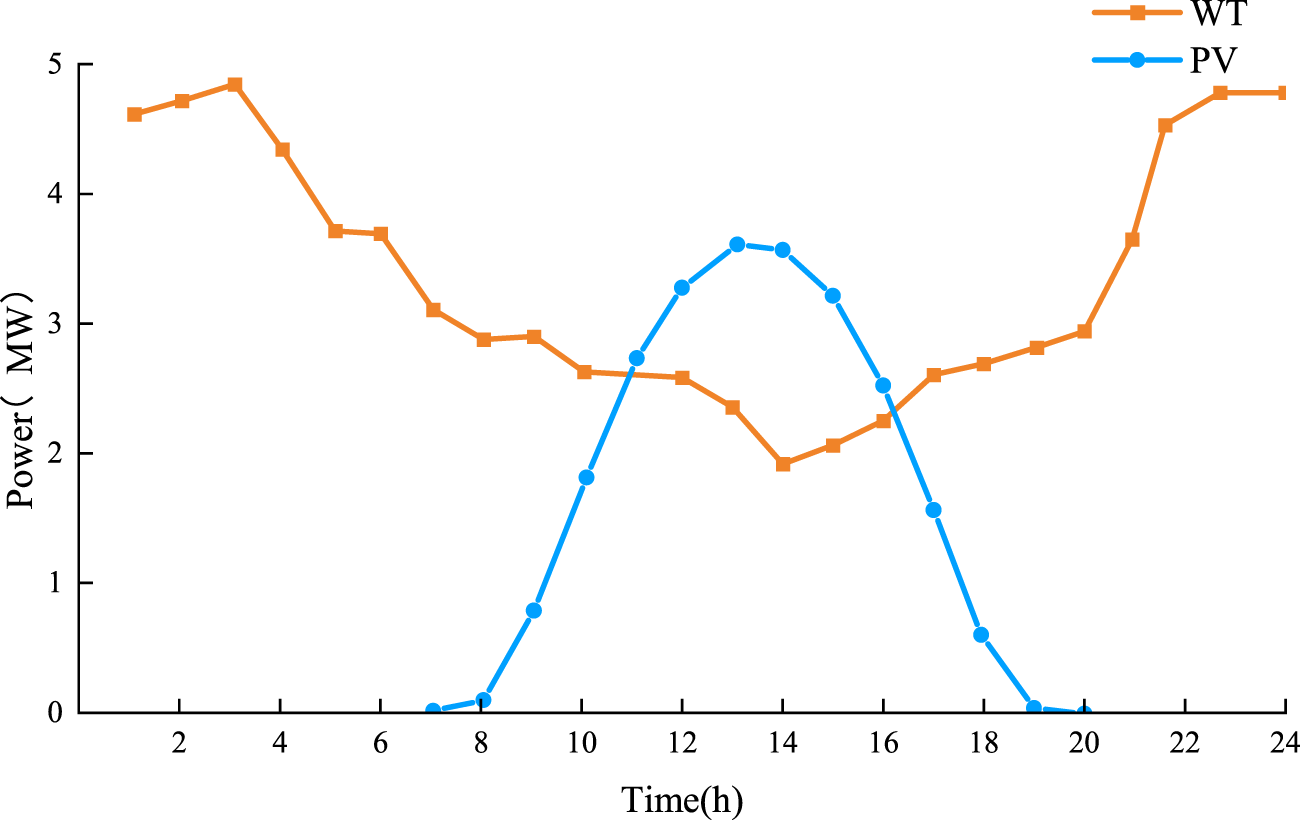
WT and PV forecast data.
5.2 Simulation results analysis
To confirm the efficacy of the proposed low-carbon economy scheduling model, sets up and analyzes three operational scenarios through simulation. Scenario A is the two-stage low-carbon economic scheduling of VPP proposed in this paper. Scenario B adopts the traditional time-sharing price DR modeling in (Zhao et al., 2022) for VPP scheduling. Scenario C does not consider DR modeling for VPP scheduling.
By contrasting the carbon emissions and economical operating expenses of the previously discussed scenarios. Figures 8, 9 show that the main factor affecting the variation in carbon emissions is the amount of clean energy used during the scheduling period. The quantity of clean energy used determines how much displacement the thermal power unit can produce. As the use of renewable energy increases, thermal power output decreases, resulting in lower carbon emissions. Based on a combined analysis of Table 2 and Figures 8A,C, gas turbine power has a higher proportion and the clean energy consumption rate is lower when DR is ignored. In Scenario C, there is an increase in gas turbine output during peak load hours, which raises generation costs and carbon emissions. On the other hand, in Scenario A, consumers engage in DR by allocating a portion of the load to the clean energy unit that has a higher output. This lowers generation costs and carbon emissions while simultaneously encouraging the use of clean energy.
FIGURE 8
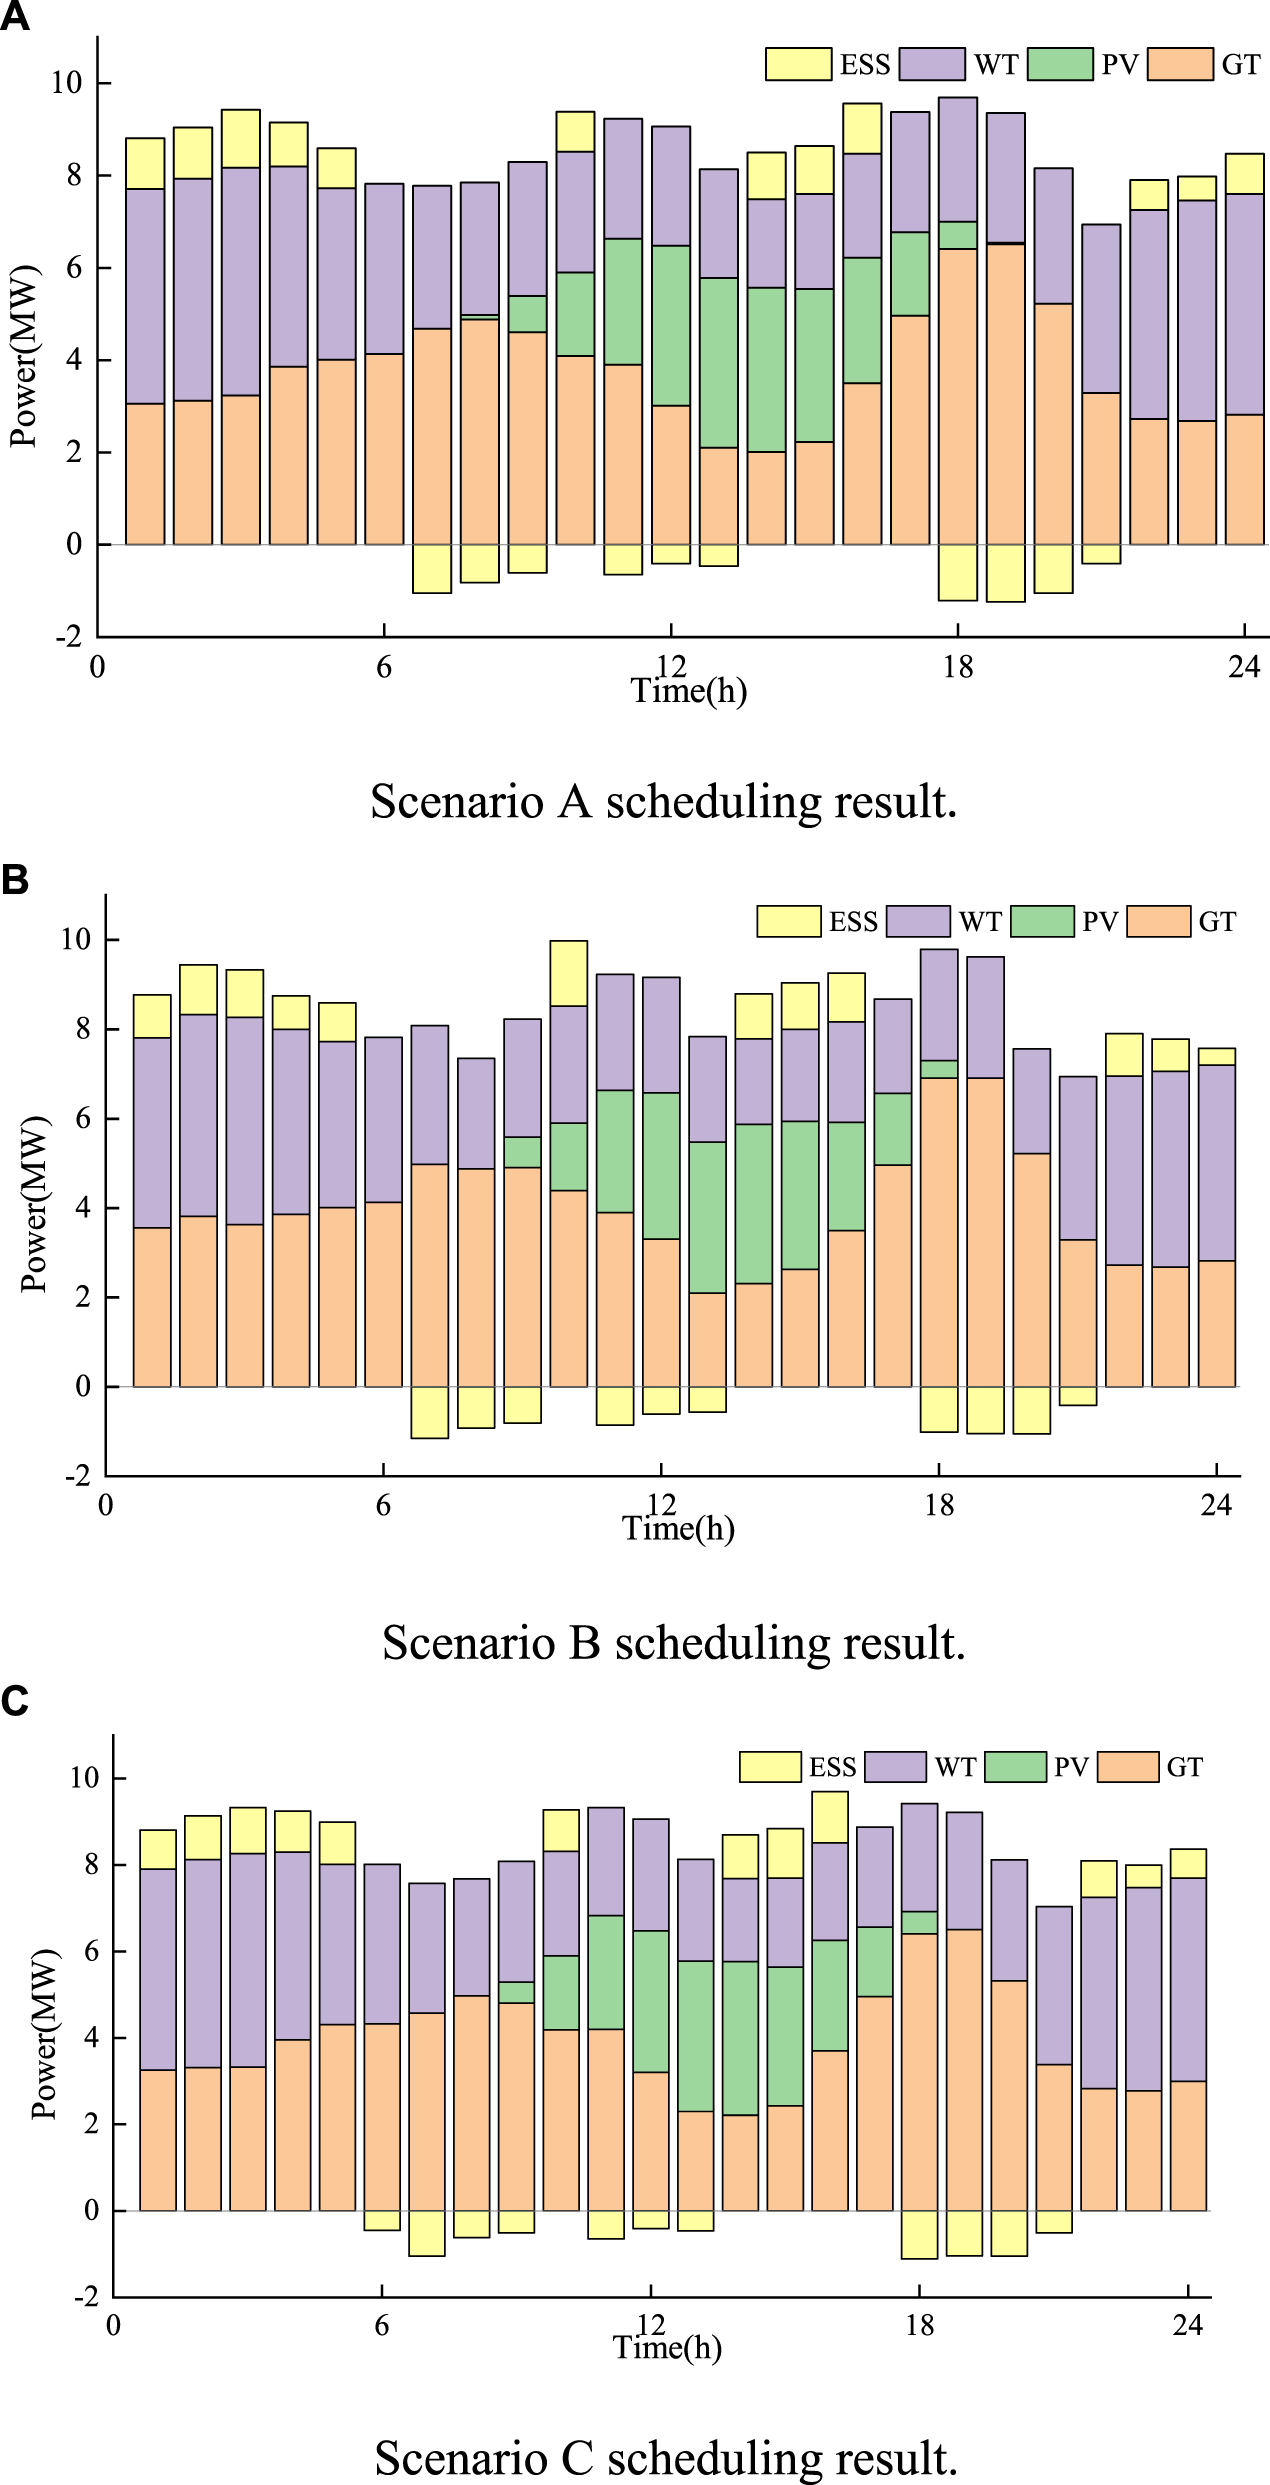
Scheduling results for different Scenarios. (A) Scenario A scheduling result. (B) Scenario B scheduling result. (C) Scenario C scheduling result.
FIGURE 9
Clean energy consumption rates for different scenarios.
TABLE 2
| Scheduling result | Generation cost/¥ | Carbon trading cost/¥ | Total cost/¥ | Carbon emission/t |
|---|---|---|---|---|
| A | 32,740 | 1,520 | 34,260 | 12.46 |
| B | 33,821 | 1,644 | 35,465 | 13.52 |
| C | 35,103 | 1912 | 37,015 | 15.23 |
Scheduling costs for each scenario.
Through a comprehensive analysis involving Table 2 and Figures 8A,B, it becomes evident that the clean energy consumption rate is higher in the scheduling model proposed in this paper, leading to a reduction in gas turbine output. This is because, compared with conventional time-sharing tariffs, the electric-carbon coupling price based on load electric-carbon characteristics takes into account the differences in carbon emissions at the nodes to reasonably calculate the carbon price at different nodes, to formulate a reasonable price, which enables the users to be more actively involved in the DR, promotes the clean energy consumption and reduces carbon emissions.
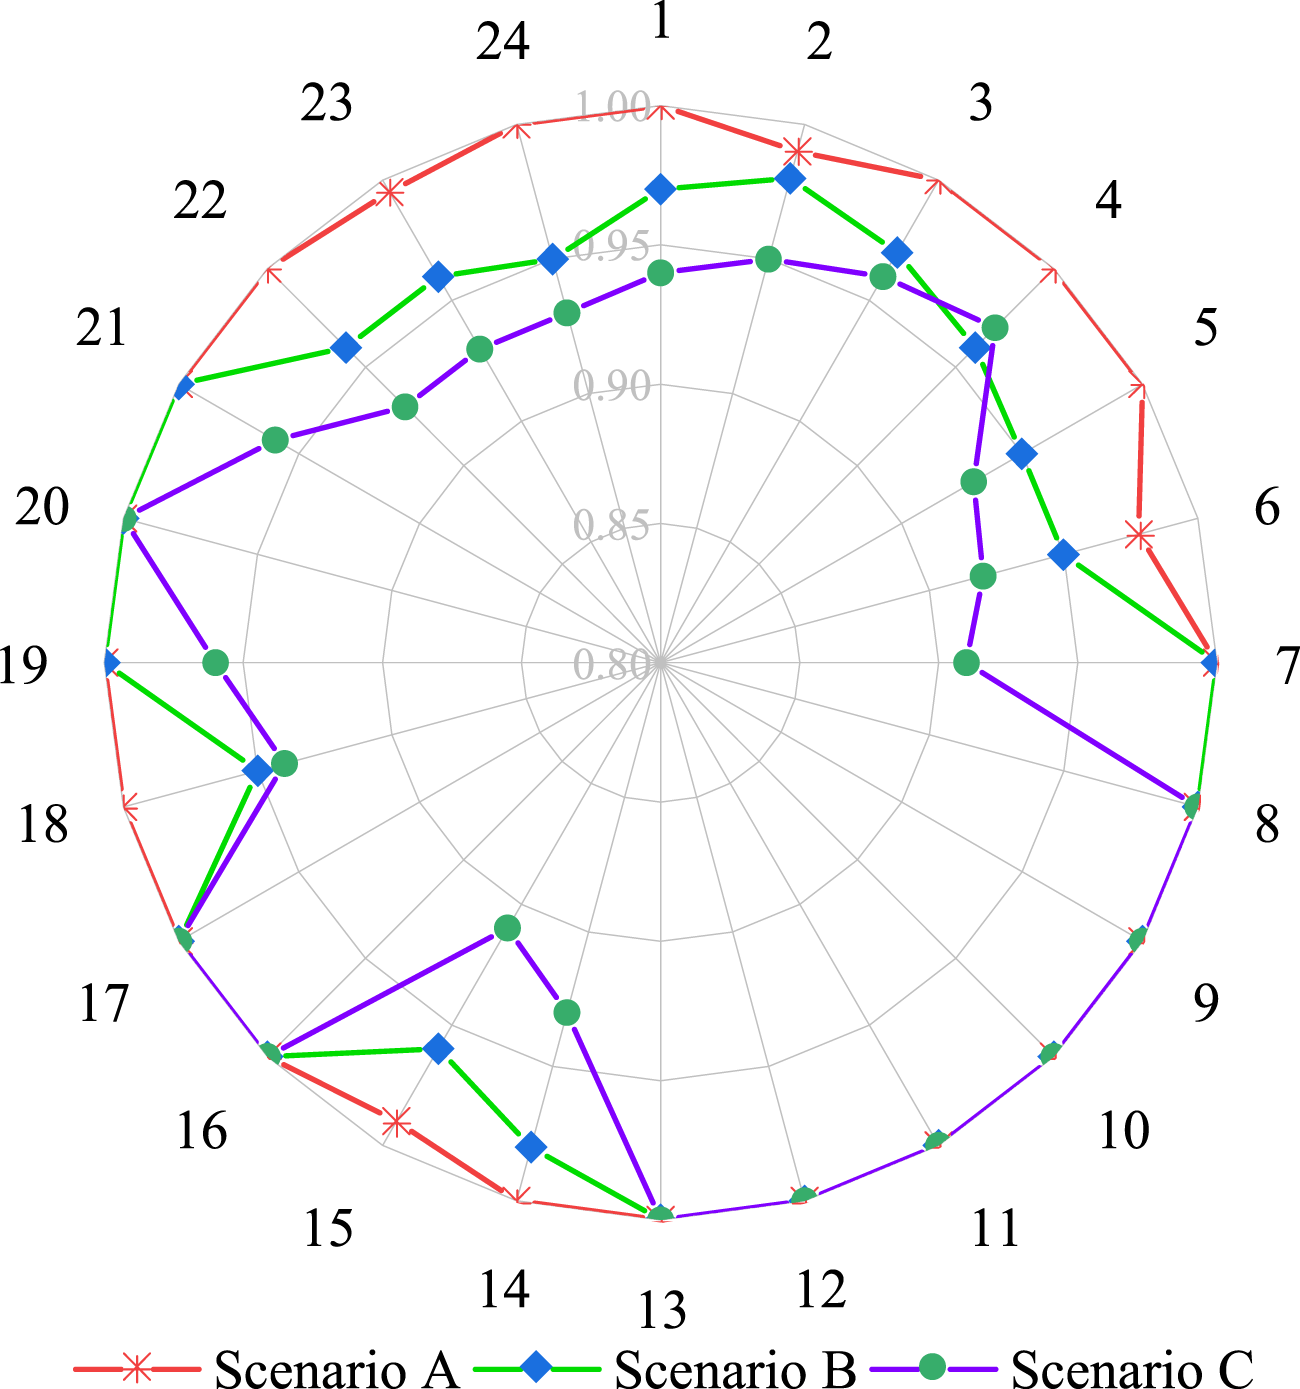
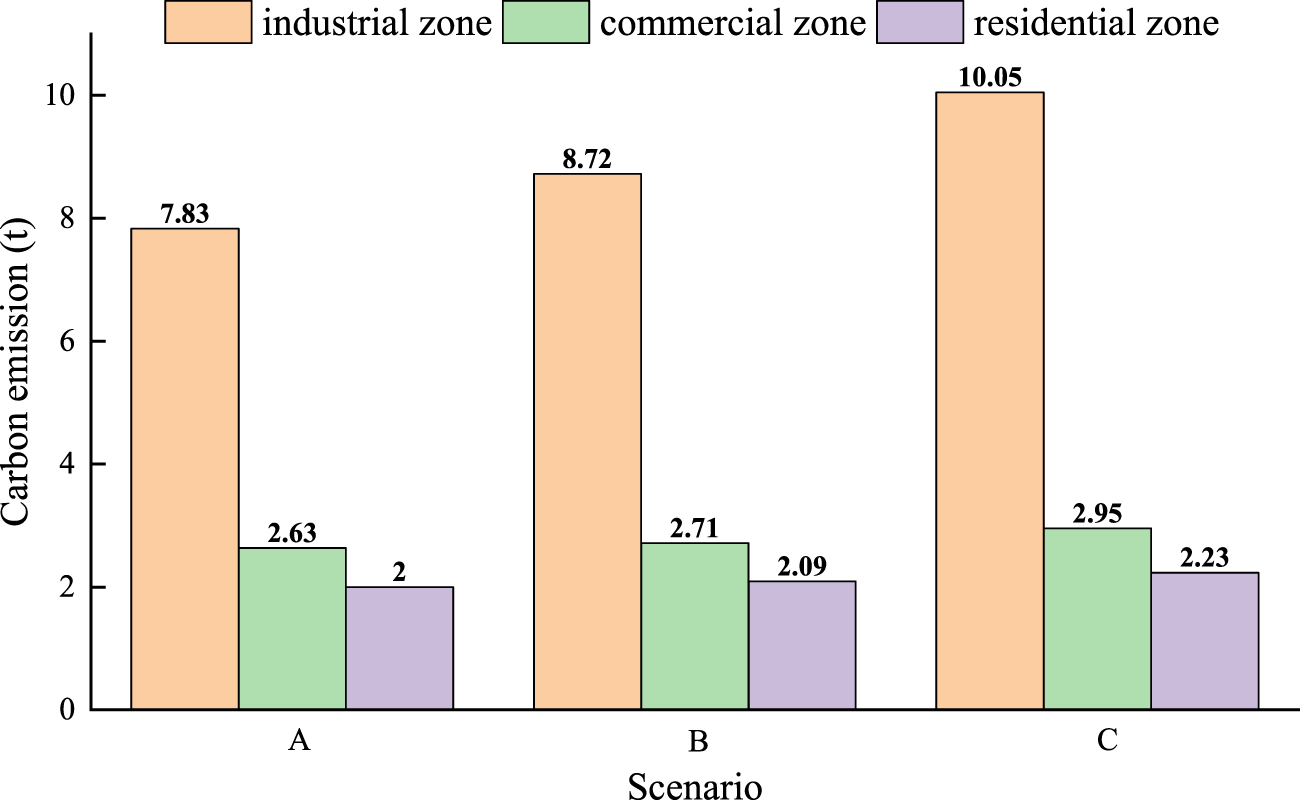
The comparison of clean energy consumption rates under different scenarios in Figure 9 shows that the multi-type demand response improves the low-carbon incentive effect for the system. The time-sharing load-side electricity-carbon coupling price signal guides the users to consciously carry out low-carbon electricity consumption behaviors and thus reduces the amount of abandoned wind and light, the carbon emission and system operation cost, which demonstrates that the multi-type demand response model proposed in this paper can enhance the low-carbon economic benefit. Figures 9, 10 reveal that, in comparison to Scenario B and Scenario C, the new energy units in Scenario A are fully utilized, the carbon emissions of the three types of regions are all reduced, and the carbon emissions of the industrial regions in the three types of regions are greatly restricted, which is in line with the priority requirement of carbon restriction in the industrial and commercial regions in the context of the dual-carbon mechanism.
FIGURE 10
Comparison of carbon emissions by partition under different scenarios.
As seen in Figure 11, Scenario A contrasts the system load change curves before and after DR. During the 2 hours of the midday and evening peaks, the commercial load is somewhat reduced by the electric power load. At the same time, a portion of the peak load is transferred to the load side valley by the DR model, which uses the linked price of carbon and electric power as the price signal. The results of the scheduling without DR indicate that the gas turbine production rises between 11:00 and 20:00, which raises the system’s generating costs and carbon emissions. After DR, part of the peak shortfall load is shifted and curtailed to the 5:00–10:00 and 20:00–23:00 valley hours, where the load is mostly supplied by clean energy, thus reducing both carbon emissions and operating costs.
FIGURE 11

Scenario 1 load comparison before and after DR.
6 Conclusion
Based on the electric-carbon coupling relationship of distributed resources and the theory of CEF, this paper proposes a low-carbon optimal scheduling method for VPP considering the CEF and DR, making full use of the adjustable resources to enhance the low-carbon economic advantages of VPP as well as facilitating the utilization of clean energy sources, which is verified by the simulation of the improved IEEE-14 node system example. the following conclusions can be obtained:
The proposed two-stage optimal scheduling model for VPP considers both the cost of generation and carbon emissions in a comprehensive manner. Through the source-load-storage cooperative scheduling strategy, the load side consumes a higher proportion of renewable energy, leading to a significant reduction in carbon emissions. Additionally, the establishment of a DR model, which is based on the coupled price of electricity and carbon, and considers multiple types of loads, holds significant practical value for reducing emissions. This model not only meets the carbon reduction needs of diverse user categories but also addresses the dual requirements of low carbon and economy aligned with the dual carbon objective. Furthermore, it provides innovative ways to explore low-carbon measures tailored to specific load categories within the carbon trading market.
Statements
Data availability statement
The original contributions presented in the study are included in the article/Supplementary Material, further inquiries can be directed to the corresponding author.
Author contributions
YW: Conceptualization, Data curation, Formal Analysis, Investigation, Methodology, Software, Validation, Writing–original draft, Writing–review and editing. Jiantie Xu: Conceptualization, Formal Analysis, Funding acquisition, Project administration, Resources, Visualization, Writing–review and editing. WP: Data curation, Validation, Writing–review and editing. Hanyang Wang: Data curation, Validation, Writing–review and editing. ZZ: Data curation, Validation, Writing–review and editing.
Funding
The author(s) declare that financial support was received for the research, authorship, and/or publication of this article. The author(s) declare financial support was received for the research, authorship, and/or publication of this article. This work was supported by the State Grid Liaoning Electric Power Co., Ltd. Technology project–Research on day-ahead optimal scheduling strategy considering multi-virtual power plant P2P transactions under the joint electricity-carbon market (2023ZX-01).
Conflict of interest
Authors JX, WP, HW, and ZZ were employed by State Grid Liaoning Electric Power Co., Ltd. The authors declare that this study received funding from the State Grid Liaoning Electric Power Co., Ltd. The funder had the following involvement in the study: the research design, data collection and analysis, decision to publish, preparation of the manuscript, and provided solutions and assistance with the writing of the manuscript.
The remaining author declares that the research was conducted in the absence of any commercial or financial relationships that could be construed as a potential conflict of interest.
Publisher’s note
All claims expressed in this article are solely those of the authors and do not necessarily represent those of their affiliated organizations, or those of the publisher, the editors and the reviewers. Any product that may be evaluated in this article, or claim that may be made by its manufacturer, is not guaranteed or endorsed by the publisher.
References
1
Cao C. Xie J. Yue D. Zhao J. Xiao Y. Wang L. (2016). “A distributed gradient algorithm based economic dispatch strategy for virtual power plant,” in 2016 35th Chinese control conference (CCC) (Chengdu, China: IEEE), 7826–7831.
2
Cheng Y. Zhang N. Lu Z. Kang C. (2019). Planning multiple energy systems toward low-carbon society: a decentralized approach. IEEE Trans. Smart Grid10, 4859–4869. 10.1109/TSG.2018.2870323
3
Cheng Y. Zhang N. Wang Y. Yang J. Kang C. Xia Q. (2019). Modeling carbon emission flow in multiple energy systems. IEEE Trans. Smart Grid10, 3562–3574. 10.1109/TSG.2018.2830775
4
Cheng Y. Zhang N. Zhang B. Kang C. Xi W. Feng M. (2020). Low-carbon operation of multiple energy systems based on energy-carbon integrated prices. IEEE Trans. Smart Grid11, 1307–1318. 10.1109/TSG.2019.2935736
5
Da C. (2016). Study on factor decomposition and network stream analysis of carbon emission in power systems. Hangzhou: Zhejiang University.
6
Huang B. Li Y. Zhan F. Sun Q. Zhang H. (2022). A distributed robust economic dispatch strategy for integrated energy system considering cyber-attacks. IEEE Trans. Industrial Inf.18, 880–890. 10.1109/TII.2021.3077509
7
Kang C. Chen X. Su J. Ai Q. Ji Y. Pan W. et al (2022). Scientific issues and research framework of a new power system scale-up flexible resource virtual power plant. Automation Electr. Power Syst.46, 3–14. 10.7500/AEPS20220401007
8
Kang C. Zhou T. Chen Q. Wang Q. Sun Y. Xia Q. et al (2015). Carbon emission flow from generation to demand: a network-based model. IEEE Trans. Smart Grid6, 2386–2394. 10.1109/tsg.2015.2388695
9
Lei R. Zhou M. Wu Z. Sha Y. Zhang Y. Liu X. (2020). “The optimal operation and revenue allocation method of virtual power plant considering carbon trading,” in 2020 IEEE 4th conference on energy internet and energy system integration, 2396–2402. 10.1109/ei250167.2020.9347001
10
Li T. Huang R. Chen L. Jensen C. S. Pedersen T. B. (2020). Compression of uncertain trajectories in road networks. Proc. VLDB Endow.13, 1050–1063. 10.14778/3384345.3384353
11
Li W. Liang R. Luo F. Feng S. Yang B. Liu Z. et al (2022). Response potential assessment of user-side flexible resources of regional power distribution networks based on sequential simulation of optimal operation. Front. Energy Res.10, 1096046. 10.3389/fenrg.2022.1096046
12
Li Y. Gao D. W. Gao W. Zhang H. Zhou J. (2020). Double-mode energy management for multi-energy system via distributed dynamic event-triggered Newton-raphson algorithm. IEEE Trans. Smart Grid11, 5339–5356. 10.1109/TSG.2020.3005179
13
Li Y. Gao D. W. Gao W. Zhang H. Zhou J. (2021). A distributed double-Newton descent algorithm for cooperative energy management of multiple energy bodies in energy internet. IEEE Trans. Industrial Inf.17, 5993–6003. 10.1109/TII.2020.3029974
14
Li Y. Zhang H. Liang X. Huang B. (2019). Event-triggered-based distributed cooperative energy management for multienergy systems. IEEE Trans. Industrial Inf.15, 2008–2022. 10.1109/TII.2018.2862436
15
Li Y. Zhou L. Wang D. Gao Z. Wu X. (2022). Virtual power plant economic dispatching considering user classification. Power Syst. Prot. Control50, 121–130. 10.19783/j.cnki.pspc.211449
16
Liu Z. Huang B. Hu X. Du P. Sun Q. (2023). Blockchain-based renewable energy trading using information entropy theory. IEEE Trans. Netw. Sci. Eng., 1–12. 10.1109/TNSE.2023.3238110
17
Liu Z. Huang B. Li Y. Sun Q. Pedersen T. B. Gao D. W. (2024). Pricing game and blockchain for electricity data trading in low-carbon smart energy systems. IEEE Trans. Industrial Inf.20, 6446–6456. 10.1109/TII.2023.3345450
18
Liu Z. Xu Y. Zhang C. Elahi H. Zhou X. (2022). A blockchain-based trustworthy collaborative power trading scheme for 5G-enabled social internet of vehicles. Digital Commun. Netw.8, 976–983. 10.1016/j.dcan.2022.10.014
19
Naughton J. Wang H. Cantoni M. Mancarella P. (2021). Co-optimizing virtual power plant services under uncertainty: a robust scheduling and receding horizon dispatch approach. IEEE Trans. Power Syst.36, 3960–3972. 10.1109/TPWRS.2021.3062582
20
Nguyen Duc H. Nguyen Hong N. (2021). Optimal reserve and energy scheduling for a virtual power plant considering reserve activation probability. Appl. Sci.11, 9717. 10.3390/app11209717
21
Sun W. Xiang Z. Yang L. Wo J. Ma X. Fang X. et al (2023). “Low carbon scheduling of integrated energy systems considering stepped carbon trading and demand response,” in 2023 3rd power system and green energy conference (PSGEC), 291–295.
22
Tang J. Liu J. Sun T. Kang H. Hao X. (2023). Multi-time-scale optimal scheduling of integrated energy system considering demand response. IEEE Access11, 135891–135904. 10.1109/ACCESS.2023.3335242
23
Wang S. Wu W. (2021). Aggregate flexibility of virtual power plants with temporal coupling constraints. IEEE Trans. Smart Grid12, 5043–5051. 10.1109/TSG.2021.3106646
24
Wang Y. Teng Y. (2023). “Economic dispatching model of virtual power plant and carbon emission under carbon trading mechanism,” in 2023 IEEE international conference on control, electronics and computer Technology (ICCECT), 765–769.
25
Yang C. Liu J. Liao H. Liang G. Zhao J. (2023). An improved carbon emission flow method for the power grid with prosumers. Energy Rep.9, 114–121. 10.1016/j.egyr.2022.11.165
26
Zahra A. Hooshmand R. A. Soleymani S. (2021). Optimal integration of demand response programs and electric vehicles in coordinated energy management of industrial virtual power plants. J. Energy Storage41, 102951. 10.1016/j.est.2021.102951
27
Zhang Z. Yang X. Zhao S. Wu D. Cao J. Gao M. et al (2022). Large-signal stability analysis of islanded DC microgrids with multiple types of loads. Int. J. Electr. Power & Energy Syst.143, 108450. 10.1016/j.ijepes.2022.108450
28
Zhao L. Wang X. Ding Y. Guo Y. Li J. (2022). Optimal scheduling of multi-energy virtual power plant considering time-sharing tariff and participation of photovoltaic power plant. Power Constr.43, 119–129. 10.12204/j.issn.10007229.2022.04.013
29
Zhou T. Kang C. Xu Q. Chen Q. (2012). Preliminary investigation on a method for carbon emission flow calculation of power system. Automation Electr. Power Syst.36, 44–49. 10.3969/j.issn.1000-1026.11.008
Summary
Keywords
virtual power plant, electro-carbon coupling, carbon emission flow, demand response, low-carbon economic scheduling
Citation
Wang Y, Xu J, Pei W, Wang H and Zhang Z (2024) Low-carbon economic scheduling of virtual power plant considering carbon emission flow and demand response. Front. Energy Res. 12:1398655. doi: 10.3389/fenrg.2024.1398655
Received
10 March 2024
Accepted
08 April 2024
Published
23 May 2024
Volume
12 - 2024
Edited by
Yushuai Li, Aalborg University, Denmark
Reviewed by
Dawei Gong, University of Electronic Science and Technology of China, China
Cheng Zhang, Hunan University, China
Ruizhuo Song, University of Science and Technology Beijing, China
Updates
Copyright
© 2024 Wang, Xu, Pei, Wang and Zhang.
This is an open-access article distributed under the terms of the Creative Commons Attribution License (CC BY). The use, distribution or reproduction in other forums is permitted, provided the original author(s) and the copyright owner(s) are credited and that the original publication in this journal is cited, in accordance with accepted academic practice. No use, distribution or reproduction is permitted which does not comply with these terms.
*Correspondence: Jiantie Xu, 8275876@qq.com
Disclaimer
All claims expressed in this article are solely those of the authors and do not necessarily represent those of their affiliated organizations, or those of the publisher, the editors and the reviewers. Any product that may be evaluated in this article or claim that may be made by its manufacturer is not guaranteed or endorsed by the publisher.