- State Grid UHV Transmission Co. of SEPC, Taiyuan, China
Introduction: Power grid icing is a severe natural hazard that threatens the safe and stable operation of power systems. With the expansion of ultra-high voltage (UHV) power grids, systematic assessment of icing disaster risks has become increasingly crucial.
Methods: This paper proposes a probabilistic inference approach for power grid icing risk assessment, which employs a Poisson process model to characterize the nonlinear relationship between line failure probability and ice thickness, combined with Monte Carlo simulation techniques to evaluate overall system risk.
Results: Research findings indicate that critical ice thickness and failure sensitivity coefficients significantly impact the grid’s disaster resistance capability, particularly when the proportion of high-load UHV lines increases, leading to nonlinear growth in system risk. Quantitative analysis reveals that when UHV lines account for 50% of the system, the maximum risk can exceed 15 times that of conventional line scenarios.
Discussion: The research outcomes provide theoretical foundations for power grid icing disaster prevention and mitigation, offering important guidance for optimizing grid planning and enhancing system resilience.
1 Introduction
Transmission line icing refers to the phenomenon where rime or glaze accumulates on conductors, or where wet snow deposits and subsequently freezes on wires. The additional ice load imposes increased mechanical stress on transmission lines, thereby elevating conductor tension and increasing the likelihood of line breakage and equipment failure. Moreover, icing compromises the insulating properties of electrical components, which may result in widespread power outages. Historically, severe icing events have caused substantial economic losses and societal disruptions. In 2008, a severe freezing rain and snow disaster affected multiple southern provinces of China. Alongside the Wenchuan Earthquake, it was classified by the Ministry of Civil Affairs as one of the two most catastrophic natural disasters in recent decades, with exceptionally wide-ranging impacts. That year, nationwide natural disasters caused direct economic losses totaling 1.175 trillion yuan (Ministry of Civil Affairs of the People’s Republic of China, 2008). In 2021, an extreme cold spell in Texas caused extensive damage to transmission and distribution infrastructure, leading to large-scale power interruptions that affected millions of residents (Busby et al., 2021).
Icing typically begins once temperatures drop to the range of −10°C–0°C, with the accumulation phase primarily occurring between −5°C and 0°C (Farzaneh and Savadjiev, 2005). When meteorological conditions persist within the critical range, or during alternating periods of freezing rain and snow, the ice layer can rapidly thicken, forming high-density ice coatings. Throughout the ice formation process, accumulation begins predominantly on the side facing the wind. As ice loads increase progressively, conductors may be subject to rotational deformation or mechanical failure caused by gravitational stress (Yang et al., 2023). Due to differences in geometry, surface characteristics, material properties, and installation configurations, conductors and insulators display distinct ice formation behaviors and growth patterns (Huang et al., 2021; Han et al., 2022; Huang et al., 2025). These differential icing behaviors directly affect the mechanical stability and electrical performance of transmission line components. Risk assessment of power grids plays a vital role in ensuring the reliable operation of electrical systems (Johansson et al., 2013). Its primary objective is to identify and quantify potential risk factors, thereby informing targeted mitigation and prevention strategies. Traditional risk assessment methods often rely on deterministic models that fail to account fully for uncertainties in weather conditions and system operations, especially when addressing complex and variable icing hazards. Probabilistic inference, recognized for its capacity to address uncertainties, has emerged as a promising methodology in recent years. By incorporating probabilistic models, it is possible to systematically describe the relationships among various random variables in the icing process and quantify the likelihood of grid failures under different meteorological scenarios, thereby enhancing the accuracy and robustness of risk assessments.
Accordingly, this study aims to establish a probabilistic-inference-based framework for assessing the risks associated with power grid icing.
1.1 Current status of transmission line icing research
Transmission line icing refers to the complex physical process by which super-cooled water droplets in clouds or fog attach to conductors or insulators under low-temperature conditions and subsequently freeze. This accumulation of ice increases both the weight and tensile stress on the lines, and may induce conductor vibrations, potentially resulting in line breakage and compromising the secure operation of transmission lines. Current research on transmission line icing generally falls into two main categories: physical models and statistical models.
Physical models describe the icing process based on fundamental principles, employing numerical simulations to represent ice formation and growth mechanisms. Classical examples include the Imai, Chaine, and Makkonen models (Imai, 1953; Chaîné et al., 1974; Poots and Makkonen, 2000), which capture time-dependent evolution of ice thickness. The Imai model uses air temperature and wind speed to simulate ice growth controlled by heat transfer; the Chaine model considers radial ice accretion on bundled conductors which require precipitation rate inputs and empirically calibrated correction factors; while the Makkonen model provides time-dependent numerical simulation incorporating both cylindrical growth and icicle formation. These models rely on multiple meteorological inputs—such as droplet size distribution, humidity, and surface roughness—that are often unavailable for grid-scale applications. Recent advancements employ computational fluid dynamics to simulate two-dimensional icing processes, providing detailed analysis of factors influencing ice accumulation (Liu et al., 2022). However, these models require extensive input parameters and are computationally intensive, which limits their applicability in large-scale risk assessment contexts.
Statistical models establish empirical relationships between icing thickness and meteorological factors through observed data analysis. Early research utilized regression analysis and time series forecasting (Zhihong et al., 2013; Liao and Duan, 2010), while recent developments have adopted more advanced data-driven methodologies. Han et al. (Han et al., 2024) utilized Grey Relational Pearson Combination Analysis to determine correlations between meteorological data and icing severity. Modern approaches increasingly leverage machine learning, with Huang and Li (Huang and Li, 2012) developing an icing thickness prediction model using BP Neural Network and Li et al. (Li X. et al., 2021) proposing an AMPSO BP neural network model. Wang (Wang L. et al., 2024) demonstrated hybrid approaches combining physical models with data-driven methods. Despite progress, the rarity of severe icing events constrains the availability of high-resolution and representative datasets.
Recent advances in power system vulnerability assessment under extreme weather conditions have yielded significant insights from multiple perspectives. Studies on parametrized fragility functions have revealed that the relationship between wind speed, ice thickness, and system component vulnerability is notably nonlinear, with wind speed primarily affecting pole rupture while extreme ice and wind combinations significantly influence conductor breakage (Pescarin and Salomoni, 2022). Regarding standards application, research using multivariate scenario sampling methods has found that the reduction factors for combined wind and ice loading specified in IEC 60826 may be conservative for most meteorological conditions, and that the mean recurrence interval (MRI) has minimal impact on hazard curves except for relatively smaller ice thicknesses (Jafari and Baghal, 2022). Additionally, investigations into the instability effects of wind and snow combinations on transmission line systems have demonstrated that a significant proportion of load combinations can lead to material yield and/or unacceptable large deformations, necessitating the implementation of control strategies and engineering innovations to limit or prevent line galloping (Li M. et al., 2024).
While existing research has primarily emphasized the dynamic simulation of ice accretion, few studies have systematically explored probabilistic modeling to quantify the nonlinear failure risks associated with varying ice thickness.
In extreme conditions, icing failures propagate through interconnected transmission systems, in-creasing the likelihood of cascading failures. The sudden shedding of accumulated ice induces conductor vibration, producing longitudinal unbalanced tension that can lead to sequential tower collapse (Li J. et al., 2021), compromising grid integrity, as shown in recent studies on progressive ice-shedding dynamics (Xie et al., 2019).
Power grid risk assessment identifies and quantifies potential risk factors, in-forming targeted prevention and mitigation measures. Recent research has utilized Poisson process models to characterize transmission line failures under icing conditions. Li W. et al. (2024) proposed a multi-device successive failure risk assessment method that models the probability distribution of equipment failures during ice storms. This approach captures the independent nature of successive failures and generates scenarios using Monte Carlo methods, effectively representing system-wide risk.
Monte Carlo simulation techniques evaluate icing risks by generating various failure scenarios, thereby facilitating a comprehensive evaluation of cascading failure risks (Li W. et al., 2024). Such probabilistic approaches are valuable for capturing the stochastic nature of icing events and their impacts on transmission systems.
Various probability distribution models characterize statistical patterns of icing disasters. Hui, (2012) applied the Pearson type III distribution to assess power grid failure risks due to ice disasters, providing insights into the probability distribution of annual extreme ice thickness and its economic implications.
To address data scarcity, innovative approaches like the GM(1, 6) grey theory model developed by Zhang N. et al. (2024) incorporate random data functions to improve predictive accuracy under data-scarce conditions. Additionally, Zhang et al. (2022) demonstrated the application of fuzzy algorithms and clustering techniques for evaluating galloping risks in iced transmission lines.
Ultra-high voltage transmission lines are particularly vulnerable to icing due to their larger conductor sizes and bundled configurations. The dynamic effects of ice-shedding cause significant mechanical damage and electrical faults, affecting both the mechanical design and alignment of UHV lines (Meng et al., 2011). Experimental studies have revealed significant differences in ice accretion between split and single conductors, highlighting the complex influence of conductor configuration on ice formation (Wang Y. et al., 2024).
Insulator flashover performance under icing conditions is critical for UHV systems. Hu et al. (2007) demonstrated that ice thickness and pollution severity significantly affect flashover voltage, directly impacting UHV line reliability. Their research on pre-contaminated and ice-covered composite insulators for 1,000 kV UHV AC trans-mission lines provides insights for designing resilient insulation systems.
UHV lines significantly influence grid resilience in regions prone to severe weather conditions. Yin et al. (2016) investigated corona losses and onset voltage under icing conditions, revealing higher corona losses with glaze ice, affecting UHV line efficiency. He et al. (2024) analyzed meteorological characteristics of ice-covered events on UHV transmission lines in the Yunnan region, emphasizing interactions between weather patterns and line performance. Yang et al. (2012) conducted unbalanced tension analysis of tangent towers for UHV lines in heavy icing areas, finding that ice thickness, span, and ice accretion rate significantly influence tension distribution, highlighting the importance of mechanical dynamics in UHV line design.
The GM(1, 6) grey theory model (Zhang N. et al., 2024) represents a notable advancement for data scarcity issues. Bai et al. (2023) compared physical mechanism models with data-driven models for icing thickness prediction, highlighting their respective advantages and limitations with sparse datasets. Recent efforts include digital twin models for trans-mission line icing (Zhang Y. et al., 2024) and heat balance modeling for transmission lines in high-frequency critical ice melting states (Tan et al., 2024).
Despite these valuable contributions to understanding power system vulnerability under winter weather conditions, there remains a need for research that integrates probabilistic inference approaches with physical mechanisms to better understand the complex relationship between line failure probability and ice thickness, particularly in the context of expanding ultra-high voltage (UHV) power grids. This study addresses this gap by developing a probabilistic inference framework for power grid icing disaster risk assessment that synthesizes physical mechanisms with statistical principles to capture icing growth uncertainties in situations with limited data availability.
1.2 Limitations of existing research
Despite progress in power system risk forecasting methodologies, substantial challenges remain in the identification and quantification of icing-related risks. Existing research frameworks are subject to notable constraints that hinder comprehensive assessment of system-wide vulnerabilities in evolving power grids.
Most prior studies focus on individual transmission lines or localized regions, failing to address the dynamics of risk propagation across interconnected systems. This limitation becomes increasingly problematic as ultra-high voltage grids expand across regions, highlighting the need for analytical frameworks capable of capturing complex system interactions throughout the power network. Traditional deterministic approaches inadequately capture the inherent uncertainties in icing phenomena, while emerging data-driven techniques, though promising, remain hampered by the scarcity of comprehensive datasets due to the infrequent nature of severe icing events.
A pronounced disconnect exists between physical mechanism models and statistical approaches. Physical models, while theoretically sound for describing ice accretion processes, demand extensive meteorological parameters that are seldom available for comprehensive grid analyses and impose substantial computational burdens. Statistical models offer computational efficiency but demonstrate inadequate reliability when confronting extreme events or data-scarce scenarios—particularly problematic for infrequent yet devastating icing disasters.
The vulnerability assessment of ultra-high voltage transmission infrastructure under icing conditions remains insufficiently explored. UHV lines exhibit distinct characteristics in ice formation and mechanical response due to their unique configurations, bundled conductors, and extended spans across diverse meteorological zones. Given the critical role these lines play in modern power systems and their exceptional load capacities, this knowledge gap presents a significant constraint on comprehensive risk evaluation.
Furthermore, existing assessment frameworks inadequately address the integration of physical principles with probabilistic methods. Most models either focus exclusively on mechanical stress analysis or probabilistic risk evaluation, but seldom effectively combine these approaches to characterize the nonlinear relationship between ice thickness and transmission line failures.
1.3 Research contributions
This paper introduces a probabilistic inference framework for power grid icing disaster risk assessment, synthesizing physical mechanisms with statistical principles to capture icing growth uncertainties, thereby addressing challenges associated with limited data. The study develops a system-level risk assessment framework integrating single line failure probabilities with grid topology and load characteristics, enabling comprehensive analysis of cascading impacts. Through quantitative assessment of how UHV line ratios impact grid vulnerability, this research provides practical guidance for grid planning and risk management under severe icing conditions.
2 Materials and methods
2.1 Line fault probability model
Icing disasters make transmission lines more likely to fail by putting extra mechanical strain on them. To rigorously evaluate system vulnerability under icing conditions during icing conditions, we need to accurately measure the connection between ice thickness and grid failures. In this section, we present a model for calculating line fault probability based on Poisson processes, with ice thickness as the main factor. Our model establishes a non-linear probability relationship that helps predict how likely lines are to fail across different icing scenarios.
When ice forms on transmission lines, Line failures involve complex interactions among multiple physical processes with each other. Initially, ice accumulation increases the mechanical load to the conductors, putting them under additional static stress. Additionally, the combination of wind forces and ice buildup with ice buildup, the conductors start to vibrate, creating dynamic stress. Moreover, ice formation reduces the insulating performance the insulating capabilities of the conductors, which raises the risk of electrical failures. To systematically depict these multifaceted mechanisms, this study adopts a Poisson process-based fault probability model. A Poisson process is well suited for describing the random occurrence of events, especially given that the probability of multiple simultaneous events in an infinitesimally small time interval is negligible. This feature makes it appropriate for modeling line failures in complex icing scenarios.
Given the nonlinear relationship between ice thickness and line faults, we assume that the occurrence of failures follows a probability distribution that increases sharply once ice thickness Hice surpasses a critical threshold Hcrit. Specifically, the fault probability Pfault shows an exponential-like increase near or beyond Hcrit, aligning with actual observations of icing disasters. The following Poisson process-based formulation describes the fault probability under different icing conditions (Equation 1):
Where Pfault denotes the fault probability given an ice thickness Hice. The parameter λ, referred to here as the fault sensitivity coefficient, captures the physical characteristics of the transmission line—such as conductor material, span length, and wind-loading capacity—and reflects the line’s tolerance to icing loads. Hcrit is the critical icing thickness beyond which fault probability rises abruptly.
The model further assumes a nonlinear relationship between line fault probability and ice thickness, meaning that when the latter approaches or exceeds the threshold Hcrit, the probability of line failure escalates rapidly. This behavior is consistent with real-world observations of icing disasters. Ice thickness is influenced by line type and environmental conditions. Our model can adjust to include specific parameters for different transmission line setups (e.g., high-voltage vs. low-voltage lines). This flexibility makes it work well across various grid layouts and geographic features.
2.2 Risk assessment model
The single-line fault probability model serves as the foundation for a comprehensive system-level risk assessment framework. This framework integrates three key components: (1) grid topological complexity, including the spatial distribution and interconnection patterns of transmission lines; (2) quantitative load interdependencies that determine cascading failure pathways; and (3) established reliability standards that define acceptable operational thresholds. The framework enables systematic evaluation of icing-related hazards through probabilistic inference methods that incorporate both deterministic physical principles and stochastic variables reflecting meteorological uncertainties. System risk can typically be represented as the product of failure probability and impact severity. When examining icing scenarios specifically, the following factors require special consideration: First, the spatial distribution and topological structure of transmission lines within the power grid influence the propagation pathways of failures. A failure in a critical line may trigger a chain reaction, leading to systemic risk. Second, lines vary considerably in both load capacity and supply area; among them, ultra-high voltage (UHV) lines carry notably heavier loads than conventional lines. The load loss caused by a single UHV line failure often far exceeds that of conventional lines. The overall system risk can be disaggregated into direct and indirect dimensions. Direct risk includes equipment damage, repair and maintenance costs, and expenses related to rebuilding or replacing lines. Indirect risk involves the socioeconomic impact of power interruptions, such as reduced industrial output and compromised public services. In assessing these factors, it is important to account for the transmission voltage level, load capacity, criticality within the network topology, and load characteristics (e.g., industrial vs. residential).
In the present study, the simulated power grid topology is abstracted as a simplified non-meshed structure, wherein transmission lines are treated as independently operating components within a homogeneous network. This approach enables tractable analysis of system-level risk patterns while avoiding the computational overhead of solving full power flow equations. Load redistribution mechanisms following line failures are not explicitly modeled, as the primary focus is to assess how line-level failure probabilities, especially those associated with high-capacity UHV lines, scale up to influence overall system vulnerability. This structural simplification facilitates comparative analysis across different grid compositions and preserves analytical clarity. Future extensions of the model may incorporate more realistic topological features—such as meshed connections, regional subnetworks, or dynamic load balancing—to improve fidelity in simulating cascading failures.
Because UHV transmission lines typically carry much higher loads than conventional lines, their failures can impose disproportionately greater impacts on the system. Consequently, particular attention must be paid to fault probability and risk contributions in high-voltage scenarios. Several unique features of UHV lines stand out. First, their role in inter-regional power transfer means that any single UHV line can bear a load far exceeding that of ordinary lines. When such lines fail under icing conditions, the scale of the ensuing power outage and economic losses can be substantial. Additionally, UHV lines typically span complex terrain with highly variable meteorological conditions, increasing both the probability and unpredictability of icing events. Repair costs and timescales for UHV lines are also generally higher, amplifying the duration and impact of the risk.
Based on the above considerations, this study proposes a comprehensive system risk assessment model (Equation 2):
Where Rtotal denotes the total risk of the power grid, Pfault,i is the fault probability for line i (as derived in Section 3.1), and Li represents the load served by line i. The variable n is the total number of lines in the system.
This formulation captures how faults on different lines can produce varied system impacts, particularly by factoring in load size to reflect scaling effects. The model can be extended by introducing weight coefficients to reflect each line’s importance within the network, enabling planners to evaluate different icing protection schemes, optimize grid structures and line configurations, and develop differentiated maintenance strategies.
In this study, the fault sensitivity coefficient λ is introduced as a tunable parameter that modulates the probabilistic relationship between ice thickness and line failure probability. The values of λ (ranging from 0.05 to 1.0) are selected to represent a continuum from structurally robust systems (low sensitivity) to highly vulnerable configurations (high sensitivity). Although λ is not directly derived from physical measurements, it serves as a proxy for multiple physical and design characteristics of transmission lines, such as conductor type, span length, mechanical load capacity, and historical reliability performance. As such, users of the model can calibrate λ based on empirical observations, laboratory tests, or known design standards of the transmission infrastructure in a given region. For example, lower λ values may be used for newly reinforced UHV lines with superior load margins, while older or minimally maintained segments may correspond to higher λ values.
Additionally, the use of a Poisson-based fault model is motivated by its simplicity and suitability for rare-event modeling in engineering systems. While alternative models such as the Weibull or exponential failure distributions may be applicable in specific contexts, the current formulation prioritizes transparency and generalizability. Future extensions could incorporate component-specific failure curves or non-Poisson processes if sufficient empirical data are available.
3 Results
3.1 Simulation method and procedure
To quantify the combined effects of ice thickness and high-capacity transmission line proportion on operational power grid risks, Monte Carlo simulation techniques were employed. This methodology generates numerous randomized samples representing potential ice thickness distributions. By integrating these samples with transmission line load profiles, the approach enables quantification of both line failure probabilities and aggregate system risk. Monte Carlo simulation is particularly advantageous for analyzing scenarios characterized by substantial uncertainty and variability, such as unpredictable ice formation patterns and fluctuating transmission line loads. By accounting for a broad range of possible icing scenarios and combining them with specific load distributions, the model provides a comprehensive estimate of failure probabilities and total risk.
All simulations are performed within a Python-based scientific computing environment. Specifically, 10,000 ice thickness samples are generated uniformly between 0 and 55 mm, encompassing conditions from no icing to severe icing to ensure the inclusiveness of the risk assessment. Based on these samples, line fault probabilities are calculated using a prescribed fault sensitivity coefficient (λ) and the critical ice thickness (Hcrit), where Hcrit is set to 10 mm, 20 mm, or 30 mm to represent light, medium, and heavy icing zones, respectively, and λ takes values of 0.05, 0.1, and 0.2 to reflect the broad spectrum of lines ranging from highly ice-resistant to more vulnerable.
In addition, different line load demands are incorporated to examine their impact on total risk. Conventional lines are assumed to follow a normal distribution N (20,52) MW, which reflects standard capacities with relatively stable fluctuations. By contrast, high-capacity lines follow N (800,1002) MW, mirroring the substantially higher design capacity of ultra-high-voltage (UHV) lines and the potential for significant load variations. The proportion of such high-capacity lines is set at 0%, 10%, 25%, and 50%, thereby simulating a range of network configurations from entirely conventional to predominantly high-capacity. Through this arrangement, the model systematically evaluates how increasing the share of high-capacity lines can shift the risk profile under different icing scenarios.
In this study, ice thickness is assumed to follow a uniform distribution, and line load demand is modeled using a normal distribution with fixed mean and standard deviation. These distributional choices are not only computationally tractable but also serve as a foundational structure for broader model expansion. The uniform distribution allows for equal representation across all ice thickness values, providing a neutral baseline that supports subsequent sensitivity analysis and modular adjustments. Similarly, the normal distribution for load demand reflects typical assumptions in power system planning and serves as a stable reference for incorporating more complex demand models. While alternative distributions such as Weibull (for environmental variables) or log-normal (for heavy-tailed events) may enhance realism in targeted applications, the current framework is intentionally simplified to facilitate extensibility and comparative analysis. Future studies can readily embed alternative statistical structures within this base model to test scenario-specific assumptions and examine their effects on risk projections.
3.2 Data sources and assumptions
To systematically assess the influence of icing disasters on transmission line operational risk, as well as to capture fault characteristics under diverse meteorological and load conditions, this study draws on the theoretical framework outlined in the Standard for Design of Tall Structures (GB 50135-2019), a national engineering code issued by the Ministry of Housing and Urban-Rural Development of China, and supplements it with representative power grid parameters.
First, the selection of critical ice thickness values (Hcrit = 10 mm, 20 mm, 30 mm) is informed by the Standard for Design of Tall Structures (GB 50135-2019), a national engineering code issued by the Ministry of Housing and Urban-Rural Development of China. This standard recommends using long-term observational data at a height of 10 m above ground, along with recurrence interval analysis, to define icing severity zones. Where direct data are unavailable, field surveys or empirical reference values are used, including 5–10 mm (light icing), 15–20 mm (moderate icing), and 20–50 mm (heavy icing). The selected values in this study correspond to this classification and are intended to represent a gradual progression from low-risk to high-risk scenarios. Although the standard originates from China, its zonal methodology is consistent with international practices for environmental load modeling and has broad applicability to power system design under icing conditions. For the fault sensitivity coefficient λ, values ranging from 0.05 to 1.0 are chosen to reflect different structural tolerances found in transmission networks with varying conductor types, spans, and design specifications. These settings enable structured simulation across a wide range of conditions, and the framework can be further adapted using region-specific empirical data without altering its core inference logic.
Second, parameters for both conventional and UHV transmission lines are derived from publicly available data on select lines in regions such as Harbin, Changsha, and Xi’an, and adjusted to reflect maximum load conditions. Specifically, conventional line loads are assumed to follow the normal distribution N (20,52) MW, whose mean represents a typical load capacity, and whose standard deviation accounts for operational fluctuations. UHV lines, by contrast, are modeled with N (800,1002) MW, reflecting a marked increase in design capacity and the inherent variability of large-scale power transfer. These assumptions allow the simulation to span a diverse array of line types and to examine in detail how different proportions of high-capacity lines alter overall risk.
Finally, to fully capture the effect of shifting proportions of high-capacity lines on system vulnerability, the share of UHV lines is set to 0%, 10%, 25%, and 50%. In this way, the study encompasses scenarios ranging from exclusive reliance on conventional lines to grids dominated by UHV lines. By analyzing fault probabilities and total system risk across varying ice thicknesses, the study sheds light on the extent to which different technological configurations can modulate overall risk levels, and it offers insights for refining grid designs to mitigate the potential impacts of severe icing events.
3.3 Fault probability model analysis
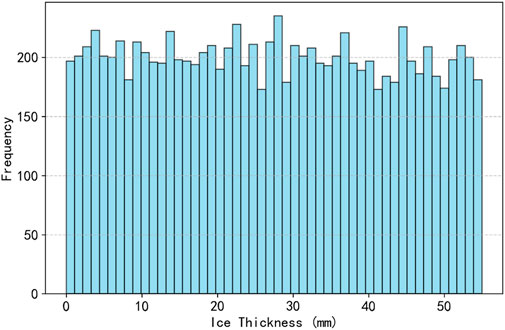
The 10,000 Monte Carlo-generated ice-thickness samples in this study span a range from 0 to 54.98 mm and are drawn from an approximately uniform distribution. As shown in Figure 1, the histogram reflects minor fluctuations in bin heights due to random sampling noise rather than true differences in underlying probability. Since the simulation inputs are generated through stochastic sampling without imposed weighting, the histogram serves primarily to confirm coverage across the full domain of possible icing conditions. The apparent unevenness is a natural artifact of random variation and does not contradict the uniform sampling assumption.
3.3.1 Impact of critical ice thickness Hcrit
A series of simulations were conducted under the assumption of a fixed fault sensitivity coefficient λ = 0.1. The critical ice thickness Hcrit was set to 0, 10, 20, and 30 mm to examine how lines would fail under different icing scenarios. Figure 2 illustrates that line fault rates increase along with ice thickness. When Hcrit = 10 mm, the fault probability begins rising rapidly once the thickness exceeds 10 mm; by contrast, with Hcrit = 20 mm, the fault-probability curve is shifted to the right, indicating higher ice tolerance, and at Hcrit = 30 mm, the system demonstrates the strongest tolerance among the four groups. Relative to the reference case of Hcrit = 0, the introduction of a nonzero critical ice thickness provides a meaningful parameter that reflects each line’s capability to withstand icing loads.
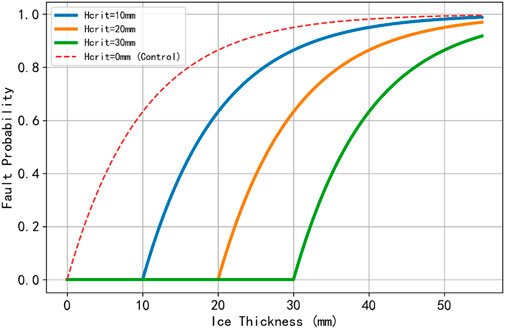
Figure 2. Line Failure Rate vs. Ice Thickness for Different Critical Ice Thickness (Hcrit) values (λ = 0.1).
3.3.2 Impact of fault sensitivity coefficient λ
Simulations were then carried out by fixing Hcrit = 20 mm—representing the boundary between medium and heavy icing—and allowing λ o take values of 0.05, 0.1, 0.2, or 1. The results in Figure 3 show that the larger the λ value, the more quickly the fault probability escalates once the ice thickness surpasses the critical threshold. An unrealistically high sensitivity is observed at λ = 1, while λ = 0.2 produces the steepest increase in fault probability in a realistic context. By contrast, a value of λ = 0.05 leads to the slowest increase, indicating that selecting involves λ balancing the conservatism of the system design against the risk of underestimating potential failures.
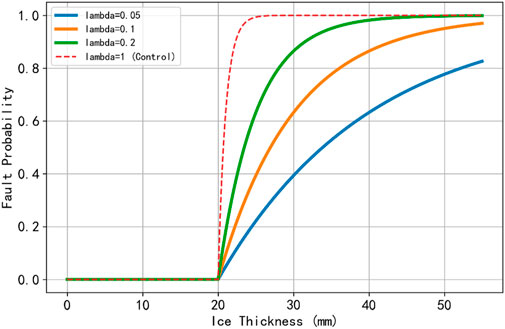
Figure 3. Line Failure Rate vs. Ice Thickness for Different Fault Sensitivity Coefficients (λ) (Hcrit = 20 mm).
3.4 System risk assessment
3.4.1 Impact of critical ice thickness and fault sensitivity coefficient
Further scenario-based simulations were conducted to evaluate how Hcrit and λ jointly affect total system risk. In these simulations, the grid was represented by 300 lines whose individual load demands were modeled by a normal distribution N (20,52) MW, with a mean of 20 MW and a standard deviation of 5 MW. Figures 4, 5 illustrate that changes in Hcrit and λ influence total system risk in a manner similar to their impact on single-line fault rates, confirming that higher ice tolerance and lower fault sensitivity both help mitigate overall system vulnerability.
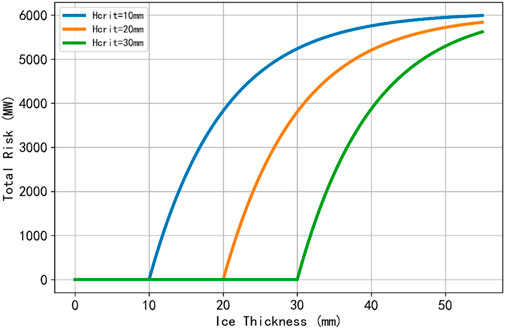
Figure 4. Line Failure Rate vs. Ice Thickness for Different Critical Ice Thickness (Hcrit) Values (λ = 0.1).
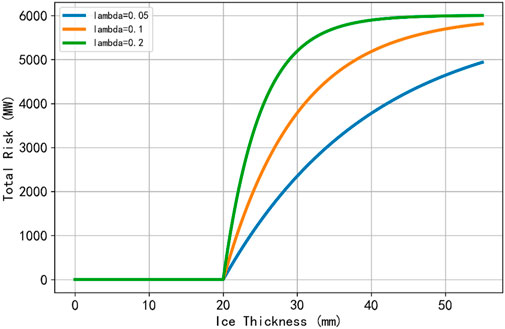
Figure 5. Line Failure Rate vs. Ice Thickness for Different Fault Sensitivity Coefficients (λ) (Hcrit = 20 mm).
3.4.2 Impact of line scale on total system risk
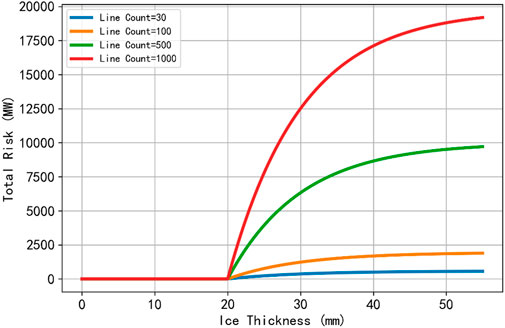
To examine how network size influences cumulative risk, simulations were performed at Hcrit = 20 mm and λ = 0.1, with total line counts set to 30, 100, 500, and 1,000. As shown in Figure 6, the maximum risk is approximately 800 MW when 30 lines are present, but escalates to nearly 20,000 MW for 1,000 lines, confirming a positive correlation between the number of lines and total risk exposure. Larger systems not only accumulate more risk but also exhibit a steeper slope in the risk curve, indicating a nonlinear risk-growth effect as network size increases.
3.4.3 Impact of the proportion of ultra-high voltage (UHV) lines
Ultra-high voltage transmission lines are designed to carry significantly higher loads, often in excess of 500–1000 MW per line, and typically span long distances with complex meteorological conditions that may encompass multiple icing regions. To investigate how different UHV line proportions affect overall system risk, this study considered scenarios where the percentage of UHV lines in the network was set to 0%, 10%, 25%, or 50%. In these high-capacity scenarios, conventional lines followed N (20,52) MW, whereas UHV lines followed N (800,1002) MW. For each of the four UHV-percentage scenarios, 10,000 load-demand samples were generated per line type, and Figure 7 depicts the distribution of load values in these settings.
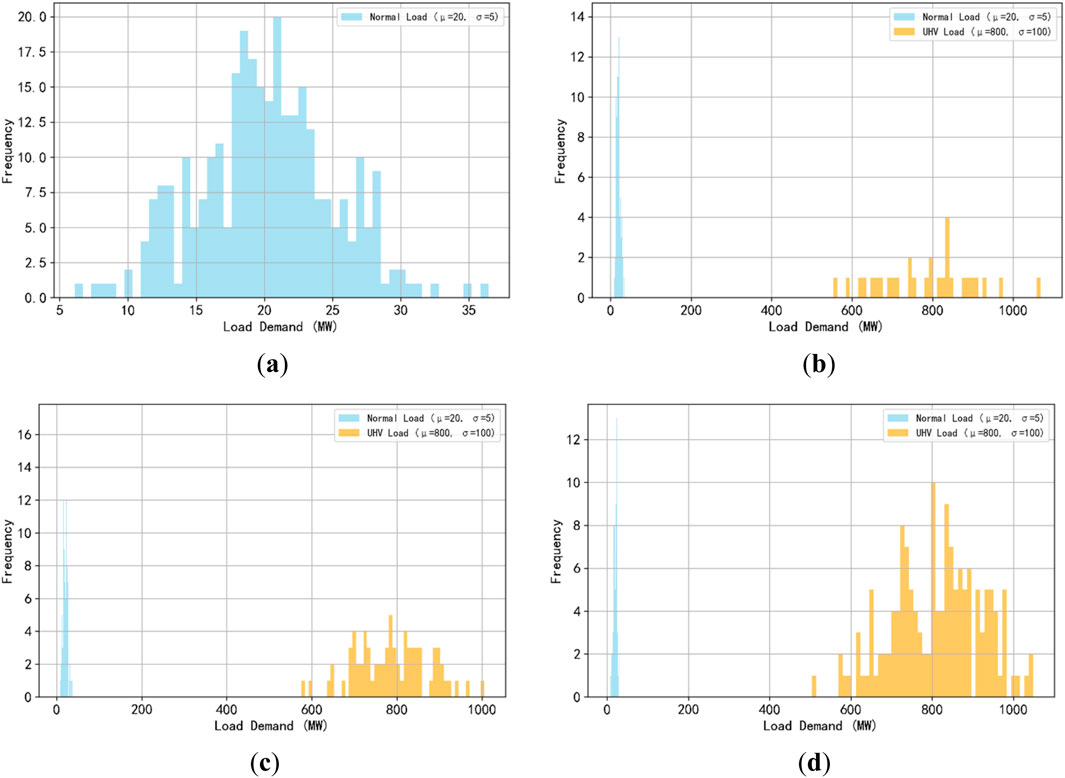
Figure 7. Sample Line Load Distributions under Varying UHV Transmission Shares (Hcrit = 20 mm, λ = 0.1). (a) UHV Line Proportion = 0%. (b) UHV Line Proportion = 10%. (c) UHV Line Proportion = 25%. (d) UHV Line Proportion = 50%.
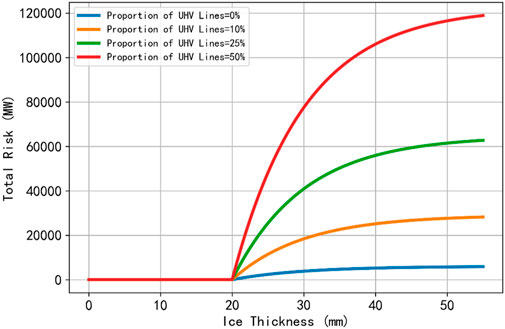
Figure 8 illustrates that the total system risk increases substantially with rising UHV-line share, reaching up to 120,000 MW at a 50% UHV proportion—more than 15 times higher than the risk associated with systems composed entirely of conventional lines. This result indicates that high-capacity lines, which inherently carry larger loads, contribute more significantly to overall system vulnerability, underscoring the need for tailored risk-mitigation strategies in UHV-rich power grids.
4 Conclusion
This study establishes a probabilistic-inference-based risk assessment framework for power grid icing disasters, systematically quantifying the influence of ice thickness on operational security and reliability. Using Monte Carlo simulations, the research models the probability of grid failures and the evolution of overall risk under various icing conditions, thereby illuminating potential vulnerabilities and offering a scientific foundation for disaster prevention and risk management in power systems.
A core contribution lies in using a Poisson-process-based probabilistic inference model to characterize the nonlinear relationship between ice thickness and transmission line failures. Simulation results show that once ice thickness exceeds a particular critical value, the pr obability of line failure increases sharply. Results indicate that the critical ice thickness parameter serves as an effective indicator of a grid’s resilience to icing conditions, providing quantifiable metrics for system vulnerability assessment.
The risk assessment model incorporates both transmission line load requirements and system reliability criteria. Analysis of different transmission line types (e.g., high-voltage versus low-voltage) and their respective load distributions reveals that heavily loaded lines, particularly ultra-high-voltage (UHV) lines, constitute critical vulnerability points during severe icing conditions. Monte Carlo simulations enabled detailed analysis of fault development across diverse ice thickness scenarios. This approach provides a multidimensional and quantitatively grounded framework for assessing grid risks. Results suggest that the critical ice thickness Hcrit value effectively represents the impact of icing intensity on the grid, thereby guiding defense strategies against icing disasters. Meanwhile, larger values of the fault sensitivity coefficient λ lead to faster increases in failure rates, particularly as ice thickness approaches the critical level. Choosing λ thus requires a pragmatic balance between system safety and economic feasibility; excessively small values may underestimate system risk, while overly large ones may produce unduly conservative designs.
5 Limitations and future work
At the system level, the study examines how grid size and the proportion of UHV lines affect total risk. Simulations indicate a nonlinear surge in overall system risk with rising line counts, and the slope of the risk curve becomes steeper in larger grids, reflecting a cumulative effect of increased potential failure points. Further analyses of UHV line proportions demonstrate that the high load demands of these lines significantly elevate system-wide risk. Specifically, when the share of UHV lines reaches 50%, the maximum risk is more than 15 times that of a grid composed exclusively of conventional lines, underscoring that high-capacity lines can be principal contributors to system vulnerabilities. Consequently, large-scale grid expansions must fully account for icing threats, implementing targeted mitigation measures to reduce the likelihood of widespread failures.
While the proposed probabilistic inference model is validated through extensive Monte Carlo simulations, it has not yet been calibrated against empirical failure data from real-world grid icing incidents. Nevertheless, historical events such as the 2008 South China ice storm and the 2021 Texas freeze illustrate the severity and cascading nature of icing-induced failures, highlighting the importance of robust and scenario-adaptive risk assessment frameworks. Future work will seek to incorporate observational datasets from such events to further enhance the model’s realism and practical applicability.
Although this study’s probabilistic inference method for evaluating grid icing risk has yielded promising insights, certain limitations persist. First, the meteorological parameters and model assumptions rest on restricted datasets and simplified estimates that may not encompass the multifaceted weather conditions encountered in real-world power systems—such as transitions between snow and ice or extreme wind speeds—that could further exacerbate failures. Second, the Monte Carlo simulations primarily consider line load demands and ice thickness; other influential factors, such as coupling effects among lines and power dispatch strategies, are not explored in depth. Future research may address these gaps by integrating more granular meteorological data and dynamic simulation methods, thereby refining and extending the proposed risk assessment model for power grid icing disasters.
While this study focuses on estimating failure probabilities and cumulative system risk under icing scenarios, it does not incorporate restoration time, repair resource constraints, or redundancy mechanisms. These factors are known to influence both the duration and severity of power outages, particularly in large-scale or high-voltage transmission systems. Incorporating repair and restoration dynamics—such as time-dependent recovery functions, logistical delays, or component redundancy—would allow future models to more accurately capture the temporal evolution of risk and system resilience. Such integration could further support operational planning by distinguishing between transient disruptions and sustained systemic failures.
Data availability statement
The original contributions presented in the study are included in the article/supplementary material, further inquiries can be directed to the corresponding author.
Author contributions
HL: Writing – original draft, Validation, Formal Analysis, Conceptualization, Methodology. PH: Writing – original draft, Methodology, Visualization, Software, Formal Analysis, Validation. ZL: Funding acquisition, Writing – review and editing, Resources, Project administration, Conceptualization, Supervision. JL: Data curation, Validation, Software, Writing – original draft. ZL: Investigation, Writing – review and editing. JJ: Data curation, Writing – review and editing, Investigation.
Funding
The author(s) declare that financial support was received for the research and/or publication of this article. This research was funded by the Science and Technology Project (52051K240007) of State Grid Shanxi Electric Power Company.
Conflict of interest
Authors HL, PH, ZqL, JL, ZyL, and JJ were employed by State Grid UHV Transmission Co. of SEPC.
The authors declare that this study received funding from State Grid Shanxi Electric Power Company. The funder had the following involvement in the study: project guidance and review throughout the research process.
Generative AI statement
The author(s) declare that no Generative AI was used in the creation of this manuscript.
Publisher’s note
All claims expressed in this article are solely those of the authors and do not necessarily represent those of their affiliated organizations, or those of the publisher, the editors and the reviewers. Any product that may be evaluated in this article, or claim that may be made by its manufacturer, is not guaranteed or endorsed by the publisher.
References
Bai, X., Lv, J., Cai, D., Shen, Y., Wan, Y., and Hou, H. (2023). “Comparative differences of physical mechanism model and data-driven model on overhead transmission line icing thickness prediction,” in 2023 IEEE Sustainable Power and Energy Conference (iSPEC), Chongqing, China, 25 January 2024 (IEEE), 1–6.
Busby, J. W., Baker, K., Bazilian, M. D., Gilbert, A. Q., Grubert, E., Rai, V., et al. (2021). Cascading risks: understanding the 2021 winter blackout in Texas. Energy Res. and Soc. Sci. 77, 102106. doi:10.1016/j.erss.2021.102106
Chaîné, P. M., Service, C. A. E., and Castonguay, G. (1974). New approach to radial ice thickness concept applied to bundle-like conductors. Environment Canada. Atmos. Environ.
Farzaneh, M., and Savadjiev, K. (2005). Statistical analysis of field data for precipitation icing accretion on overhead power lines. IEEE Trans. Power Deliv. 20, 1080–1087. doi:10.1109/tpwrd.2004.838518
Han, S., Li, D., Li, K., Wu, H., Gao, Y., Zhang, Y., et al. (2024). Analysis and study of transmission line icing based on grey correlation Pearson combinatorial optimization support vector machine. Measurement 236, 115086. doi:10.1016/j.measurement.2024.115086
Han, X., Wang, J., Xing, B., Jiang, X., and Dong, S. (2022). Collision characteristics of water droplets in icing process of insulators. Electr. Power Syst. Res. 212, 108663. doi:10.1016/j.epsr.2022.108663
He, S., Song, Y., Huang, H., He, Y., Zhou, S., and Gao, Z. (2024). Meteorological characteristics of a continuous ice-covered event on ultra-high voltage transmission lines in yunnan region in 2021. Atmosphere 15, 389. doi:10.3390/atmos15040389
Hu, J., Sun, C., Jiang, X., Zhang, Z., and Shu, L. (2007). Flashover performance of pre-contaminated and ice-covered composite insulators to be used in 1000 kV UHV AC transmission lines. IEEE Trans. Dielectr. Electr. Insulation 14, 1347–1356. doi:10.1109/tdei.2007.4401217
Huang, X., and Li, J. (2012). “Icing thickness prediction model using BP Neural Network,” in 2012 IEEE International Conference on Condition Monitoring and Diagnosis, Bali, Indonesia, 23-27 September 2012 (IEEE), 758–760.
Huang, Y., Chen, Y., Yang, X., Yang, Z., Ouyang, Z., Jiang, X., et al. (2025). Study on icing characteristics of bundled conductor of transmission line based on shadowing effect analysis. Cold Regions Sci. Technol. 231, 104393. doi:10.1016/j.coldregions.2024.104393
Huang, Y., Jiang, X., and Virk, M. S. (2021). Ice accretion study of FXBW4-220 transmission line composite insulators and anti-icing geometry optimization. Electr. Power Syst. Res. 194, 107089. doi:10.1016/j.epsr.2021.107089
Hui, H. (2012). Modeling for multi-factor risk assessment on ice disaster of power system. Power Syst. Technol. doi:10.13335/j.1000-3673.pst.2012.05.007
Jafari, M. A., and Baghal, S. R. (2022). Estimation of reduction factors for combined wind and ice loading of power transmission lines using multivariate scenario sampling. J. Wind Eng. Industrial Aerodynamics 226, 105045. doi:10.1016/j.jweia.2022.105045
Johansson, J., Hassel, H., and Zio, E. (2013). Reliability and vulnerability analyses of critical infrastructures: comparing two approaches in the context of power systems. Reliab. Eng. and Syst. Saf. 120, 27–38. doi:10.1016/j.ress.2013.02.027
Li, J., Wang, B., Sun, J., Wang, S., Zhang, X., and Fu, X. (2021a). Collapse analysis of a transmission tower-line system induced by ice shedding. Front. Phys. 9, 9–2021. doi:10.3389/fphy.2021.712161
Li, M., Darestani, Y., Dai, Q., and Ma, Y. (2024). Parametrized fragility, failure analysis and cost-effectively strengthening of electrical power distribution system under ice and concurrent wind hazards. Struct. Infrastructure Eng., 1–18. doi:10.1080/15732479.2024.2426047
Li, W., Su, B., Guo, X., Dang, Z., Liu, X., Wang, J., et al. (2024). “Poisson process-based risk assessment of successive failures in power system under ice storms,” in 2024 4th International Conference on Energy Engineering and Power Systems (EEPS), Hangzhou, China, 25 December 2024 (IEEE), 528–532.
Li, X., Zhang, X., Liu, J., and Hu, J. (2021b). Prediction of transmission line icing thickness applying AMPSO-BP neural network model. Electr. Power Constr. 42, 140–146. doi:10.12204/j.issn.1000-7229.2021.09.015
Liao, Y., and Duan, L. (2010). Study on estimation model of wire icing thickness in Hunan Province. Trans. Atmos. Sci. 33, 395–400. doi:10.13878/j.cnki.dqkxxb.2010.04.016
Liu, J., Xu, Z., Fan, W., Wang, Y., and Mo, W. (2022). Numerical simulation of transmission LineIcing based on computational fluid dynamics. J. Phys. Conf. Ser. 2378, 012070. doi:10.1088/1742-6596/2378/1/012070
Meng, X., Wang, L., Hou, L., Fu, G., Sun, B., MacAlpine, M., et al. (2011). Dynamic characteristic of ice-shedding on UHV overhead transmission lines. Cold Regions Sci. Technol. 66, 44–52. doi:10.1016/j.coldregions.2011.01.005
Ministry of Civil Affairs of the People's Republic of China (2008). Statistical bulletin on the development of Civil Affairs. Available online at: https://www.mca.gov.cn/n156/n189/c93362/content.html (Accessed May 29, 2025).
Pescarin, L., and Salomoni, V. A. (2022). “Instability effects due to wind and snow combinations on transmission line systems,” in In Proceedings of the 2022 World Congress on Advances in Civil, Environmental, and Materials Research (ACEM22), Seoul, Korea, August 16-19 2022.
Poots, G., and Makkonen, L. (2000). Models for the growth of rime, glaze, icicles and wet snow on structures. Philosophical Trans. R. Soc. Lond. Ser. A Math. Phys. Eng. Sci. 358, 2913–2939. doi:10.1098/rsta.2000.0690
Tan, L., Liu, Y., Yuan, Z., and Li, R. (2024). Linear modeling analysis of the heat balance of the transmission line in high frequency critical ice melting state. Int. J. Low-Carbon Technol. 19, 508–516. doi:10.1093/ijlct/ctad134
Wang, L., He, Y., He, Y., Zhou, Y., and Zhao, Q. (2024). Wind turbine blade icing risk assessment considering power output predictions based on SCSO-IFCM clustering algorithm. Renew. Energy 223, 119969. doi:10.1016/j.renene.2024.119969
Wang, Y., Wang, Y., Zhang, S., Zhang, Z., and Wang, L. (2024). Field natural experimental study of ice growth characteristics of split conductor and single conductor on hybrid freezing icing. J. Phys. Conf. Ser. 2785, 012138. doi:10.1088/1742-6596/2785/1/012138
Xie, Y., Huang, L., Wang, D., Ding, H., and Yin, X. (2019). Modeling and analysis of progressive ice shedding along a transmission line during thermal de-icing. Math. Problems Eng. 2019, 4851235. doi:10.1155/2019/4851235
Yang, F., Yang, J., and Zhang, Z. (2012). Unbalanced tension analysis of tangent towers for UHV transmission lines located at heavy icing area. Power Syst. Technol. 36, 234–240. doi:10.13335/j.1000-3673.pst.2012.03.041
Yang, G., Jiang, X., Liao, Y., Li, T., Deng, Y., Wang, M., et al. (2023). Research on load transfer melt-icing technology of transmission lines: its critical melt-icing thickness and experimental validation. Electr. Power Syst. Res. 221, 109409. doi:10.1016/j.epsr.2023.109409
Yin, F., Farzaneh, M., and Jiang, X. (2016). Laboratory investigation of AC corona loss and corona onset voltage on a conductor under icing conditions. IEEE Trans. Dielectr. Electr. Insulation 23, 1862–1871. doi:10.1109/tdei.2016.005626
Zhang, N., Chen, J., Gao, C., Tan, X., and Wang, Y. (2024a). Transmission line ice disaster early warning method based on ice thickness prediction using GM(1, 6) model. IEEE Access 12, 162412–162419. doi:10.1109/access.2023.3262794
Zhang, Y., Huang, H., Zou, D., Wu, J., Zhang, L., and Lv, Q. (2024b). “Research on the construction method of digital twin model for transmission line icing,” in Fourth international conference on mechanical, electronics, and electrical and automation control (METMS 2024) (Bellingham, WA: SPIE (The International Society for Optics and Photonics)), 1071–1077.
Zhang, Z., Liu, J., and Jia, B. (2022). Risk assessment of the iced transmission line galloping based on fuzzy and cluster algorithms. J. Comput. Methods Sci. Eng. 22, 1413–1432. doi:10.3233/jcm-226170
Keywords: power grid icing, probabilistic inference, risk assessment, Monte Carlo simulation, ultra-high voltage lines, system vulnerability
Citation: Liu H, He P, Lu Z, Li J, Lu Z and Jia J (2025) Research on probabilistic inference methods for power grid icing risk assessment: a systematic analysis incorporating ultra-high voltage line ratios. Front. Energy Res. 13:1618421. doi: 10.3389/fenrg.2025.1618421
Received: 26 April 2025; Accepted: 07 July 2025;
Published: 21 July 2025.
Edited by:
Shuai Lu, Southeast University, ChinaReviewed by:
Mohd Shihabudin Ismail, Universiti Malaysia Perlis, MalaysiaMiaomiao Li, WSP, United States
Copyright © 2025 Liu, He, Lu, Li, Lu and Jia. This is an open-access article distributed under the terms of the Creative Commons Attribution License (CC BY). The use, distribution or reproduction in other forums is permitted, provided the original author(s) and the copyright owner(s) are credited and that the original publication in this journal is cited, in accordance with accepted academic practice. No use, distribution or reproduction is permitted which does not comply with these terms.
*Correspondence: Ziqiang Lu, aGFvMjAxN0AxNjMuY29t
 Huiwei Liu
 Ziqiang Lu