 Adrian Borlestean
 Paul C. Frost
 Dennis L. Murray
- Department of Biology, Trent University, Peterborough, ON, Canada
Population density regulation is a fundamental principle in ecology, but the specific process underlying functional expression of density dependence remains to be fully elucidated. One view contends that patterns of density dependence are largely fixed across a species irrespective of environmental conditions, whereas another is that the strength and expression of density dependence are fundamentally variable depending on the nature of exogenous or endogenous constraints acting on the population. We conducted a study investigating the expression of density dependence in Chlamydomonas spp. grown under a gradient from low to high nutrient density. We predicted that the relationship between per capita growth rate (pgr) and population density would vary from concave up to concave down as nutrient density became less limiting and populations experienced weaker density regulation. Contrary to prediction, we found that the relationship between pgr and density became increasingly concave-up as nutrient levels increased. We also found that variation in pgr increased, and pgr levels reached higher maxima, in nutrient-limited environments. Most likely, these results are attributable to population growth suppression in environments with high intraspecific competition due to limited nutrient resources. Our results suggest that density regulation is strongly variable depending on exogenous and endogenous processes acting on the population, implying that expression of density dependence depends extensively on local conditions. Additional experimental work should reveal the mechanisms influencing how the expression of density dependence varies across populations through space and time.
Introduction
It is well-understood that natural populations are limited by both exogenous (e.g., climate) and endogenous (e.g., predation, competition) processes, and that these forces can have profound impacts on population growth and stability. Exogenous processes are density-independent in that they do not return a population to a stable equilibrium but rather act by adding variability in the population trajectory, whereas endogenous processes are density-dependent and promote reduced growth and numerical stationarity around an equilibrium population size (Sinclair, 1989; Krebs, 1995b; Sinclair et al., 2006). Density dependence is a well-known process affecting virtually all natural populations, but there is considerable variability across species and systems in how this process acts to constrain growth and how this translates to changes in abundance (Sæther and Engen, 2002; Sibly et al., 2005; Ross, 2009). For example, some populations experience strong density-dependent regulation at low numbers such that population growth is constrained well in advance of reaching a stable equilibrium (carrying capacity), whereas in others the full effects of density dependence are not manifest until the population is resource-limited and closer to its carrying capacity (Sibly et al., 2005). Sometimes there is a direct and immediate relationship between population size and its density-dependent constraints; in others the response is time-delayed (Turchin, 2003). It may even be possible that individual populations experience variable density-dependent constraints depending on local conditions affecting growth rates or carrying capacity (Sæther and Engen, 2002; Murray et al., 2010). It follows that these variable scenarios highlight the challenges associated with quantifying density dependence in natural populations, and the uncertainty in our understanding of precisely how density dependence acts to regulate growth across populations; this uncertainty parallels the noted confusion and inconsistency in the use of nomenclature surrounding density dependence (Herrando-Pérez and Delean, 2012). Accordingly, these collective shortcomings limit our ability to fully predict how natural populations are regulated as well as their likely responses to perturbation (Sinclair, 1989; Krebs, 1995a).
Phenomenological models have been developed for estimating density dependence from population abundance data, with the standard logistic equation being the most commonly-used heuristic (Tsoularis, 2001; Gabriel et al., 2005; Sakanoue, 2007). Yet, the logistic model is limited by the assumption that there is a negative linear relationship between per capita population growth rate (pgr) and population size, without elaborating on an underlying biological reasoning behind this simplifying constraint (Sibly et al., 2005). While alternate population models relax this constraint by making allowance for nonlinearity in the pgr-population size relationship (Tsoularis, 2001; Tsoularis and Wallace, 2002), these modifications are driven perhaps more strongly by a goal to fit models with high precision rather than by first principles governing population dynamics. Indeed, a cogent example is Sibly et al.'s (2005) use of the theta-Logistic model to infer nonlinearity in density dependence across a broad range of animal taxa. In an attempt to fit this model to population time series data, Sibly et al. (2005) assumed implicitly that the expression of density dependence was fixed in a given species and could be summarized by averaging the level of nonlinearity observed in the population growth-population size relationship, across multiple conspecific populations. However, it remains plausible that the manner by which density dependence is expressed is not a species-specific trait but rather that it varies according to population-level circumstances like local resource abundance, growth potential, or other exogenous or endogenous constraints. More generally, this uncertainty highlights our limited perspective on how density dependence may vary through space or time (Sibly et al., 2005), how to appropriately detect density dependence in growing or declining populations (Getz and Lloyd-Smith, 2006; Ross, 2006), and whether density dependence can over-ride or otherwise mask the influence of density-independent processes on population growth (Clark and Brook, 2010). Ultimately, we need a deeper understanding of why and how density dependence is manifested to provide important insight into the complexity of factors associated with population regulation.
Using a unicellular alga (Chlamydomonas spp.) as a model, we examined the extent of variability in density dependence as a function of resource (nutrient) level. Specifically, we used a gradient of 12 nutrient concentrations to determine whether the nature of density dependence differed according to resource level. We predicted that differential resources would alter the expression of density dependence, such that the population growth vs. population size relationship would not be fixed but rather vary according to nutrient level. More specifically, we predicted that at low resource levels pgr would be expressed as a concave up relationship with population size, and that the relationship would gradually transition to concave down, as resources increased. This prediction makes intuitive sense because when per capita resource levels are low, populations should experience accelerated expression of density dependence due to rapid initial growth, which would translate to rapid decline in per capita population growth at low population density (see Figure 1). In contrast, when resources are abundant, the effects of density dependence should be more consistent at higher population density. If density regulation in a given population is plastic based on its environment, then the intensity of density regulation will vary in correspondence with environmental quality. It follows that an increase in resource level should correspond to an increase in time before the effects of density dependence on population growth are readily discerned. Under this scenario, we expected additional nutrients to prolong the onset of population growth rate deceleration from density dependence, again owing to the slower time before resources become strongly limiting (Figure 1). We note that because ours is among the first studies to explicitly test how density dependence varies in a single species across multiple resource levels, we consider that our general findings are helpful not only in terms of establishing a firmer grasp of mechanistic processes underlying population dynamics, but also in broadly elucidating how populations may respond to natural or anthropogenic perturbation.
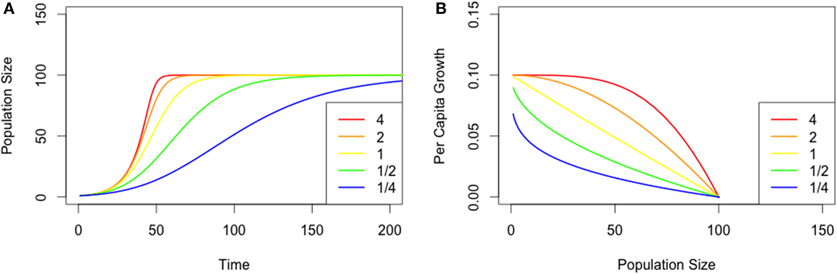
Figure 1. Illustration of the role of resource variability on patterns of (A) abundance, and (B) per capita growth (pgr) in population dynamics. The curves in (B) are defined as concave-up (θ < 1) and concave-down (θ > 1). The legend refers to estimates of parameter θ in the theta-Logistic equation, where population growth is sigmoidal with the inflection point at K/2, and the decline in pgr with population size is linear. Resource levels were arbitrarily chosen for illustrative purposes.
Materials and Methods
Algal Population Growth
We used Chlamydomonas reinhartti (Chlamydomonadaceae), a unicellular green-algae, as our model system for examining density-dependent processes (Renaut et al., 2006). Stock cultures (Canadian Phycological Culture Centre: August 2012) were inoculated into sterile algal medium in a closed system, and cultures were kept in an environmental chamber at 21°C with a 16: 8 h (light: dark) cycle (Harris, 1989; Renaut et al., 2006). Cultures were grown in 2 L Pyrex Erlenmeyer flasks, with tubing extending from aerators and through syringe filters (0.22 μm), which ensured that the system remained sterile for the duration of the experiment (Cunningham and Maas, 1978). To confirm that all cells were at the maximal stage of growth at the outset of the experiment, inoculum was only extracted between 7 and 10 days after the stock culture was initiated. Prior to inoculation, cell density and cell diameter (μm) were recorded from the stock culture to confirm initial concentration, size, and to calculate the initial density (N0 = 1308 cells/ml). Cell diameter is also used to ensure synchrony in cell cycles and provides an indirect measure of cell health. The stock was agitated continuously during inoculation to ensure consistent concentration in each 1 mL sample of algal inoculum.
Algae were grown in standard MPI medium; a mixture designed to propagate consistent growth of phytoplankton (Sterner and Hagemeier, 1993; Kilham et al., 1998). We provided nutrient levels in 12 different concentrations to establish a gradient in resource availability; this was completed by dilution and/or concentration of each nutrient in the formula. We considered 100% MPI as the baseline concentration, and our nutrient gradient ranged from 20% (lowest) to 200% (highest) concentration, with three replicates per individual nutrient level. Each nutrient concentration level was produced individually to guarantee consistency across each replicate. Once neutralized to a pH of 7, each container was autoclaved and subsequently inoculated simultaneously at the onset of the experiment.
Cell concentration and cell dimensions were estimated daily from a culture sample (~1–2 mL) using an automated cell counter (Life Technologies: Grand Island, NY, USA). Cell density counts were verified with a prior standardized analysis against microscope cell density counts (Borlestean, unpublished). The experiment continued until population size stabilized near a carrying capacity, ~15–20 days after inoculation. We considered the occurrence of either 2 consecutive days where the algal population experienced a population loss, or a sequence of 3 days in which population increase and decrease alternated, as an indication that carrying capacity was reached; thereafter any further population estimates were censored. Along with daily counts, cell diameter was employed as an indicator of cell health.
Data Analysis
Theta-Ricker Model
Population growth and density dependence were examined using the theta-Ricker equation;
where N, rmax, and K are the population density, intrinsic rate of population growth, and carrying capacity, respectively (Gilpin and Ayala, 1973). The theta-Ricker model differs from the standard logistic model as a discrete function with explicit consideration of the structure of density dependence, through the estimation of parameter θ (Gilpin and Ayala, 1973; Sibly et al., 2005). Parameter θ accounts for potential curvilinearity in patterns of population growth across population size; functionally, parameter θ can fit a variable inflection point in the logistic growth curve (i.e., a divergence from K/2), depending on the particular form of density dependence (Tsoularis, 2001; Gabriel et al., 2005). Such flexibility is required to evaluate the variability in density dependence across treatments. Parameter θ allows the density feedback within a population to be easily computed. If a population is affected by density dependence at low densities, then density regulation is stronger (θ < 1) and the curvilinear relationship is concave up (Sibly et al., 2005). If density regulation is manifest especially at high density, density regulation will be expressed more gradually (θ > 1) and the population growth-population size relationship will be concave down (Figure 1B) (Sibly et al., 2005). It follows that if parameter θ =1, the theta-Ricker reduces to the more parsimonious Ricker model. Although parameter θ is important for characterizing variability in density dependence, its shortcoming is that it is sensitive to patterns in population growth and variability that emerge during the curve-fitting process (Clark and Brook, 2010). For example, Sibly et al. (2005) fit the theta-Logistic model (i.e., continuous-time version of the theta-Ricker model) to datasets from the Global Population Dynamics Database (GPDD) and found that only 20.6% (n = 3269) of the total sample of population time series could be reliably fit using this approach (Getz and Lloyd-Smith, 2006; Ross, 2006; Clark and Brook, 2010). Notwithstanding this, in a related exercise we used simulations to evaluate the performance of the theta-Logistic model compared to a set of three alternative population growth equations; our results reveal that the theta-Logistic has superior performance across a broad extent of realistic parameter space (Borlestean, unpublished).
Estimating Intrinsic Rate of Growth
There is a recognized lack of independence between the variables within the theta-Logistic equation, more specifically, θ and rmax are highly correlated (Clark and Brook, 2010) and these parameters may be further related to K. It is notable that natural correlation between rmax and parameter θ is an important consideration when seeking to estimate density dependence, owing to the similar dependency on rmax and θ in determining population change (Clark and Brook, 2010). Practically speaking, population growth rate is commonly calculated using the growth rate experienced by a population at a given time, whereas rmax is a theoretical construct that is not realistically achieved in natural environments (Birch, 1948; Caughley and Birch, 1971). This intrinsic growth rate affects the velocity of the population size increase (the steepest slope of the curve) and therefore remains fixed (Caughley and Birch, 1971). Conversely, parameter θ affects the change in velocity due to the size of the population (the inflection point of the curve), which ultimately must be contingent upon resource levels in the environment.
In most qualitative studies, ecologists estimate all variables within population growth equations simultaneously. However, owing to the inherent correlation between rmax and θ, in our study we estimated each parameter separately (Clark and Brook, 2010). Although there lacks a standard method for estimating rmax, we used three different approaches to reach a consensus. First, we estimated rmax from the literature; Grover (1989) used the Monod model to compute the μmax (limnological rmax) of Chlamydomonas as 0.79 (± 0.18, 95% CI); this was among the highest μmax recorded for any algal species (Grover, 1989; Kargi, 2009). Second, we determined the greatest instantaneous per capita increase in population size observed in our study; this value corresponded to 1.70 (log[Nt+1/Nt] = log[6.6 × 10⁵/1.2 × 105]). Third, we used the standard logistic model (i.e., theta-Ricker where θ = 1) to estimate rmax from our data. To account for the variation in rmax estimates between each nutrient treatment, the mean across all treatments was computed as 1.29 (± 0.24, 95% CI) after confirming that the rmax estimate was not closely related to nutrient level (Borlestean, unpublished). Notably, rmax from Method #2 was the largest and produced erratic results by generating large confidence intervals and model non-convergence. Conversely, the rmax converted from Grover (1989) and the one we generated (Method #3) provided qualitatively similar results (Borlestean, unpublished). Hereafter, we focus on results using the rmax from Method #3.
Direct Measure of Density Dependence
The primary metric used to estimate density dependence was the relationship between per capita growth rate and population density. Per capita growth rate (pgr) was computed by calculating the rate of growth (ri) relative to the population size at the given time-step (Sibly et al., 2005; Clark and Brook, 2010). Linear models were examined first to determine whether nutrient concentration affected per capita growth rate as density increased. Next, the theta-Logistic equation was fit to these data via least squares, transforming the discrete data points to continuous format. Estimates of density dependence (θ) were further compared to their respective nutrient concentrations in order to elucidate the relationship between resource limitation and the nature of density dependence.
Indices of Density Dependence
We also used two additional approaches to further characterize the patterns by which density dependence was expressed by our experimental conditions: (1) variability of pgr; and (2) population size at the inflection point of the standard (linear) logistic curve (Ninf). The variability of pgr across a treatment reveals growth rate constancy and can be used to identify highly variable populations with dramatic changes in population growth rate and size. A nonlinear change in the inflection points across treatments would further reveal a departure from the traditional linear relationship of density dependence produced in the standard Ricker model (where θ = 1 and inflection point = K/2). Estimating population size relative to carrying capacity was achieved using the following equation (from Tsoularis, 2001):
where K and θ represent corresponding variables to Equation 1, while Ninf represents the instance when accelerated growth changes to deceleration (inflection point of the sigmoidal growth curve). Comparison of the theta-Logistic inflection to the standard logistic inflection reveals the strength of regulation upon the population's growth rate; with larger values implying lower density-dependent constraints for that population. This metric must be proportional to the population's corresponding carrying capacity, and the resulting ratios help identify the point during the growth phase at which density-dependent regulation begins affecting population growth rate. Finally, to ensure that our analysis did not conflate nonlinearity in density dependence with time-delayed density dependence, using the theta-Logistic model we used AICc weights based on model likelihoods (Burnham and Anderson, 2002) to compare fit for models with no time delay [i.e., Nt−0 (Equation 1, where θ = 1)] versus models with time delays (Nt−1, Nt−2, Nt−3). Here we used population size estimates collected during the initial growth phase (14–18 days) of the experiment to fit a consistent number of observations to our models. All analyses were conducted using R software (R Core Team v3.1.1 2014) (Bolker, 2008; Stevens, 2009).
Results
Populations across our nutrient treatments underwent numerical changes that were characteristic of logistic growth (Figure 2A). Overall, populations reached their maximum size (carrying capacity) more rapidly in resource-limited treatments, and by Day 18 all treatment groups reached our defined endpoint (range 8–18 days, see Figure 2A).
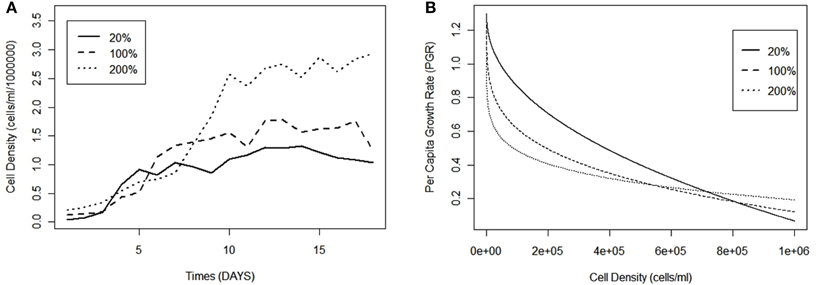
Figure 2. (A) Mean population size for Chlamydomonas grown in variable nutrient concentrations. Mean values per replicate (n = 3) are provided. (B) Fitted theta-Logistic models for Chlamydomonas grown in variable nutrient concentrations.
Cell diameter was consistent through time [F(17,619) = 1.0715, p = 0.37], with mean cell size averaging 6.51 (± 0.31, 95% CI) μm through the duration of the experiment (Table 1). Although cell size varied between treatment groups [F(11,619) = 4.14, p < 0.001], post-hoc tests revealed no correlation between cell size and nutrient level (R2 = 0.002, p = 0.13), however, there was a qualitative increase in cell size variability among the nutrient-limited groups. For example, variance in mean cell size was 1.76 at 20% MPI and 0.43 at 200% MPI. Furthermore, no significant correlation was detected between cell diameter and time (Figure 2A), thereby allowing us to assume that cell health was largely consistent across all treatments, irrespective of nutrients.
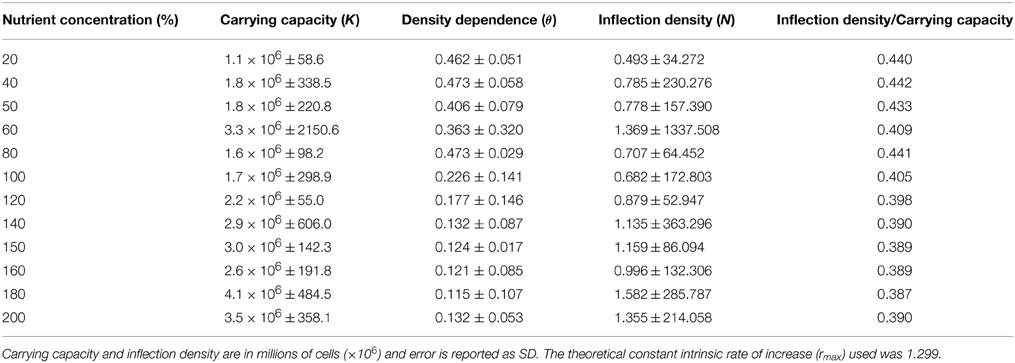
Table 1. Summary statistics for Chlamydomonas across nutrient treatments.
Estimating Carrying Capacity (K)
Nutrient level affected population K [t(11) = 7.697, p < 0.001; R2 = 0.64], with resource limitation reducing the carrying capacity. Therefore, we infer that the nutrient treatment generated a gradient in resource limitation. Overall, we observed a three-fold increase in maximum cell density from the least (20%: 1.16 × 10⁶ cells/ml) to most saturated solution (200%: 3.47 × 10⁶ cells/ml, see Figure 2A). We found a greater variability in the K estimates in the low-nutrient treatments, with the exception of the 20% nutrient level, which exhibited surprisingly low levels of variability in estimated K (Table 1).
Assessment of Density Dependence
Estimated θ revealed that patterns of density dependence across all treatments were concave up, more specifically all values were <1.0 (Table 1). Based on 95% confidence intervals, all θ estimates were significantly <1.0, implying that the relationship between PGR and population density was nonlinear across all treatments. There was a significant relationship between estimated θ and nutrient concentration, but contrary to our prediction as nutrient levels increased, θ decreased and density dependence became proportionally increasingly curvilinear [regression equation: θ = −6.99 × 10⁻⁷(% NUTRIENTS) + 2.50; t(11) = 5.432; p < 0.001; R2 = 0.49]. For example, estimated θ 's ranged from 0.462 (± 0.051) at 20% nutrient concentration, to 0.132 (± 0.053) at the 200% nutrient concentration (Table 1, Figure 3). Accordingly, contrary to what we expected, density dependence shifted from being moderately concave up in low nutrient availability, to being increasingly concave up in high nutrient treatments. Most theta estimates had low variability (i.e., 95% confidence intervals <0.10), with a few treatments (60, 100, and 180%) serving as outliers. Not surprisingly, we also noted a correlation between θ and carrying capacity [regression equation: θ = 2.50 − 6.99 × 10⁻⁷K; t(11) = 5.432; p < 0.001; R2 = 0.49] (Figure 3).
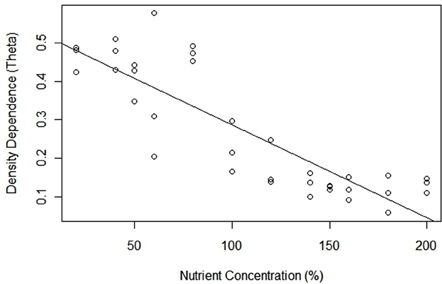
Figure 3. Density dependence curvilinearity (θ) for Chlamydomonas grown in variable nutrient concentrations.
Indirect Measures of Density Dependence
Populations exposed to nutrient limitation experienced higher (and more variable) per capita growth rates compared to those with saturated nutrients. Mean pgr values had a negative correlation with treatment levels [regression equation: pgr= 298 – 538.40[nutrient concentration]; t(11) = 3.666, p < 0.01; R = 0.73], and the range of pgr values decreased from 20% (−0.247 to 1.70) to 200% (−0.355 to 0.548), thereby demonstrating more stable growth in higher nutrient concentration (Figure 4). Furthermore, variance of these mean values follows the same declining trend, decreasing from 0.200 (20%) to 0.027 (200%). The mean pgr for all treatments was 0.166 (± 0.386), and treatment-specific pgrs did not deviate significantly from the mean. For example, the limited (20%), normal (100%), and oversaturated (200%) nutrient levels had mean pgr of 0.188 ± 0.433, 0.136 ± 0.380, and 0.158 ± 0.247, respectively.
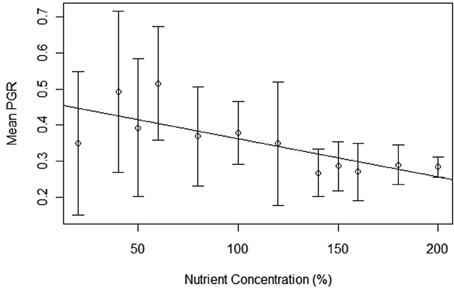
Figure 4. Mean per capita growth rate for Chlamydomonas grown in variable nutrient concentrations, error bars represent variance.
The relationship between pgr and population density became increasingly concave up with decreasing concentration of nutrients. Examining the lowest nutrient concentration (20%) [regression equation: pgr = 0.9241 + (−8.750 × 10⁻⁷)N; t(17) = 5.583; p < 0.001; R2 = 0.65], the baseline (100%) [regression equation: pgr = 0.7812 + (−6.119 × 10⁻⁷)N; t(17) = 5.241; p < 0.001; R2 = 0.62], and the oversaturated treatment (200%) [regression equation: pgr = 0.4168 + (−1.630 × 10⁻⁷)N; t(17) = 3.575; p < 0.01; R2 = 0.42] shows that slopes between pgr and population size approached 0 with a corresponding increase in nutrients (Figure 2B).
We found that decreasing nutrients also exhibited a delay in the time to reach inflection in population growth. It is important to note, however, that this delay seems to be due to reaching carrying capacity while growing at a less regulated pace, rather than a classic expression of delayed density dependence. The theta-Logistic model revealed an inflection point at higher population density (>K/2) compared to the standard logistic model. We found that as nutrient concentration increased, the inflection point in the standard logistic model was reached at proportionally lower population density [regression equation: y = 0.4462 + (−3.401 × 10⁻⁴)x, t(35) = −5.961, p < 0.0001, R2 = 0.76]. Therefore, populations that grow in nutrient rich environments experience density regulation more consistently throughout their logistic growth (Table 2). Note that this variability in inflection point further supports the primary use of the theta-Logistic model (rather than standard logistic model) in fitting our data to models.
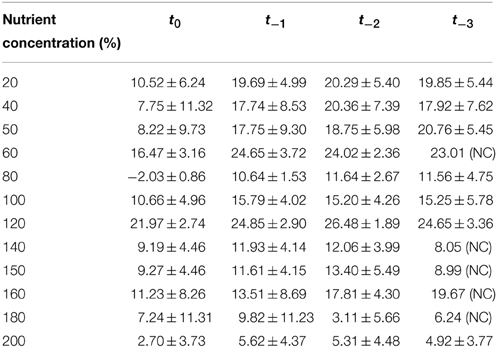
Table 2. Summary of AICc results from a curve-fitting exercise using a range of time-delays (t−0 … tx) in Chlamydomonas populations.
To confirm that that the observed pattern of density dependence in high nutrient treatments was due to fundamental changes in the way that population growth was regulated rather than simply a standard time-delayed density dependent response, we compared theta-Logistic model's fit with forced time delays ranging from 0 to 3 days (t−0 to t−3). For 11 of 12 nutrient levels, model fit was superior for the t = 0 model than for any model including a t > 0 time delay. Mean AICc model weights averaged across all 12 nutrient levels were 0.769 ± 0.181 for t−0, 0.098 ± 0.084 for t−1, 0.089 ± 0.072 for t−2, and 0.104 ± 0.103 for t−3 (Table 2). Therefore, it is evident that the t−0 set of models provided a superior fit to our data, and that the patterns of population regulation at high nutrient concentrations were not attributable to delayed expression of density dependence but rather to more fundamental changes in the nonlinear properties of density dependence.
Discussion
Our experiment, using an algal species as model, sought to disentangle the complex relationship between variation in nutrient availability and expression of density dependence. Overall, we found that algal populations exposed to high nutrient concentrations experienced both higher carrying capacity (K) and accelerated onset of density dependence (θ), resulting in an increasingly concave relationship between population growth and population size (i.e., 1 > θ > 0). Thus, per capita density dependence was generally less constant at higher nutrient levels, which was contrary to our prediction of increased concavity with nutrient concentration in nutrient-limited environments. It follows that there are a number of biological factors that could have contributed to the observed increase in curvilinearity at high nutrient concentration, and because density dependence was not found to be time-delayed due to nutrient variation, observed differences across nutrient treatments likely were associated with fundamental changes in the expression of density dependence. Collectively, our results reveal strong plasticity in the expression of density dependence depending on nutrient availability, meaning that population regulation is influenced by exogenous factors in the environment rather than being largely fixed to a particular species or system.
The mechanisms underlying population regulation, including how and when density dependence affects population growth and abundance, are complex and to date have not been fully elucidated in the ecological literature (Sibly et al., 2005; Krebs, 2008). In particular, one major gap in knowledge concerns the level of variability in the expression of density dependence across environmental conditions. One possibility is that density dependent processes are largely fixed in a given species, such that variability in environmental conditions play a minor role in the timing and intensity of density dependent constraints on population growth (Reynolds and Brassil, 2013). This view has been expressed implicitly in the literature (Sibly et al., 2005; Figure 3; see also Clark and Brook, 2010). In contrast, the alternate view is that expression of density dependence is more dynamic and reflects a suite of environmental conditions that are experienced by a given population. This view is supported mainly by studies examining spatio-temporal variation in density dependence in natural populations (e.g., Sæther and Engen, 2002; Bull and Bonsall, 2008; Murray et al., 2010). However, the current uncertainty surrounding density dependence is related, in part, to the paucity of experimental studies seeking to isolate its influence under strictly controlled conditions, and that much of our understanding is based on phenomenological research seeking to explain patterns of population change using relatively weak datasets and post-hoc approaches (Doncaster, 2006; Getz and Lloyd-Smith, 2006; Peacock and Garshelis, 2006; Ross, 2006). Certainly, it remains challenging to identify the patterns and processes underlying density dependence even under controlled experimental conditions, so the current state of uncertainty is not altogether surprising. Density regulation is difficult to recognize in larger taxa because of the long generation times, strong environmental variability, and the generally high level of noise that arises with wild populations. Conversely, model species such as Chlamydomonas provide the ability to more carefully examine underlying subtle ecological processes in controlled environments and using replicated conditions.
Our work represents an important step in reconciling the uncertainty associated with density dependence expression, by showing that under strict experimental conditions population regulation varies according to nutrients. This finding contradicts the general consensus that population attributes are intrinsic to a species, and thus do not vary across variable resource levels (Sinclair and Krebs, 2002; Sibly and Brown, 2007). Population parameters such as density dependence are often assumed to be variable across populations depending exclusively upon changes in estimated carrying capacity (e.g., γ = rmax/K, see McCallum, 2000) and thus by ignoring other potential sources of variability. In the case of density dependence estimated by parameter γ, the standard assumption is that the relationship between pgr and Nt is linear, which may represent an important oversimplification.
The variation in density dependence observed across the gradient in nutrient concentration means that growth patterns in populations are strongly influenced by local conditions. Yet, our prediction that the per capita growth rate (pgr) population density curve would become concave-down with additional nutrients was not supported. Our findings are surprising in that high nutrient environments generated greater density regulation even at low densities and earlier in the growth phase. The possible explanations for this phenomenon are likely rooted in the physiological responses of individual algal cells to the gradient of nutrient supply provided in each replicate. For example, excessively high nutrient concentrations can be acutely toxic to algae (e.g., Lehman, 1976), which have delayed initial growth during acclimation to these stressful conditions (Cunningham and Maas, 1978). Alternatively, high phosphorus (P) concentrations may have resulted in rapid P uptake and the storage of polyphosphate, and thereby delayed the onset of growth in P-saturated algal cells (Pascual and Caswell, 1997; Xenopoulos et al., 2002). A third possibility is that algal inoculates contained multiple strains that are uniquely suited to different nutrient conditions. A delayed growth response under high nutrient supply may have resulted from the longer time period for a few fast growing cells to replace their slow growing counterparts (Droop, 1974). It is unclear whether we should expect gradual decline in density-dependent constraints on population growth if the above mechanisms were in play.
On the level of population growth, we surmise that the above possibilities could be manifest by divergences in the expression of density dependence in environments where cell numbers are low and nutrient levels are highly limiting. In such environments, populations may simply be unable to grow at levels that would allow expression of density dependence and rather that positive effects of grouping (i.e., Allee effects) shape the patterns of density dependence (Courchamp et al., 1999). Indeed, the observed high variation in density dependence in our low nutrient treatments, as well as those seen more generally in natural systems (Sæther and Engen, 2002; Sibly et al., 2005), indicates that density dependence is strongly affected by exogenous processes. It follows that such processes require further evaluation before they can be satisfactorily described from a purely mechanistic perspective.
Delayed density dependence was absent in our system, with population abundance at t0 being most strongly related to current (t0) rather than later (t−1, t−2, t−3) time lags. This finding further supports that the structural features of density dependence changed patterns of growth regulation rather than were driven by a change in the timing of the expression of density dependence per se. This observation is perhaps surprising in light of the apparent delay in population growth in our highest nutrient treatments, and likely reflects that constraints occurred in the ability for populations to grow effectively when they were below numerical thresholds (i.e., Allee effect), despite abundant resources. Furthermore, the lack of density-related change in cell size implies that density dependence was either not sufficiently strong to constrain cell quality or that the primary avenue by which density feedback is manifested is through a change in demography (i.e., cell productivity) rather than cell condition.
In sum, our study reveals the demographic effect of density regulation as a proportional response to nutrient variation; this supports our hypothesis that population regulation varies in response to variable environments. Density regulation has been observed in a broad range of taxa, including through the expression of trade-offs between costs of current versus future reproductive opportunities in relation to resource levels (Engen et al., 2001; Reznick et al., 2012). For micro-organisms, due to their more limited lifespan and restricted life history variability, growth versus reproduction trade-offs may be more restricted. Ultimately, the mechanism driving changes in population regulation must be examined further using experimental approaches across a variety of taxa and under natural and experimental conditions, to provide a deeper understanding of the gamut of complexities associated with density dependent population regulation.
Author Contributions
AB and DLM conceived of the research. AB conducted the study and collected the data under the guidance of DLM and PF. AB and DLM interpreted the results and wrote the manuscript and revised it in collaboration with PF.
Conflict of Interest Statement
The authors declare that the research was conducted in the absence of any commercial or financial relationships that could be construed as a potential conflict of interest.
Acknowledgments
We are grateful to Guillaume Bastille-Rousseau for providing assistance with the data analysis. We appreciate all the helpful guidance from the DLM and PF Labs. We thank the reviewers for helpful comments on our paper.
References
Birch, L. (1948). The intrinsic rate of natural increase of an insect population. J. Anim. Ecol. 17, 15–26. doi: 10.2307/1605
Bull, J. C., and Bonsall, M. B. (2008). Overcompensatory population dynamic responses to environmental stochasticity. J. Anim. Ecol. 77, 1296–1305. doi: 10.1111/j.1365-2656.2008.01449.x
PubMed Abstract | Full Text | CrossRef Full Text | Google Scholar
Burnham, K. P., and Anderson, D. R. (2002). Model Selection and Multimodel Inference: A Practical Information-Theoretical Approach. 2nd Edn. New York, NY: Springer-Verlag.
Caughley, G., and Birch, L. (1971). Rate of increase. J. Wildl. Manag. 35, 658–663. doi: 10.2307/3799769
Clark, F., and Brook, B. (2010). The theta-logistic is unreliable for modelling most census data. Methods Ecol. Evol. 1, 253–262. doi: 10.1111/j.2041-210X.2010.00029.x
Courchamp, F., Clutton-Brock, T., and Grenfell, B. (1999). Inverse density dependence and the Allee effect. Trends Ecol. Evol. 14, 405–410. doi: 10.1016/S0169-5347(99)01683-3
PubMed Abstract | Full Text | CrossRef Full Text | Google Scholar
Cunningham, A., and Maas, P. (1978). Time lag and nutrient storage effects in the transient growth response of Chlamydomonas reinhardii in nitrogen-limited batch and continuous culture. J. Gen. Microbiol. 104, 227–231. doi: 10.1099/00221287-104-2-227
Doncaster, C. P. (2006). Comment on “On the regulation of populations of mammals, birds, fish, and insects” III. Science 311, 1100. doi: 10.1126/science.1122383
PubMed Abstract | Full Text | CrossRef Full Text | Google Scholar
Droop, M. R. (1974). The nutrient status of algal cells in continuous culture. J. Mar. Biol. Assoc. U.K. 9, 825–855. doi: 10.1017/S002531540005760X
Engen, S., Sæther, B., and Møller, A. P. (2001). Stochastic population dynamics and time to extinction of a declining population of barn swallows. J. Anim. Ecol. 70, 789–797. doi: 10.1046/j.0021-8790.2001.00543.x
Gabriel, J., Saucy, F., and Bersier, L. (2005). Paradoxes in the logistic equation? Ecol. Model. 185, 147–151. doi: 10.1016/j.ecolmodel.2004.10.009
Getz, W. M., and Lloyd-Smith, J. O. (2006). Comment on “On the regulation of populations of mammals, birds, fish, and insects” I. Science 311, 1100. doi: 10.1126/science.1121388
Gilpin, M. E., and Ayala, F. J. (1973). Global models of growth and competition. Proc. Natl. Acad. Sci. U.S.A. 70, 3590–3593. doi: 10.1073/pnas.70.12.3590
PubMed Abstract | Full Text | CrossRef Full Text | Google Scholar
Grover, J. (1989). Phosphorus-dependent growth kinetics of 11 species of freshwater algae. Limnol. Oceanogr. 34, 341–348. doi: 10.4319/lo.1989.34.2.0341
Harris, E. (1989). The Chlamydomonas Sourcebook. Burlington: Elsevier Inc. Available online at: http://journals.cambridge.org/abstract_S0024282989000538
Herrando-Pérez, S., and Delean, S. (2012). Density dependence: an ecological Tower of Babel. Oecologia 170, 585–603. doi: 10.1007/s00442-012-2347-3
PubMed Abstract | Full Text | CrossRef Full Text | Google Scholar
Kargi, F. (2009). Re-interpretation of the logistic equation for batch microbial growth in relation to Monod kinetics. Lett. Appl. Microbiol. 48, 398–401. doi: 10.1111/j.1472-765X.2008.02537.x
PubMed Abstract | Full Text | CrossRef Full Text | Google Scholar
Kilham, S., Kreeger, D., Lynn, S., and Goulden, C. (1998). COMBO: a defined freshwater culture medium for algae and zooplankton. Hydrobiologia 377, 147–159. doi: 10.1023/A:1003231628456
Krebs, C. J. (2008). The experimental paradigm and long-term population studies. Ibis (Lond. 1859) 133, 3–8. doi: 10.1111/j.1474-919X.1991.tb07663.x
Lehman, J. (1976). Ecological and nutritional studies on Dinobryon Ehrenb.: Seasonal periodicity and the phosphate toxicity problems. Limnol. Oceanogr. 21, 646–658. doi: 10.4319/lo.1976.21.5.0646
McCallum, H. (2000). Population Parameters: Estimation for Ecological Models. Oxford: Blackwell Science.
Murray, D. L., Anderson, M. G., and Steury, T. D. (2010). Temporal shift in density dependence among North American breeding duck populations. Ecology 91, 571–581. doi: 10.1890/MS08-1032.1
PubMed Abstract | Full Text | CrossRef Full Text | Google Scholar
Pascual, M., and Caswell, H. (1997). From the cell cycle to population cycles in phytoplankton-nutrient interactions. Ecology 78, 897–912. doi: 10.2307/2266068
Peacock, E., and Garshelis, D. L. (2006). Comment on “On the regulation of populations of mammals, birds, fish, and insects” IV. Science 313, 45. doi: 10.1126/science.1127705
PubMed Abstract | Full Text | CrossRef Full Text | Google Scholar
Sinclair, A. R. E., and Krebs, C. J. (2002). Complex numerical responses to top-down and bottom-up processes in vertebrate populations. Philos. Trans. R. Soc. Lond. B Biol. Sci. 357, 1221–1231. doi: 10.1098/rstb.2002.1123
PubMed Abstract | Full Text | CrossRef Full Text | Google Scholar
Renaut, S., Replansky, T., Heppleston, A., and Bell, G. (2006). The ecology and genetics of fitness in Chlamydomonas. XIII. Fitness of long-term sexual and asexual populations in benign environments. Evolution 60, 2272–2279. doi: 10.1111/j.0014-3820.2006.tb01864.x
PubMed Abstract | Full Text | CrossRef Full Text | Google Scholar
Reynolds, S. A., and Brassil, C. E. (2013). When can a single-species, density-dependent model capture the dynamics of a consumer-resource system? J. Theor. Biol. 339, 70–83. doi: 10.1016/j.jtbi.2013.08.025
PubMed Abstract | Full Text | CrossRef Full Text | Google Scholar
Reznick, D., Bassar, R., Travis, J., and Rodd, F. H. (2012). Life-history evolution in guppies VIII: the demographics of density regulation in guppies (Poecilia Reticulata). Evolution 50, 2903–2915. doi: 10.1111/j.1558-5646.2012.01650.x
PubMed Abstract | Full Text | CrossRef Full Text | Google Scholar
Ross, J. V. (2006). Comment on “On the regulation of populations of mammals, birds, fish, and insects” II. Science 311, 1100. doi: 10.1126/science.1121875
PubMed Abstract | Full Text | CrossRef Full Text | Google Scholar
Ross, J. V. (2009). A note on density dependence in population models. Ecol. Model. 220, 3472–3474. doi: 10.1016/j.ecolmodel.2009.08.024
Sæther, B.-E., and Engen, S. (2002). Pattern of variation in avian population growth rates. Philos. Trans. R. Soc. Lond. B Biol. Sci. 357, 1185–1195. doi: 10.1098/rstb.2002.1119
PubMed Abstract | Full Text | CrossRef Full Text | Google Scholar
Sakanoue, S. (2007). Extended logistic model for growth of single-species populations. Ecol. Model. 205, 159–168. doi: 10.1016/j.ecolmodel.2007.02.013
Sibly, R. M., Barker, D., Denham, M. C., Hone, J., and Pagel, M. (2005). On the regulation of populations of mammals, birds, fish, and insects. Science 309, 607–610. doi: 10.1126/science.1110760
PubMed Abstract | Full Text | CrossRef Full Text | Google Scholar
Sibly, R. M., and Brown, J. H. (2007). Effects of body size and lifestyle on evolution of mammal life histories. Proc. Natl. Acad. Sci. U.S.A. 104, 17707–17712. doi: 10.1073/pnas.0707725104
PubMed Abstract | Full Text | CrossRef Full Text | Google Scholar
Sinclair, A., Fryxell, J., and Caughley, G. (2006). Wildlife Ecology, Conservation, and Management. West Sussex: Wiler-Blackwell.
Sinclair, A. R. E. (1989). “Population regulation in animals,” in Ecological Concepts, ed J. M. Cherrett (Oxford: Blackwell), 197–241.
Sterner, R., and Hagemeier, D. (1993). Phytoplankton nutrient limitation and food quality for Daphnia. Limnol. Oceanogr. 38, 857–871. doi: 10.4319/lo.1993.38.4.0857
Stevens, M. (2009). A Primer of Ecology with R. New York, NY: Springer. doi: 10.1007/978-0-387-89882-7
Tsoularis, A. (2001). Analysis of logistic growth models. Res. Lett. Inf. Math. Sci. 2, 23–46. Available online at: http://hdl.handle.net/10179/4341
Tsoularis, A., and Wallace, J. (2002). Analysis of logistic growth models. Math. Biosci. 179, 21–55. doi: 10.1016/S0025-5564(02)00096-2
PubMed Abstract | Full Text | CrossRef Full Text | Google Scholar
Turchin, P. (2003). Complex Population Dynamics: a Theoretical/Empirical Synthesis. Princeton, NJ: Princeton University Press.
Keywords: Chlamydomonas reinhartti, density dependence, logistic model, per capita growth rate, phytoplankton, population dynamics, single species growth, theta-logistic model
Citation: Borlestean A, Frost PC and Murray DL (2015) A mechanistic analysis of density dependence in algal population dynamics. Front. Ecol. Evol. 3:37. doi: 10.3389/fevo.2015.00037
Received: 06 December 2014; Accepted: 24 March 2015;
Published: 10 April 2015.
Edited by:
José J. Lahoz-Monfort, University of Melbourne, AustraliaReviewed by:
Rob Salguero-Gomez, The University of Queensland, AustraliaFernando Colchero, University of Southern Denmark, Denmark
Copyright © 2015 Borlestean, Frost and Murray. This is an open-access article distributed under the terms of the Creative Commons Attribution License (CC BY). The use, distribution or reproduction in other forums is permitted, provided the original author(s) or licensor are credited and that the original publication in this journal is cited, in accordance with accepted academic practice. No use, distribution or reproduction is permitted which does not comply with these terms.
*Correspondence: Dennis L. Murray, Department of Biology, Trent University, 1600 West Bank Drive, Peterborough, ON K9J 7B8, CanadaZGVubmlzbXVycmF5QHRyZW50dS5jYQ==