 Michaela Thoß
 Kenneth C. Luzynski1
 Michael Ante
 Ingrid Miller
 Dustin J. Penn
- 1Department of Integrative Biology and Evolution, Konrad Lorenz Institute of Ethology, University of Veterinary Medicine Vienna, Vienna, Austria
- 2Department of Biomedical Sciences, Institute of Medical Biochemistry, University of Veterinary Medicine Vienna, Vienna, Austria
House mice (Mus musculus) produce a variable number of major urinary proteins (MUPs), and studies suggest that each individual produces a unique MUP profile that provides a distinctive odor signature controlling individual and kin recognition. This “barcode hypothesis” requires that MUP urinary profiles show high individual variability within populations and also high individual consistency over time, but tests of these assumptions are lacking. We analyzed urinary MUP profiles of 66 wild-caught house mice from eight populations using isoelectric focusing. We found that MUP profiles of wild male house mice are not individually unique, and though they were highly variable, closer inspection revealed that the variation strongly depended on MUP band type (prominence of putative isoforms). The prominent (“major”) bands were surprisingly homogenous, but we also found inconspicuous (“minor”) bands that were highly variable and therefore potential candidates for individual fingerprints. We also examined changes in urinary MUP profiles of 58 males over time (from 6 to 24 weeks of age), and found that individual MUP profiles and MUP concentration were surprisingly dynamic, and showed significant changes after puberty and during adulthood. Contrary to what we expected, however, the minor bands were the most variable over time and thus do not provide good candidates for individual fingerprints. Although MUP profiles do not provide individual fingerprints, we found that MUP profiles were more similar among siblings than non-kin despite considerable fluctuation. Our findings show that MUP profiles are not highly stable over time, they do not show strong individual clustering, and thus challenge the barcode hypothesis. Within-individual dynamics of MUP profiles suggest a different function of MUPs than previously assumed, and future studies need to examine the function of these dynamic changes.
Introduction
It has been a major challenge to understand how animals recognize kin, and how natural selection maintains genetic diversity for traits used to recognize kin (reviewed in Penn and Frommen, 2010; Holman et al., 2013). House mice (Mus musculus) use chemical signals to assess kinship and genetic compatibility of potential mates. Studies on house mice and other species indicate that the highly polymorphic genes of the major histocompatibility complex (MHC) influence odor and mating preferences that enhance genetic compatibility (increasing offspring MHC heterozygosity and avoiding inbreeding) (Penn and Potts, 1999; Penn, 2002; Milinski, 2006; Roberts, 2009; Thoß et al., 2011), thereby providing significant fitness benefits (Meagher et al., 2000; Ilmonen et al., 2008). Some studies suggest that major urinary proteins (MUPs) play an even more important role than MHC genes in mediating individual recognition and inbreeding avoidance (Hurst, 2005; Cheetham et al., 2007; Sherborne et al., 2007; Thom et al., 2007). MUPs are small barrel-shaped, lipocalin proteins (18–20 kDa) that bind and transport hydrophobic ligands, including volatile pheromones (Novotny et al., 1999; Novotny, 2003), to urine, tears, saliva and other secretions in house mice (Shahan et al., 1987; Flower, 1996; Timm et al., 2001). Sexually dimorphic liver MUP production is regulated by testosterone (Szoka and Paigen, 1978; Clissold et al., 1984), thyroxine (Knopf et al., 1983), and pulsatile release of growth hormone (Mode et al., 1982; Norstedt and Palmiter, 1984; Macleod et al., 1991) and males excrete 3–10 times more urinary MUPs than females (Norstedt and Palmiter, 1984; Stopková et al., 2007; Cheetham et al., 2009; Janotova and Stopka, 2009; Novikov et al., 2009). Urinary MUPs show extraordinarily high amino acid sequence similarity and can only be separated using high-resolution techniques, such as isoelectric focusing in narrow pH ranges. This technique has been employed to study variation in urinary MUPs, and it revealed that wild house mice (Mus musculus domesticus) excrete 4–12 different MUP bands (MUP profiles) (Hainey and Bishop, 1982; Hurst et al., 2001; Payne et al., 2001; Veggerby et al., 2001; Beynon et al., 2002; Armstrong et al., 2005). These findings led to the idea that individuals excrete their own unique MUP profiles or “barcodes” (Beynon et al., 2014) that provide distinctive odor signatures mediating individual and kin recognition (“barcode hypothesis”) (Hurst et al., 2001; Cheetham et al., 2007, 2009), inbreeding avoidance (Sherborne et al., 2007), and assessment of heterozygosity (Thom et al., 2007). It is not known whether MUP profiles are individually unique or highly polymorphic in wild house mice, and even if MUPs show high individual variability, a single snapshot in time (cross-sectional survey) is inadequate to show stable, individual fingerprints as individual diversity could be due to dynamic changes over time. To mediate individual or kin recognition, MUPs and any other chemosensory cue must show both high individual variability and individual consistency over time (Penn et al., 2007). Therefore, our aims were to test whether MUP profiles in wild house mice show individually unique patterns, as assumed by the barcode hypothesis, or whether they show dynamic expression.
Three studies have investigated variation in MUP profiles in populations of wild mice (Mus musculus domesticus) (Robertson et al., 1997; Pes et al., 1999; Payne et al., 2001), and although they concluded that MUPs are “highly polymorphic,” no quantitative measures were provided and it is unclear whether the diversity observed occurs within or only between populations. One of these studies surveyed wild-caught mice from three mainland farms and one feral island population in the UK (Payne et al., 2001). MUP profile complexity and similarity between individuals were related to population size, as there were more bands in larger populations. The feral island population showed highest MUP profile similarity and, in turn, lowest MUP diversity compared to mainland farm populations (Payne et al., 2001; Beynon et al., 2002). The authors concluded that MUPs provide “signature patterns” unique to different populations, but no evidence was provided to support this conclusion. Based on these findings, it is often asserted that MUP profiles are individually unique and also that Mup genes are “highly polymorphic” (Robertson et al., 1996, 1997; Beynon et al., 2002; Mudge et al., 2008), but neither of these hypotheses has been tested. There is little or no individual variation in MUP profiles within inbred strains, and the number of bands varies among different laboratory strains (Cheetham et al., 2009). Also, laboratory strains show reduced MUP profile complexity and diversity when compared to wild mice (Cheetham et al., 2009), however, no quantitative measures were provided and it is unclear whether the wild mice used in this study were all sexually mature (which potentially influences MUP profiles; see below).
It has also been assumed that individual MUP profiles are stable or consistent over time, which is necessary to provide “barcodes” or “signatures” for individual recognition. Only one study has examined intra-individual consistency of MUP profiles and it found that MUP profiles change during puberty (day 21–52), so that mature males express the full MUP profile (Payne et al., 2001). This study was based on three males, each sampled on three different days, and it is unclear whether MUP profiles change significantly during puberty or whether they stabilize during adulthood. Dynamic expression of MUP profiles is expected for several reasons: First, MUP excretion is under endocrine control and different hormones influence the expression of individual MUPs (Knopf et al., 1983; Clissold et al., 1984; Schwende et al., 1986). Second, MUP expression and excretion show dynamic changes depending upon social interactions (Harvey et al., 1989; Janotova and Stopka, 2011), health, and condition, i.e., MUP expression is down-regulated following infection (Isseroff et al., 1986), immune activation (Litvinova et al., 2005) and food restriction (Giller et al., 2013). Finally, MUPs function to transport pheromones known to show dynamic changes (Timm et al., 2001; Osada et al., 2008; Kwak et al., 2013) and mice may change their pheromones by regulating the expression of individual MUPs, assuming MUP isoforms differentially bind and release different pheromones (Marie et al., 2001; Timm et al., 2001; Sharrow et al., 2002; Kwak et al., 2012). These findings suggest that MUP profiles are dynamic rather than stable over time, contrary to the barcode hypothesis, and advocate a testable, alternative hypothesis.
Our aims were to test whether MUP profiles show high inter-individual variability and intra-individual consistency, as assumed by the barcode hypothesis, or whether they fluctuate over time (“dynamic expression” hypothesis). To measure variation in MUP profiles, we used isoelectric focusing, as this is the method used to support the barcode hypothesis in previous studies, and we had the following specific aims: First, we tested the assumption that MUP profiles are individually unique or highly variable in commensal populations of house mice. We also compared variation in MUP profiles within and between eight geographically distinct populations to test for population “signature patterns” (Payne et al., 2001) and whether there is more similarity among populations that are in closer proximity to each other than more distant ones. Second, we investigated intra-individual consistency by studying the dynamics of urinary MUP profiles of wild-derived male house mice over their lifetime. To achieve this aim, we sampled 29 brother pairs of wild-derived male mice from one population in regular intervals and examined intra-individual consistency of MUP profiles. To our knowledge, this study is the first quantitative analysis of variation in MUP profiles, the first to analyze the effects of genetic relatedness (kinship) on MUP profiles, and the first to examine intra-individual consistency during puberty and adulthood in more than three individual mice. We conducted our study on wild-caught house mice (Mus musculus musculus) and future studies are needed to determine whether our findings generalize to Mus musculus domesticus and other subspecies.
Materials and Methods
Subjects and Urine Collection
To assess MUP profile diversity, 66 mature wild house mice were trapped in barns, stables or farm houses at eight different localities in Austria (Supplemental Figure 1) using Sherman live traps. A population included any mouse caught within a radius of 10 km in or near the following towns (federal state, sample size): Illmitz (Burgenland, N = 7), Mooskirchen (Styria, N = 12), Moosburg (Carinthia, N = 7), Mauterndorf (Salzburg, N = 5), Donnersbachwald (Styria, N = 6), Lacken (Upper Austria, N = 15), Bad Zell (Upper Austria, N = 6) and Vienna (N = 8). Mean distance between populations was 149 km (range: 50–248 km). Immediately after trapping, mature (≥15 g) male mice were transferred to a metabolic cage (Tecniplast, Germany) for 1 h to collect urine and feces samples and mice were subsequently released at the trapping site. Urine and feces were initially stored in Eppendorf tubes at −20°C, and then transferred to −80°C within 72 h. On average, we sampled 9 individuals per population (range: 5–15) at one to five trapping sites within each trapping locality. Sampled mice weighed on average 17.2 g (±1.7 g) and mean body mass did not differ between populations (Kruskal-Wallis test, H = 9.83, df = 7, p = 0.2).
For assessing intra-individual consistency, we sampled 58 male offspring obtained from 29 pregnant female house mice that we trapped at the Konrad Lorenz Institute of Ethology, Vienna, Austria. Females were kept in Type IIL cages (Tecniplast, Germany) containing wood shavings (ABEDD, Austria), a mouse house (Tecniplast, Germany) and nesting material (Nestlet©, Ehret, Austria) for environmental enrichment. Mice were kept under a 12:12 h dark:light cycle with lights on at 0700 and provided with food (rodent diet 1324, Altromin, Germany) and water ad libitum. After weaning (day 21), two males of each litter were kept singly in Type IIL cages and urine and feces were collected six times (at 4, 6, 8, 10, 12, and 24 weeks of age) for 1 h starting at 0900 using metabolic cages (Tecniplast, Germany). Urine and feces were stored in Eppendorf tubes at −80°C.
The experimental procedures were in accordance with ethical standards and guidelines in the care and use of experimental animals of the Ethical and Animal Welfare Commission of the University of Veterinary Medicine Vienna and the Austrian Federal Ministry of Science and Research (Permit No. BMWF-68.205/0225-II/3b/2012 and BMWF-68.205/0124-II/3b/2013).
Protein Biochemistry
Protein concentration of urine samples was measured in triplicates according to a standard Bradford assay (Bradford, 1976) on a 96-well microplate. Triplet values occurred within ±10% range, or otherwise the analysis was repeated. We evaluated total (MUP concentration, see below) and relative (protein:creatinine ratio or PC ratio) urinary protein concentration, corrected for renal activity and urine dilution by measuring creatinine (In Vitro: Labor für Veterinärmedizinische Diagnostik and Hygiene GmbH, Vienna). Repeatability of creatinine measurement was 92.7%. In healthy mice, MUPs comprise the vast majority of urinary protein (up to 99%, Beynon et al., 2002; Garratt et al., 2011) and the remainder is albumin and other urinary proteins at very low concentration, and, thus, we use total urinary protein concentration to estimate “MUP concentration” in this study. There was no relationship between body mass and MUP concentration (Spearman correlation, N = 66, ρ = 0.15, p = 0.23; Supplemental Figure 2A) or between body mass and protein:creatinine (PC) ratio (ρ = 0.05, p = 0.69; Supplemental Figure 2B).
Isoelectric focusing (pH gradient gel electrophoresis) was used to separate urinary proteins according to differences in charge and assess MUP profiles (Hurst et al., 2001; Payne et al., 2001; Beynon et al., 2002). In-house narrow-range, immobilized pH gradient gels (IPGs, pH 4.2–4.9) were polymerized using appropriate acrylamide/Immobiline® mixtures (GE Healthcare Life Sciences); linear gradients were established as described (Westermeier, 1993). 3 μl of diluted urine samples (1 μg/μl) were focused overnight at 10°C–15 kVh. Protein patterns were stained (Coomassie Brilliant Blue R-250), scanned and evaluated with ImageQuantTL® (GE Healthcare Life Sciences) for banding pattern. IPG bands were non-saturated and relative intensity of each band (single band staining normalized by overall staining in respective lane) was determined. Position of IPG bands was measured relative to an internal standard [trypsin inhibitor pH 4.6 (Sigma, St. Louis, USA)] to account for slight gradient differences and to compare MUP profiles between gels. IPG bands were individually numbered from 1 to 19 starting from the acidic side of the gradient (Supplemental Figure 3). The barcode hypothesis is based on the assumption that IPG gels provide an accurate method to assess variation in MUP proteins (Robertson et al., 1997; Pes et al., 1999; Payne et al., 2001), which is reasonable since MUPs comprise the vast majority of urinary protein (Beynon et al., 2002; Garratt et al., 2011) with a predicted pI between pH 4.2 and 4.9. Thus, urinary proteins separated on narrow-range IPGs (pH 4.2–4.9) are mostly MUPs and we found no evidence for interference from the second most abundant urinary protein, albumin, even at very high concentrations (Supplemental Figure 4). All other urinary proteins occur at lower concentrations and would not be detected with our method (Coomassie Blue staining). Previous studies have assumed that IPG bands contain different MUP isoforms, however, this assumption is untested, as we address in the Discussion, and therefore, we conservatively refer to these putative isoforms as “IPG bands.”
Classifying IPG Bands
Visual inspection and plotting of frequency against intensity for each band indicated that MUP profiles consisted of two distinct types of IPG bands, large, dark bands, and small, light bands. Hierarchical clustering based on band frequency and intensity using nearest neighbor method confirmed two clusters of bands with common, high intensity or “major” bands in one cluster and rare, low intensity or “minor” bands in the other (Supplemental Figure 5A). This result holds when band frequency and intensity were averaged over the sampling period (6, 10, and 24 weeks, Supplemental Figure 5B) and when age classes were analyzed separately (Supplemental Figures 5C–E). Overall, and separately for each age class, we found the identical set of eight major bands that were expressed on average by >35% of individuals and contained 70% of total protein. The other 30% of protein in 11 minor bands were present on average in <26% of the individuals. To rule out the possibility that variation in individual IPG profiles can be explained by slight between-gel differences in pH gradient or running conditions, we measured repeatability of MUP profiles by running individual samples twice on the same (within gel repeatability, six samples in total) or on a different IPG gel (between gel repeatability, six samples in total). Within gel repeatability of MUP profiles was 98% (98.8 and 97.6% for major and minor bands, respectively), whereas repeatability between gels was 97% (98.1 and 95.3% for major and minor bands, respectively).
Analyses of MUP Profiles
MUP profiles were defined as individual vectors of 0 (absence) and 1 (presence) scored for a total of 19 bands detected. To obtain a measure of MUP profile similarity, we calculated the Manhattan distance between two MUP profiles using simple matching coefficients by scoring 1 for each match (e.g., band present or absent in both profiles) and 0 for each mismatch (e.g., band present or absent in one of the profiles but not in the other) and averaging over all 19 comparisons. This matching coefficient ranges from 0 (0% profile similarity) to 1 (100% profile similarity or identical profiles) and was square-root transformed for statistical analysis. We present MUP profile similarity results for all bands, and separate analyses of major and minor bands.
Statistical Analyses
Protein:creatinine ratio and MUP profile similarity were square-root transformed to achieve normality. We used Spearman rank correlation to test whether mean number of MUP bands per individual, total number of MUP bands per population and MUP profile similarity were correlated with number of individuals sampled from a population. We employed Wilcoxon signed rank test to compare MUP profile similarity within and between populations for all types of bands. To test for differences in band frequency between populations, we used a generalized linear model (GZLM) with band frequency as dependent variable, populations as fixed factor and sample size as random factor. We employed analysis of similarity (anosim) and nonmetric multidimensional scaling (NMDS) to investigate potential clustering of populations based on MUP profiles. We used a Mantel test (Oksanen et al., 2013), a method often used to relate genetic marker distance and geographic distance, to examine a potential correlation between MUP profile similarity and geographic distance.
To test intra-individual consistency in MUP concentration and PC ratio, we employed a repeated measures generalized linear mixed effects model (RM GLMM) with MUP concentration or PC ratio as dependent variable, age at sampling as fixed factor and ID and body mass as random factors. Using Pearson's correlation, we tested for an association between MUP concentration, body mass and creatinine concentration. Using the same test, we investigated an association between mean MUP concentration/PC ratio and the variance in MUP concentration/PC ratio.
We employed analysis of similarity (anosim) and nonmetric multidimensional scaling (NMDS) to investigate potential clustering of individuals based on MUP profiles at 6, 10, and 24 weeks of age and to examine potential clustering of age classes. To test intra-individual consistency of MUP profiles, we compared intra-individual MUP profile similarity during puberty (6–10 weeks) and adulthood (10–24 weeks) to the expected value of 1 (indicating identical MUP profiles) using one-sample Wilcoxon signed rank test. Wilcoxon signed rank test was employed to test for differences in intra-individual consistency of major and minor bands. To examine changes in number of MUP bands over time, we used repeated measures general linear model (RM GLM) with mean number of MUP bands per family as dependent variable and age at sampling (6, 10, or 24 weeks) as fixed factor. Hochberg's GT2 was used as post hoc test to test for changes during puberty (6–10 weeks) and adulthood (10–24 weeks). Finally, we employed Spearman rank correlation to test for associations between number of MUP bands and intra-individual consistency. We used partial correlation to test for an association between number of MUP bands and MUP concentration/PC ratio while controlling for age and family effects.
We used repeated measures generalized linear mixed effects model (RM GLMM) to test for changes in band intensity (dependent variable) over the sampling period with individual band (1–19) and age at sampling (6, 10, and 24 weeks) as fixed factors and male ID as random factor.
To examine effects of relatedness, we separately ran repeated measures generalized linear mixed effects models (RM GLMM) comparing MUP concentration, PC ratio, body mass, MUP profile similarity, and number of MUP bands between brothers and unrelated males. Age at sampling (6, 10, and 24 weeks) and relatedness (brother or not) were employed as fixed factors, family (and for one model body mass) as random factor(s). Statistical analysis was done using SPSS 20, except for anosim, NMDS, and Mantel test which were carried out in R (R Core Team, 2014).
Results
MUP Diversity between Populations
In total, we detected 19 different MUP bands in these populations and males produced 3–14 MUP bands per individual (mean 8.4 ± 2.6; Supplemental Figure 6). Mean number of MUP bands per male in a population was not correlated with number of individuals sampled from this population (Spearman rank correlation, N = 8, ρ = 0.62, p = 0.10, Supplemental Figure 7A), though the total number of MUP bands found in a population increased with increasing sample size (ρ = 0.92, p = 0.001, Supplemental Figure 7B). When analyzing MUP profile similarity between populations using all 19 bands, we found that most (57 individuals; 86%), though not all, males had unique MUP profiles and did not share their particular MUP profile with any other individual (average profile similarity: 67 ± 12%); only a minority (9 individuals; 14%) had MUP profiles identical to at least one other individual. MUP profiles were composed of two types of IPG bands, major, and minor bands, which differed markedly in their abundance (see Methods), and therefore we also compared the variation of major and minor bands. Males in our populations produced 3–8 major MUP bands (mean 5.6 ± 1.1; Supplemental Figure 8A) and 0–6 minor MUP bands (mean 1.8 ± 1.4; Supplemental Figure 8B) per individual. Surprisingly, most males were not unique for the 8 major bands, as 58 individuals (88%) had MUP profiles that were identical to at least one other individual. The remaining 8 individuals expressed unique MUP profiles at major bands with an average profile similarity of 69 ± 15%. In contrast, for the 11 minor bands, most males were unique, as only 19 individuals (29%) produced MUP profiles that were identical to at least one other individual. The remaining 47 individuals (71%) expressed unique MUP profiles at minor bands with an average profile similarity of 64 ± 14%. Thus, when analyzing all populations, individual MUP profiles showed high overall diversity, though profile sharing was significantly higher at major bands compared to minor bands (Wilcoxon signed rank test, N = 8, Z = 2.52, p = 0.012, Figure 1).
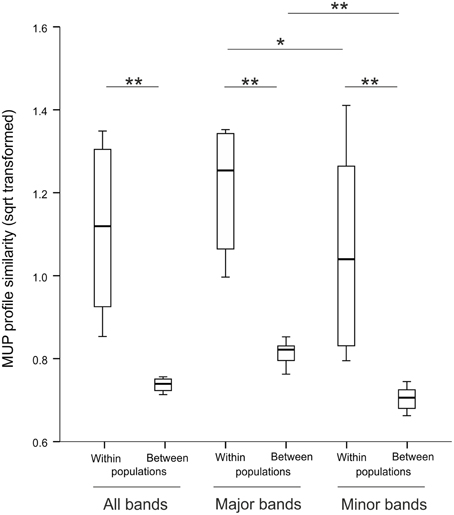
Figure 1. MUP profile similarity within and between populations for all, major and minor bands. *p < 0.05, **p < 0.02.
It has also been suggested that MUPs may provide a “population signature” through presence/absence of single MUP bands in different populations. We found evidence for significant differences in MUP profiles between populations, regardless of whether analysis was based on full data set (NMDS: stress = 0.183, ANOSIM: R = 0.111, p = 0.007, Supplemental Figure 9), major bands (NMDS: stress = 0.129, ANOSIM: R = 0.132, p = 0.003) or minor bands (NMDS: stress = 0.143, ANOSIM: R = 0.121, p = 0.005). Surprisingly, however, the frequency of individual bands did not differ between populations (GZLM, population: X2 = 4.42, p = 0.78). We also tested whether MUP profile similarity functions as a proxy of geographic distance in our populations. Again, surprisingly, similarity of MUP profiles did not decline with geographic distance between populations, regardless of whether analysis was based on full data set (Mantel test, r = −0.03, p = 0.72, Supplemental Figure 10), major bands (r = −0.12, p = 0.97) or minor bands (r = 0.02, p = 0.34).
MUP Diversity within Populations
Overall, mean MUP profile sharing within a population decreased with increasing sample size (Spearman correlation, N = 8, ρ = −0.78, p = 0.022, Supplemental Figure 11), as expected. When analyzing MUP profile similarity within populations (all 19 bands), we found unique MUP profiles for almost every individual [64 of 66 individuals (97%), only two individuals were identical in the Lacken population] with an average profile similarity of 72 ± 4%. Again, we compared the variation of major and minor bands and found that for the 8 major bands, most males were not unique, as 42 individuals (64%) had MUP profiles that were identical to at least one other individual within their population. Average major band profile similarity was 77 ± 5%. In contrast, for the 11 minor bands, most males were unique, as only 11 individuals (17%) produced MUP profiles that were identical to at least one other individual within their population. The remaining 55 individuals expressed unique MUP profiles at minor bands with an average profile similarity of 70 ± 8%. Thus, MUP profile similarity within populations was significantly higher at major bands compared to minor bands (Wilcoxon signed rank test, N = 8, Z = 2.03, p = 0.042, Figure 1). As expected, MUP profiles of individual males were significantly more similar within than between populations, regardless of whether analysis was on the full data set, major or minor bands (Wilcoxon signed rank test, N = 8, all comparisons: Z ≤ −2.52, p ≤ 0.012; Figure 1).
Intra-individual Consistency and Dynamics
Protein Concentration
MUP production by individual males increased significantly over the sampling period (GLMM, age: F = 28.77, p < 0.001) and post-hoc analysis revealed that it was significantly lower before than after puberty (4 and 6 weeks vs. 8, 10, 12, and 24 weeks, Figure 2A). Including body mass as random factor in the model did not change the overall result (GLMM, age: F = 7.02, p < 0.001), as MUP concentration was not correlated with body mass (Pearson correlation, N = 57, r = 0.12, p = 0.19). PC ratio did not change significantly over the sampling period (GLMM, age: F = 0.28, p = 0.91, Figure 2B) due to a strong correlation of creatinine concentration with MUP concentration (Pearson correlation, N = 58, r = 0.5, p < 0.001) and body mass (r = 0.27, p = 0.004), which confirms that adjusting MUP concentration with creatinine concentration corrects for individual differences in MUP production due to body mass. Unexpectedly, males that produced higher protein concentration also fluctuated more in their protein production over the sampling period (MUP concentration: N = 29, r = 0.56, p = 0.002, Supplemental Figure 12A; PC ratio: r = 0.53, p = 0.002, Supplemental Figure 12B).
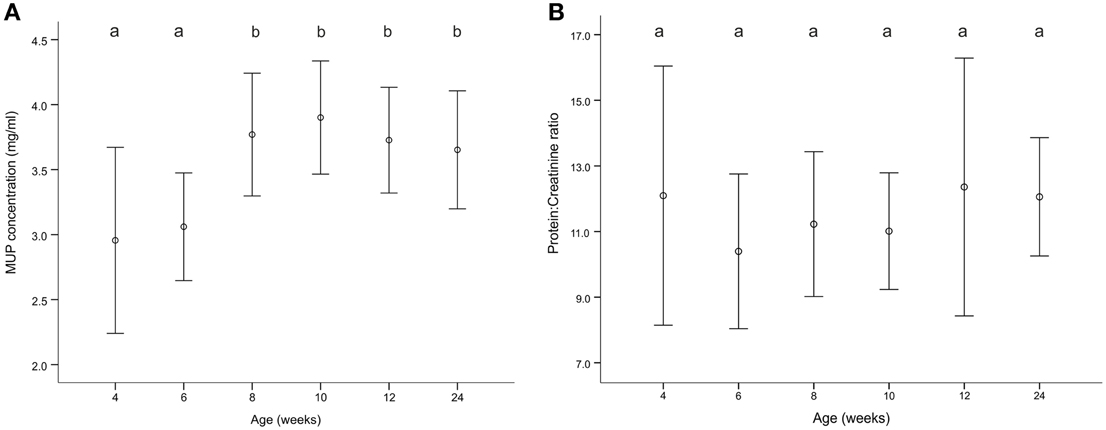
Figure 2. (A) MUP concentration and (B) protein:creatinine ratio over the sampling period. Plots show means ± s.e.m. Different letters above the data indicate significant differences between measurements (p < 0.05).
MUP IPG Profiles
Overall, MUP profiles were more similar within than between individuals, regardless of whether analysis was based on full data set (NMDS: stress = 0.14, ANOSIM: R = 0.678, p = 0.001, Figure 3), major bands (NMDS: stress = 0.06, ANOSIM: R = 0.406, p = 0.001) or minor bands (NMDS: stress = 0.102, ANOSIM: R = 0.592, p = 0.001). However, age classes did not show significant differences in MUP profiles (NMDS: stress = 0.14, ANOSIM: R = −0.04, p = 0.98, Supplemental Figure 13).
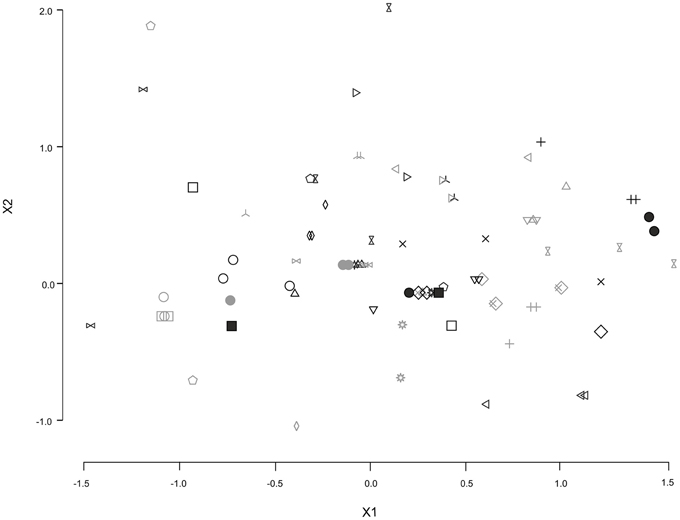
Figure 3. Nonmetric multidimensional scaling (NMDS) analysis of individual MUP profiles. Different symbols and color (gray or black) indicate different individuals (three samplings, N = 16; two samplings, N = 17).
To assess intra-individual consistency, we first analyzed intra-individual MUP profile similarity by comparing presence/absence of each IPG band within each individual between 6 and 10 weeks of age (puberty) and 10 and 24 weeks of age (adulthood, see Methods). Intra-individual MUP profile similarity was significantly smaller than 1 (indicating identical MUP profiles), regardless of whether analysis was based on all bands, major, or minor bands (One-sample Wilcoxon signed rank test, all Z ≥ 3.20, all p ≤ 0.001, Figure 4). When analyzing all 19 bands, only 34% of the profiles were consistent during puberty (average MUP profile similarity: 87 ± 9%) and only 29% were consistent during adulthood (average MUP profile similarity: 90 ± 8%). We conducted this analysis separately for major and minor MUP bands and found that, for major bands, 53% of males expressed consistent MUP profiles during puberty and 63% expressed consistent MUP profiles during adulthood. Individuals expressing inconsistent MUP profiles showed an average intra-individual MUP profile similarity of 73% (±16%) during puberty and 75% (±13%) during adulthood. For minor bands, 50% of males expressed consistent MUP profiles during puberty and 48% were consistent during adulthood. Individuals expressing inconsistent or fluctuating MUP profiles showed an intra-individual average MUP profile similarity of 87% (±6%) during puberty and adulthood. Thus, individual MUP profiles changed significantly during puberty (mean: 8.5%; range: 0–26.3%), as well as during adulthood (mean: 7.5%; range: 0–36.8%), though we found no evidence for differences in intra-individual consistency between major and minor bands during puberty (Wilcoxon signed rank test, N = 38, Z = −1.61, p = 0.11) or adulthood (N = 56, Z = −0.59, p = 0.55).
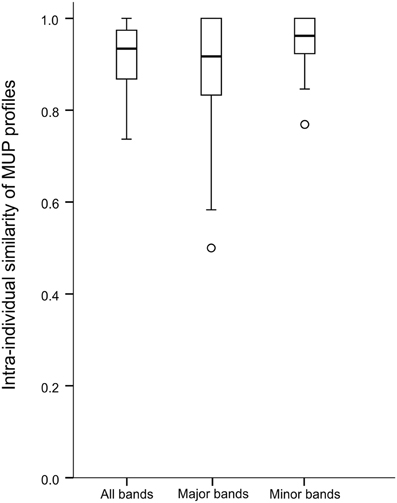
Figure 4. Intra-individual consistency of MUP profiles at all, major and minor bands.
In addition, we examined changes in the number of MUP bands over the sampling period and found a significant increase during puberty but not during adulthood (RM GLM, N = 23, F = 9.13, p = 0.006; post-hoc: puberty: p = 0.009; adulthood: p = 0.16; Supplemental Figure 14). Number of major bands increased during puberty, but not adulthood (F = 6.33, p = 0.02; post-hoc: puberty: p = 0.023 adulthood: p = 0.37), whereas number of minor bands increased both during puberty and adulthood (F = 11.26, p = 0.003; post-hoc: puberty: p = 0.016; adulthood: p = 0.041). There was a trend for males that expressed more MUP bands to show higher intra-individual consistency during adulthood (Spearman rank correlation, N = 22, ρ = 0.32, p = 0.09), but not during puberty (ρ = 0.03, p = 0.89). Furthermore, when controlling for age and family effects, we found a significant association between number of MUP bands and MUP concentration (partial correlation, N = 23, r = 0.58, p < 0.001; Supplemental Figure 15, black circles), but not PC ratio (r = −0.05, p = 0.68; Supplemental Figure 15, white circles).
Band Intensity
MUP profiles might also differ in relative intensity (amount of protein of different bands), as well as in the presence/absence of bands over the lifetime. Hierarchical clustering of band intensity and frequency revealed two types of MUP bands, major and minor bands, which were stable over the sampling period (see Methods for details). Thus, we found significant differences in intensity between single MUP bands; however, we found no evidence for significant changes of intensity within bands over the sampling period. For a more detailed analysis, we calculated the variance in intensity for each band and reran the analysis using only highly variable MUP bands (variance in intensity more than twice the SD of the mean variance in intensity); however, we found no evidence for significant changes over the sampling period in the nine remaining bands (band: F = 18.61, p < 0.001, age: F = 0.39, p = 0.68, band*age: F = 1.22, p = 0.25).
MUP Similarity between Kin and Non-Kin
Difference in MUP concentration between brothers and unrelated males changed significantly over the sampling period, however, at any age, brothers were more similar in MUP concentration than unrelated males (GLMM, age: F = 3.50, p = 0.009; relatedness: F = 193.5, p < 0.001, age*relatedness: F = 0.86, p = 0.49; Supplemental Figure 16A). In contrast, PC ratio showed no change over the sampling period, and PC ratio did not differ between brothers and unrelated males (GLMM, age: F = 1.80, p = 0.13, relatedness: F = 0.91, p = 0.34, age*relatedness: F = 0.14, p = 0.97; Supplemental Figure 16B). This result suggested that brothers were more similar in body mass than unrelated males. We compared body mass of brothers and unrelated males at four age classes (6, 8, 10, and 24 weeks of age) and confirmed that, at any age, brothers are more similar in body mass than unrelated males (GLMM, age: F = 1.19, p = 0.32; relatedness: F = 21.61, p < 0.001, age*relatedness: F =1.96, p = 0.12; Supplemental Figure 17A). However, this finding does not explain the higher similarity of brothers in MUP concentration compared to unrelated males as including body mass in the first model does not change the overall result (age: F = 3.29, p = 0.023; relatedness: F = 75.08, p < 0.001, age*relatedness: F = 0.39, p = 0.76).
At all ages, we found that MUP profiles of brothers were significantly more similar to each other than profiles of unrelated males (GLMM, age: F = 0.84, p = 0.43; relatedness: F = 81.68, p < 0.001, age*relatedness: F = 0.65, p = 0.52; Figure 5A). This familial effect held for both major and minor bands when analyzed separately. Also, MUP profile similarity unexpectedly increased with age overall, and for both major and minor bands, and MUP profiles during adulthood were significantly more similar than during puberty (major bands: age: F = 3.15, p = 0.046, relatedness: F = 104.0, p < 0.001, age*relatedness: F = 2.44, p = 0.09, Figure 5B; minor bands: age: F = 2.66, p = 0.073, relatedness: F = 117.0, p < 0.001, age*relatedness: F = 2.52, p = 0.084, Figure 5C). This finding suggests that brothers are more similar in the number of MUP bands they express compared to unrelated males. We confirmed this relationship for all 19 bands (age: F = 0.53, p = 0.59; relatedness: F = 19.31, p < 0.001, age*relatedness: F = 0.64, p = 0.53, Supplemental Figure 17B) and minor bands (age: F = 1.09, p = 0.34; relatedness: F = 89.54, p < 0.001, age*relatedness: F = 1.62, p = 0.20, Supplemental Figure 18B). For major bands, we found a significant interaction of age and relatedness so that brothers expressed more similar numbers of bands at 6 and 10 weeks of age, but not at 24 weeks (age: F = 6.66, p = 0.002; relatedness: F = 28.77, p < 0.001, age*relatedness: F = 4.02, p = 0.02, Supplemental Figure 18A).
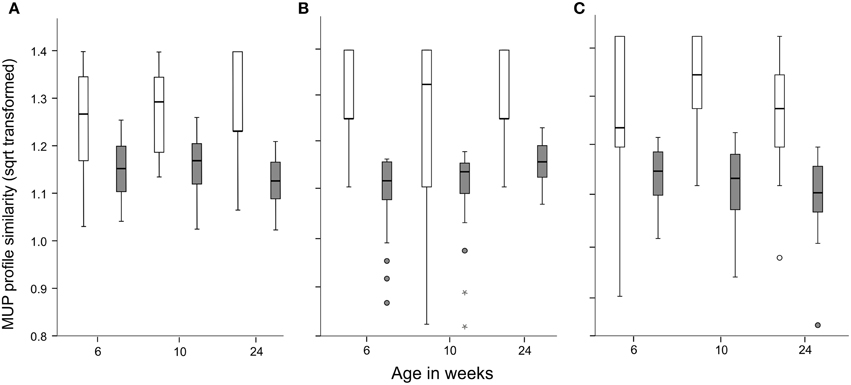
Figure 5. MUP profile similarity and kinship at all (A), major (B) and minor bands (C). Brothers (white bars) vs. unrelated males (gray bars) at 6, 10, and 24 weeks of age. Circles and asterisks indicate outliers.
Discussion
Our findings from the population survey show that urinary MUP profiles are highly variable in wild-caught male house mice, but this variation mainly occurred in the small, minor IPG bands whereas most proteins (large, major bands) were surprisingly uniform among males. When we sampled mice longitudinally to track changes over time, we found that individual MUP profiles were remarkably dynamic and expressed significant changes during puberty and also during adulthood [MUP profiles of most males (71%) were not consistent]. Also, the minor bands showed the highest individual variation, but continued to change in adults, and therefore they do not provide good candidates for individual signatures. Thus, our findings do not support the hypothesis that MUP profiles provide unique individual “barcodes” sensu stricto, and they challenge broader versions of the barcode hypothesis, which require high inter-individual diversity and intra-individual consistency. Nonetheless, we found the first evidence to our knowledge that MUP profiles provide signatures for genetic relatedness, and therefore, MUP profiles are better candidates for self and kin recognition than individual recognition in house mice. Since we studied Mus musculus musculus, future studies are needed to determine whether our findings generalize to Mus musculus domesticus and other subspecies. Below we address our main findings in more detail, the main implications of our findings, and other future studies that are needed.
In our survey on individual variation in MUP profiles, we found that individual males expressed between 3 and 14 MUP bands in their urine (mean 8 ± 3 bands), which is slightly higher than a previous estimate in the subspecies, M. musculus domesticus (i.e., maximum 11 bands in one population) (Beynon et al., 2002; Cheetham et al., 2009). A larger sample size would be necessary to estimate the overall number of bands in this subspecies, as the number of bands increases with increasing sample size of the population (this study for musculus, and domesticus subspecies Payne et al., 2001). Many (14%) individuals shared identical MUP profiles across different populations, and therefore, we can reject the strict version of the barcode hypothesis postulating unique MUP profiles. And although most (86%) males produced unique profiles, closer inspection revealed that the majority of individual variation was in a small portion of the proteins (minor bands). The majority of males (74%) expressed both major and minor protein bands, and visual inspection of gels suggested that there was very little, if any, variation in the major bands. Major bands were produced by most (≥67%) individuals, whereas minor bands were expressed in fewer (≤26%) individuals, and while 71% (47/66) of individuals expressed a unique minor band MUP profile, only 12% (8/66) of individuals expressed a unique MUP profile at major bands. This finding indicates that most of the MUP profiles (major bands) are not variable between individuals, and since the variation mainly occurs at the minor bands, these are potential candidates for individual signatures.
Overall MUP profiles of individuals were variable within as well as between the eight populations and almost all individuals (97%) expressed unique MUP profiles within their population. Again, more individuals expressed a unique MUP profile at minor bands (83%) than at major bands (36%). As expected, we found more similarity in MUP profiles within than between populations. This finding suggests that MUP profile similarity increases with relatedness (see below); however, it also suggests that studies using mice interbred from different populations could artificially inflate MUP variation and potentially confound MUP variation and other genetic differences that occur among populations (e.g., Hurst et al., 2001; Cheetham et al., 2007; Sherborne et al., 2007; Thom et al., 2007). Although we found greater similarity of individual MUP profiles within than between populations, we found no evidence for a “population signature” based on presence/absence of any particular MUP band, contrary to the suggestion that each population has its own unique MUP profile signature (Payne et al., 2001). Furthermore, MUP profile similarity did not decline with geographic distance between populations, contrary to what we expected.
Our longitudinal study on urinary protein concentration and MUP profile dynamics provides first evidence that MUP concentration increases significantly during puberty, and then stabilizes during adulthood. Liver MUP expression is testosterone-dependent and under the control of pulsatile growth hormone release (Knopf et al., 1983; Norstedt and Palmiter, 1984; Isseroff et al., 1986; Macleod et al., 1991), and this increase in MUP concentration is likely due to endocrinological changes during maturation. Interestingly, creatinine-adjusted MUP concentration (PC ratio, which controls for renal activity and urine dilution) remained constant during puberty and adulthood. Thus, as a mouse grows, the relationship between protein and creatinine production remains constant, even though MUP production increases with age. Therefore, MUP production provides an informative measure to study MUP dynamics. However, to compare MUP production between individuals of the same age (cross-sectional analysis), we suggest using PC ratios, as this relationship is surprisingly invariant within individuals over their life span and yet differs between individuals.
To mediate individual recognition, MUP profiles must be highly consistent within individuals over time, as well as highly variable among individuals. We found that MUP profiles show a considerable amount of intra-individual variation (on average 10%) before as well as after puberty. Although we found evidence for statistically significant clustering within vs. between individual MUP profiles, the clustering was surprisingly moderate (see Figure 2), contrary to what we expected. This result does not support the hypothesis the MUP profiles provide individual “barcodes” and suggests that MUP profiles may be too dynamic to facilitate individual recognition (and especially through chemosensory imprinting Hepper, 1986). MUP profile dynamics can be explained, at least in part, by an increase in the number of MUP bands with sexual maturation, which stabilized during adulthood. Number of major and minor bands increased significantly during puberty, but whereas the number of major bands stabilized during adulthood, the number of minor bands continued to increase also during adulthood. Additionally, we found a positive association between an individual's number of MUP bands and MUP concentration (but not PC ratio), though protein amount of single bands did not change over the sampling period. This result could be explained by expression of new MUP bands with sexual maturation, rather than single bands increasing in concentration, and some isoforms (especially those in minor bands) appearing only in later life. Our findings suggest that MUP profiles are surprisingly dynamic, contrary to the barcode hypothesis, and thus advocate a different function of MUP profiles in individual recognition. Future studies are needed to determine endocrine changes or other proximate mechanisms that explain their dynamics.
In our study on MUP profile consistency, we found that brothers were significantly more similar to each other in the absolute amount of MUPs excreted compared to unrelated males. This finding suggests that variation in MUP production may be influenced by genetic variation, but since we did not find such a difference using adjusted MUP concentration (PC ratio), our finding may be explained by brothers being more similar in body mass than unrelated males. We also found that MUP profiles and number of expressed MUP bands are more similar between brothers than between unrelated males, which supports our finding on higher similarity of MUP profiles within than between mouse populations.
Our results raise several new questions that need to be addressed in future studies. First, if individuals do not produce their own unique MUP profiles, the hypothesis that MUPs control individual odor (Hurst et al., 2001) should be reconsidered. Mice can discriminate individuals by their urine odor, even among individuals of the same inbred strain (Penn and Potts, 1998) that have identical MUP profiles (Cheetham et al., 2009), which indicates that variation in MUPs is not necessary for individual discrimination. One study on wild-derived house mice investigated sniffing and scent marking of males in response to urine samples from males with same or different MUP profile (Hurst et al., 2001). Males sniffed and scent marked more in response to urine from unrelated males, but also in response to marks from brothers with a different MUP profile and scent marked more in response to their own urine spiked with recombinant MUP (Hurst et al., 2001). The authors concluded that mice can detect differences in urinary MUP profiles; however, this study was based on a small sample size (N = 9) and the authors did not control for the extent of dissimilarity between MUP profiles. A recent study indirectly addressed whether MUPs influence individual odor by investigating countermarking in response to artificial scent marks composed of different ligand-free recombinant MUP isoforms (Kaur et al., 2014). Some mixtures of MUP isoforms (those containing mostly “non-self MUPs”) promoted countermarking, whereas others (those containing mainly “self MUPs”) did not. Also, recombinant MUP3 and MUP20 invariably (alone and in any mixture) elicited aggressive behavior in a resident-intruder assay when swabbed on castrated males. The authors concluded that presence/absence of single MUP isoforms influence individual odor presenting a combinatorial code to promote appropriate social behavior (Kaur et al., 2014). Thus, variation in MUP profiles is not necessary for mice to differentiate individuals by their urinary odor, and though MUPs may facilitate discrimination in mice, these urinary cues may only facilitate self vs. non-self (and kin versus non-kin) recognition. Variation in MUPs may mainly amplify individual differences in volatile ligands (Röck et al., 2006; Kwak et al., 2012) and future studies are needed to address this question in wild mice. Studies on volatile compounds have more general implications for explaining individual odor (Penn et al., 2007) than MUPs because most species only have one Mup gene (Logan et al., 2008).
Second, we found that brothers are more likely to have similar MUP profiles than non-brothers, which is the first such evidence to our knowledge, though future studies are needed to measure the heritability of MUP production and profiles, and especially address the possibility of genetic kin recognition based on MUP profile similarity. The diversity of kin recognition genes may be selectively maintained by disassortative mating (Penn and Potts, 1999) and one study on house mice living in semi-natural enclosures found evidence for disassortative mating at MUP-linked markers which might function to facilitate kin recognition and inbreeding avoidance (Sherborne et al., 2007). However, contrary to this prediction, there was no significant deficiency in successful matings between full siblings, and therefore, disassortative mating at MUP-linked markers did not result in inbreeding avoidance. Another possibility is that disassortative mating could promote outbreeding, especially if different populations express different MUPs. Although we found no evidence for a “population signature,” MUP profiles within populations were more similar than between populations and interbreeding would be expected to increase MUP diversity.
Third, it is often claimed that MUPs are encoded by “highly polymorphic genes” (Robertson et al., 1996, 1997; Hurst et al., 2001); however, no data have been provided to support these claims and recent work suggests that Mup genes may be unusually monomorphic. Genetic surveys revealed high sequence similarity at the cDNA and protein level [82–94% for peripheral, ancestral MUPs (Class A MUPs) to greater than 97% for central, recently duplicated MUPs (Class B MUPs) (Logan et al., 2008)] and some MUPs differ only by single amino acid changes (Logan et al., 2008; Mudge et al., 2008). A recent study compared sequence similarity at the gene and protein level for all 21 Mup genes listed in the MGI reference genome database (Phelan et al., 2014) and found that all 15 central Mup genes encode proteins that differ by a maximum of three amino acids with 5 genes encoding for the same mature protein (Phelan et al., 2014). Also, 19 of 20 cavity residues are conserved for these 15 central Mup genes. These findings challenge claims that Mup genes are highly polymorphic and therefore influence highly unique MUP profiles and individual odors (Robertson et al., 1996, 1997; Beynon et al., 2002; Mudge et al., 2008). The genetics of the MUP cluster remains elusive and studies are needed to determine how variation in Mup genes influences MUP profiles. Variation in MUP profiles may be due to copy number variation of Mup loci in addition to or rather than allelic variation. Also, individual variation in MUP profiles is not necessarily genetically determined, contrary to what is often assumed (Hurst et al., 2001; Cheetham et al., 2009), and MUP expression appears to be under epigenetic control (Howlett and Reik, 1991; Reik et al., 1993; Roemer et al., 1997). In a recent paper, Kaur et al. (2014) provided a key to compare previous Mup gene nomenclature with the MGI reference genome database, as earlier studies used inconsistent nomenclature of Mup genes, mRNAs and protein isoforms which complicated comparisons between studies (see Logan et al., 2008 Figure 1 vs. Mudge et al., 2008 Figure 7). Genomic studies are needed to elucidate regulation, expression, as well as the extent and functional significance of polymorphism of Mup genes (e.g., if Mup genes are polymorphic, then studies are needed to determine how selection maintains genetic diversity Penn and Frommen, 2010; Holman et al., 2013). Thus, our findings indicate that MUP profiles are variable and more similar between kin than non-kin in wild house mice, however, studies are still needed to assess Mup genetic diversity and variation in MUP proteins should not be extrapolated to measure allelic diversity of Mup genes.
Finally, the barcode hypothesis was based on observations of variation in MUP profiles of wild mice using IPG gels (Robertson et al., 1997; Pes et al., 1999; Payne et al., 2001), and though our findings do not support these claims, it is feasible that using higher resolution proteomic analyses will provide different results. It is generally assumed that IPG gels provide an accurate method to assess variation in MUP proteins, and that different IPG bands represent different isoforms (or combinations of isoforms) (Robertson et al., 1997), but as we previously pointed out, these assumptions have never been demonstrated to our knowledge. Some IPG bands may contain multiple isoforms (two or more proteins with similar structure and migration behavior on IPG gels, but originating from different genes). Proteomic studies using mass spectrometry are needed to identify the MUPs contained in IPG bands and determine whether and to what extent variation in MUP profiles correlates with actual protein diversity. Proteomic analyses may reveal greater individual diversity than we detected in our study, but they may also show more dynamic changes in individual MUP profiles. Studies are currently under way to examine variation of MUP profiles using proteomic methods (Beynon et al., 2014), which will hopefully help resolve these questions.
Taken together, our findings challenge the assumptions of the barcode hypothesis and show that although individual MUP profiles are very variable among individuals, they are not highly consistent or repeatable within individuals supporting the “dynamic changes” hypothesis. Nonetheless, MUP profiles showed moderate individual clustering, and therefore, we suggest that MUPs might contribute to an individual ‘odor signature’ in addition to other compounds in urine and other secretions, vocalizations (Hoffmann et al., 2012), or other phenotypes for individual recognition. Future studies integrating genetics, proteomics and behavioral research are needed to study the mechanisms and functions of MUP profile dynamics.
Author Contributions
DP and MT designed the study, KL and MT performed trapping and sampling, IM and MT conducted IEF, MA and MT analyzed the data, DP and MT wrote the paper. All authors approved the final manuscript.
Conflict of Interest Statement
The authors declare that the research was conducted in the absence of any commercial or financial relationships that could be construed as a potential conflict of interest.
Acknowledgments
We thank the Biologische Station Illmitz, Austria and the various farmers for access to their premises and T. Klaus, E. Straßer, K. Thonhauser, W. Vogl and F. Hölzl for invaluable help with trapping. We are grateful to M. Kalcounis-Ruppell for help with NMDS analysis. This work was funded by the Austrian Science Fund (FWF): P24711-B21.
Supplementary Material
The Supplementary Material for this article can be found online at: http://journal.frontiersin.org/article/10.3389/fevo.2015.00071
References
Armstrong, S. D., Robertson, D. H., Cheetham, S. A., Hurst, J. L., and Beynon, R. J. (2005). Structural and functional differences in isoforms of mouse major urinary proteins: a male-specific protein that preferentially binds a male pheromone. Biochem. J. 391, 343–350. doi: 10.1042/Bj20050404
Beynon, R. J., Armstrong, S. D., Gomez-Baena, G., Lee, V., Simpson, D., Unsworth, J., et al. (2014). The complexity of protein semiochemistry in mammals. Biochem. Soc. Trans. 42, 837–845. doi: 10.1042/Bst20140133
Beynon, R. J., Veggerby, C., Payne, C. E., Robertson, D. H. L., Gaskell, S. J., Humphries, R. E., et al. (2002). Polymorphism in major urinary proteins: Molecular heterogeneity in a wild mouse population. J. Chem. Ecol. 28, 1429–1446. doi: 10.1023/A:1016252703836
Bradford, M. M. (1976). A rapid and sensitive method for the quantitation of microgram quantities of protein utilizing the principle of protein-dye binding. Anal. Biochem. 72, 248–254. doi: 10.1016/0003-2697(76)90527-3
Cheetham, S. A., Smith, A. L., Armstrong, S. D., Beynon, R. J., and Hurst, J. L. (2009). Limited variation in the Major Urinary Proteins of laboratory mice. Physiol. Behav. 96, 253–261. doi: 10.1016/j.physbeh.2008.10.005
Cheetham, S. A., Thom, M. D., Jury, F., Ollier, W. E. R., Beynon, R. J., and Hurst, J. L. (2007). The genetic basis of individual-recognition signals in the mouse. Curr. Biol. 17, 1771–1777. doi: 10.1016/j.cub.2007.10.007
Clissold, P. M., Hainey, S., and Bishop, J. O. (1984). Messenger RNAs coding for mouse major urinary proteins are differentially induced by testosterone. Biochem. Genet. 22, 379–387.
Flower, D. R. (1996). The lipocalin protein family: structure and function. Biochem. J. 318(Pt 1), 1–14.
Garratt, M., Stockley, P., Armstrong, S. D., Beynon, R. J., and Hurst, J. L. (2011). The scent of senescence: sexual signalling and female preference in house mice. J. Evol. Biol. 24, 2398–2409. doi: 10.1111/j.1420-9101.2011.02367.x
Giller, K., Huebbe, P., Doering, F., Pallauf, K., and Rimbach, G. (2013). Major urinary protein 5, a scent communication protein, is regulated by dietary restriction and subsequent re-feeding in mice. Proc. R. Soc. B Biol. Sci. 280:20130101 doi: 10.1098/rspb.2013.0101
Hainey, S., and Bishop, J. O. (1982). Allelic variation at several different genetic-loci determines the major urinary protein phenotype of inbred mouse strains. Genet. Res. 39, 31–39.
Harvey, S., Jemiolo, B., and Novotny, M. (1989). Pattern of volatile compounds in dominant and subordinate male mouse urine. J. Chem. Ecol. 15, 20612072. doi: 10.1007/BF01207438
Hepper, P. G. (1986). Kin recognition: functions and mechanisms. A review. Biol. Rev. Camb. Philos. Soc. 61, 63–93.
Hoffmann, F., Musolf, K., and Penn, D. J. (2012). Spectrographic analyses reveal signals of individuality and kinship in the ultrasonic courtship vocalizations of wild house mice. Physiol. Behav. 105, 766–771. doi: 10.1016/j.physbeh.2011.10.011
Holman, L., Van Zweden, J. S., Linksvayer, T. A., and D'ettorre, P. (2013). Crozier's paradox revisited: maintenance of genetic recognition systems by disassortative mating. BMC Evol. Biol. 13:211. doi: 10.1186/1471-2148-13-211
Howlett, S. K., and Reik, W. (1991). Methylation levels of maternal and paternal genomes during preimplantation development. Development 113, 119–127.
Hurst, J. L. (2005). “Scent marking and social communication,” in Animal Communication Networks, ed P. K. Mcgregor (Cambridge: Cambridge University Press), 219–243.
Hurst, J. L., Payne, C. E., Nevison, C. M., Marie, A. D., Humphries, R. E., Robertson, D. H. L., et al. (2001). Individual recognition in mice mediated by major urinary proteins. Nature 414, 631–634. doi: 10.1038/414631a
Ilmonen, P., Penn, D. J., Damjanovich, K., Clarke, J., Lamborn, D., Morrison, L., et al. (2008). Experimental infection magnifies inbreeding depression in house mice. J. Evol. Biol. 21, 834–841. doi: 10.1111/j.1420-9101.2008.01510.x
Isseroff, H., Sylvester, P. W., and Held, W. A. (1986). Effects of Schistosoma Mansoni on androgen regulated gene expression in the mouse. Mol. Parasitol. 18, 401–412. doi: 10.1016/0166-6851(86)90096-4
Janotova, K., and Stopka, P. (2009). Mechanisms of chemical communication: the role of major urinary proteins. Folia Zool. 58, 41–55.
Janotova, K., and Stopka, P. (2011). The level of major urinary proteins is socially regulated in wild Mus musculus musculus. J. Chem. Ecol. 37, 647–656. doi: 10.1007/s10886-011-9966-8
Kaur, A. W., Ackels, T., Kuo, T.-H., Cichy, A., Dey, S., Hays, C., et al. (2014). Murine pheromone proteins constitute a context-dependent combinatorial code governing multiple social behaviors. Cell 157, 676–688. doi: 10.1016/j.cell.2014.02.025
Knopf, J. L., Gallagher, J. F., and Held, W. A. (1983). Differential, multihormonal regulation of the mouse major urinary protein gene family in the liver. Mol. Cell. Biol. 3, 2232–2240.
Kwak, J., Grigsby, C. C., Preti, G., Rizki, M. M., Yamazaki, K., and Beauchamp, G. K. (2013). Changes in volatile compounds of mouse urine as it ages: their interactions with water and urinary proteins. Physiol. Behav. 120, 211–219. doi: 10.1016/j.physbeh.2013.08.011
Kwak, J., Grigsby, C. C., Rizki, M. M., Preti, G., Koeksal, M., Josue, J., et al. (2012). Differential binding between volatile ligands and major urinary proteins due to genetic variation in mice. Physiol. Behav. 107, 112–120. doi: 10.1016/j.physbeh.2012.06.008
Litvinova, E. A., Kudaeva, O. T., Mershieva, L. V., and Moshkin, M. P. (2005). High level of circulating testosterone abolishes decline in scent attractiveness in antigen-treated male mice. Anim. Behav. 69, 511–517. doi: 10.1016/j.anbehav.2004.05.014
Logan, D. W., Marton, T. F., and Stowers, L. (2008). Species specificity in major urinary proteins by parallel evolution. PLoS ONE 3:e3280. doi: 10.1371/journal.pone.0003280
Macleod, J. N., Pampori, N. A., and Shapiro, B. H. (1991). Sex differences in the ultradian pattern of plasma growth hormone concentrations in mice. J. Endocrinol. 131, 395–399. doi: 10.1677/joe.0.1310395
Marie, A. D., Veggerby, C., Robertson, D. H. L., Gaskell, S. J., Hubbard, S. J., Martinsen, L., et al. (2001). Effect of polymorphisms on ligand binding by mouse major urinary proteins. Protein Sci. 10, 411–417. doi: 10.1110/ps.31701
Meagher, S., Penn, D. J., and Potts, W. K. (2000). Male-male competition magnifies inbreeding depression in wild house mice. Proc. Natl. Acad. Sci. U.S.A. 97, 3324–3329. doi: 10.1073/pnas.060284797
Milinski, M. (2006). The major histocompatibility complex, sexual seleciton and mate choice. Ann. Rev. Ecol. Evol. Syst. 37, 159–186. doi: 10.1146/annurev.ecolsys.37.091305.110242
Mode, A., Gustafsson, J. A., Jansson, J. O., Eden, S., and Isaksson, O. (1982). Association between plasma-level of growth-hormone and sex-differentiation of hepatic-steroid metabolism in the rat. Endocrinology 111, 1692–1697.
Mudge, J. M., Armstrong, S. D., Mclaren, K., Beynon, R. J., Hurst, J. L., Nicholson, C., et al. (2008). Dynamic instability of the major urinary protein gene family revealed by genomic and phenotypic comparisons between C57 and 129 strain mice. Genome Biol. 9:R91. doi: 10.1186/gb-2008-9-5-r91
Norstedt, G., and Palmiter, R. (1984). Secretory rhythm of growth hormone regulates sexual differentiation of mouse liver. Cell 36, 805–812. doi: 10.1016/0092-8674(84)90030-8
Novikov, S. N., Churakov, G. A., Philimonenko, A. A., Ermakova, I. I., Fedorova, E. M., and Burkot, I. A. (2009). The pattern of major urinary proteins (MUPS) expression during postnatal ontogenesis of the laboratory mouse depends on genotype and sex. Russ. J. Develop. Biol. 40, 204–211. doi: 10.1134/S1062360409040031
Novotny, M. V. (2003). Pheromones, binding proteins and receptor responses in rodents. Biochem. Soc. Trans. 31, 117–122. doi: 10.1042/BST0310117
Novotny, M. V., Ma, W., Zidek, L., and Daev, E. (1999). “Recent biochemical insights into puberty acceleration, estrus induction and puberty-delay in the house mouse,” in Advances in Chemical Signals in Vertebrates, eds R. E. Johnston, D. Müller-Schwarze and P. Sorenson (New York, NY: Plenum Publishers), 99–116.
Oksanen, J., Blanchet, F. G., Kindt, R., Legendre, P., Minchin, P. R., O'hara, R. B., et al. (2013). Vegan: Community Ecology Package. R package version 2.0-7 ed.
Osada, K., Tashiro, T., Mori, K., and Izumi, H. (2008). The identification of attractive volatiles in aged male mouse urine. Chem. Senses 33, 815–823. doi: 10.1093/chemse/bjn045
Payne, C. E., Malone, N., Humphries, R., Bradbrook, C., Veggerby, C., Beynon, R. J., et al. (2001). “Heterogeneity of major urinary proteins in house mice: population and sex differences,” in Chemical Signals in Vertebrates 9, eds A. Marchlewska-Koj, J. J. Lepri, and D. Müller-Schwarze (New York, NY: Springer), 233–240.
Penn, D. J. (2002). The scent of genetic compatibility: sexual selection and the major histocompatibility complex. Ethology 108, 1–21. doi: 10.1046/j.1439-0310.2002.00768.x
Penn, D. J., and Frommen, J. G. (2010). “Kin recognition: an overview of conceptual issues, mechanisms and evolutionary theory,” in Behavior: Mechanisms and Functions, ed P. Kappeler (Berlin; Heidelberg: Springer), 55–85. doi: 10.1007/978-3-642-02624-9_3
Penn, D. J., Oberzaucher, E., Grammer, K., Fischer, G., Soini, H. A., Wiesler, D., et al. (2007). Individual and gender fingerprints in human body odour. J. R. Soc. Interface 4, 331–340. doi: 10.1098/rsif.2006.0182
Penn, D., and Potts, W. (1998). Untrained mice discriminate MHC-Determined odors. Physiol. Behav. 63, 235–243. doi: 10.1016/S0031-9384(98)00052-3
Penn, D., and Potts, W. (1999). The evolution of mating preferences and major histocompatibility complex genes. Am. Nat. 153, 145–164. doi: 10.1086/303166
Pes, D., Robertson, D. H. L., Hurst, J. L., Gaskell, S. J., and Beynon, R. (1999). “How many major urinary proteins are produced by the house mouse Mus domesticus?,” in Advances in Chemical Signals in Vertebrates, eds R. Johnston, D. Müller-Schwarze and P. Sorensen. (New York, NY: Kluwer Academic/Plenum Publishers), 149–161.
Phelan, M. M., Mclean, L., Hurst, J. L., Beynon, R. J., and Lian, L. Y. (2014). Comparative study of the molecular variation between 'central' and 'peripheral' MUPs and significance for behavioural signalling. Biochem. Soc. Trans. 42, 866–872. doi: 10.1042/BST20140082
R Core Team. (2014). R: A Language and Environment for Statistical Computing. Vienna: R Foundation for Statistical Computing.
Reik, W., Romer, I., Barton, S. C., Surani, M. A., Howlett, S. K., and Klose, J. (1993). Adult phenotype in the mouse can be affected by epigenetic events in the early embryo. Development 119, 933–942.
Roberts, S. C. (2009). Complexity and context of MHC-correlated mating preferences in wild populations. Mol. Ecol. 18, 3121–3123. doi: 10.1111/j.1365-294X.2009.04244.x
Robertson, D. H., Hurst, J. L., Bolgar, M. S., Gaskell, S. J., and Beynon, R. J. (1997). Molecular heterogeneity of urinary proteins in wild house mouse populations. Rapid Commun. Mass Spectrom. 11, 786–790. doi: 10.1002/(SICI)1097-0231(19970422)11:7<786::AID-RCM876>3.0.CO;2-8
Robertson, D. H. L., Cox, K. A., Gaskell, S. J., Evershed, R. P., and Beynon, R. J. (1996). Molecular heterogeneity in the major urinary proteins of the house mouse Mus musculus. Biochem. J. 316, 265–272.
Röck, F., Mueller, S., Weimar, U., Rammensee, H. G., and Overath, P. (2006). Comparative analysis of volatile constituents from mice and their urine. J. Chem. Ecol. 32, 1333–1346. doi: 10.1007/s10886-006-9091-2
Roemer, I., Reik, W., Dean, W., and Klose, J. (1997). Epigenetic inheritance in the mouse. Curr. Biol. 7, 277–280. doi: 10.1016/s0960-9822(06)00124-2
Schwende, F. J., Wiesler, D., Jorgenson, J. W., Carmack, M., and Novotny, M. (1986). Urinary volatile consituents of the house mouse, Mus musculus, and their endocrine dependency. J. Chem. Ecol. 12, 277–296.
Shahan, K., Denaro, M., Gilmartin, M., Shi, Y., and Derman, E. (1987). Expression of six mouse major urinary protein genes in the mammary, parotid, sublingual, submaxillary, and lachrymal glands and in the liver. Mol. Cell. Biol. 7, 1947–1954.
Sharrow, S. D., Vaughn, J. L., Zidek, L., Novotny, M. V., and Stone, M. J. (2002). Pheromone binding by polymorphic mouse major urinary proteins. Protein Sci. 11, 2247–2256. doi: 10.1110/ps.0204202
Sherborne, A. L., Thom, M. D., Paterson, S., Jury, F., Ollier, W. E. R., Stockley, P., et al. (2007). The genetic basis of inbreeding avoidance in house mice. Curr. Biol. 17, 1–6. doi: 10.1016/j.cub.2007.10.041
Stopková, R., Stopka, P., Janotová, K., and Jedelský, P. L. (2007). Species-specific expression of major urinary proteins in the house mice (Mus musculus musculus and Mus musculus domesticus). J. Chem. Ecol. 33, 861–869. doi: 10.1007/s10886-007-9262-9
Szoka, P. R., and Paigen, K. (1978). Regulation of mouse major urinary protein production by the Mup-A gene. Genetics 90, 597–612.
Thom, M. D., Stockley, P., Beynon, R. J., and Hurst, J. L. (2007). “Scent, Mate Choice and Genetic Heterozygosity,” in Chemical Signals in Vertebrates, ed J. L. Hurst (New York, NY: Springer), 291–301.
Thoß, M., Ilmonen, P., Musolf, K., and Penn, D. J. (2011). Major histocompatibility complex heterozygosity enhances reproductive success. Mol. Ecol. 20, 1546–1557. doi: 10.1111/j.1365-294X.2011.05009.x
Timm, D. E., Baker, L. J., Mueller, H., Zidek, L., and Novotny, M. V. (2001). Structural basis of pheromone binding to mouse major urinary protein (MUP-I). Protein Sci. 10, 997–1004. doi: 10.1110/ps.52201
Veggerby, C., Payne, C. E., Gaskell, S. J., Robertson, D. H. L., Hurst, J., and Beynon, R. (2001). “Polymorphic variants of mouse major urinary proteins,” in Chemical Signals in Vertebrates, eds A. Marchlewska-Koj, J. J. Lepri and D. Müller-Schwarze (New York, NY: Kluwer Academic/Plenum Publishers), 157–163.
Keywords: major urinary proteins, barcode hypothesis, individual recognition, intra-individual consistency, inter-individual variation, Mus musculus musculus
Citation: Thoß M, Luzynski KC, Ante M, Miller I and Penn DJ (2015) Major urinary protein (MUP) profiles show dynamic changes rather than individual “barcode” signatures. Front. Ecol. Evol. 3:71. doi: 10.3389/fevo.2015.00071
Received: 17 April 2015; Accepted: 15 June 2015;
Published: 30 June 2015.
Edited by:
Carla Mucignat, University of Padova, ItalyReviewed by:
Archunan Govindarju, Bharathidasan University, IndiaPatricia Nagnan-Le Meillour, Institut National de la Recherche Agronomique, France
Pavel Stopka, Charles University in Prague, Czech Republic
Copyright © 2015 Thoß, Luzynski, Ante, Miller and Penn. This is an open-access article distributed under the terms of the Creative Commons Attribution License (CC BY). The use, distribution or reproduction in other forums is permitted, provided the original author(s) or licensor are credited and that the original publication in this journal is cited, in accordance with accepted academic practice. No use, distribution or reproduction is permitted which does not comply with these terms.
*Correspondence: Michaela Thoß, Department of Integrative Biology and Evolution, Konrad Lorenz Institute of Ethology, University of Veterinary Medicine Vienna, Savoyenstraße 1, 1160 Vienna, Austria,bWljaGFlbGEudGhvc3NAdmV0bWVkdW5pLmFjLmF0