 Jason G. Morrow1
 David R. Huggins
 John P. Reganold
- 1Department of Crop and Soil Sciences, Washington State University, Pullman, WA, USA
- 2Northwest Sustainable Agroecosystems Research Unit, Agricultural Research Service (USDA), Pullman, WA, USA
Soil organic matter (SOM) is a key indicator of agricultural productivity and overall soil health. Currently, dryland cropping systems of the inland Pacific Northwest (iPNW) span a large gradient in mean annual temperature (MAT) and precipitation (MAP). These climatic drivers are major determinants of surface SOM dynamics and storage characteristics. Future climate change projections through 2070 indicate significant shifts in MAT and MAP for the iPNW. We assessed surface (0–10 cm) soil organic C and N as well as active and recalcitrant fractions of SOM within long-term experiments representing different tillage regimes and cropping intensities across the current climatic gradient of the iPNW. We discovered that current levels of soil C and N as well as various SOM fractions were positively correlated with MAP and negatively correlated with MAT. Furthermore, these climatic drivers were more influential than either tillage regime or cropping intensity in determining SOM levels and characteristics. Soil organic C and total N as well as the hydrolyzable and non-hydrolyzable fractions were negatively correlated with the current ratio of MAT to MAP, called the climate ratio. Future climate projections (2030 and 2070) forecast an increase of the climate ratio, thus predicting declines in surface SOM and associated soil health across the iPNW.
Introduction
Mean annual temperature (MAT) and precipitation (MAP) are major climatic drivers of SOM levels and dynamics. Jenny (1941) classically compared SOM levels of grassland soils across the MAT and MAP gradients of the North American Great Plains. Here, the greatest SOM levels occurred in northern regions and decreased as MAT increased to the south, while SOM increased from west-to-east in response to regional increases in MAP. Significant climatic gradients also span the dryland cropping region of the inland Pacific Northwest (iPNW). Here, MAP ranges from a low of 150 mm in south-central Washington and increases along a west-to-east gradient to a high of 600 mm in eastern Washington and northern Idaho (Schillinger et al., 2006). A MAT gradient runs inversely to the MAP gradient, ranging from 8.4°C in the wetter regions of eastern Washington and northern Idaho to 10.9°C in the drier regions of south-central Washington (Schillinger et al., 2006).
Integral to many soil functions and properties, SOM is a major component of soil productivity and overall agroecosystem performance. Consequently, climatic gradients and potential future changes in climate represent important drivers of soil health. In water-limited regions, such as the iPNW, precipitation drives biomass production, soil C inputs, and positive correlations of SOM with MAP. Conversely, SOM decomposition rates are often accelerated by increasing temperatures and SOM is usually negatively correlated with MAT (Post et al., 1982; Wynn et al., 2006). Climate change models predict warmer and wetter springs in the iPNW and hotter, drier summers, translating to an increase in both MAP and MAT (Littell et al., 2009). Therefore, considering the interactive effects of MAP and MAT, future influences of climate change on SOM dynamics within the iPNW are unclear.
Informed management practices are essential to building resilient, healthy soils (Morrow et al., 2016). For example, soil disturbance with tillage generally promotes loss of SOM by facilitating microbial degradation of SOM, promoting crop-residue-soil contact, and placing residues into more favorable subsurface moisture regimes as compared to surface placement under no-tillage (Halvorson et al., 2002; Huggins et al., 2007). Tillage also creates a more oxidative environment and reduces soil aggregate stability, thereby decreasing physical protection mechanisms that promote SOM storage (Denef et al., 2004). Conversely, cropping system intensification that reduces fallow in dryland cropping systems can increase SOM (Halvorson et al., 2002). Therefore, practices that reduce soil disturbance and intensify cropping have the potential to increase SOM and improve soil health. Interactive effects of management and climate, however, on SOM in the iPNW for current situations and future projections are largely unquantified.
Different properties that capture and define meaningful characteristics and fractions of SOM can provide unique information about SOM and soil health. These include the active fraction of soil organic carbon (SOC) and total N (Franzluebbers and Arshad, 1996; Dou et al., 2008; Culman et al., 2013), permanganate oxidizable carbon (POXC) (Weil et al., 2003), soil microbial biomass C, and N (Powlson and Brookes, 1987), SOC mineralization (Franzluebbers et al., 2000), acid hydrolysis (Rovira and Vallejo, 2002), and water extractable C and N (Haney et al., 2012). Just as critical to soil function are soil processes that contribute to, or detract from, the nutrient supply associated with SOM mineralization. For example, potential N mineralization (PNM) represents an important source of crop available N, whereas denitrification represents not only a loss of N from the soil N pool, but also a source of nitrous oxide (N2O), a major greenhouse gas.
Our study focuses on the impact of present and future climatic variables (MAT and MAP) and long-term agricultural management on SOM dynamics in surface soils (0–10 cm) of the iPNW. Specifically, our objectives are to: (1) assess the impact of MAT and MAP gradients and interactions with tillage practice and cropping intensity on surface soil C and N characteristics, basal denitrification (BDR), potential denitrification (PDR), and potential N mineralization (PNM); and (2) predict the potential influence of future iPNW climate scenarios on these same soil C and N properties, thereby identifying future soil health challenges.
Methods
Site Descriptions
Four long-term and presently on-going agricultural research experiments within the dryland cropping region of the iPNW were used for our study (Table 1). Additional description of these sites can be found in Morrow et al. (2016). The four field experiments are located at the following research centers: Kambitsch Farm near Genesee, ID, operated by the University of Idaho; the Washington State University and USDA Palouse Conservation Field Station near Pullman, WA; the Columbia Basin Agricultural Research Center near Pendleton, OR; and the Columbia Basin Agricultural Research Center near Moro, OR. These long-term studies were selected based on the cropping systems present as well as the range of climatic conditions collectively represented by the sites. Together, these four locations span three agroecological classes (AECs), or land-use classifications that represent unique biophysical and socioeconomic conditions resulting in distinct cropping systems (Huggins et al., 2014): (1) annual cropping (limited annual fallow) represented by Kambitsch Farm and Palouse Conservation Field Station; (2) annual crop-fallow transition (e.g., 3-years rotations with fallow every third year) represented by the Pendleton Research Station; and (3) grain-fallow (e.g., 2-years wheat [Triticum aestivum L.]-fallow rotation) represented by the Moro Research Station.
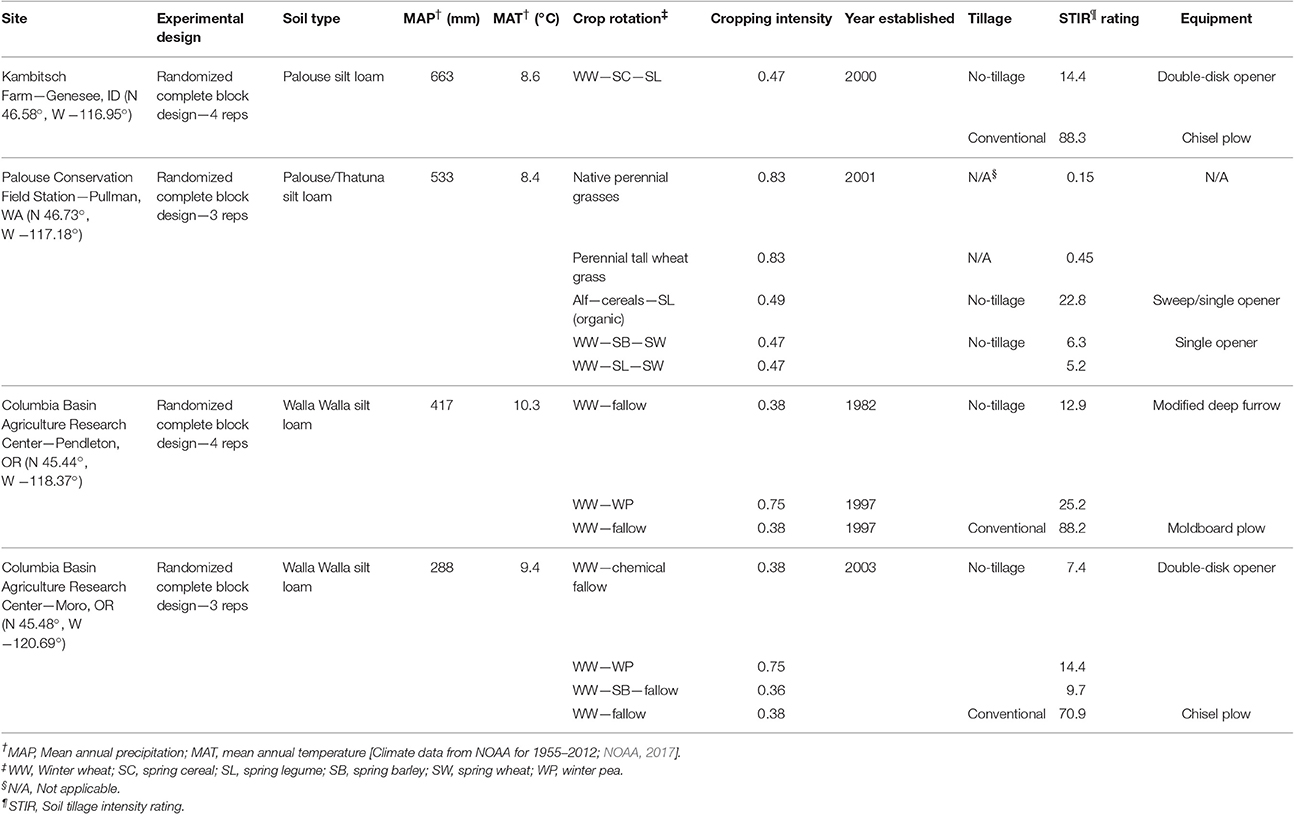
Table 1. Four study locations with climate, management, and site information.
Tillage and Cropping Intensity
The four study sites represent a range of tillage and cropping intensities. The Natural Resources Conservation Service (NRCS) soil tillage intensity rating (STIR) (USDA-NRCS, 2006) was applied to assess the soil disturbance in each treatment. The STIR rating captures the range and severity of soil disturbance caused by management operations over an entire crop rotation, from spraying herbicide to plowing, planting and harvesting. The final STIR value is annualized based on the operations required for the entire rotation (Table 1).
The NRCS establishes a STIR of 30 as the maximum value for no-tillage (NT) operations (USDA-NRCS, 2011). In the site descriptions and in subsequent tables, all treatments with a STIR exceeding 30 are referred to as conventional tillage (CT), while those under 30 are referred to as NT. The primary tillage implements for CT treatments are listed in Table 1.
Cropping intensity of each treatment was quantified according to the proportion of time there was growing crop cover (Table 1). Each crop or phase was assigned a value, and these values were averaged over the length of the rotation. The following cropping intensity values were applied: perennial crops—0.83 (10 of 12 months), fall planted, winter annual crops—0.75 (9 of 12 months), spring planted, annual crops—0.33 (4 of 12 months).
Soil Sampling and Analyses
Each site was sampled in June or July of 2013 prior to harvest from 0- to 10-cm depth, collecting 50–60 samples across each plot using a hand-operated soil probe (1.8 cm inside diameter). Four cores (3.0 cm inside diameter) were also collected from 0- to 10-cm depth from each subject plot using a hand-operated soil probe to determine soil bulk density and gravimetric water content. All samples were immediately placed on ice in the field and transferred to cold storage at 4°C until further processing.
Laboratory Analysis
Soil Preparation
Unless otherwise noted, all analyses were performed on soil samples weighed to an oven-dry (105°C for 48 h) mass equivalence. Where required for analysis, field capacity was estimated by texture as 250 g water per kg soil for all four sites (Table 1; Saxton and Rawls, 2006).
Soil Carbon and Nitrogen Fractionation
Total soil C and N were determined on air-dried soil sieved to 2.0 mm and subsequently roller-ground to a fine powder (Purakayastha et al., 2009). The analysis was performed by dry combustion using a CHN autoanalyzer (LECO CHN-1000, Leco Corp., St Joseph, MI, USA; Tabatabai and Bremner, 1970). Total soil C measured was all organic (SOC) as no inorganic C or carbonates were detected. Acid hydrolysis was performed as described by Paul et al. (1997) with modification. Soil was air-dried, sieved to 2.0 mm and roller-ground to a fine powder then refluxed at 115°C for 16 h with 6.0-M HCl. This suspension was then washed with deionized water through a glass-fiber filter and the recovered sample dried at 40°C for 72 h. Samples were then analyzed for total C and N as mentioned previously and the hydrolyzability of samples calculated based on a mass balance of SOC and total N before and after acid hydrolysis. Non-hydrolyzable C and N consists of C and N remaining in the sample and hydrolyzable C and N consists of the portion lost through hydrolysis.
Microbial biomass C and N (MBC, MBN) was performed on 10.0 g (dry weight) of soil using the chloroform fumigation-extraction method (Voroney et al., 2008). This method was performed on soil air-dried for 24 h then sieved to 2.0 mm. Soils were then brought to field capacity and incubated at 20°C for 48 h prior to fumigation with ethanol-free chloroform. Instead of a 0.5 M K2SO4 extractant, which is a source of interference for the Shimadzu TOC analyzer (Shimadzu TOC-V Analyzer with total N unit; Kyoto, Japan) used in this study, fumigated and non-fumigated soils were extracted using 30 ml of DI water, shaken for 30 min using an oscillating shaker then filtered through 0.2 μm nylon filter after centrifuging for 5 min at 1,500 × g. Using DI water instead of K2SO4 as the extractant has been shown to yield similar results (Ros et al., 2009). The filtrate was frozen until analyzing for C and N on a high-temperature combustion Shimadzu TOC analyzer.
Water extractable C (WEOC) and N (WEON) analyses were performed according to established laboratory protocol at the USDA-ARS Soil Biochemistry lab at Washington State University. In short, 12.5 ml of 18-MΩ water purified to remove C was added to 5.0 g of soil that was previously dried at 40°C for 24 h then sieved to 2.0 mm. This soil water mixture was shaken for 1 min on an oscillating shaker, centrifuged for 5 min at 2,950 × g, and then filtered through 0.2 μm nylon filter paper. The collected filtrate was frozen until analyzing for C and N on a high-temperature combustion TOC machine (Shimadzu TOC-V Analyzer with total N unit; Kyoto, Japan). Samples were also analyzed for inorganic N by extraction with 1.0 M KCl and subsequent analysis on a Lachat (Hach, Co; Loveland, CO). The WEON fraction was determined from subtracting out the inorganic N fraction. All C detected was considered representative of organic C as pH of all soils was <6.0, indicating no carbonates were present. Soil pH was measured on a 1:1 soil and water slurry with a Denver Instrument model 250 pH ISE conductivity benchtop meter and an Accumet #13-62-631 saturated KCl-filled, glass electrode (Van Lierop, 1990).
Permanganate oxidizable carbon (POXC) was quantified (Weil et al., 2003) in triplicate using 0.02 m KMnO4 on 2.5 g soil that was previously air dried for 24 h and sieved to 2.0 mm. Absorbance at 550 nm was measured on a Spectra Max M2 single cuvette reader.
Potential Carbon Mineralization
Carbon mineralization (Cmin) was performed on 5.0 g soil that was previously dried at 40°C for 24 h and sieved to 2.0 mm. Soil was packed to a dry bulk density of 1.0 g cm−3 in 40 ml glass vials with rubber top septa through which gas samples were collected using a syringe and needle at the designated times. Prior to bringing samples to field capacity, they were covered with Parafilm and incubated at 20°C for 24 h. After incubation, water was added to bring samples to field capacity, which was designated as time zero and gas samples were collected at 24 h, and 3, 10, 17, and 24 days. During gas sampling, vials with soils at field capacity were flushed with a breathing-air mixture containing approximately 200 ppm CO2, and gas samples were collected immediately after flushing on every tenth sample and 2 h after flushing from every sample. The CO2 evolution rate was calculated as the difference between average time zero CO2 and CO2 measured at 2 h (McLauchlan and Hobbie, 2004). Samples were analyzed on a gas chromatograph (Shimadzu GC-2014; Kyoto, Japan) equipped with an automated valve system for routing gas samples to the flame ionization (FID) detector. The data collected at 24 h with this methodology were intended to be comparable to the Solvita 24-h CO2 burst test (Haney et al., 2008). The microbial metabolic quotient, qCO2, was calculated from total carbon mineralized between day 10 and 24 per unit of MBC.
Potential Nitrogen Mineralization
Anaerobic N mineralization at 28 days was determined according to Curtin and Campbell (2008), with modification. Soils were sieved to 2.0 mm rather than 4.0 mm, and rather than using field moist soils, they were dried at 40°C for 24 h. Additionally, 5.0 g soil samples were incubated for 28 days with 12.5 ml of deionized water, enough water to submerge the soil and create anaerobic conditions, at a constant temperature of 40°C. Time zero samples were immediately extracted with 1 M KCl and inorganic N determined on a Lachat Autoanalyzer (Hach, Co; Loveland, CO). Incubated samples were extracted with 1 M KCl and analyzed in triplicate after 28 days incubation and inorganic N determined as with time zero samples. Potential N mineralization (PNM) was determined as the average difference between in samples at time zero and after incubation.
Basal and Potential Denitrification
Basal Denitrification (BDR) and potential denitrification (PDR) were performed in a manner similar to Drury et al. (2008), with modification. In preparation for this analysis field-moist soil, which had been stored at 4°C for <1 month, was sieved to 4 mm. Samples consisting of 20.0 g oven-dry equivalent soil were then weighed into half-pint wide-mouth canning jars, in triplicate. For both BDR and PDR, samples were incubated for 24 h at room temperature (20°C) to allow time for samples to equilibrate. Following this incubation period, BDR samples were brought to field capacity by the addition of the appropriate amount of deionized water, while a 25.0 ml solution containing 300 ug glucose-C g−1 soil and 50 ug NO3-Ng−1 soil was added to PDR samples. An anaerobic environment was created by flushing with N2 gas through the rubber septa for 60 s. Immediately following flushing, a headspace volume equivalent to 10% of the total headspace volume was removed and an equivalent amount of acetylene was injected through the rubber septa. Gas samples (9.0 ml) were collected for both BDR and PDR samples at 2 and 4 h and injected into 5.9-ml exetainers that had previously been flushed with N2. The N2O concentration of samples was measured on a gas chromatograph equipped with an automated valve system for routing gas samples to the electron capture (ECD) and flame ionization (FID) detectors. BDR and PDR rates are the slope of the regression line when plotted vs. time.
Statistical Analyses and Future Climate Scenarios and Ratios
Actual values of soil C and N properties and agricultural management treatment effects can be found in Morrow et al. (2016), whereas in this paper we are primarily using these data for correlation and regression analyses. Stepwise multivariate analysis using SAS (SAS Institute, 2014) was used to model the influence of climate variables and management factors on the soil C and N properties. Initial model entry was set at p < 0.25, with significance for variables remaining in the model set at p < 0.10. Pearson correlations were also determined for all variables in the study with significant correlations set at p < 0.10. A less rigorous alpha was selected due to the inherent spatial variability of many of the soil C and N properties measured. In consideration of this, an alpha of 0.10 was considered a judicious step toward minimizing type II errors (failing to reject a false null hypothesis).
Two climate scenarios form the basis for future climate in 2030 and 2070 at the four study sites. Representative concentration pathway (RCP) 4.5 represents moderate climate action (Thomson et al., 2011), while RCP 8.5 is a baseline scenario that assumes no target reduction in greenhouse gas emissions (Riahi et al., 2011). Using these two climate scenarios, projected MAT and MAP of each site for 2030 and 2070 were determined by averaging across the MAT and MAP outputs for each site from 19 to 20 climate models considered most appropriate for the iPNW and where data were available (data unavailable for one model). The climate data were from a statistical downscaling of global climate data from the Coupled Model Intercomparison Project 5 or CMIP5 (Taylor et al., 2011) utilizing the Multivariate Adaptive Constructed Analogs (MACA) method (Abatzoglou and Brown, 2012) and can be accessed at <http://maca.northwestknowledge.net/GCMs.php>. The resulting MAT and MAP of each site for 2030 and 2070 were then used to determine the future climate ratio, which is the ratio of MAT to MAP; subsequently a higher climate ratio indicates a warmer, drier climate. The present day relationship between the climate ratio and average SOC and total N at all sites was used to create a regression equation that was then used to predict SOC and total N using future climate ratios determined for each of the climate scenarios described.
Results and Discussion
Present Climate: Soil C and N
POXC, SOC, total N, HC, NHC, HN, and NHN had positive Pearson correlations with MAP, ranging from 0.7 to 0.84, whereas these same variables were negatively correlated, although less strongly, with MAT (Table 2). Variable means and treatment effects were previously reported (Morrow et al., 2016). The MAP/MAT had the greatest Pearson correlations with measured SOM-related variables ranging up to 0.88 (Table 2). MAP explained 57 and 69%, respectively, of the variation in SOC and total N in the multivariate regression analysis that also included MAT, STIR, and cropping intensity as explanatory variables (Table 3). When MAP was removed from the regression model, MAT was the dominant significant variable, explaining 42% of SOC variation and 49% of total N variation (Table 3). These data show that management variables of STIR and cropping intensity explained little of the variability in SOC and total N as compared to climate related variables (Table 3).
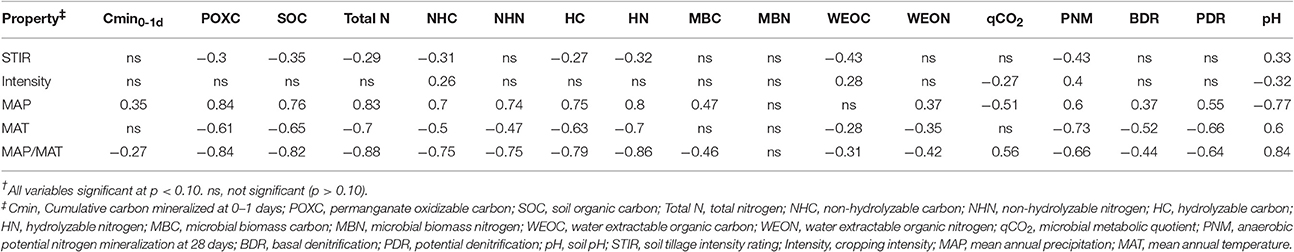
Table 2. Pearson correlations between soil properties, climate, and management across four study sites†.
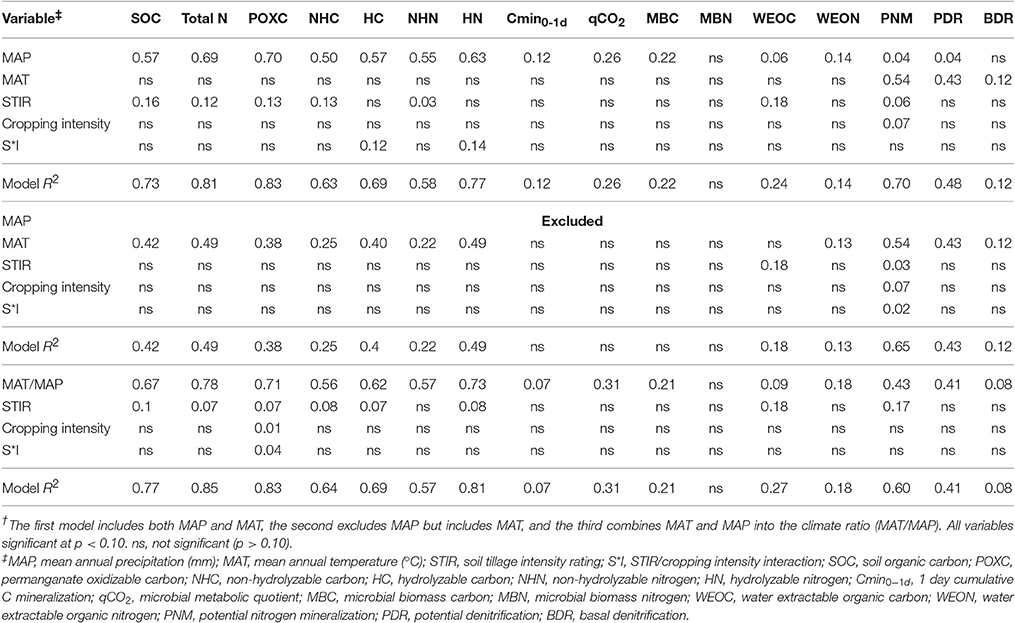
Table 3. Theree multivariate regression models of climate and management variables for soil C and N properties across four study sites†.
The hydrolyzable and non-hydrolyzable fractions of soil C and N are also correlated with MAP and MAT, similar to SOC and total N (Table 3). MAP explains 50% of NHC variation, 55% of NHN variation, and a slightly greater percent of variation in the hydrolyzable fraction, explaining 57% of HC variation and 63% of HN variation. As with SOC and total N, if MAP is removed from the model, MAT becomes the major significant factor in explaining the variation in the hydrolyzable and non-hydrolyzable fractions of SOC and total N (Table 3).
Some of the more labile soil properties measured in this study, including WEON, MBC, and Cmin0−1d, were positively correlated with MAP, whereas only WEON along with WEOC displayed a significant correlation with MAT (Table 2). The microbial metabolic quotient (qCO2) is an indicator of microbial efficiency, where increases in qCO2 indicate a decrease in microbial efficiency (Smith et al., 2002). In the present study, qCO2 had a negative relationship with MAP (Table 2), indicating a decrease in MAP was associated with a decrease in microbial efficiency. MAP was also an important factor, more so than management factors, in explaining the variation in MBC (r2 = 0.22), 1-day Cmin (r2 = 0.12), qCO2 (r2 = 0.26), and WEON (r2 = 0.14; Table 3). Variation in MBN was not explained by management or climate factors (Table 3). When MAP was removed from the model, MAT was not a signficant variable in explaining variation in these more active soil properties (Table 3).
The multivariate analysis of climate along with management indicates that soil C and N of surface soils within the scale covered by this study were influenced by MAP and MAT more so than tillage and cropping intensity. Similarly, Colman and Schimel (2013) found that on a continental scale across 84 different soils, MAP and MAT could explain 60% of the observed variation in SOC. Results also showed that more active soil C and N pools displayed lower or no significant relationship to MAT, whereas the more recalcitrant pools were strongly correlated with MAT (Table 2). These results are consistent with enzyme kinetic theory established by Arrhenius (Davidson and Janssens, 2006), which dictates that reactants with higher activation energies (recalcitrant SOM) have higher temperature sensitivities. In other words, as MAT increases across the temperature gradient, the more recalcitrant soil C and N pools experience a greater relative increase in decomposition rate compared to more labile SOM (Davidson and Janssens, 2006).
Present Climate: N Transformations
PNM, PDR, and BDR were all positively correlated with MAP and negatively correlated with MAT (Table 2). These trends between MAP, MAT, and soil N transformations reflect the opposing gradients of MAP and MAT across the iPNW. Greater MAP is associated with colder MAT and greater SOM accumulations and labile SOM constituents. Laboratory incubations occur under favorable environmental conditions for promoting soil N transformations and the results express the combined influence of MAT and MAP on SOM accumulations and consequent measures of PNM, BDR, and PDR.
Variability in N mineralization has been reported to be primarily correlated with MAT, MAP, as well as total N and N deposition (Chapman et al., 2013). In agreement with our results, Colman and Schimel (2013) concluded that the direct drivers of N mineralization were soil C and N as well as clay content and that precipitation drives N mineralization indirectly through its influence on soil C and N content. Regarding PDR, Niboyet et al. (2011) found that experimentally increasing precipitation 50% for 8 years resulted in a 22% increase in PDR, in agreement with the positive correlation of PDR with MAP found in our study. Niboyet et al. (2011) did not, however, detect sensitivity of PDR to warming of 1°C for 8 years. The MAT gradient in our study spans 1.9°C (Table 1) and the negative correlation of MAT with PDR represent long-term climatic conditions rather than short-term increases that have been experimentally induced.
Future Climate: Soil C and N Properties
Soil organic C and total N as well as the hydrolyzable and non-hydrolyzable fractions were negatively correlated with the ratio of MAT to MAP, called the climate ratio (Weil and Magdoff, 2004; Figure 1, Table 4). Here, SOC and total N along with the hydrolyzable and non-hydrolyzable fractions are greatest at the Palouse Conservation Field Station and Kambitsch Farm, where the climate ratio approaches one, and decrease as the climate ratio increases (Figure 1). Similarly, Weil and Magdoff (2004) reported the greatest SOC when the climate ratio is near one, decreasing as the ratio increases. Consequently, the climate ratio provides a simple indicator of future climate change effects on SOC and related properties.
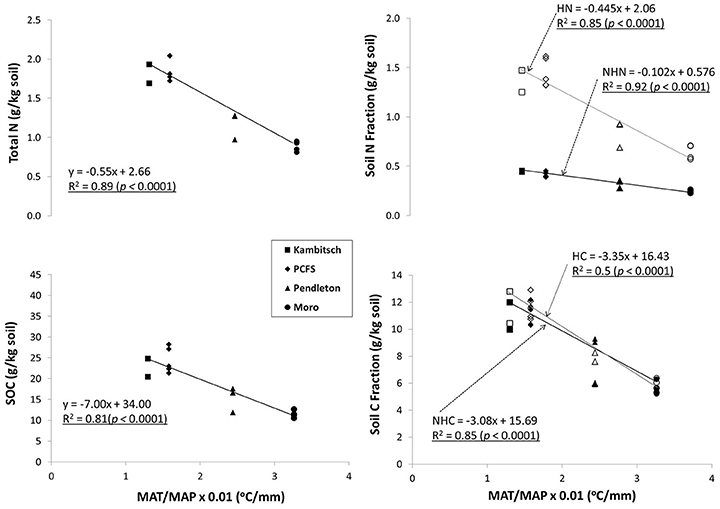
Figure 1. Relationship of SOC, total N, NHC, NHN, HC, and HN with present climate ratio across four dryland study sites and multiple treatments (Table 1). [MAT, mean annual temperature (°C); MAP, mean annual precipitation (mm); SOC, soil organic carbon; NHC, non-hydrolyzable carbon; NHN, non-hydrolyzable nitrogen; HC, hydrolyzable carbon; HN, hydrolyzable nitrogen].
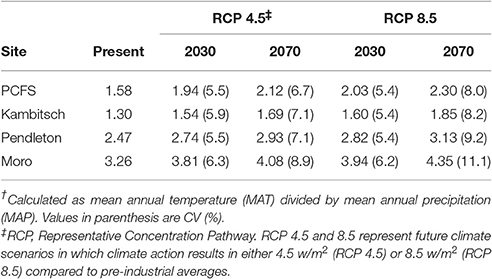
Table 4. Present and future climate ratios†.
The relationship between the climate ratio and soil C and N indicates that a rise in MAT without a proportionate rise in MAP will result in degradation of surface SOM across the iPNW. For the iPNW, RCP 4.5 and RCP 8.5 both predict disproportionate increases in MAT relative to MAP across the region for 2030 and 2070 average projections of 19 climate models as compared to present day averages (Abatzoglou and Brown, 2012). Consequently, future climate ratios are projected to increase as much as 27–46% by 2070 for RCP 8.5 across the study sites (Table 4). Increases in the climate ratio will drive a decline in average SOC and total N across the region for 2030 and 2070 (Figure 2), under the assumption that a new steady state of SOC and total N is realized. For example, SOC values for 2030 and 2070 at Pendleton, based on forecasted shifts in MAT/MAP under the RCP 4.5 scenario, are 3.6 and 12.3%, respectively, below the present day average for the Pendleton site across all treatments (Figure 2). Likewise, at the same site under the RCP 8.5 scenario and based on forecasted shifts in MAP/MAT for 2030 and 2070, SOC levels may be reduced by 6.9 and 21.2%, respectively. Calculated another way and for scalability, the slope of the regression lines in Figure 2 coupled with current soil bulk densities indicate that every 1/10 increase in MAT/MAP is associated with a decrease in soil C and N of 725 kg ha−1 and 58 kg ha−1, respectively. Taking regional averages from the present data set, this equates to an average reduction in soil C and N of 3.3% and 3.4%, respectively, for every 1/10 increase in MAT/MAP. This analysis does not take into account potentially offsetting unknown microbial responses to temperature increases, such as changes in enzyme production that could alter the present day relationship between decomposition and temperature, or greater water-use efficiencies and potential biomass production resulting from increasing concentrations of atmospheric CO2 (Stöckle et al., 2010). This analysis, however, does provide scale to potential implications of climate change to soil C and N, and subsequently soil health, across the iPNW. Loss of soil C is associated with a reduction in soil aggregate stability, reduced water holding capacity and porosity, reduction in root aeration and overall root health, and a decrease in cation exchange capacity (CEC), all soil properties critical to soil health and function (Delgado et al., 2011).
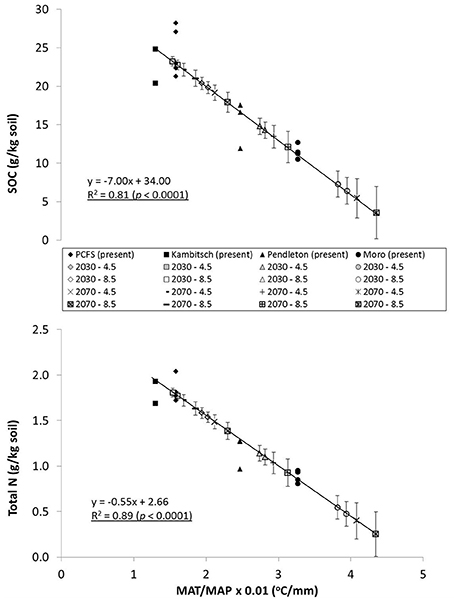
Figure 2. Present climate and future climate scenarios with SOC and total N across four dryland study sites. (SOC, soil organic carbon; MAT, mean annual temperature; MAP, mean annual precipitation). Notes: Future SOC and Total N projections are based on regression relationship between present day climate ratio and present day average SOC and total N for each site determined by averaging across treatments (Table 1). MAT/MAP ratio for 2030 and 2070 is based on average across 19 climate models for scenario in which climate action results in an additional 4.5 w/m2 or 8.5 w/m2 in Earth's atmosphere compared to pre-industrial averages (RCP 4.5 or 8.5). Error bars show standard deviation across climate models and across treatments for present day SOC and TN. Regression equation shown based on present climate and measured SOC and TN values).
While overall SOM stocks are susceptible to projected changes in climate within the iPNW, understanding how SOM pools representing different turnover times are impacted by future climate scenarios is also important. Both hydrolyzable C (HC) and non-hydrolyzable C (NHC), which has a longer turnover time than the HC fraction (Paul et al., 2006; Rovira and Vallejo, 2007), were negatively correlated with MAT and positively correlated with MAP (Table 2). Under elevated temperatures, Plante et al. (2010) demonstrated accelerated decomposition of SOM resistant to acid hydrolysis as well as particulate organic matter, typically consisting of more labile C. A comparison of the hydrolyzable and non-hydrolyzable fractions of SOC with the climate ratio revealed that both declined similarly as the climate ratio increased (Figure 1). SOM pools with longer turnover times reportedly exhibit a greater relative increase in decomposition rate than SOM pools with shorter turnover times as temperature increases (Lefevre et al., 2014). Therefore, our results indicate that interactive effects of MAT and MAP on C inputs and decomposition are operational and that relative changes in temperature and precipitation must be considered when assessing climate change impacts on SOC pools. In contrast to HC and NHC, the HN fraction, composed primarily of amino acids and amino sugars, displayed greater sensitivity to the climate ratio than the NHN fraction (Figure 1). This is consistent with the concept that a portion of HN may be stabilized by the presence of more processed material, represented in NHC (Pare et al., 1998), and therefore a decline in NHC would further accelerate a decline in HN.
Loss of recalcitrant SOM fractions may not be easily replaced under traditional cropping systems. Annual inputs from agriculture to more recalcitrant SOM pools as compared to that derived from native vegetation have often been reported to be minimal (Balesdent et al., 1990; Huggins et al., 1998; Poirier et al., 2006). Contributing factors are reductions in quantity of annual C inputs, decreases in recalcitrant inputs (e.g., lignin), and/or increases in disturbance or erosion that result from a switch from native to agricultural conditions (Hassink, 1997; Huggins et al., 1998; Krull et al., 2003). In part, this may explain why management factors, particularly tillage and cropping intensity, were not very significant factors influencing soil C and N properties as compared to MAT and MAP across the four study sites (Table 3).
Declines in labile and recalcitrant constituents of SOM with increasing climate ratio have implications for associated soil functions. More recalcitrant SOM benefits soil chemical and physical properties, such as CEC and water holding capacity, while more labile SOM is essential for soil biological processes such as nutrient mineralization (Wander, 2004). The demonstrated sensitivity of various constituents of SOM to the climate ratio suggests that soil chemical, physical, and biological properties are susceptible to degradation resulting from predicted climate change in the iPNW.
Future Climate: N Transformations
Climate variables were major drivers of total N and, in turn, total N was the dominant driver of both PNM and PDR (Table 5). Therefore, the primary influence of future climate change on N transformations will be through soil N impacts. Replacing total N with NHN and HN in the multivariate model shows that HN is the dominant variable for explaining variation in both PNM (R2 = 0.58) and PDR (R2 = 0.51). MAT, however, was the main variable that explained BDR variability (Table 5). Li et al. (2010) modeled the influence of climate, along with soil and management factors associated with a maize-wheat rotation and found SOC had the greatest impact on N2O emissions; the model did not include soil N. This emphasizes along with present findings that substrate availability is a critical driver of N transformations. The negative correlations of TN, PNM, and PDR with both MAT and MAT/MAP (Table 2) indicate that these variables will decrease below present day values with projected climate change. Reductions in PNM may lead to a greater reliance on inorganic fertilizers and possible decreases in N-use efficiency as applied inorganic N is subject to losses via multiple pathways (Culman et al., 2013). This places greater importance on precision N applications under future climate scenarios to help increase N-use efficiency and minimize potential losses.
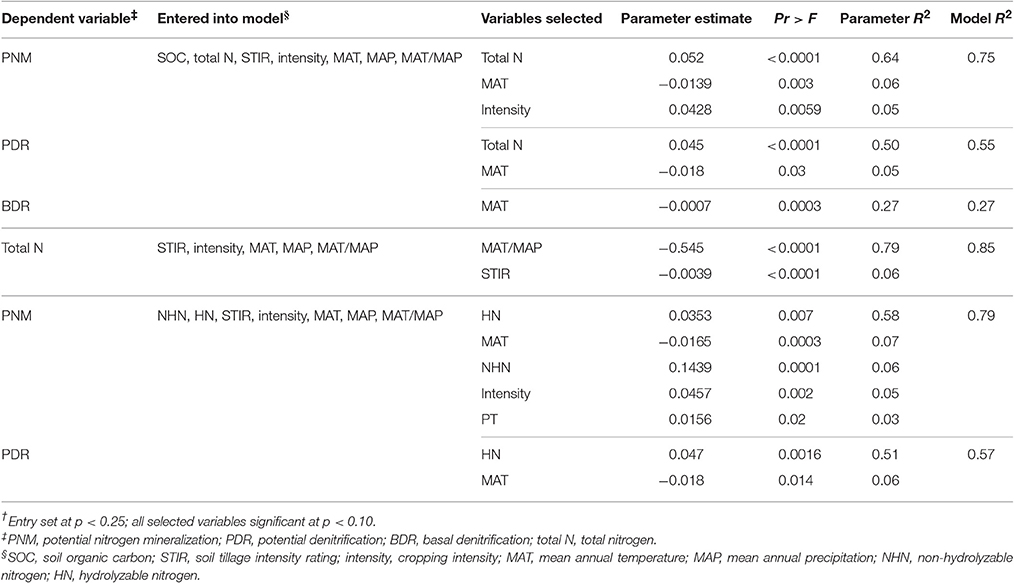
Table 5. Stepwise multivariate regression with climate, management, SOC, and total N for N transformations across four study sites†.
Conclusions
Climate plays a dominant role in determining soil C and N and soil N transformations within the iPNW. Also, in comparison, management variables of soil disturbance (STIR) and cropping system intensity had relatively little influence. Many SOM characteristics and associated transformations are negatively correlated with the climate ratio, which is expected to significantly increase due to climate change in the coming century. Climate change is predicted, consequently, to negatively impact SOM and associated soil health characteristics. Unknowns such as specific plant and soil microbial community and management responses to climate change may alter the outcomes predicted by this study. Therefore, forethought dictates the best course of action for bolstering against soil health degradation under future climate scenarios is the continued adoption of soil conservation practices, including NT and cropping intensification. It remains unclear if these strategies will be sufficient to maintain present levels of soil C and N into the future under projected climate change. For this reason, it is critical for the agricultural community of the iPNW to adopt effective soil health monitoring strategies now in order to have a chance to encourage, through management, optimal health of our soils into the future. Such a proactive approach will help assure that land managers are situated to guide adaptive-management decisions toward building resilient soils and more sustainable agricultural systems, a critical step to adapting to climate change.
Author Contributions
DH was major advisor for the graduate M.S. degree program of JM, the primary author. DH directed and supported field and laboratory research conducted in facilities he manages, aided in development of research questions/hypotheses/objectives and analytical methods, reviewed and edited manuscript drafts including final submission of manuscript. JM conducted field and laboratory activities, developed hypotheses with co-authors, conducted data analyses and wrote preliminary and final manuscript drafts. JR served on graduate committee of JM and aided in hypothesis development, identification of appropriate field and laboratory analyses and participated in all aspects of manuscript development.
Funding
This material is based on work that was supported by the National Institute of Food and Agriculture, U.S. Department of Agriculture, under award number 2011-68002-30191.
Conflict of Interest Statement
The authors declare that the research was conducted in the absence of any commercial or financial relationships that could be construed as a potential conflict of interest.
References
Abatzoglou, J. T., and Brown, T. J. (2012). A comparison of statistical downscaling methods suited for wildfire applications. Int. J. Climatol. 32, 772–780. doi: 10.1002/joc.2312
Balesdent, J., Mariotti, A., and Boisgontier, D. (1990). Effect of tillage on soil organic carbon mineralization estimated from 13 C abundance in maize fields. J. Soil Sci. 41, 587–596. doi: 10.1111/j.1365-2389.1990.tb00228.x
Chapman, L. Y., McNulty, S. G., Sun, G., and Zhang, Y. (2013). Net nitrogen mineralization in natural ecosystems across the conterminous US. Int. J. Geosci. 4, 1300–1312. doi: 10.4236/ijg.2013.49125
Colman, B. P., and Schimel, J. P. (2013). Drivers of microbial respiration and net N mineralization at the continental scale. Soil Biol. Biogeochem. 60, 65–76. doi: 10.1016/j.soilbio.2013.01.003
Culman, S. W., Snapp, S. S., Green, J. M., and Gentry, L. E. (2013). Short- and long-term labile soil carbon and nitrogen dynamics reflect management and predict corn agronomic performance. Soil Fertil. Crop Nutr. 105, 493–502. doi: 10.2134/agronj2012.0382
Curtin, D., and Campbell, C. A. (2008). “Mineralizable nitrogen,” in Soil Sampling and Methods of Analysis, eds M. R. Carter and E. G. Gregorich (Boca Raton, FL: CRC Press), 599–606.
Davidson, E. A., and Janssens, I. A. (2006). Temperature sensitivity of soil carbon decomposition and feedbacks to climate change. Nature 440, 165–173. doi: 10.1038/nature04514
Delgado, J. A., Groffman, P. M., Nearing, M. A., Goddard, T., Reicosky, D., Lal, R., et al. (2011). Conservation practices to mitigate and adapt to climate change. J. Soil Water Conserv. 66, 118–129. doi: 10.2489/jswc.66.4.118A
Denef, K., Six, J., Merckx, R., and Paustian, K. (2004). Carbon sequestration in microaggregates of no-tillage soils with different clay mineralogy. Soil Sci. Soc. Am. J. 68, 1935–1944. doi: 10.2136/sssaj2004.1935
Dou, F., Wright, A. L., and Hons, F. M. (2008). Sensitivity of labile soil organic carbon to tillage in wheat-based cropping systems. Soil Sci. Soc. Am. J. 72, 1445–1453. doi: 10.2136/sssaj2007.0230
Drury, C. F., Myrold, D. D., Beauchamp, E. G., and Reynolds, W. D. (2008). “Denitrification techniques for soils,” in Soil Sampling and Methods of Analysis, eds M. R. Carter and E. G. Gregorich (Boca Raton, FL: CRC Press), 471–494.
Franzluebbers, A. J., and Arshad, M. A. (1996). Soil organic matter pools during early adoption of conservation tillage in Northwestern Canada. Soil Sci. Soc. Am. J. 60, 1422–1427. doi: 10.2136/sssaj1996.03615995006000050019x
Franzluebbers, A. J., Haney, R. L., Honeycutt, C. W., Schomberg, H. H., and Hons, F. M. (2000). Flush of carbon dioxide following rewetting of dried soil relates to active organic pools. Soil Sci. Soc. Am. J. 64, 613–623. doi: 10.2136/sssaj2000.642613x
Halvorson, A. D., Weinhold, B. J., and Black, A. L. (2002). Tillage, nitrogen, and cropping system effects on soil carbon sequestration. Soil Sci. Soc. Am. J. 66, 906–912. doi: 10.2136/sssaj2002.9060
Haney, R. L., Brinton, W. H., and Evans, E. (2008). Estimating soil carbon, nitrogen, and phosphorus mineralization from short-term carbon dioxide respiration. Commun. Soil Sci. Plant Anal. 39, 2706–2720. doi: 10.1080/00103620802358862
Haney, R. L., Franzluebbers, A. J., Jin, V. L., Johnson, M., Haney, E. B., White, M. J., et al. (2012). Soil organic C:N vs. water-extractable organic C:N. Open J. Soil Sci. 2, 269–274. doi: 10.4236/ojss.2012.23032
Hassink, J. (1997). The capacity of soils to preserve organic C and N by their association with clay and silt particles. Plant Soil 191, 77–87. doi: 10.1023/A:1004213929699
Huggins, D. R., Allmaras, R. R., Clapp, C. E., Lamb, J. A., and Randall, G. W. (2007). Corn-soybean sequence and tillage effects on soil carbon dynamics and storage. Soil Sci. Soc. Am. J. 71, 145–154. doi: 10.2136/sssaj2005.0231
Huggins, D. R., Buyanovsky, G. A., Wagner, G. H., Brown, J. R., Darmody, R. G., Peck, T. R., et al. (1998). Soil organic C in the tallgrass prairie-derived region of the Corn Belt: effects of long-term crop management. Soil Tillage Res. 47, 219–234. doi: 10.1016/S0167-1987(98)00108-1
Huggins, D. R., Rupp, R., Kaur, H., and Eigenbrode, S. (2014). “Defining agroecological classes for assessing land use dynamics,” in Regional Approaches to Climate Change for Pacific Northwest Agriculture, eds K. Borrelli, D. Daley-Laursen, S. Eigenbrode, B. Mahler, and B. Stokes (Moscow: University of Idaho), 4–7.
Krull, E. S., Baldock, J. A., and Skjemstad, J. O. (2003). Importance of mechanisms and processes of stabilization of soil organic matter for modeling turnover. Funct. Plant Biol. 30, 207–222. doi: 10.1071/FP02085
Lefevre, R., Barre, P., Moyano, F. E., Christensen, B. T., Bardoux, G., Eglin, T., et al. (2014). Higher temperature sensitivity for stable than for labile soil organic carbon – Evidence from incubations of long-term bare fallow soils. Glob. Chang. Biol. 20, 633–640. doi: 10.1111/gcb.12402
Li, H., Qiu, J., Wang, L., Tang, H., Li, C., and Ranst, E. V. (2010). Modelling impacts of alternative farming management practices on greenhouse gas emissions from a winter wheat-maize rotation in China. Agric. Ecosyst. Environ. 135, 24–33. doi: 10.1016/j.agee.2009.08.003
Littell, J. S., McGuire Elsner, M., Whitely Binder, L. C., and Snover, A. K. (eds). (2009). The Washington Climate Change Impacts Assessment: Evaluating Washington's Future in a Changing Climate - Executive Summary. Seattle, WA: University of Washington.
McLauchlan, K. K., and Hobbie, S. E. (2004). Comparison of labile soil organic matter fractionation techniques. Soil Sci. Soc. Am. J. 68, 1616–1625. doi: 10.2136/sssaj2004.1616
Morrow, J. G., Huggins, D. R., Carpenter-Boggs, L. A., and Reganold, J. P. (2016). Evaluating measures to assess soil health in long-term agroecosystem trials. Soil Sci. Soc. Am. J. 80, 450–462. doi: 10.2136/sssaj2015.08.0308
Niboyet, A., Le Roux, X., Dijkstra, P., Hungate, B. A., Barthes, L., Blankinship, J. C., et al. (2011). Testing interactive effects of global environmental changes on soil nitrogen cycling. Ecosphere 2, 1–24. doi: 10.1890/ES10-00148.1
NOAA (National Oceanic and Atmospheric Administration) (2017). Climate Data Online. Available online at: http://www.ncdc.noaa.gov/cdo-web/ (accessed January 16, 2017).
Pare, T., Dinel, H., Schnitzer, M., and Dumontet, S. (1998). Transformations of carbon and nitrogen during composting of animal manure and shredded paper. Biol. Fertil. Soils 26, 173–178. doi: 10.1007/s003740050364
Paul, E. A., Follett, R. F., Leavitt, S. W., Halvorson, A., Peterson, G. A., and Lyon, D. J. (1997). Radiocarbon dating for determination of soil organic matter pool sizes and dynamics. Soil Sci. Soc. Am. J. 61, 1058–1067. doi: 10.2136/sssaj1997.03615995006100040011x
Paul, E. A., Morris, S. J., Conant, R. T., and Plante, A. F. (2006). Does the acid hydrolysis-incubation method measure meaningful soil organic matter pools? Soil Sci. Soc. Am. J. 70, 1023–1035. doi: 10.2136/sssaj2005.0103
Plante, A. F., Conant, R. T., Carlson, J., Greenwood, R., Shulman, J. M., Haddix, M. L., et al. (2010). Decomposition temperature sensitivity of isolated soil organic matter fractions. Soil Biol. Biochem. 42, 1991–1996. doi: 10.1016/j.soilbio.2010.07.022
Poirier, N., Derenne, S., Balesdent, J., Chenu, C., Bardoux, G., Mariotti, A., et al. (2006). Dynamics and origin of the non-hydrolyzable organic fraction in a forest and a cultivated temperate soil, as determined by isotopic and microscopic studies. Eur. J. Soil Sci. 57, 719–730. doi: 10.1111/j.1365-2389.2005.00764.x
Post, W. M., Emanuel, W. R., Zinke, P. J., and Stangenberger, A. G. (1982). Soil carbon pools and world life zones. Nature 298, 156–159. doi: 10.1038/298156a0
Powlson, D. S., and Brookes, P. C. (1987). Measurement of soil microbial biomass provides an early indication of changes in total soil organic matter due to straw incorporation. Soil Biol. Biochem. 19, 159–164. doi: 10.1016/0038-0717(87)90076-9
Purakayastha, T. J., Smith, J. L., and Huggins, D. R. (2009). Microbial biomass and N cycling under native prairie, conservation reserve and no-tillage in Palouse soils. Geoderma 152, 283–289. doi: 10.1016/j.geoderma.2009.06.013
Riahi, K., Rao, S., Krey, V., Cho, C., Chirkov, V., Fischer, G., et al. (2011). RCP 8.5 – A scenario of comparatively high greenhouse gas emissions. Clim. Change 109, 33–57. doi: 10.1007/s10584-011-0149-y
Ros, G. H., Hoffland, E., van Kessel, C., and Temminghoff, E. J. M. (2009). Extractable and dissolved soil organic nitrogen–A quantitative assessment. Soil Biol. Biochem. 41, 1029–1039. doi: 10.1016/j.soilbio.2009.01.011
Rovira, P., and Vallejo, V. R. (2002). Labile and recalcitrant pools of carbon and nitrogen in organic matter decomposing at different depths in soil: an acid hydrolysis approach. Geoderma 107, 109–141. doi: 10.1016/S0016-7061(01)00143-4
Rovira, P., and Vallejo, V. R. (2007). Labile, recalcitrant, and inert organic matter in Mediterranean forest soils. Soil Biol. Biochem. 39, 202–215. doi: 10.1016/j.soilbio.2006.07.021
Saxton, K. E., and Rawls, W. J. (2006). Soil water characteristic estimates by texture and organic matter for hydrologic solutions. Soil Sci. Soc. Am. J. 70, 1569–1578. doi: 10.2136/sssaj2005.0117
Schillinger, W. F., Papendick, R. I., Guy, S. O., Rasmussen, P. E., and Van Kessel, C. (2006). “Dryland cropping in the Western United States,” in Dryland Agriculture Research Issues, eds G. Peterson, P. Unger, and B. Payne (Madison, WI: American Society of Agronomy), 365–393.
Smith, J. L., Halvorson, J. J., and Bolton, H. Jr. (2002). Soil properties and microbial activity across a 500 m elevation gradient in a semi-arid environment. Soil Biol. Biochem. 34, 1749–1757. doi: 10.1016/S0038-0717(02)00162-1
Stöckle, C. O., Nelson, R. L., Higgins, S., Brunner, J., Grove, G., Boydston, R., et al. (2010). Assessment of climate change impact on eastern Washington agriculture. Clim. Change 102, 77–102. doi: 10.1007/s10584-010-9851-4
Tabatabai, M. A., and Bremner, J. M. (1970). Use of the Leco automatic 70-second carbon analyzer for total carbon analysis of soils. Soil Sci. Soc. Am. Proc. 34, 608–610. doi: 10.2136/sssaj1970.03615995003400040020x
Taylor, K. E., Stouffer, R. J., and Meehl, G. A. (2011). An overview of CMIP5 and the experiment design. Bull. Amer. Meteor. Soc. 93, 485–498. doi: 10.1175/BAMS-D-11-00094.1
Thomson, A. M., Calvin, K. V., Smith, S. J., Kyle, G. P., Volke, A., Patel, P., et al. (2011). RCP4.5: a pathway for stabilization of radiative forcing by 2100. Clim. Change 109, 77–94. doi: 10.1007/s10584-011-0151-4
USDA-NRCS (2011). Natural Resources Conservation Service Conservation Practice Standard: Residue and Tillage Management No Till/Strip Till/Direct Seed. Code 329. Washington, DC: USDA-NRCS.
Van Lierop, W. (1990). “Soil pH and lime requirement determination,” in Soil Testing and Plant Analysis, ed R. L. Westerman (Madison, WI: Soil Science Society of America), 73–126.
Voroney, R. P., Brookes, P. C., and Beyaert, R. P. (2008). “Soil microbial biomass C, N, P, and S,” in Soil Sampling and Methods of Analysis, eds M. R. Carter and E. G. Gregorich (Boca Raton, FL: CRC Press), 639–642.
Wander, M. (2004). “Soil organic matter fractions and their relevance to soil function,” in Soil Organic Matter in Sustainable Agriculture, eds F. Magdoff and R. R. Weil (Boca Raton, FL: CRC Press), 67–102.
Weil, R. R., Islam, K. R., Stine, M. A., Gruver, J. B., and Samson-Liebig, S. E. (2003). Estimating active carbon for soil quality assessment: a simplified method for laboratory and field use. Am. J. Altern. Agric. 18, 3–17. doi: 10.1079/AJAA2003003
Weil, R. R., and Magdoff, F. F. (2004). “Significance of soil organic matter to soil quality and health,” in Soil Organic Matter in Sustainable Agriculture, eds F. Magdoff and R. R. Weil (Boca Raton, FL: CRC Press), 45–65.
Keywords: climate change impacts, soil health, soil organic matter, cropping systems, agroecosystems
Citation: Morrow JG, Huggins DR and Reganold JP (2017) Climate Change Predicted to Negatively Influence Surface Soil Organic Matter of Dryland Cropping Systems in the Inland Pacific Northwest, USA. Front. Ecol. Evol. 5:10. doi: 10.3389/fevo.2017.00010
Received: 30 September 2016; Accepted: 16 February 2017;
Published: 21 March 2017.
Edited by:
Jodi Lynn Johnson-Maynard, University of Idaho, USAReviewed by:
Jeanette Whitaker, Lancaster Environment Centre, UKRajan Ghimire, New Mexico State University, USA
Copyright © 2017 Morrow, Huggins and Reganold. This is an open-access article distributed under the terms of the Creative Commons Attribution License (CC BY). The use, distribution or reproduction in other forums is permitted, provided the original author(s) or licensor are credited and that the original publication in this journal is cited, in accordance with accepted academic practice. No use, distribution or reproduction is permitted which does not comply with these terms.
*Correspondence: David R. Huggins, ZGh1Z2dpbnNAd3N1LmVkdQ==