 Roy Yanovski
 Peter A. Nelson2
 Avigdor Abelson
- 1Department of Zoology, Tel Aviv University, Tel Aviv, Israel
- 2H. T. Harvey & Associates—Ecological Consultants, Los Gatos, CA, USA
Structural complexity is a key factor in ecology, often positively linked to biodiversity and carrying capacity of habitats. However, defining quantitatively the ecological role of structural complexity remains a challenge, mainly due to its unclear definition and lack of accurate measurement tools and indices. The most common structural complexity indices used in ecological studies are the “Rugosity index” and “Fractal Dimension.” However, these indices cannot appraise or overlook certain complexity indications that may play important ecological roles, such as the different characteristics of structural elements or different spatial scales of structural complexity. This study attempts to tackle these challenges by: 1. examining a new method for structural complexity measurement (“Point-Intercept Contour” or PIC), which may allow calculation of different complexity indices; 2. measuring structural complexity on different spatial scales, each of which may affect or reflect on different ecological factors; and 3. comparing three different indices of structural complexity (i.e., “Rugosity index,” “Coefficient of Variation,” and “Neighbor's Distance”) at different spatial scales, in natural reefs in the Philippines. The PIC method has proven to be easy to perform, provides informative data about structural complexity elements, and enables the calculation of all three indices on different spatial scales. The different spatial scales revealed different patterns among sites that emphasize the importance of considering spatial scaling when expressing different ecological aspects that may indicate reef health. The three indices showed similar general trends, with some differences between scales that reveal some advantages and some drawbacks to each index. The study demonstrates the importance of structural complexity at different spatial scales, and suggests a series of considerations for the use of relevant methods and indices with emphasis on an inexpensive, facile tool for quantitative structural complexity measurements.
Introduction
Structural complexity is a key factor in ecology (e.g., Russ, 1980; August, 1983; Gilinsky, 1984; McCoy and Bell, 1991; Tews et al., 2004; Hardiman et al., 2011; Harborne et al., 2012; Graham et al., 2015). Kovalenko et al. (2012) describe complexity as “one of the most important factors structuring biotic assemblages.” Numerous studies have shown a strong correlation between structural complexity and species richness and diversity in both terrestrial (e.g., MacArthur and MacArthur, 1961; Karr and Roth, 1971) and marine environments (e.g., Kohn, 1967; Jeffries, 1993; Lingo and Szedlmayer, 2006; Moore and Hovel, 2010).
Coral reefs offer a frequently referenced example of a structurally complex ecosystem, and their high structural complexity is recognized as important in accounting for its high species richness (Friedlander and Parrish, 1998; Gratwicke and Speight, 2005b). A link has also been shown between structural complexity and the state of coral reefs and their biota (e.g., Friedlander and Parrish, 1998; Alvarez-Filip et al., 2009; Graham and Nash, 2013), as well as a possible relationship to their ability to recover from degraded states (Rogers et al., 2015). Here, we define structural complexity as: “The heterogeneity and irregularity levels of structural elements” (Taniguchi et al., 2003), which compose the topographic contours of a given site. The ecological importance of structural complexity is often related to sheltered spaces (e.g., Almany, 2004) and physical niches (e.g., Willis et al., 2005), which can support higher biodiversity (Tews et al., 2004; Gratwicke and Speight, 2005b) and increase the carrying capacity of the habitat (Kostylev et al., 2005), at different spatial scales. The previously-cited studies, as well as many others, have referred to structural complexity as a broadly-accepted ecological factor that plays an important role in benthic marine ecosystems. However, determining the exact ecological role of structural complexity, and harnessing it as a potential factor in coral-reef monitoring and management plans, remains a challenge, mainly due to its unclear definition and the limitations of available measurement tools. As Gratwicke and Speight (2005a) stated: “The issue of habitat complexity is approached intuitively by most investigators, and even though there is a consensus that more complex habitats support a greater variety of species, its quantification remains difficult.” Recent technological developments have yielded new, advanced tools (e.g., 3D photography and acoustic imaging; Friedman et al., 2012; Knudby et al., 2014; Burns et al., 2015; Figueira et al., 2015), which have improved the accuracy of structural complexity measurements. However, the implementation of these tools in coral reefs is constrained by several major disadvantages, including the high-cost of the devices and limited operational capacities, which may make them not applicable in many coral-reef areas that reliant on local communities, and should therefore be based on inexpensive, easy to use, and broadly applicable measurement tools. The need for an improved heuristic definition and for better tools for the evaluation of structural complexity can be demonstrated by its diverse synonymous terms (e.g., habitat complexity, architectural complexity, topographic complexity, habitat heterogeneity, habitat diversity, substratum heterogeneity, spatial heterogeneity, and substratum irregularity; Gilinsky, 1984; Carleton and Sammarco, 1987; Connell and Jones, 1991; Thomas and Atkinson, 1997; Lapointe and Bourget, 1999; Tews et al., 2004; Sleeman et al., 2005; Alvarez-Filip et al., 2009), as well as the diverse definitions and measurement methods (e.g., McElhinny et al., 2005; Graham and Nash, 2013).
The most common way to measure structural complexity in ecological studies is the chain-and-tape method (Risk, 1972; Knudby and LeDrew, 2007), which is used to calculate “Rugosity” as an index of structural complexity. Another common index, “Fractal Dimension,” is usually measured by the “walking dividers” method (Mandelbrot, 1967). These two common indices, despite providing indications of structural complexity, overlook aspects relevant to important ecological roles of structural complexity, including:
• Relationships between neighboring elements: Neither the Rugosity index nor the Fractal Dimension provide information on the spatial arrangement of structural elements (for example see Figures 1A,B). Structural elements may be distributed in different spatial arrangements, forming different topographic patterns that affect the reef biota as they create different types and sizes of shelters, despite having identical values of the Rugosity index, or Fractal Dimension. Moreover, fractal geometry is based on the assumption that different scales exhibit the exact same structural pattern (Mandelbrot and Blumen, 1989), and therefore, inherently cannot assess potential differences between scales.
• Various types of elements: Different types of structural elements (Figures 1C,D), for example, a bulge and a dent with the same contour length, will receive the same Rugosity measurement, even though they may play opposing ecological roles and exert different effects on organisms in their vicinity.
• Different scales of structural complexity: Despite the importance of spatial scale, this aspect has not been adequately addressed by ecologists, and very few studies have referred to more than one scale of complexity (Tokeshi and Arakaki, 2012). Moreover, Fractal Dimension and Rugosity index are measured in ways (e.g., the walking dividers and chain methods) that cannot differentiate between the structural complexities of different spatial scales, and are therefore represented on only one scale (Tokeshi and Arakaki, 2012). Structural complexity can be measured on diverse spatial scales, from nanometers (e.g., Mitik-Dineva et al., 2009) to thousands of kilometers (e.g., Renard et al., 2013). When referring to coral reefs, one may want to represent the complexity of spatial scales that play different roles for different reef species and ecological processes. For instance, the small scale we chose (millimeters; e.g., surface texture) can play a pivotal role in biofilm development and the settlement of coral larvae (e.g., Benayahu and Loya, 1984), whereas the medium scale and the large scale we chose (centimeters and meters, respectively) can play a role in the structure's capacity to host relatively small creatures (e.g., Crinoids, Sea urchins, small fish) and large creatures (e.g., Octopi and large carnivorous fish), respectively.
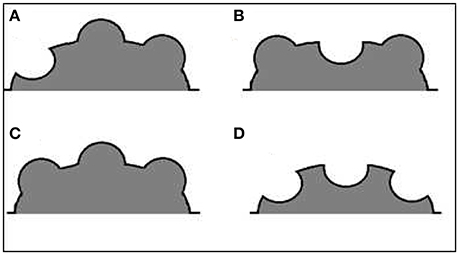
Figure 1. Schematic profiles of different structures demonstrate the ambiguity of the Rugosity index. (A) Bulges together, (B) Bulges separated by a dent, (C) Convex substructures, and (D) Concave substructures; all have the same Rugosity, and yet may have distinct architectural designs of different ecological implications. Panels (A) and (B) demonstrate differences in spatial arrangement of structural elements. Panels (C) and (D) demonstrate differences in types of structural elements (a bulge vs. a dent).
If better ways to assess structural complexity can be found, and their ecological roles better understood, complexity could then be more accurately defined and employed as an ecological indicator and monitoring tool for the conservation and management of ecosystems. The goal of the current study is to explore a novel measurement method which can be applied on different spatial scales and examined via the implementation of different structural complexity indices.
We introduce and test a new measurement tool, the “Point-Intercept Contour (PIC),” which allows the calculation of different complexity indices on different spatial scales. The indices examined in this study were the widely-applied Rugosity index, the Coefficient of Variation (CV), and the Neighbor's Distance (ND). The latter two indices consider the height differences between neighboring elements. ND is based on McCormick's method (McCormick, 1994) and its concept is derived from the field of geomorphology. It was chosen here for its potential to express relationships between complexity elements while considering their relative positions. We also chose to measure structural complexity on three different spatial scales, in terms of millimeters, centimeters, and meters.
Materials and Methods
Study Sites
Field observations and measurements were carried out in order to provide a real-world venue to test our assumptions and our methods regarding structural complexity. Four sites along the shores of Ticao Island, Bicol, in the Philippines were selected: the Plateau (N-12°36.892′, E-123°43.025′), the Cove (N-12°37.010′, E-123°42.570′), the Edge (N-12°36.924′, E-123°43.175′), and Halea (N-12°42.770′, E-123°35.912′). All sites are in close proximity to Ticao Island, although Halea is somewhat more remote than the three others and may therefore be under lower fishing pressure.
Measurements
The structural complexity of the reefs at these sites was measured at depths of 3–5 m (during high tide) using the new PIC method at three different spatial scales, and three complexity indices were calculated from the PIC data collected. The PIC method creates an output similar to the actual surface being measured (Figure 2).
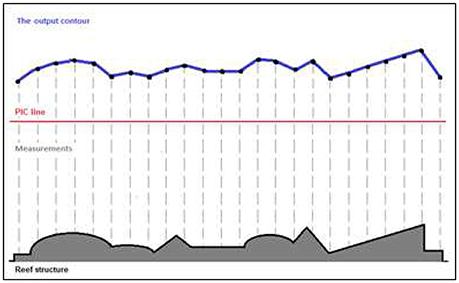
Figure 2. Schematic illustration of an hypothetical reef structure and its output contour. The actual surface contour (black line), as expressed by the Point Intercept Contour line (red line), the measurement points in a gray dashed line, and the PIC output contour (blue line).
All the measurements were performed during August 2013 by divers using scuba equipment. To reduce observer error, all surveys were conducted by the same two divers, one operating the measurement devices and the other recording the measurements.
For the PIC method, at each site, a 20 m floating transect line was deployed and fixed horizontally (i.e., at a constant depth) in place by lead weights and buoys about 1–1.3 m above the bottom. Each line transect location was selected haphazardly while attempting to keep water depth at the basic reef habitat largely constant. At each site, three transects were laid out, measuring complexity at all three scales. The large-scale measurements (i.e., meter-scale) were carried out by measuring the distance from the bottom to the line every 0.5 m along the line (forty measurements per line), using a laser “yardstick” device (Figure 3a; Taylor, 2007)—multiple points intercepting each transect were gathered along the contours of the reef, hence the PIC method. To complete these measurements at the large-scale, we used the known distance between the two laser pointers on the yardstick device and the measured angle between one laser and the stick, while the other one is pointing straight down and the two beams met on the seafloor (using basic laws of geometry). The medium-scale PIC measurements (i.e., centimeter-scale) were estimated at each 2 m mark along the transect line by placing a 50 × 50 cm PVC pipe frame with twenty-three, 30 cm steel bars inserted through holes. This device reflects the deviations from an artificial horizon (the bottom pipe) at 2 cm intervals. The deviations are recorded by taking a digital photograph of the device (Figure 3b). The small-scale PIC measurements (i.e., millimeter-scale) were estimated at each 1 m mark along the transect by using a similar device as in the medium-scale assessments, but using a 9 cm steel strip with thirty 5 cm needles inserted through holes in the strip at 3 mm intervals (Figure 3c). The medium and small scale devices each provided “deviations from an artificial horizon” measurements by analyzing the photographs using image analysis software (ImageJ; Schneider et al., 2012). In summary, the PIC method provides a set of measurements for each line transect, that allows the computation of multiple indices. The large scale assessments have 3 replicates or samples per site, with 40 measurement points for each replicate; the medium scale assessments have 30 replicates per site with 23 measurement points for each replicate; and the small scale assessments have 60 replicates per site with 30 measurement points for each replicate.
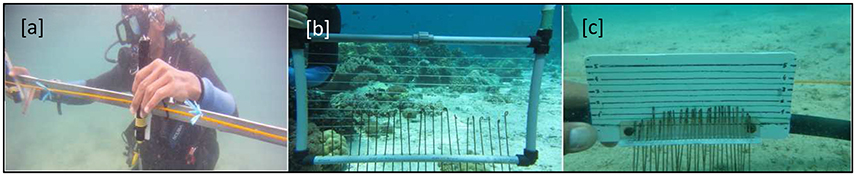
Figure 3. Photos of the complexity measuring devices: [a] the large-scale device (the yardstick). [b] The medium-scale device. [c] The small-scale device.
We used the PIC data to calculate the widely-used Rugosity index, typically measured via the chain method (Saleh, 1993), as well as the Coefficient of Variation index (CV), and the Neighbor's Distance index (ND).
The “Rugosity index” was calculated by dividing the length of the surface contour by the length of the plane on which it is situated:
where Rs is the Rugosity rank of site “s,” Lsr is the actual surface contour length of the line at site “s,” and Lsg is the of the point-to-point “horizon” at site “s.” Note that here, we did not use a chain to measure Lsr, rather, we estimated that quantity by measuring the distance from the position of multiple intervening points, from one to the next, as shown in Figure 2.
The Neighbor's Distance index, modified from McCormick (1994) was calculated from the average of the height differences between each two adjacent elements (measurements):
where NDa is the Neighbor's Distance index for line “a” (a sample measurement), Ha is the height of one element on line “a,” “z” is the distance between two neighboring elements (measurements) in the same units of distance as “H,” and “n” is the number of pairs of neighboring elements per sampling unit.
The Coefficient of Variation index was calculated by first calculating the ratio between the standard deviation and the average of each two adjacent elements, and then summing the results and multiplying them by the number of elements and converting them to percentage. The general formula:
The detailed formula:
where CVa is the Coefficient of Variation for line “a,” Ha is the height of one element on line “a”, and “n” is the number of pairs of neighboring elements per line/section. The structural complexities of the different reef sites were compared at each of the three spatial scales. Within site complexity cannot be compared using different scale measurements since they are measured at different sampling densities, which can produce an artifact index value due to the different structural oscillations and the distances between neighboring elements.
Statistical Analysis
All the statistical analyses were carried out with R 3.0.3 software. For all statistical tests α was set to 0.05. When the data did not meet the normality assumption (determined by Shapiro–Wilk test), a permutation test for ANOVA with 10,000 repetitions was applied. When data did not meet the homoscedasticity as well (determined by Fligner–Killeen test), Welch's test has been applied. We applied the Games–Howell test for the post-hoc analysis analyses.
All error bars presented in the following graphs are standard errors. Transformations to the data are indicated in the relevant parts of the Results Section. Asterisks on relevant graphs indicate the significance level as follows: n.s. p > 0.05, *p ≤ 0.05, **p ≤ 0.01, ***p ≤ 0.001.
Results
Rugosity Index (Figure 4)
Large Scale
A significant difference was found between the sites (permutation ANOVA test, F = 14.08, p = 0.0044, n = 3). Post-hoc testing showed significant differences between Halea-the Cove and Halea-the Plateau (Games–Howell multiple comparisons analysis; Table S1 in Appendix of Supplementary Material).
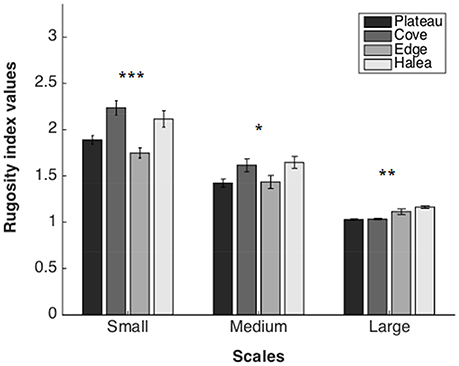
Figure 4. Rugosity index values of the four study sites, on three scales: large scale (n = 3), medium scale (n = 27), and small scale (n = 54). *p = 0.05, **p = 0.01, ***p = 0.001.
Medium Scale
A significant difference was found between the sites (permutation ANOVA test, F = 3.408, p = 0.0191, n = 27). Post-hoc testing showed significant differences only between Halea-the Plateau (Games–Howell multiple comparisons analysis; Table S2 in Appendix of Supplementary Material).
Small Scale
A significant difference was found between the sites (Welch's test, F = 10.2897, p < 0.0001, n = 54). Post-hoc testing showed significant differences between Halea-the Edge, the Edge-the Cove, and the Cove-the Plateau (Games–Howell multiple comparisons analysis; Table S3 in Appendix of Supplementary Material).
Neighbor's Distance (Figure 5)
Large Scale
A significant difference was found between the sites (permutation ANOVA test, F = 46.57, p = 0.0003, n = 3). Post-hoc testing showed significant differences between Halea-the Cove, Halea-the Plateau, and the Edge-the Cove (Games–Howell multiple comparisons analysis; Table S1 in Appendix of Supplementary Material).
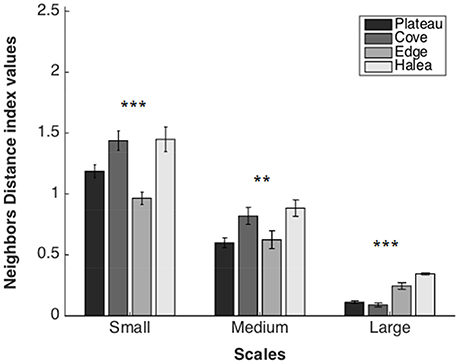
Figure 5. Neighbors Distance average values of the four study sites, on three scales: large scale (n = 3), medium scale (n = 27), and small scale (n = 54). **p = 0.01, ***p = 0.001.
Medium Scale
A significant difference was found between the sites (permutation ANOVA test, F = 4.71, p = 0.0049, n = 27). Post-hoc testing showed significant differences between Halea-the Plateau, and the Cove-the Plateau (Games–Howell multiple comparisons analysis; Table S2 in Appendix of Supplementary Material).
Small Scale
A significant difference was found between the sites (Welch's test, F = 11.6281, p < 0.0001, n = 54). Post-hoc testing showed significant differences between all the sites except Halea-the Cove and Halea-the Plateau (Games-Howell multiple comparisons analysis; Table S3 in Appendix of Supplementary Material).
Coefficient of Variation (Figure 6)
Large Scale
A significant difference was found between the sites (permutation ANOVA test, F = 26.12, p = 0.0006, n = 3). Post-hoc testing showed significant differences between Halea-the Plateau, and Halea-the Cove (Games–Howell multiple comparisons analysis; Table S1 in Appendix of Supplementary Material).
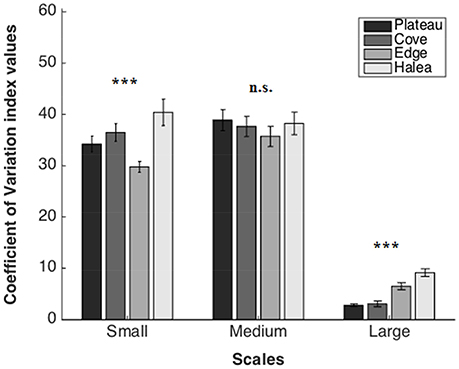
Figure 6. Coefficient of Variation average values of the four study sites, on three scales: large scale (n = 3), medium scale (n = 27), and small scale (n = 54). n.s.p > 0.05, ***p = 0.001.
Medium Scale
No significant difference was found between the sites (permutation ANOVA test, F = 0.441, p = 0.7247, n = 27).
Small Scale
A significant difference was found between the sites (Welch's test, F = 7.2965, p = 0.00016, n = 54). Post-hoc testing showed significant differences between the Edge-the Cove, the Edge-Halea (Games–Howell multiple comparisons analysis; Table S3 in Appendix of Supplementary Material).
Discussion
A key motivation for translating structural complexity into quantitative values is the need to understand the possible relationships between structural complexity and diverse ecological factors and their implications for ecosystem health and conservation management plans. At present, however, there is a gap between this need and the capabilities of measurement and assessment tools used for evaluating structural complexity. The main problems are the issue of the ignored spatial scales (in many cases due to user error) and the disregard of structural element characteristics (due to tool limitations). The main aim of the current study was to address these issues by applying a new measurement method (PIC), examining different complexity indices (Rugosity, CV, and ND), and measuring complexity on different spatial scales.
Structural Complexity Measurement Methods
There are several complexity measurement methods in use today. The most common tools are the chain method (Saleh, 1993) and the walking dividers (Mandelbrot, 1967); more recent tools include echo-sounders (Hellequin et al., 2003; Zawada et al., 2010) and 3D photography (Burns et al., 2015). Every tool presents advantages and disadvantages (Table 1). Our suggested method, the PIC, is proposed as an inexpensive, easily implemented alternative tool, suitable for use in remote areas, even by layman divers. Complexity measurements using the PIC method provided the relative position of structural elements whereas other methods (like the chain method) do not. PIC can provide data that may be used to calculate all three indices examined in this study, as well as other indices (e.g., Fractal Dimension). That being said, the chain method is more suited to Rugosity index when measured on one specific scale since it provides more accurate data regarding the actual length of the contour. The advantage of PIC over the chain and the walking dividers is that the latter methods can calculate only a limited set of indices and cannot measure complexity on different scales. The PIC method is also inexpensive and easy to perform compared to the methods of echo-sounders and 3D photography. It is reasonably accurate, although fewer data are collected compared to the new higher-tech methods. It is also a method that can be used to compare sites while measuring different spatial scales and documenting the spatial arrangement of structural elements. Moreover, if the exact measurement points at the beginning and end of each line are recorded precisely (e.g., using permanent markers and/or GPS), the data can be used to map sites via GIS software in order to produce topographic maps and track changes over time.
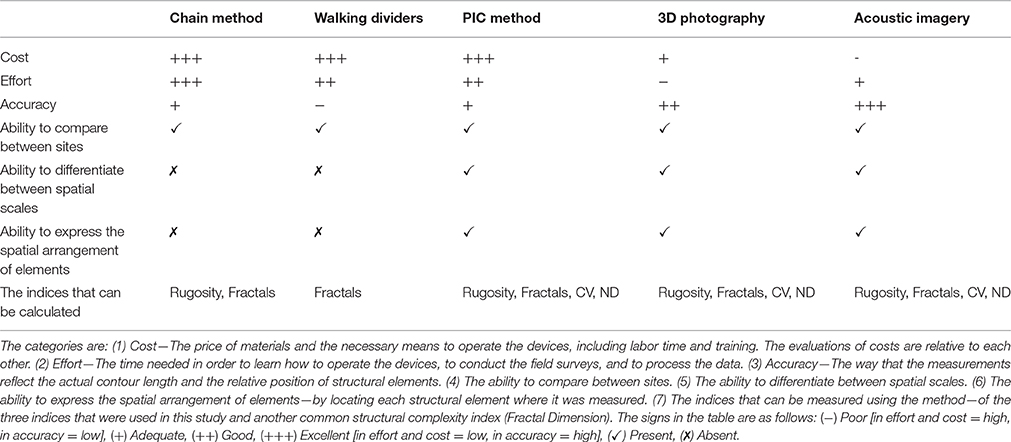
Table 1. Comparison between different measurement methods of structural complexity.
Ecologically, our proposed method provides a high resolution assessment of reef sites at three different spatial scales which may reasonably be expected to reflect different ecological processes (e.g., shelter for fish on the large scale or settlement of coral larvae on the small scale), an approach that has not been applied in previous structural complexity studies of coral reefs.
Structural Complexity Indices
In this study we chose to use the Rugosity index, the most commonly used index to measure the complexity of coral reefs (e.g., Alvarez-Filip et al., 2009), and has been shown to be correlated to biotic factors (Luckhurst and Luckhurst, 1978; Friedlander and Parrish, 1998). However, since the Rugosity index has some weaknesses, we chose also to use the CV and ND indices. Another index that has received some attention in the literature but was not examined in the present study is that of the Fractal Dimension (e.g., Sugihara and May, 1990; Palmer, 1992; Corbit and Garbary, 1995; Simon and Simon, 1995). This index and its measurement method have been criticized mainly due to its disregard for scaling issue and individual elements in size, shape, and location (Tokeshi and Arakaki, 2012).
Although, the three indices showed very similar results in terms of the relative complexity of the sites, we suggest some considerations which can help to determine the index most suitable to the goals and limitations of a particular study (Table 2). We make the following suggestions regarding the selection of an appropriate index: the CV index shows lower sensitivity since it could not distinguish the significant differences on the medium scale that the Rugosity and ND index revealed. On the other hand, the Rugosity index and Fractal Dimension index do not consider the relative spatial location of elements and the relationship between neighboring elements, while the CV and ND indices do. The Fractal Dimension has an additional disadvantage as it cannot measure and differentiate between spatial scales.
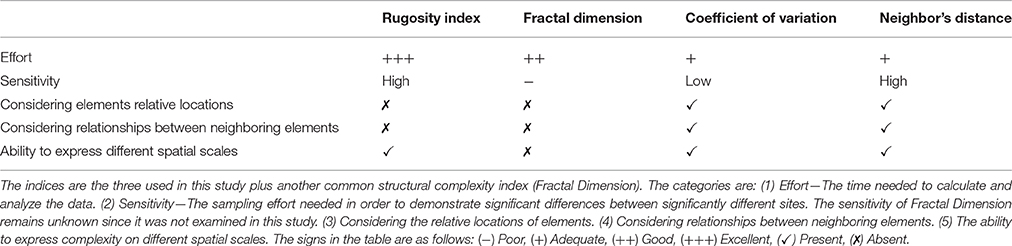
Table 2. Comparison between different structural complexity indices.
Using the chain method, the Rugosity index requires less sampling and calculation effort is minimal. Rugosity may represent the structural complexity levels in a reasonably good way, especially in natural environments, where the chaotic spatial arrangement of the structural elements hides its flaws. In a more “organized” artificial (man-made) environment, the lack of attention given to the spatial arrangement of structural elements in the Rugosity index may lower its reliability. The ND index also captures structural complexity reasonably well. Improvements should still be made as the examined indices lack informative physical data such as the structure of each complexity element (element types), the location of these elements relative to each other, the diversity of element types, or the incorporation of different spatial scales into a single value.
The complexity graphs show relatively large standard errors. These standard errors may also indicate structural complexity, that is, if the measurements from a given site vary greatly, they indicate higher structural complexity (see Figure 7). This additional aspect may serve as an important factor for consideration if future complexity indices are to be developed.
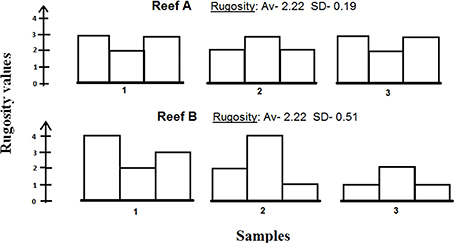
Figure 7. An illustration of three samples of two hypothetical reefs sharing the same Rugosity with different standard deviations. Reef B exhibits higher standard deviation, which indicates higher structural diversity than Reef A, and may therefore be considered as a more structurally-complex reef.
Spatial Scales of Structural Complexity
The results reveal different patterns of complexity on different spatial scales at the different sites, and highlight the need to examine more than one spatial scale in order to determine the true structural complexity of a site. Each scale is independent and might reveal different complexity levels, which may have implications for different ecological organisms and processes.
Conclusions
The present study focuses on structural complexity: its definitions, assessment tools, and indices. The results of the study suggest that:
1. The PIC method can serve as an effective, easy-to-perform measurement tool. The method generates reliable data, allowing the computation of several complexity indices.
2. The structural complexity indices used in this study (Rugosity index, Coefficient of Variation, and Neighbor's Distance) provide a reasonably reliable assessment of the structural complexity, yet challenges still remain regarding their ecological implications.
3. Measuring structural complexity at different spatial scales resulted in significantly different site assessments; presumably, these differing levels of complexity have ecological implications.
Further study and refinements are needed to confirm or refute the presumption of combined ecological effects of scale and complexity. Given that these factors are indeed complimentary, further studies are also needed to formulate a more comprehensive index that includes scale directly, rather than multiple separate measurements, and will be able to bridge the current gaps. Expressing additional parameters that can help to characterize complexity (e.g., the type of complexity elements, their diversity, and their relative spatial location) and using a geographical software like the GIS, combined with a carefully-designed computer-programmed formula, may provide the basis for establishing such an index. This study provides a first step toward these objectives, and the inclusion of structural complexity as a measurable and critically important factor in ecological studies and management practices. We believe that applying simple accurate quantitative approach to different spatial scales of structural complexity can help in promoting it as a monitoring and management tool in diverse benthic marine and terrestrial ecosystems.
Author Contributions
RY and AA established the study concept and design. RY conducted the field surveys and experiments. All authors contributed in data analyses, concept interpretations, manuscript writing, and editing. All the authors gave their final approval for publication.
Conflict of Interest Statement
The authors declare that the research was conducted in the absence of any commercial or financial relationships that could be construed as a potential conflict of interest.
Acknowledgments
Thanks are due to Rico Calleja and Jessica Noelle Wong from the Ticao Island Resort, G.L. Cabrera and the Ticao Island Resort staff, and Leor Korzen for their help with the field work. We thank Dr. Adi Lavy and Prof. Eli Geffen for aiding with the data analysis, Naomi Paz for language editing, and Dr. Itzik Brickner, Yotam Barr, and Doron Ashkenazi for being an integral part of the process.
Supplementary Material
The Supplementary Material for this article can be found online at: http://journal.frontiersin.org/article/10.3389/fevo.2017.00027/full#supplementary-material
References
Almany, G. R. (2004). Differential effects of habitat complexity, predators and competitors on abundance of juvenile and adult coral reef fishes. Oecologia 141, 105–113. doi: 10.1007/s00442-004-1617-0
Alvarez-Filip, L., Dulvy, N. K., Gill, J. A., Côté, I. M., and Watkinson, A. R. (2009). Flattening of Caribbean coral reefs: region-wide declines in architectural complexity. Proc. Biol. Sci. 276, 3019–3025. doi: 10.1098/rspb.2009.0339
August, P. V. (1983). The role of habitat complexity and heterogeneity in structuring tropical mammal communities. Ecology 64, 1495–1507. doi: 10.2307/1937504
Benayahu, Y., and Loya, Y. (1984). Substratum preferences and planulae settling of two red sea alcyonaceans: Xenia macrospiculata Gohar and Parerythropodium fulvum fulvum (Forskl). J. Exp. Mar. Biol. Ecol. 83, 249–260. doi: 10.1016/S0022-0981(84)80004-0
Burns, J. H. R., Delparte, D., Gates, R. D., and Takabayashi, M. (2015). Integrating structure-from-motion photogrammetry with geospatial software as a novel technique for quantifying 3D ecological characteristics of coral reefs. PeerJ 3:e1077. doi: 10.7717/peerj.1077
Carleton, J. H., and Sammarco, P. W. (1987). Effects of substratum irregularity on success of coral settlement: quantification by comparative geomorphological techniques. Bull. Mar. Sci. 40, 85–98.
Connell, S. D., and Jones, G. P. (1991). The influence of habitat complexity on postrecruitment processes in a temperate reef fish population. J. Exp. Mar. Biol. Ecol. 151, 271–294. doi: 10.1016/0022-0981(91)90129-K
Corbit, J. D., and Garbary, D. J. (1995). Fractal dimension as a quantitative measure of complexity in plant development. Proc. R. Soc. Lond. B Biol. Sci. 262, 1–6.
Figueira, W., Ferrari, R., Weatherby, E., Porter, A., Hawes, S., and Byrne, M. (2015). Accuracy and precision of habitat structural complexity metrics derived from underwater photogrammetry. Remote Sens. 7, 16883–16900. doi: 10.3390/rs71215859
Friedlander, A. M., and Parrish, J. D. (1998). Habitat characteristics affecting fish assemblages on a Hawaiian coral reef. J. Exp. Mar. Biol. Ecol. 224, 1–30. doi: 10.1016/S0022-0981(97)00164-0
Friedman, A., Pizarro, O., Williams, S. B., and Johnson-Roberson, M. (2012). Multi-scale measures of rugosity, slope and aspect from benthic stereo image reconstructions. PLoS ONE 7:e50440. doi: 10.1371/journal.pone.0050440
Gilinsky, E. (1984). The role of fish predation and spatial heterogeneity in determining benthic community structure. Ecology 65, 455–468. doi: 10.2307/1941408
Graham, N. A., Jennings, S., MacNeil, M. A., Mouillot, D., and Wilson, S. K. (2015). Predicting climate-driven regime shifts versus rebound potential in coral reefs. Nature 518, 94–97. doi: 10.1038/nature14140
Graham, N. A. J., and Nash, K. L. (2013). The importance of structural complexity in coral reef ecosystems. Coral Reefs 32, 315–326. doi: 10.1007/s00338-012-0984-y
Gratwicke, B., and Speight, M. R. (2005a). Effects of habitat complexity on Caribbean marine fish assemblages. Mar. Ecol. Prog. Ser. 292, 301–310. doi: 10.3354/meps292301
Gratwicke, B., and Speight, M. R. (2005b). The relationship between fish species richness, abundance and habitat complexity in a range of shallow tropical marine habitats. J. Fish Biol. 66, 650–667. doi: 10.1111/j.0022-1112.2005.00629.x
Harborne, A. R., Mumby, P. J., and Ferrari, R. (2012). The effectiveness of different meso-scale rugosity metrics for predicting intra-habitat variation in coral-reef fish assemblages. Environ. Biol. Fishes 94, 431–442. doi: 10.1007/s10641-011-9956-2
Hardiman, B. S., Bohrer, G., Gough, C. M., Vogel, C. S., and Curtis, P. S. (2011). The role of canopy structural complexity in wood net primary production of a maturing northern deciduous forest. Ecology 92, 1818–1827. doi: 10.1890/10-2192.1
Hellequin, L., Boucher, J. M., and Lurton, X. (2003). Processing of high-frequency multibeam echo sounder data for seafloor characterization. IEEE J. Ocean. Eng. 28, 78–89. doi: 10.1109/JOE.2002.808205
Jeffries, M. (1993). Invertebrate colonization of artificial pondweeds of differing fractal dimension. Oikos 67, 142–148. doi: 10.2307/3545104
Karr, J. B., and Roth, R. R. (1971). Vegetation structure and avian diversity in several new world areas. Am. Nat. 105, 423–435. doi: 10.1086/282735
Knudby, A., and LeDrew, E. (2007). “Measuring structural complexity on coral reefs,” in Proceedings of the American Academy of Underwater Science (AAUS) 26th Symposium, eds N. W. Pollock and J. M. Godfrey (Miami, FL).
Knudby, A., Pittman, S. J., Maina, J., and Rowlands, G. (2014). “Remote sensing and modeling of coral reef resilience,” in Remote Sensing and Modeling, eds C. W. Finkl and C. Makowski (New York, NY: Springer International Publishing), 103–134.
Kohn, A. J. (1967). Environmental complexity and species diversity in the gastropod genus Conus on Indo-West Pacific reef platforms. Am. Nat. 101, 251–260. doi: 10.1086/282488
Kostylev, V. E., Erlandsson, J., Ming, M. Y., and Williams, G. A. (2005). The relative importance of habitat complexity and surface area in assessing biodiversity: fractal application on rocky shores. Ecol. Complex. 2, 272–286. doi: 10.1016/j.ecocom.2005.04.002
Kovalenko, K. E., Thomaz, S. M., and Warfe, D. M. (2012). Habitat complexity: approaches and future directions. Hydrobiologia 685, 1–17. doi: 10.1007/s10750-011-0974-z
Lapointe, L., and Bourget, E. (1999). Influence of substratum heterogeneity scales and complexity on a temperate epibenthic marine community. Mar. Ecol. Prog. Ser. 189, 159–170. doi: 10.3354/meps189159
Lingo, M. E., and Szedlmayer, S. T. (2006). The influence of habitat complexity on reef fish communities in thenortheastern Gulf of Mexico. Environ. Biol. Fishes 76, 71–80. doi: 10.1007/s10641-006-9009-4
Luckhurst, B. E., and Luckhurst, K. (1978). Analysis of the influence of substrate variables on coral reef fish communities. Mar. Biol. 49, 317–323. doi: 10.1007/BF00455026
MacArthur, R. H., and MacArthur, J. (1961). On bird species diversity. Ecology 42, 594–598. doi: 10.2307/1932254
Mandelbrot, B. B., and Blumen, A. (1989). “Fractal geometry: what is it, and what does it do?[and Discussion],” in Proceedings of the Royal Society of London A: Mathematical, Physical and Engineering Sciences, Vol. 423, No. 1864 (London: The Royal Society), 3–16.
McCormick, M. I. (1994). Comparison of field methods for measuring surface topography and their associations with a tropical reef fish assemblage. Mar. Ecol. Prog. 112, 87–96. doi: 10.3354/meps112087
McCoy, E. D., and Bell, S. S. (1991). “Habitat structure: the evolution and diversification of a complex topic,” in Habitat Structure, eds S. S. Bell, E. D. McCoy, and H. R. Mushinsky (London), 3–27.
McElhinny, C., Gibbons, P., Brack, C., and Bauhus, J. (2005). Forest and woodland stand structural complexity: its definition and measurement. For. Ecol. Manage. 218, 1–24. doi: 10.1016/j.foreco.2005.08.034
Mitik-Dineva, N., Wang, J., Truong, V. K., Stoddart, P., Malherbe, F., Crawford, R. J., et al. (2009). Escherichia coli, Pseudomonas aeruginosa, and Staphylococcus aureus attachment patterns on glass surfaces with nanoscale roughness. Curr. Microbiol. 58, 268–273. doi: 10.1007/s00284-008-9320-8
Moore, E. C., and Hovel, K. A. (2010). Relative influence of habitat complexity and proximity to patch edges on seagrass epifaunal communities. Oikos 119, 1299–1311. doi: 10.1111/j.1600-0706.2009.17909.x
Palmer, M. W. (1992). The coexistence of species in fractal landscapes. Am. Nat. 139, 375–397. doi: 10.1086/285332
Renard, F., Candela, T., and Bouchaud, E. (2013). Constant dimensionality of fault roughness from the scale of micro−fractures to the scale of continents. Geophys. Res. Lett. 40, 83–87. doi: 10.1029/2012GL054143
Risk, M. J. (1972). Fish Diversity on a Coral Reef in the Virgin Islands. Atoll Res. Bull. 153, 1–6.
Rogers, A., Harborne, A. R., Brown, C. J., Bozec, Y. M., Castro, C., Chollett, I., et al. (2015). Anticipative management for coral reef ecosystem services in the 21st century. Glob. Chang. Biol. 21, 504–514. doi: 10.1111/gcb.12725
Russ, G. R. (1980). Effects of predation by fishes, competition, and structural complexity of the substratum on the establishment of a marine epifaunal community. J. Exp. Mar. Biol. Ecol. 42, 55–69. doi: 10.1016/0022-0981(80)90166-5
Schneider, C. A., Rasband, W. S., and Eliceiri, K. W. (2012). NIH Image to ImageJ: 25 years of image analysis. Nat. Methods 9, 671–675. doi: 10.1038/nmeth.2089
Simon, R. M., and Simon, R. H. (1995). Mid-Atlantic salt-marsh shorelines: mathematical commonalities. Estuaries 18, 199–206. doi: 10.2307/1352630
Sleeman, J. C., Boggs, G. S., Radford, B. C., and Kendrick, G. A. (2005). Using agent−based models to aid reef restoration: enhancing coral cover and topographic complexity through the spatial arrangement of coral transplants. Restor. Ecol. 13, 685–694. doi: 10.1111/j.1526-100X.2005.00087.x
Sugihara, G., and May, R. M. (1990). Applications of fractals in ecology. Trends Ecol. Evol. 5, 79–86. doi: 10.1016/0169-5347(90)90235-6
Taniguchi, H., Nakano, S., and Tokeshi, M. (2003). Influences of habitat complexity on the diversity and abundance of epiphytic invertebrates on plants. Freshw. Biol. 48, 718–728. doi: 10.1046/j.1365-2427.2003.01047.x
Taylor, L. H. (2007). Navigation: An Underwater Laser Equipped “Yardstick”. Available online at: http://www-personal.umich.edu/~lpt/yardstick.htm
Tews, J., Brose, U., Grimm, V., Tielbörger, K., Wichmann, M. C., Schwager, M., et al. (2004). Animal species diversity driven by habitat heterogeneity/diversity: the importance of keystone structures. J. Biogeogr. 31, 79–92. doi: 10.1046/j.0305-0270.2003.00994.x
Thomas, F. I. M., and Atkinson, M. J. (1997). Ammonium uptake by coral reefs: effects of water velocity and surface roughness on mass transfer. Limnol. Oceanogr. 42, 81–88. doi: 10.4319/lo.1997.42.1.0081
Tokeshi, M., and Arakaki, S. (2012). Habitat complexity in aquatic systems: fractals and beyond. Hydrobiologia 685, 27–47. doi: 10.1007/s10750-011-0832-z
Willis, S. C., Winemiller, K. O., and Lopez-Fernandez, H. (2005). Habitat structural complexity and morphological diversity of fish assemblages in a Neotropical floodplain river. Oecologia 142, 284–295. doi: 10.1007/s00442-004-1723-z
Keywords: coral reefs, structural complexity, habitat complexity, spatial scales, rugosity, coefficient of variation, neighbors distance, point intercept contour
Citation: Yanovski R, Nelson PA and Abelson A (2017) Structural Complexity in Coral Reefs: Examination of a Novel Evaluation Tool on Different Spatial Scales. Front. Ecol. Evol. 5:27. doi: 10.3389/fevo.2017.00027
Received: 03 November 2016; Accepted: 21 March 2017;
Published: 07 April 2017.
Edited by:
Alberto Basset, University of Salento, ItalyReviewed by:
Rafael Sarda, Consejo Superior de Investigaciones Científicas, SpainGiuseppe Corriero, Università degli Studi di Bari Aldo Moro, Italy
Copyright © 2017 Yanovski, Nelson and Abelson. This is an open-access article distributed under the terms of the Creative Commons Attribution License (CC BY). The use, distribution or reproduction in other forums is permitted, provided the original author(s) or licensor are credited and that the original publication in this journal is cited, in accordance with accepted academic practice. No use, distribution or reproduction is permitted which does not comply with these terms.
*Correspondence: Roy Yanovski, eWFub3Zza2lyQGdtYWlsLmNvbQ==