 Kyle B. Gustafson
 Basil S. Bayati
 Philip A. Eckhoff
- Applied Math, Institute for Disease Modeling, Intellectual Ventures, Bellevue, WA, USA
Mobility networks facilitate the growth of populations, the success of invasive species, and the spread of communicable diseases among social animals, including humans. Disease control and elimination efforts, especially during an outbreak, can be optimized by numerical modeling of disease dynamics on transport networks. This is especially true when incidence data from an emerging epidemic is sparse and unreliable. However, mobility networks can be complex, challenging to characterize, and expensive to simulate with agent-based models. We therefore studied a parsimonious model for spatiotemporal disease dynamics based on a fractional diffusion equation. We implemented new stochastic simulations of a prototypical influenza-like infection spreading through the United States' highly-connected air travel network. We found that the national-averaged infected fraction during an outbreak is accurately reproduced by a space-fractional diffusion equation consistent with the connectivity of airports. Fractional diffusion therefore seems to be a better model of network outbreak dynamics than a diffusive model. Our fractional reaction-diffusion method and the result could be extended to other mobility networks in a variety of applications for population dynamics.
1. Introduction
Characterization of the spatiotemporal dynamics of infection during disease outbreaks is an essential problem for disease control and elimination (Oro, 2013). The fundamental process is broadly analogous to the invasion of an ecosystem by a non-native species (Lurgi et al., 2014) or the changing spatial distribution of a expanding population (Phillips et al., 2010). Epidemiological models that incorporate spatial dispersion have been used for numerous diseases such as measles (Grenfell et al., 2001; Bharti et al., 2011), dengue (Cummings et al., 2004; Chao et al., 2012; Perkins et al., 2013), seasonal influenza (Viboud et al., 2006), and pandemic flu (Ferguson et al., 2005; Van Kerkhove et al., 2010; Merler et al., 2011). Effective communication and collaboration between mathematical modelers and field ecologists will lead to faster progress. A recent review of the topic (Riley et al., 2015) identified five opportunities for including spatial effects in epidemic models, including the issue of long-distance transport.
Transport models are fundamental to many problems in population dynamics. The underlying spatial process for many models of dispersion and disease spreading is often assumed to be classical diffusion, gravity-like migration, or radiation flux (Simini et al., 2012). However, these are not necessarily valid for mobility networks with long-range movements, as was shown for the circulation of US bank notes by Brockmann et al. (2006). Thus, it seems that solutions to spatial ecology problems with long-range movements should consider alternatives to classical diffusion, as described in detail in a recent monograph (Mendez et al., 2014).
The bank note tracking study used ambivalent fractional diffusion as a generalized model of a transport process with power-law statistics, which explained ensemble trajectories of US bank notes measured through crowd-sourcing. The concept of fractional calculus was first conceived by Leibniz in 1695 (Ross, 1977) and has now realized applications across fields from ecology (Humphries et al., 2010; Jacobs and Sluckin, 2015; Meyer and Held, 2014) to plasma physics (Gustafson and Ricci, 2012; Bovet et al., 2014). A related transport model, space-fractional diffusion, can be derived from a generalization of the diffusive random walk when the distribution of step sizes in the walk is described by a power law, x−(1+α) with α ≤ 2, instead of a normal distribution.
The spread of a disease through a population distributed across a spatial landscape can be distilled into the dual processes of local transmission and long-range movement of infected individuals. While most human movements tend to be short distances, it is the longer-distance movements that are often most problematic for disease control if they introduce the disease to a new location beyond the spatial focus of existing control efforts. The tail of the probability distribution of movements thus can have substantial effects on the global dynamics of a disease, and a heavy-tailed process may be fundamentally different from a process with thin tails. While it may be advantageous and realistic to utilize a heavy-tailed human movement process such as the Lévy flight, its use is often limited by the combined challenges of parameterizing the Lévy flight process from data and efficiently and simply implementing it computationally (Ajelli et al., 2010). These two challenges are addressed in the present manuscript using a combination of data from a long-range human transport network and a compartmental modeling framework.
Step-size distributions from human displacements can be measured on many scales through channels ranging from walking, driving, and flying (Tatem et al., 2006). The relative importance of these channels for spatial epidemic models depends on the density and territorial extent of a connected population (Colizza et al., 2006, 2007). We decided to focus on data from the scheduled air traffic network that determines long-range transport in developed countries with large land area, such as the United States, China or India. Since the US air traffic network is dense and connected across long distances, we focused on the U. S. as a touchstone for validating our fractional superdiffusion model.
We accessed a flight schedule database to determine passenger transport rates between areas serviced by commercial flights. We limited our mobility model to air travel since we were interested in highlighting long-range travel that is relatively insensitive to local commuting (Balcan et al., 2009a; Strano et al., 2015). Others (Brockmann and Helbing, 2013) have already performed stochastic simulations of a realistic pandemic using global mobility data and examined a variety of network structures for disease dynamics (Keeling, 2005; Leventhal et al., 2015). Additionally, we extended the stochastic fractional-diffusion work presented in Bayati (2013) with a more accurate, spatially second-order fractional-diffusion method. Our method is related to fractional reaction-diffusion equations previously explored analytically and numerically (del Castillo-Negrete et al., 2003; Stollenwerk and Pedro Boto, 2009; Hanert et al., 2011; Hanert, 2012).
This report is organized as follows. First we show our analysis of commercial air traffic on several countries' national flight networks before focusing on the USA. We extracted a superdiffusive transport exponent from the distribution of step sizes in the network data. We then describe our version of a stochastic susceptible-infected-susceptible (SIS) simulation to model seasonal influenza, using USA air traffic data to form a weighted adjacency matrix connecting populated areas exposed to the disease. We found these results to be in agreement with known seasonal SIS behaviors, validating our new simulations. Next, focusing on a non-seasonal saturating SIS outbreak, we propose a one-dimensional, space-fractional-diffusion equation as a macroscale substitute for simulating the United States' commercial air traffic mixing network. We found that this space-fractional approximation reproduces the national-average SIS infection curve best when the fractional exponent is similar to the superdiffusive exponent measured from the national flight network. We found this result to be insensitive to the value of R0. In cases such as the one studied here, where long-range displacements form an important component of mobility, fractional diffusion is a promising macroscale approximation for transport dynamics of disease outbreaks.
2. Methods
In this work we used two approaches to investigate a real world meta-population model of an SIS outbreak with transport of susceptible and infected individuals between nodes. First we built a direct simulation of air traffic transport using data from real-world flight networks. Second we adapted a stochastic fractional-diffusion-reaction equation with parameters measured from the tails of the distribution of air passenger flight data. Both methods use the same stochastic algorithm for infection dynamics separately at each node of the transport network. All simulations were coded in Matlab and made publicly available here: github.com/kgustafIDM/fractair. Each simulation for 482 network nodes in the USA required no more than 48 h of serial calculations on a Dell Latitude E7450 laptop with 4 GB RAM and Intel Core i7 processor. Computational time scaled linearly with the number of nodes as each metapopulation required a stochastic simulation of the SIS dynamics.
2.1. Air Travel Network Simulation
Air travel was specified by a matrix of transfer rates from node to node using flight schedules taken from the OAG airline database (www.oag.com), which includes flight data from over 900 airlines Figure 1A. Similar datasets are available from other sources (Balcan et al., 2009b). Other authors have conducted more detailed analyses of air travel networks (Grosche et al., 2007), but our focus was on reproducing large-scale epidemic dynamics. The OAG database was the source for all national flight networks used to build the transfer matrices. For each flight itinerary, the database includes origin and destination airport codes (IATA), number of seats, and frequency of flight per week. We computed displacements of passengers summed over a week, assuming that all seats in the airplane are occupied. This approximation should be sufficient for tracking infections for diseases with incubation times lasting several days. We do not explicitly model infections occurring inside the aircraft.
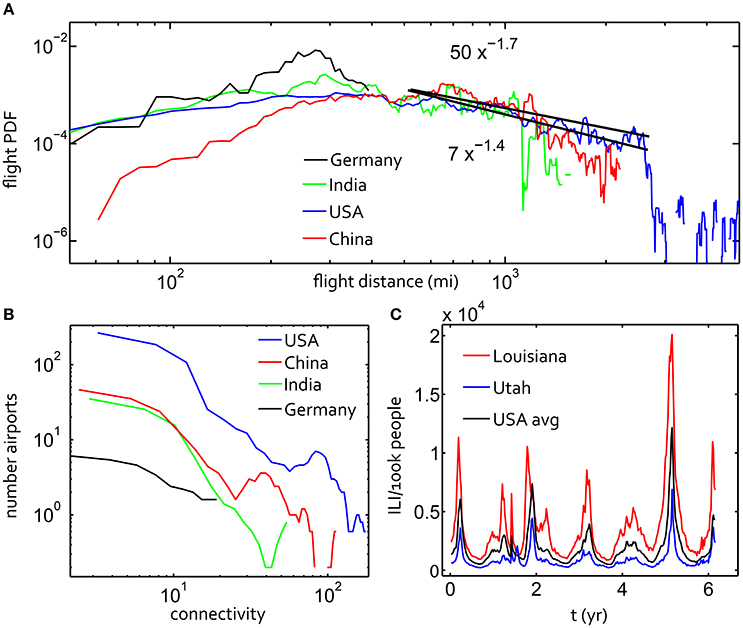
Figure 1. (A) The probability of a flight/step of a certain number of miles within a week-long time interval for displacements on the air travel networks in the USA, China, Brazil and India. Considering the power law scaling −(1 + α) of this data for flight distances between 400 and 2,500 miles, black lines are fit for α = 0.3, α = 0.6, α = 0.9. (B) Distribution of connectivity for these four countries' flight networks. (C) Google Flu Trends for the USA average and for two states with noticeably different histories.
We treated each airport as a service area with a meta-population acting as a proxy for the actual population in the service area. Rather than attempting to measure the relative size of each population served by an airport, we scaled the populations by the relative connectivity of each airport service center Figure 1B. Connectivity, Cn, for a given node is the number of other nodes with a connecting flight to that node. A minimum node population size was fixed at Nmin = 1, 000 proxy individuals, and the total number of population units at a node, Ntot = Nmin + BnCn. Here both Nmin and Bn were chosen by scanning across several values to enable stochastic fluctuations in the populations. If the populations are too large, this compartmental susceptible-infection approximation does not capture stochastic fluctuations. The population units in the simulation should be re-calibrated for other applications.
The rates of transport on the flight network were renormalized to give realistic transport rates. In particular, the transfer rate of proxy individuals was the sum , where Si is the number of seats for flight i between the two nodes and Ai is the number of days per week that the connection is serviced. Therefore, the transfer operator was applied on a weekly basis, which sets the time-scale for the simulations. The transfer matrix was also symmetrized to eliminate small errors in the database and ensure conservation of total network population. Moreover, the database-derived transfer operator was reduced, through Bn, to prevent small proxy populations from being quickly depleted. Thus, our simulations on the air traffic network should be considered as an approximation that preserved the relative size of each population center and the relative transport of proxy individuals between them. Applying the transfer operator on a weekly basis assumed that the infected proportion of the population does not change significantly on the weekly timescale.
2.2. Fractional Diffusion Simulation
An infectious disease model such as the one used in this work can be constructed with a reaction-diffusion process. Mathematically, a reaction-diffusion process can be described by a so-called master equation, which is a differential equation (Kampen, 2007). The master equation describes the time course of a probability density vector, where each element of the vector denotes a state of the system. In population modeling, these states are the number of individuals in particular categories, such as infected-with or susceptible-to a disease. Thus a reaction-diffusion model can help to understand and predict time series data for an epidemic. We will omit some details of the numerical method used in this work, which the reader can find in Bayati (2013), but will include enough here for a degree of completeness. The diffusion equation, from Brownian motion, is a special case of the fractional-diffusion equation. Both can be solved from the master equation approach (Mendez et al., 2014).
As discussed in Jahnke and Altintan (2010) and Bayati (2013) the master equation can be solved analytically in some instances, and therefore it is useful to partition the master equation and use analytical solutions when possible. Mathematically, this means we can combine an exactly solvable model with a stochastic numerical simulation to arrive at a probabilistic result. The reactions were simulated with a numerical method, which we discuss below, since analytical solutions are generally unavailable. The fractional diffusion portion was both solved analytically and applied numerically using a sample from a multinomial distribution (Bayati, 2013), a generalization of the usual binomial probability distribution. In other words, the diffusion process was applied over a time-step Δt and the system was updated, then the reactions were simulated with another time-step Δt. These two steps constitute a single iteration in the numerical method.
The air traffic transport process consists of transitions that are not necessarily limited to adjacent nodes. Fittingly, the space-fractional diffusion operator is non-local and naturally accounts for the long tails in step-size distributions observed in some air traffic networks and other mobility networks. In previous work (Bayati, 2013) a first-order method was used to simulate the diffusion process. Here, we have followed (Ortigueira, 2006) and used a more accurate, second-order method for the fractional diffusion process. The method we used for this work is the same as in Bayati (2013) except we used the following fractional-diffusion kernel:
where Γ(·) denotes the Γ function, D denotes the diffusion coefficient, denotes the jth component of the vector 𝔊(λ′), h the size of the compartment, α the value of the fractional derivative, and provided that the following time-step criterion is satisfied:
In practice, the time step should be chosen an order of magnitude less than the right-hand side of Equation (3). We chose a spatial boundary condition that fixes the value of the population at zero at the edges of the domain. A kernel is a mathematical expression that can be used to evolve a model forward in time and through space.
If denotes the concentration of people at position x ∈ ℝ at time t, then the expected value of the method with the kernel above converges to the symmetric, space-fractional diffusion equation (Mainardi et al., 1997; Gorenflo and Mainardi, 1998; Gorenflo et al., 2002a,b; Bayati et al., 2011):
where α ∈ (0, 2]. This equation is analogous to the usual diffusion equation when the step-size distribution is similar to a normal distribution. In this case, α = 2.
2.3. Simulating Disease Dynamics
For our simulations of transport due to either fractional diffusion or air traffic, each node had a finite population subject to a susceptible-infectious-susceptible (SIS) disease process. The infection dynamics were applied independently to the nodes. Since we are generally interested in accounting for stochastic effects, such as fade-out and bursting, we used the τ-Leaping stochastic simulation algorithm (Gillespie, 2001). In the standard SIS system, the infection contact rate may vary with time and correspond to the following discrete reactions:
where S is the susceptible species and I is the infected species. This discrete model corresponds to the following differential equations when the population is large:
where N = S + I is the total population, S0 is the initial number of susceptible individuals and β(t) and γ are parameters that determine the reproduction number . When β(t) is allowed to oscillate in time, β = < β(t) > t is the time averaged value across one oscillation (typically a season).
The β and γ parameters affect both the rate at which the infection grows and the steady-state infected fraction. The variation in infection rate can be modeled with a simple sinusoidal function, or as we implemented for the first part of the results, with a time-course explicitly fit to the Google Flu Trends (GFT) database (Ginsberg et al., 2009). We set β(t) = β0(t), where (t) is the national averaged oscillation in seasonal flu from GFT, normalized to the average value. The GFT data gives an estimate of the occurrence of influenza-like illness (ILI) according to internet searches. While the predictive power of GFT data has recently been challenged (Lazer et al., 2014), the qualitative pattern of the GFT data is descriptive of influenza occurrence. In some of our simulations of the USA flight network, we used the historical GFT time course for individual states, shown in Figure 1C.
We scanned through γ and β to determine whether it was possible to use the fractional-reaction diffusion equation to minimally model the epidemic on the air traffic network. We note that R0 in pandemics such as the 1918 flu has been estimated to be in the range of range 1.4–2.8 (Coburn et al., 2009). Simulations with values of R0 closer to unity exhibit greater stochastic effects (Bayati and Eckhoff, 2012). In our results, values of R0 = 4 or R0 = 2 were used as reference scenarios.
3. Results
3.1. Determining Superdiffusion Parameters for Air Traffic
When aggregating the full set of flight data for several countries' air travel networks, a power law distribution of displacements was readily observed. Countries with large land areas and a dense airport network tend to have a heavy-tailed distribution of air travel step sizes, as shown in Figure 1A. Relative to those from the USA and China, displacement distributions from Brazil and India had a flat tail with a shorter flight range due to the geographic area and distribution of population centers in these countries. The USA network step-size distribution had a superdiffusive power-law exponent 1 + α ~ 1.55 ± 0.15 for a significant fraction of displacements in the main part of the tail of the distribution. We fit this power law within the range shown by the black lines using the Nelder-Mead method through the open Matlab toolbox Ezyfit. This power law is truncated sharply for steps larger than 1,500 miles for the USA. We note that the superdiffusive scaling in US travel displacements with α = 0.6 was also inferred from the dispersion of US bank notes (Brockmann et al., 2006). India, China and the USA show similarities in the shape of the step-size distribution to the upper bound.
There are two parameters necessary to specify the approximate power law fit indicated in Figure 1A: α and D for the slope and intercept of the line in log-log scale. These parameters appear in qα, a large step-size (|x| → ∞) limiting solution of a space-fractional diffusion equation (for constant t):
Here Γ is the extension of the factorial function, π is the transcendental number, and t = 1 since our random walk statistics are time-invariant. This formula (Mainardi et al., 2007) allowed us to estimate the order of magnitude of D, which we found to be D ~ 1 when α ~ 0.4 and D ~ 10 when α ~ 0.7. This well-grounded, if inexact, calculation of D was supported by our parameter scan later in the results section.
The distributions of airport connectivity for the same four countries are given in Figure 1B, where connectivity for a given node is simply the number of other nodes with a connecting flight to that node. This plot makes clear that the United States' network is roughly ten times denser than the next example, China, though the shapes of the curves are similar. With 482 nodes, the US air travel network is significantly denser than any other single nation examined. This network was therefore the focus of our study to find a plausible fractional diffusion approximation for a human mobility network superimposed with disease dynamics.
3.2. Visualizing Seasonality of Outbreaks on an Air Travel Network
We used the susceptible-infected-susceptible (SIS) differential equations (see Section 2). Since we considered an outbreak at a single location, the fraction S0/N for the entire network is effectively unity. Since the flu virus evolves seasonally to reinfect populations, we treated the dynamics as effectively SIS. Our air travel network simulations produced node-by-node seasonal SIS disease dynamics initiated by an outbreak of infection at a single airport. Examples are shown in Figure 2 for outbreaks at a highly connected node (ATL) and a poorly connected node (COS). Due to the seasonal reduction of infectivity β(t) and subsequent stochastic fadeout of infections, the epidemic disappeared within 3 years for this combination of < β(t) >t = 12 and γ = 3, or < R0(t)>t = 4. Short movies showing the evolution of these outbreaks are provided as Supplementary Material.
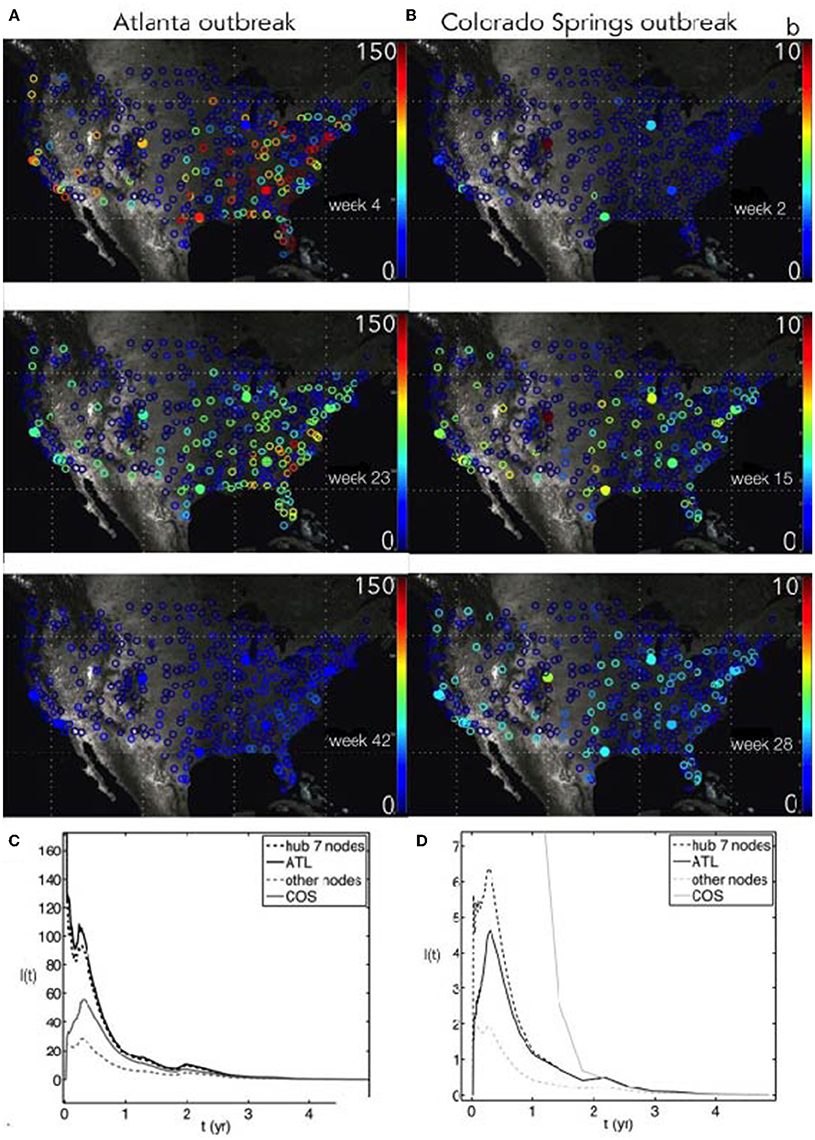
Figure 2. (A,B) Outbreak of a stochastic seasonal SIS influenza-like infection on the USA flight network, with origins either in Atlanta (ATL) (A) or Colorado Springs (COS) (B). The seasonal force of infection is scaled using the Google Flu Trends timeseries for infectivity β(t), where the baseline β0 = 12 and γ = 3. After some time (top to bottom), the disease propagates throughout the network and tends to fade out due to stochastic fluctuations and dilution. The colorbar shows the number of infected population units for each node, I(t). (C,D) Time course of SIS outbreaks for the networks in the above panels, showing the average infected for the seven most connected hubs, the average infected for all other nodes, and the specific nodes ATL and COS.
A highly-connected ATL-seeded outbreak shows a faster disease dispersion compared to the poorly-connected COS-based outbreak. We chose a 50% initial infected fraction to ignore the possibility of a long latency between the initial node outbreak and a network-wide epidemic. The magnitude of the initial infected fraction does not change the main results here, as a larger infected fraction will only decrease the delay to network-wide infection. However, in the stochastic simulations, a very small initial infected fraction will lead to disease fadeout before it can move onto the network.
The faster growth rate after Atlanta seeding was due to the number of flight connections and the higher peak amplitude of infection is due to the larger population of the Atlanta airport service area, which led to a larger number of infected people traveling. The Atlanta seeded infection quickly moved to the other hubs in the network and concentrated infections in the South. The expected contrast for a Colorado Springs-seeded outbreak is seen in the right-hand panels (Figures 2B,D). This outbreak, at a less-connected node, entered the network at the hubs (such as Denver) and traveled more uniformly throughout the country, with a much lower intensity (note difference in scales for I(t)).
3.3. Fractional Reaction-Diffusion With an SIS Outbreak
Next, we removed seasonality from the simulations and examined the SIS fractional diffusion model. According to the SIS model, the epidemic saturates at I∞(β, γ). However, while the saturated state is determined by the SIS parameters, the shape of I(t) during the expanding phase of the outbreak is influenced by the the calibrated fractional diffusion parameters, which act as a proxy for the air traffic network.
We implemented the SIS reaction system with this space-fractional reaction-diffusion model using both deterministic and stochastic solvers for the transport. These results are shown in Figure 3 for constant β = 12 and γ = 3, giving R0 = 4. We chose two reference values of α to highlight the differences between a very superdiffusive α = 0.3 and a less superdiffusive α = 1.3. The scaling exponent η of dispersion with time, σ2 = Dtη, is more superdiffusive for smaller values of α: η = 2/α. The smaller value of α = 0.3 clearly leads to faster spreading of the disease compared to α = 1.3.
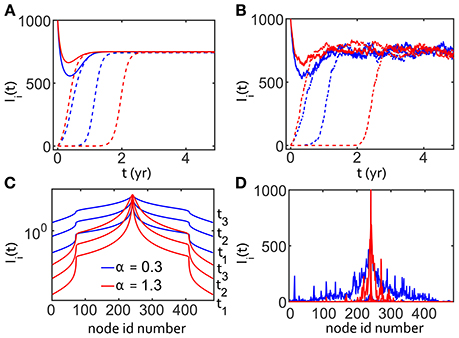
Figure 3. One dimensionalgridded SIS simulations with R0 = 4 using fractional diffusion. One thousand population units are simulated at each node. Blue denotes a very superdiffusive transport α = 0.3 and red denotes a less superdiffusive α = 1.3 in all panels. (A) Time dependence of the number of infected Ii(t), for three nodes on the grid for two different values of α. Solid lines show number of infected at the node where the infection was seeded. The dashed lines show data from two other nodes for each value of α, where the outbreak arrives later. (B) Same as previous except with stochastic fluctuations. (C) Spatial dependence, at grid point i, of the infection for three time-points, denoted by t1, t2, t3 for both values of α without stochastic effects. Several curves are shown to demonstrate that, as time progresses, the infection rises at distal nodes. (D) Same as (C) except with stochastic dynamics, showing left/right asymmetry and long range fluctuations.
For the deterministic case, Figures 3A,C, we used the analytic solution of the fractional diffusion operator in Equations (1) and (2). We introduced stochastic effects into the fractional-reaction-diffusion system using multinomial sampling, resulting in Figures 3B,D. We used 482 nodes along a line as shown, seeded at node i = 241, with 1,000 population units per node. The outbreak was seeded with all population units infected at the center node in order to magnify the amplitude and shorten the timescale for analysis. While a smaller infected fraction changes the time delay to epidemic steady-state, we verified that the initial magnitude does not affect the relative shape of the epidemic curve for different values of α.
Figure 3A shows the time-dependence of Ii for three nodes taken from the symmetric solution shown in Figure 3C. The number of infected population units decreased for the central outbreak node and rose for other nodes, as expected. One of the distal nodes is further from the outbreak, a difference that determined the delay in the arrival of the outbreak, separating the curves in Figures 3A,B. All nodes eventually reached the same steady state with in the absence of seasonal forcing. Moving the observation point away from the center node delayed the arrival, as expected, of the outbreak wave. The shape of the propagating front of the infection in Figure 3C was determined partly by the fixed boundary condition, Ibnd(t) = 0, but this is irrelevant due to the small fraction of population in the distal nodes as I(t) → I∞.
Stochastic behavior was apparent in Figures 3B,D compared to the temporal and spatial dependence of the deterministic SIS model for the same values of α in Figures 3A,C. We saw that stochasticity can affect the time of saturation for Ii for nodes far from the center of the outbreak, though the steady-state mean fraction of infected is the same. The spatial dependence of Ii on the grid position also shows the importance of stochastic reactions for amplifying infection at distal nodes, as well as the appearance of asymmetry due to fluctuations. Without stochastic fluctuations, the time delay to infection saturation is proportional to the distance from the outbreak node. We noted that stochastic fluctuations delay the saturation time for the outbreak source node, especially in the less superdiffusive (α = 1.3) case. We chose to plot Figure 3C in log-log to highlight the shape of the propagating front, but chose linear-log for Figure 3D to highlight the heterogeneity introduced by stochastic effects.
In addition to the obvious effect due to the distance from the outbreak node, the time to saturation was also influenced by the fractional diffusion parameters α and D, such that larger (less superdiffusive) values of α imply a longer delay to full network saturation. Following this observation, we exploited the outbreak curve's dependence on the parameters of the fractional diffusion model to find the remarkable comparison described in the next section.
3.4. Capturing Features of an Air Traffic-driven Outbreak with Fractional Diffusion
The power law tail for the probability of displacements on the air travel network (Figure 1A) was calibrated to a non-local space-fractional diffusion operator (see Section 2), suggesting that normal diffusion is an inadequate approximation. For the comparison between air traffic and superdiffusion for an SIS disease, we excluded stochastic effects and seasonal forcing, since our main conclusions here are not sensitive to these features. Thus, the relative shape of the network-averaged epidemic curve should be a good test of whether the data-driven superdiffusion model can emulate the mobility due to air travel.
We compared air traffic and fractional diffusion using the cumulative difference, , between < I(t) > /N curves for 0 < t < t∞. Here, < I(t)> is the network-averaged number of infected and t∞ is the time at which the I∞ value is reached. We let Ia(t) be the air traffic result and If(t) be the fractional diffusion result. Figure 4 shows the direct comparison for a single R0 = 4 over a range of fractional derivative α values with D = 5. The difference between the epidemic curve depended on the value of α, with α = 0.7 providing the best agreement. It is very clear that fractional superdiffusion is qualitatively better than classical Brownian diffusion for reproducing the air traffic network.
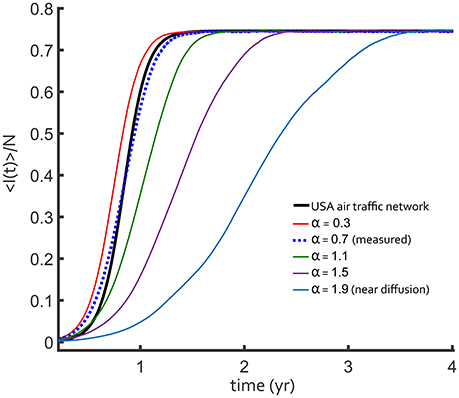
Figure 4. Fraction of infected total population for a constant R0 = 4, SIS influenza-like outbreak. The outbreak on the USA flight network (black curve) is compared to discretized fractional diffusion in one-dimension (colored curves). As the power law exponent α decreases, the transport becomes more superdiffusive and the dashed line is closer to the USA network result. The best-fit value of this exponent, α = 0.7 (blue dotted curve), is similar to the one measured in Figure 1A with D = 10.
This result is further supported by the Θ surface for a two-dimensional parameter scan of α and D in Figure 5. Independent of R0, there is a unique minimum in the values of α and D, consistent with the scaling in the long-tail limit of Equation (9). When α is larger, D is forced by the form of qα to be larger with a similar scaling as observed in the Θ surface. There is uncertainly in measuring both α and D, but within the parameter scan shown in Figure 5, a superdiffusive α is always preferred over a diffusive model. The agreement shown in Figure 4 was from the most plausible parameter pair that matches the data.
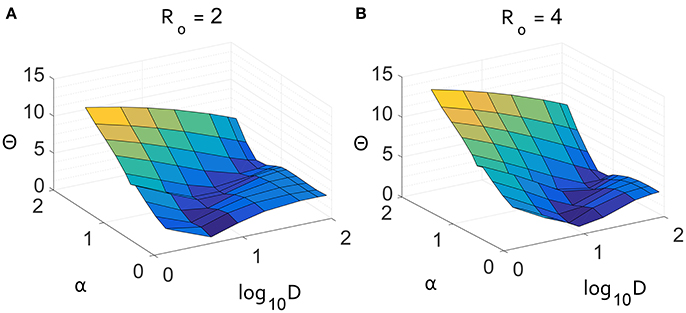
Figure 5. Result of parameter scan through α and D displaying the absolute distance Θ between the growth curves for average number of infected. The two panels show the difference for constant values of (A) R0 = 2 and (B) R0 = 4. These scans show that there is an optimal value of α that nearly matches the air travel model for both values of R0.
4. Discussion
Devising a campaign strategy for the dynamic control and elimination of an infectious disease in a population is a task that can benefit from computational modeling and an ecological perspective. We sought to encapsulate human mobility-driven spatial spreading of an infectious disease with a fractional reaction-diffusion model as an approximation to the full air travel network. We explored the validity of using a one dimensional fractional-diffusion model to approximate disease dynamics on the full air traffic network. Such a comparison proved to be useful for broadly interpreting the rate of increase in the fraction of infected individuals in the entire national population of the USA. We found good quantitative agreement, especially considering that the air traffic mobility network can be characterized only approximately by a power law tail. The connectivity of a node was known to be significantly more important for spatial disease propagation than physical distance, as previously described (Brockmann and Helbing, 2013).
Given that a heavy-tailed long-distance distribution of infected human movements will disproportionately affect the spatial spread of a disease, it is very desirable to have a simple modeling implementation of a fractional-diffusion human movement process. The present work implements an efficient computational solution for a fractional-diffusion transport model and demonstrates its parameterization to air-transport data for a variety of countries. This data-driven computational approach for human movement can be combined with a wide range of models for the local transmission and progression of a disease, facilitating spatially-explicit modeling of a wide array of pathogens.
For other problems in population dynamics it may be helpful to note the relevance of a fractional reaction-diffusion modeling approach. At first, one can immediately apply this result to the invasion of a non-native species as it “infects” the range of a native species (Hui and Richardson, 2017). If the invader, or its carriers, takes mobility step sizes characterized approximately by a power law, then the spreading process should be better approximated by fractional diffusion than classical diffusion. More broadly, we expect that the dissemination and expansion of the results reported here will be useful to the wider ecological modeling and data analysis communities. Such models cannot be expected to account for all of the detailed properties of dispersion in a mobility network, but we show here that they provide a useful and efficient macroscale approximation for a network with a power-law tail of displacements. Non-diffusive networks exist in many ecological contexts and we suggest that a fractional diffusion approach is a convenient but underutilized approach for modeling the interaction between transport and disease dynamics.
Several caveats apply to applications of the fractional reaction-diffusion approach. As noted in the bank note models (Brockmann et al., 2006), Lévy flights can be replaced more accurately by a full space-time fractional diffusion equation. Also, our attempt to translate an airport network into a linear series of nodes does not preserve the topology of the network. However, it does produce a compelling case for fractional diffusion instead of normal diffusion. This work could be advanced by considering other modes of transportation such as private vehicles and foot traffic. It may also be useful to consider a 2-D fractional-diffusion model, though the numerical implementation of non-local effects in two dimensions is a challenging area of current research (Hanert, 2012; Hanert and Piret, 2014). In practice, a natural process can only be roughly approximated by a Lévy flight. In some applications, a truncation of the Lévy flight or a similar Lévy walk can be a good approximation (Fogleman et al., 2001; Del-Castillo-Negrete, 2009; Gustafson and Ricci, 2012).
We conclude that a space-fractional diffusion model with superdiffusive statistics can emulate the dynamics of a generic disease on a densely connected, long-range transportation network. This result is meant to guide the selection of transport models in specific studies of disease and, more generally, population dynamics. Our method, based on well-grounded mathematical physics, can feasibly be applied by epidemiologists and population biologists for other transport networks that have heavy tails in the size of displacements between nodes (Miller, 2009; Draief and Ganesh, 2010). Along with other recent modeling results based on transportation network data (Balcan and Vespignani, 2011, 2012; Schumm et al., 2015), we aim to inform future large-scale experimental studies of spatial ecology and disease dynamics through these recently developed methods.
Author Contributions
BB and PE conceived the project. BB derived and tested the numerical method for solving fractional diffusion. KG analyzed the flight data, wrote the numerical methods and ran the simulations. BB and KG analyzed the results of the simulations. BB, KG, and PE wrote the manuscript.
Funding
The authors thank Bill and Melinda Gates for their active support of this work and their sponsorship through the Global Good Fund.
Conflict of Interest Statement
The authors declare that the research was conducted in the absence of any commercial or financial relationships that could be construed as a potential conflict of interest.
Acknowledgments
Thanks to Alexandre Bovet, Daniel Klein, Edward Wenger, and Josh Proctor for helpful conversations.
Supplementary Material
Movie 1. Outbreak of a seasonal, stochastic SIS infection in the Atlanta International airport (ATL) service area. The colorbar represents the number of infected population units at each node of the air travel network. Population sizes are scaled relatively to the size of the service area. The infection spreads quickly to hubs in the network and then fades out as the seasonal infectivity falls and stochastic fluctuations eliminate infected units. The average number of infected for this simulation is shown in Figure 3C. http://github.com/kgustafIDM/fractair/blob/master/movies/air43_50pct_nodATL_gflu.gif
Movie 2. Outbreak of a seasonal, stochastic SIS infection in the Colorado Springs airport (COS) service area. The colorbar represents the number of infected population units at each node of the air travel network. Population sizes are scaled relatively to the size of the service area. The infection spreads quickly to hubs in the network and then fades out as the seasonal infectivity falls and stochastic fluctuations eliminate infected units. The average number of infected for this simulation is shown in Figure 3D. http://github.com/kgustafIDM/fractair/blob/master/movies/air43_50pct_nodeCOS_gflu.gif
References
Ajelli, M., Gonçalves, B., Balcan, D., Colizza, V., Hu, H., Ramasco, J. J., et al. (2010). Comparing large-scale computational approaches to epidemic modeling: agent-based versus structured metapopulation models. BMC Infect. Dis. 10:190. doi: 10.1186/1471-2334-10-190
Balcan, D., Colizza, V., Gonçalves, B., Hu, H., Ramasco, J. J., and Vespignani, A. (2009a). Multiscale mobility networks and the spatial spreading of infectious diseases. Proc. Natl. Acad. Sci. U.S.A. 106, 21484–21489. doi: 10.1073/pnas.0906910106
Balcan, D., Colizza, V., Gonçalves, B., Hu, H., Ramasco, J. J., and Vespignani, A. (2009b). Multiscale mobility networks and the spatial spreading of infectious diseases. Proc. Natl. Acad. Sci. U.S.A. 106, 21484–21489. doi: 10.1073/pnas.0906910106
Balcan, D., and Vespignani, A. (2011). Phase transitions in contagion processes mediated by recurrent mobility patterns. Nat. Phys. 7, 581–586. doi: 10.1038/nphys1944
Balcan, D., and Vespignani, A. (2012). Invasion threshold in structured populations with recurrent mobility patterns. J. Theor. Biol. 293, 87–100. doi: 10.1038/nphys1944
Bayati, B. S. (2013). Fractional diffusion-reaction stochastic simulations. J. Chem. Phys. 138:104117. doi: 10.1063/1.4794696
Bayati, B., Chatelain, P., and Koumoutsakos, P. (2011). Adaptive mesh refinement for stochastic reaction-diffusion processes. J. Comp. Phys. 230, 13–26. doi: 10.1016/j.jcp.2010.08.035
Bayati, B. S., and Eckhoff, P. A. (2012). Influence of high-order nonlinear fluctuations in the multivariate susceptible-infectious-recovered master equation. Phys. Rev. E 86:062103. doi: 10.1103/PhysRevE.86.062103
Bharti, N., Tatem, A. J., Ferrari, M. J., Grais, R. F., Djibo, A., and Grenfell, B. T. (2011). Explaining seasonal fluctuations of measles in niger using nighttime lights imagery. Science (New York, N.Y.) 334, 1424–1427. doi: 10.1126/science.1210554
Bovet, A., Gamarino, M., Furno, I., Ricci, P., Fasoli, A., Gustafson, K., et al. (2014). Transport equation describing fractional lvy motion of suprathermal ions in torpex. Nucl. Fusion 54:104009. doi: 10.1088/0029-5515/54/10/104009
Brockmann, D., and Helbing, D. (2013). The hidden geometry of complex, network-driven contagion phenomena. Science 342, 1337–1342. doi: 10.1126/science.1245200
Brockmann, D., Hufnagel, L., and Geisel, T. (2006). The scaling laws of human travel. Nat. Lett. 439, 462–465. doi: 10.1038/nature04292
Chao, D. L., Halstead, S. B., Halloran, M. E., Longini, J., and Ira, M. (2012). Controlling dengue with vaccines in thailand. PLoS Negl. Trop. Dis. 6:e1876. doi: 10.1371/journal.pntd.0001876
Coburn, B. J., Wagner, B. G., and Blower, S. (2009). Modeling influenza epidemics and pandemics: insights into the future of swine flu (H1N1). BMC Med. 7:30. doi: 10.1186/1741-7015-7-30
Colizza, V., Barrat, A., Barthélemy, M., and Vespignani, A. (2006). The role of the airline transportation network in the prediction and predictability of global epidemics. Proc. Natl. Acad. Sci. U.S.A. 103, 2015–2020. doi: 10.1073/pnas.0510525103
Colizza, V., Barrat, A., Barthélemy, M., and Vespignani, A. (2007). Predictability and epidemic pathways in global outbreaks of infectious diseases: the sars case study. BMC Med. 5:34. doi: 10.1186/1741-7015-5-34
Cummings, D. A., Irizarry, R. A., Huang, N. E., Endy, T. P., Nisalak, A., Ungchusak, K., et al. (2004). Travelling waves in the occurrence of dengue haemorrhagic fever in thailand. Nature 427, 344–347. doi: 10.1038/nature02225
Del-Castillo-Negrete, D. (2009). Truncation effects in superdiffusive front propagation with Lévy flights. Phys. Rev. E 79:031120. doi: 10.1103/PhysRevE.79.031120
del Castillo-Negrete, D., Carreras, B. A., and Lynch, V. E. (2003). Front dynamics in reaction-diffusion systems with levy flights: a fractional diffusion approach. Phys. Rev. Lett. 91:018302. doi: 10.1103/PhysRevLett.91.018302
Draief, M., and Ganesh, A. (2010). A random walk model for infection on graphs: spread of epidemics & rumours with mobile agents. Discrete Event Dyn. Syst. 21, 41–61. doi: 10.1007/s10626-010-0092-5
Ferguson, N. M., Cummings, D. A., Cauchemez, S., Fraser, C., Riley, S., Meeyai, A., et al. (2005). Strategies for containing an emerging influenza pandemic in southeast asia. Nature 437, 209–214. doi: 10.1038/nature04017
Fogleman, M. A., Fawcett, M. J., and Solomon, T. H. (2001). Lagrangian chaos and correlated Lévy flights in a non-Beltrami flow: transient versus long-term transport. Phys. Rev. E 63:020101. doi: 10.1103/PhysRevE.63.020101
Gillespie, D. (2001). Approximate accelerated stochastic simulation of chemically reacting systems. J. Chem. Phys. 115, 1716–1733. doi: 10.1063/1.1378322
Ginsberg, J., Mohebbi, M. H., Patel, R. S., Brammer, L., Smolinski, M. S., and Brilliant, L. (2009). Detecting influenza epidemics using search engine query data. Nature 457, 1012–1014. doi: 10.1038/nature07634
Gorenflo, R., Fabritiis, G. D., and Mainardi, F. (2002b). Discrete random walk models for symmetric levy-feller diffusion processes. Physica A 269, 79–89. doi: 10.1016/S0378-4371(99)00082-5
Gorenflo, R., and Mainardi, F. (1998). Fractional calculus and stable probability distributions. Arch. Mech. 50, 1–10.
Gorenflo, R., Mainardi, F., Moretti, D., Pagnini, G., and Paradisi, P. (2002a). Discrete random walk models for space-time fractional diffusion. Chem. Phys. 284, 521–541. doi: 10.1016/S0301-0104(02)00714-0
Grenfell, B. T., Bjørnstad, O. N., and Kappey, J. (2001). Travelling waves and spatial hierarchies in measles epidemics. Nature 414, 716–723. doi: 10.1038/414716a
Grosche, T., Rothlauf, F., and Heinzl, A. (2007). Gravity models for airline passenger volume estimation. J. Air Trans. Manage. 13, 175–183. doi: 10.1038/414716a
Gustafson, K. B., and Ricci, P. (2012). Lévy walk description of suprathermal ion transport. Phys. Plasmas 19:2304. doi: 10.1063/1.3690097
Hanert, E. (2012). Front dynamics in a two-species competition model driven by Lévy flights. J. Theor. Biol. 300, 134–142. doi: 10.1016/j.jtbi.2012.01.022
Hanert, E., and Piret, C. (2014). A chebyshev pseudospectral method to solve the space-time tempered fractional diffusion equation. SIAM J. Sci. Comput. 36, A1797–A1812. doi: 10.1137/130927292
Hanert, E., Schumacher, E., and Deleersnijder, E. (2011). Front dynamics in fractional-order epidemic models. J. Theor. Biol. 279, 9–16. doi: 10.1016/j.jtbi.2011.03.012
Humphries, N. E., Queiroz, N., Dyer, J. R. M., Pade, N. G., Musyl, M. K., Schaefer, K. M., et al. (2010). Environmental context explains Lévy and Brownian movement patterns of marine predators. Nature 465, 1066–1069. doi: 10.1038/nature09116
Jacobs, G. S., and Sluckin, T. J. (2015). Long-range dispersal, stochasticity and the broken accelerating wave of advance. Theor. Popul. Biol. 100, 39–55. doi: 10.1016/j.tpb.2014.12.003
Jahnke, T., and Altintan, D. (2010). Efficient simulation of discrete stochastic reaction systems with a splitting method. BIT Numer. Math. 50, 797–822. doi: 10.1007/s10543-010-0286-0
Kampen, N. V. (2007). Stochastic Processes in Physics and Chemistry, 3rd Edn. North Holland: Elsevier B.V.
Keeling, M. (2005). The implications of network structure for epidemic dynamics. Theor. Popul. Biol. 67, 1–8. doi: 10.1016/j.tpb.2004.08.002
Lazer, D., Kennedy, R., King, G., and Vespignani, A. (2014). The parable of google flu: traps in big data analysis. Science 343, 1203–1205. doi: 10.1126/science.1248506
Leventhal, G. E., Hill, A. L., Nowak, M. A., and Bonhoeffer, S. (2015). Evolution and emergence of infectious diseases in theoretical and real-world networks. Nat. Commun. 6:6101. doi: 10.1038/ncomms7101
Lurgi, M., Galiana, N., Lpez, B. C., Joppa, L. N., and Montoya, J. M. (2014). Network complexity and species traits mediate the effects of biological invasions on dynamic food webs. Front. Ecol. Evol. 2:36. doi: 10.3389/fevo.2014.00036
Mainardi, F., Paradisi, P., and Gorenflo, R. (1997). “Probability distributions generated by fractional diffusion equations,” in International Workshop on Econophysics (Budapest).
Mainardi, F., Paradisi, P., and Gorenflo, R. (2007). Probability distributions generated by fractional diffusion equations. arXiv.org.
Mendez, V., Campos, D., and Bartumeus, F. (2014). Stochastic Foundations in Movement Ecology, 1st Edn. Berlin; Heidelberg: Springer-Verlag.
Merler, S., Ajelli, M., Pugliese, A., and Ferguson, N. M. (2011). Determinants of the spatiotemporal dynamics of the 2009 H1N1 pandemic in europe: implications for real-time modelling. PLoS Comput. Biol. 7:e1002205. doi: 10.1371/journal.pcbi.1002205
Meyer, S., and Held, L. (2014). Power-law models for infectious disease spread. Ann. Appl. Stat. 8, 1612–1639. doi: 10.1214/14-AOAS743
Miller, J. C. (2009). Percolation and epidemics in random clustered networks. Phys. Rev. E 80:020901. doi: 10.1103/PhysRevE.80.020901
Oro, D. (2013). Grand challenges in population dynamics. Front. Ecol. Evol. 1:2. doi: 10.3389/fevo.2013.00002
Ortigueira, M. (2006). Riesz potential operators and inverses via fractional centred derivatives. Int. J. Math. Math. Sci. 2006, 1–12. doi: 10.1155/IJMMS/2006/48391
Perkins, T. A., Scott, T. W., Le Menach, A., and Smith, D. L. (2013). Heterogeneity, mixing, and the spatial scales of mosquito-borne pathogen transmission. PLoS Comput. Biol. 9:e1003327. doi: 10.1371/journal.pcbi.1003327
Phillips, B. L., Brown, G. P., and Shine, R. (2010). Life-history evolution in range-shifting populations. Ecology 91, 1617–1627. doi: 10.1890/09-0910.1
Riley, S., Eames, K., Isham, V., Mollison, D., and Trapman, P. (2015). Five challenges for spatial epidemic models. Epidemics 10, 68–71. doi: 10.1016/j.epidem.2014.07.001
Ross, B. (1977). The development of fractional calculus. Hist. Math. 4, 75–89. doi: 10.1016/0315-0860(77)90039-8
Schumm, P., Scoglio, C., Zhang, Q., and Balcan, D. (2015). Global epidemic invasion thresholds in directed cattle subpopulation networks having source, sink, and transit nodes. J. Theor. Biol. 367, 203–221. doi: 10.1016/j.jtbi.2014.12.007
Simini, F., González, M. C., Maritan, A., and Barabási, A. L. (2012). A universal model for mobility and migration patterns. Nature 484, 96–100. doi: 10.1038/nature10856
Stollenwerk, N., and Pedro Boto, J. (2009). Reaction-superdiffusion systems in epidemiology, an application of fractional calculus. AIP Conf. Proc. 1168, 1548–1551. doi: 10.1063/1.3241397
Strano, E., Shai, S., Dobson, S., and Barthelemy, M. (2015). Multiplex networks in metropolitan areas: generic features and local effects. J. R. Soc. Interf. 12:20150651. doi: 10.1098/rsif.2015.0651
Tatem, A. J., Rogers, D. J., and Hay, S. I. (2006). Global transport networks and infectious disease spread. Adv. Parasitol. 62, 293–343. doi: 10.1016/s0065-308x(05)62009-x
Van Kerkhove, M. D., Asikainen, T., Becker, N. G., Bjorge, S., Desenclos, J. C., dos Santos, T., et al. (2010). Studies needed to address public health challenges of the 2009 H1N1 influenza pandemic: insights from modeling. PLoS Med. 7:e1000275. doi: 10.1371/journal.pmed.1000275
Keywords: fractional diffusion, disease modeling, transport networks, Levy flights, power law phenomena
Citation: Gustafson KB, Bayati BS and Eckhoff PA (2017) Fractional Diffusion Emulates a Human Mobility Network during a Simulated Disease Outbreak. Front. Ecol. Evol. 5:35. doi: 10.3389/fevo.2017.00035
Received: 28 November 2016; Accepted: 07 April 2017;
Published: 26 April 2017.
Edited by:
Mauricio Lima, Pontifical Catholic University of Chile, ChileReviewed by:
Sergio Andrés Estay, Austral University of Chile, ChileMauricio Canals, Universidad de Chile, Chile
Copyright © 2017 Gustafson, Bayati and Eckhoff. This is an open-access article distributed under the terms of the Creative Commons Attribution License (CC BY). The use, distribution or reproduction in other forums is permitted, provided the original author(s) or licensor are credited and that the original publication in this journal is cited, in accordance with accepted academic practice. No use, distribution or reproduction is permitted which does not comply with these terms.
*Correspondence: Kyle B. Gustafson, a2d1c3RhZnNvbkBpZG1vZC5vcmc=
†These authors have contributed equally to this work.