 Benjamin Shryock
 John M. Marzluff
 L. Monika Moskal
- School of Environmental and Forest Sciences, University of Washington, Seattle, WA, USA
Fluctuations in weather and forest productivity influence the abundance and richness of bird populations, however in a rapidly urbanizing landscape the relative importance of each factor may vary. We assessed this possibility in the Seattle, WA, USA region by correlating 10 years of bird richness and relative abundance of nine guilds indicative of their tolerance of human development, migration, diet and use of human food subsidies with an annual index of forest productivity (vegetation greenness derived from a 250 m resolution Normalized Difference Vegetation Index (NDVI) product from the MODIS satellite) and weather (variation in the Oceanic Niño Index, which estimates the strength of the El Niño-Southern Oscillation, a major driver of local temperature and precipitation). We found that variation in NDVI exerted a strong influence on the richness of the avian community and the abundance of guilds in landscapes undergoing active development, but was less influential in areas of established housing development or forested reserves. Relative to NDVI, weather was much less influential on the abundance of guilds at actively changing sites, and slightly more influential in forest reserves and established developments. Following the warm winter and during the dry summer associated with a strong El Niño, migrants and herbivores declined in changing landscapes, insectivores declined in established developments, and herbivores declined while synanthropic species increased in reserves. These changes may presage the effects of climate change in the Pacific Northwest, which are expected to be similar to El Niño conditions. To buffer these changes in native bird communities, planners, developers, regulators, and home owners should minimize the loss of vegetation during development and attempt to quickly achieve mature landscaping that preferably provides food and shelter for birds.
Introduction
Animals increasingly confront new challenges, many resulting from human activities that are extensive and enduring. While many challenges may be difficult to eliminate in a human-dominated world, by understanding their effects it may be possible to affect minor changes that significantly improve the chances for animals to thrive. Two such novel challenges are urbanization (Miller and Hobbs, 2002) and climate change (IPCC, 2007; Møller, 2013). Both dynamic, abiotic factors affect primary productivity and the biodiversity dependent upon it. In most ecosystems, urbanization influences primary productivity in a predictable way, with a decrease in productivity in proportion to the level of urbanization (Bino et al., 2008). Urbanization also interacts with climate, most obviously in forming the urban heat island, a pattern that has been intensifying in recent years (Hoffmann and Schlünzen, 2013). Concurrent changes in precipitation are less consistent than increased temperatures associated with the urban heat island, but increased downwind precipitation is a common effect of urbanization (Blake et al., 2011). Climate change has observable effects on plant and animal species as well as the communities and ecosystems they compose; changes include phenological mismatches, shifts in species ranges, and response to disturbance (Walther, 2010). Urbanization is exerting an equally pervasive force on ecological communities (Chace and Walsh, 2006; Marzluff et al., 2008), particularly as it removes, fragments, and degrades key habitat elements (Alberti, 2005; Marzluff, 2016) and changes biogeochemical cycles and trophic structure (Goldman et al., 1995; Kaye et al., 2006; Coleman et al., 2011). Animals that find themselves in these newly fragmented landscapes must cope with the changes in vegetation cover and the changes in energy provided by the remaining plants. Despite the severity of these novel changes, the interactive effects of urbanization and climate on plant and animal populations are rarely studied (Liu et al., 2007; Sehgal, 2010; Zuckerberg et al., 2011; Møller, 2013). Investigating the effects of current climatic variability, such as the El Niño-Southern Oscillation (ENSO), in urban ecosystems can help fill this important void.
Birds living in suburban temperate forests experience both seasonal and yearly climatic variability and changes in vegetation associated with urbanization. The severity of the extremes and local habitat conditions dictate which species will thrive and which will decline. Numerous recent studies have found primary productivity or available energy, as measured by satellite based remote sensing, to be a good predictor of species richness at various spatial scales (Laurent et al., 2005; Luck, 2006; Marshal et al., 2006; Goetz et al., 2007; Bino et al., 2008). However, there are relatively few published reports investigating the use of productivity as a predictor of avian species richness in urban landscapes (Gottschalk et al., 2005) and fewer yet that relate this to the effects of climate. In a large-scale study, Luck (2006) found that species richness tracks human population density, despite the effects of urbanization, because humans routinely select the most productive areas for settlement.
Given the inherent variability associated with suburban landscapes, methods that can quickly and accurately assess important variables are imperative. The patchiness of the suburban landscape makes ground based measurement of primary productivity difficult; fortunately, advances in remote sensing techniques allow for rapid and extensive assessment. Normalized Difference Vegetation Index (NDVI), which synthesizes both vegetation quantity and health, has been shown to be an accurate predictor of productivity (Tucker et al., 1985; Piñeiro et al., 2006; Goetz et al., 2007; Bino et al., 2008; Buyantuyev and Wu, 2009). MODIS (MODerate resolution Imaging Spectroradiometer) allows a researcher to derive frequent NDVI observations over a wide scale of time and space without a debilitating sacrifice in spatial resolution (Buyantuyev and Wu, 2009). The improved continuous temporal resolution may provide a more accurate predictor of avian species richness and abundance than simply maximum NDVI of one or two images, particularly in an area undergoing rapid land clearing and subsequent construction. Similarly to using a synthetic variable such as NDVI to represent vegetative cover and primary productivity, the Oceanic Niño Index (ONI), a measure of ENSO that utilizes ocean buoys to measure sea temperature, provides a synthetic climate variable that may represent future patterns if climate change models are accurate (Praskievicz and Chang, 2009; Chen et al., 2011; Todd et al., 2011). Although it is clear that no single weather variable, such as temperature or precipitation, is adequate to predict changes in productivity or bird populations, a composite climate variable that summarizes changes in temperature as well as precipitation, such as the strength of the ENSO, may have stronger predictive power.
The Seattle metropolitan area is an excellent location to study the convergence of a changing landscape and climate. The significant climatic effects of ENSO are relatively well understood and predictable (Kogan, 2000). Due to a change in normal storm track El Niño winters in the PNW are warmer than normal which may benefit resident bird survival; however, the decrease in soil moisture content for the subsequent summer (Baker et al., 2008) can reduce primary productivity (Li and Kafatos, 2000), which could negatively effect bird reproduction. La Niña winters in the PNW are cooler and wetter than normal, which may increase the energetic demands on birds breeding in a cool, rainy spring, and lower reproductive success (Bloxton, 2002; Nott et al., 2002), but will provide increased soil moisture during the plant growing season. In addition, the urbanizing fringes of Seattle are undergoing rapid and extreme changes in land cover, land use and wildlife habitat (Donnely and Marzluff, 2006), which often results in a sharp decline and subsequent, although moderate, rebound in plant primary productivity. Distinct changes in the patterns of avian species richness, which are, at least partially, explained by urbanization, have occurred near Seattle (Marzluff, 2005). However, the degree to which interactions between climate, urbanization and forest extent and productivity (as summarized by NDVI) are shaping this shift is not well understood.
The abnormal weather that results from ENSO in the Pacific Northwest, warm El Niño winters and drier summers, resembles the predicted effects of sustained climate change and provides an opportunity to examine the interaction of a rapidly changing landscape and climate. By comparing long-established residential developments (developed sites) and forested reserves (reserve sites) with sites that were cleared and developed between 2001 and 2010 (changing sites), we examine how weather variability associated with ENSO and changes in NDVI during and following development influence bird populations over time.
We expect NDVI to be strongly correlated with bird populations at changing sites (Marzluff et al., 2016), but less so at developed or reserve sites. The over-riding effects of forest loss at changing sites suggest that weather patterns will have less influence on birds and forest productivity at these sites. However, at reserves and developments we hypothesize that weather will explain more variation in bird populations than NDVI because productivity is less variable than weather in these sites.
Methods
Study Region and Site Selection
Within the urbanizing fringe of the Seattle Metropolitan area, we selected 21 one-kilometer study sites spanning a gradient of forest land cover, impervious surface and forest patch connectivity (Figure 1; details of site selection and composition are in Marzluff et al., 2016). These sites were all below 500 m elevation in dense urban to sparsely populated exurban and second-growth forest (Donnely and Marzluff, 2004, 2006; Blewett and Marzluff, 2005). They represent 3 treatments (5 reserve, 7 developed, and 9 changing sites) in a quasi-experimental, temporal study (Marzluff et al., 2016). Reserve sites are dominated by mid-successional vegetation with at least 70-year-old Douglas-fir trees interspersed with deciduous trees and an understory of ferns and fruiting shrubs closely surrounded by suburban matrix. Developed sites are long established housing subdivisions that have been human dominated for at least 20 years. Changing sites were forested either when the study began or cleared in the few years prior but have since become suburban developments. Although minor development may have continued through 2010 at some changing sites, forest clearing, road building and intense home building typically occurred over 3 years at any one site, with construction starting at the first site in ~2000.
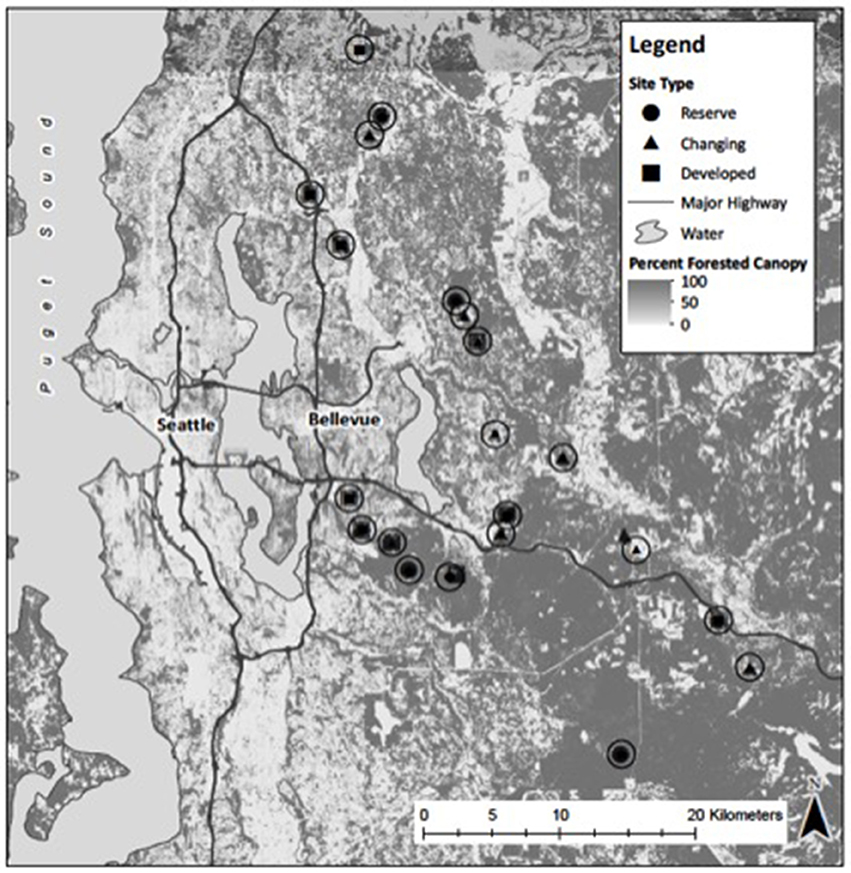
Figure 1. Study sites are spread throughout the Seattle Metropolitan area and across a range of canopy coverage. Canopy cover was obtained from the National Land Cover Database 2001 (Homer et al., 2007).
Bird Surveys
We surveyed bird abundance during the breeding seasons (April to August) of 2001 to 2010 by conducting four 50 m fixed radius point count surveys at four to eight points in each study site each year (Ralph et al., 1993). We conducted the surveys between the hours of 05:00 and 12:00 on days when conditions allowed adequate visibility and audibility of birds (time of surveys were not biased by site type and did not affect detection; Marzluff et al., 2016). Rarely (9% of site years), we only completed three surveys per year due to weather or denial of land access. Additionally, three sites had fewer than eight points; however, as each site was either homogenously forested, small in size or both, fewer points were adequately representative. At all developed and changing sites, the majority, typically six of eight, of survey points were located in the far more heterogeneous urban matrix and the remaining were located in the remnant forest (Donnely and Marzluff, 2006).
Our study goals were to investigate the relative influence of ecological and climatological factors on species abundance and richness within a large avian community. We were not interested in estimating absolute richness or abundance, therefore we chose to design our study to minimize bias in detection, rather than adjust for incomplete detection after data collection. We minimized detection bias by: (1) limiting our survey area to small (50 m-radius), easily defined plots; (2) surveying across the entire breeding season to remove seasonal variation in bird activity; (3) using only 16, expert and seasonally trained observers; (4) curtailing surveys during periods of inclement weather; and (5) limiting surveys to the morning hours and randomizing start times across study sites (Marzluff et al., 2016). Due to inadequate sampling resulting from fixed-radius point counts we did not include nonbreeding birds, raptors, waterfowl, and other species with very specific habitat requirements or large home ranges in this analysis (Ralph et al., 1993).
Our design is appropriate, especially for community studies, where many birds are naturally rare (Banks-Leite et al., 2014). Moreover, while distance sampling is often employed to determine and correct for imperfect detection in bird studies, the basic assumptions of this approach: (1) that birds do not move between the start of the survey and the time at which they are observed, (2) that measurements from the observer to the bird are exact, and (3) that sampled areas are homogeneous are violated in most field settings, including ours (Johnson, 2008; Hutto, 2016; Marzluff et al., 2016). Although failure to correct abundance estimates for imperfect detection may create a bias toward underestimation of relative abundance, rarely does correction affect a study's findings (Banks-Leite et al., 2014). Indeed, correction did not affect conclusions concerning the abundance of birds across changing, developed, or reserve landscapes in our study (Marzluff et al., 2016). In the last year of our study we compared distance sampling and fixed-radius sampling. Our detection probability was high and variation in the density of vegetation among site types did not systematically affect abundance estimates (Marzluff et al., 2016). However, detection was 20% higher at points in open developed sites relative to heavily forested reserves. Despite this potential bias, estimated bird abundance was not uniformly greatest in sites with high detection. Rather, we found that species known to associate with open landscapes were most abundant in developments, while those known to associate with closed forest were most abundant in reserves, regardless of whether we corrected for imperfect detection or did not (Marzluff et al., 2016).
Estimation of occupancy, rather than relative abundance, is a metric applicable to field studies of avian communities such as ours (Hutto, 2016). Small, fixed-radius plots are appropriate for the estimation of occupancy. Several, repeated visits to plots are needed to estimate occupancy, and these repeats should be within a biologically homogeneous sampling period. While we visited each plot three to four times, these visits spanned a period of variable breeding activity (including early sampling of settlement and late sampling after the fledging of nestlings). An increase in sampling effort during early, mid, and late breeding season would be needed to accurately estimate occupancy. Increased sampling was inconsistent with our study goals of wide spatial replication (Banks-Leite et al., 2014); therefore we felt estimation of occupancy was inappropriate for our study.
Avian Richness and Relative Abundance
We classified birds into guilds based upon the following life history characteristics: tolerance of human development, migration, diet, and use of human food subsidies (Table 1; assignments for all 58 species in Table S1).
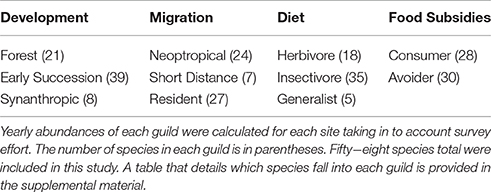
Table 1. Bird species were separated in to guilds based on the following life history traits.
To account for differential survey effort between sites and to normalize our data we calculated annual mean relative abundance as the average number of detections per 10 min, fixed-radius survey per year for each of the adequately sampled bird species and guilds known to breed in the study region (Tables S2, S3, S4). Annual species richness was calculated at the total number of species observed at each site during the four annual surveys (Table S5).
Vegetation Greenness Index
We used images from NASA's MODIS satellite to obtain NDVI, an index of forest greenness in our region, for each research site over the course of the 10-year study. We downloaded the Version 5 MOD13Q1 250 m resolution 16-day composites of a gridded level-3 product from the NASA Warehouse Inventory Search Tool (WIST) for January 2001 to December 2010. This results in a maximum of 23 measurements of NDVI for each year, or 230 for each site over the course of this study. In this product NDVI is calculated using ratios of reflectance in the red (645 nm) and near-infrared (858 nm) bands from the best daily images of each 16-day period. Both bands are atmospherically corrected using bi-directional surface reflectances with appropriate feature masking. MODIS13Q1 is a Validated Stage 2 product with extensive accuracy assessments over numerous locations and time points. The MODIS13Q1 product is distributed in Hierachical Data Format–Earth Observation System (HDF-EOS) and visualized in an integerized sinusoidal projection (ISIN) mapping grid (Land Processes Distributed Active Archive Center, 2013).
We obtained research grade GPS (Trimble GeoXT) coordinates for each point count location and projected them in UTM NAD83 using ARCGIS 9.3.3 (ESRI, 2008). The many steps we used to extract usable NDVI data from the MODIS13Q1 product are summarized in Figure S1. Briefly, we calculated the geometric mean of the survey point locations within a study site and buffered these with a 1 km2 circle. Due to the inherent challenges of collecting NDVI data from a satellite, Pixel Reliability classes are provided as a subdataset of the original MODIS13Q1 files. We used the Set Null tool from the Conditional toolset in the ARCGIS Spatial Analyst toolbox to remove any unreliable data by converting pixels with any Pixel Reliability class other than zero (most reliable) to No Data in the NDVI layer. This essentially removed any unreliable data from subsequent calculations. Finally, we calculated the mean NDVI for each composite image at each site using ARCGIS Zonal Statistics with the 1 km2 buffer around each site center as the zone. At each time point there was a maximum of 21 NDVI pixels included in the each zone; after removing unreliable pixels the actual average was 18.4 with a standard deviation of 2.82. We dropped sites that had <10 reliable pixels from the final calculation of annual mean NDVI. Due to unreliable NDVI data each site had an average of 16.5 (S.D. = 1.23) out of a total possible 23 time points, with most of the missing composites coming in the winter months. We calculated the yearly mean NDVI for each site using the values from each composite image. As a result we had annual mean NDVI for each 1 km2 site drawn from multiple time-points throughout each year (Figure S1).
We utilized annual mean NDVI because we were interested in the effects of forest greenness throughout the year. Additionally, we used annual mean NDVI rather than mean summer or annual peak NDVI, because it was calculated from approximately 16 time points, rather than approximately six or one, respectively. Mean annual NDVI was strongly correlated with annual peak NDVI at Changing (r = 0.93, p < 0.01, N = 90), Developed (r = 0.93, p < 0.01, N = 70) and Reserve sites (r = 0.88, p < 0.01, N = 50) throughout the study period, indicating that either measure would correlate similarly with our bird population metrics.
Annual Variation in Weather
We estimated the annual strengths of the El Niño Southern Oscillation using the National Oceanic and Atmospheric Association's Oceanic Niño Index (ONI). This index is calculated as the difference between a 3-month running mean of sea surface temperatures from the historical mean from 1971 to 2000. Numbers >0.5 indicate a strong El Niño and numbers < −0.5 indicate a strong La Nina. Because the effects of the ENSO are felt more strongly during the winter in the study areas, the yearly metrics are the means from the winter preceding the breeding season. For example the metric for 2010 is the mean of September 2009-February 2010.
Rainfall and temperature data was obtained from the NOAA weather station at the Seattle Tacoma International Airport (Table 2). The station is 113 m above sea level with Latitude 47°27′N, Longitude 122°19′W. Since specific weather data is not available for each of our study sites we selected one representative station that provided the most complete and accurate data over our study period.
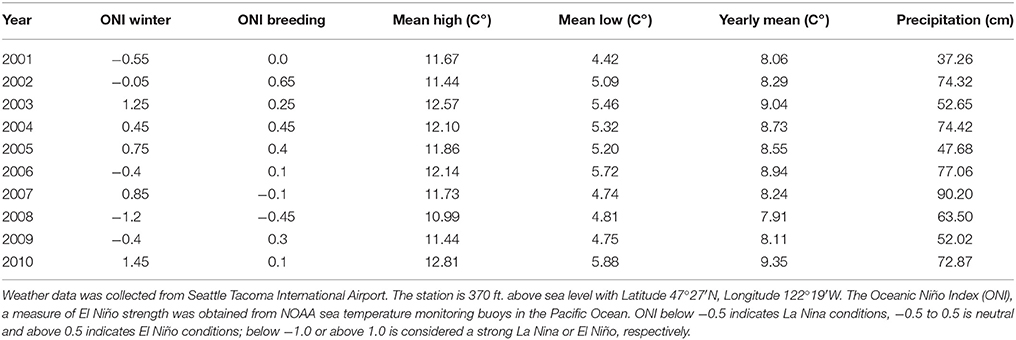
Table 2. Weather and climate data utilized in this study.
Statistical Analyses
We viewed the experimental unit as the site-year when we describe patterns of variability in abiotic factors and as the correlation between birds and abiotic factors within a site when we assess the relative importance of abiotic factors to birds within each of our three landscapes. Although some sites were monitored for fewer than 10 years, each was monitored over a set of years that represented variation in weather and productivity (Table 3). Changing sites, with more variable bird populations were monitored more intensively than reserve and developed sites, where bird populations were relatively stable. We did not sample developed sites from 2004 to 2007 because sufficient field teams were not available.
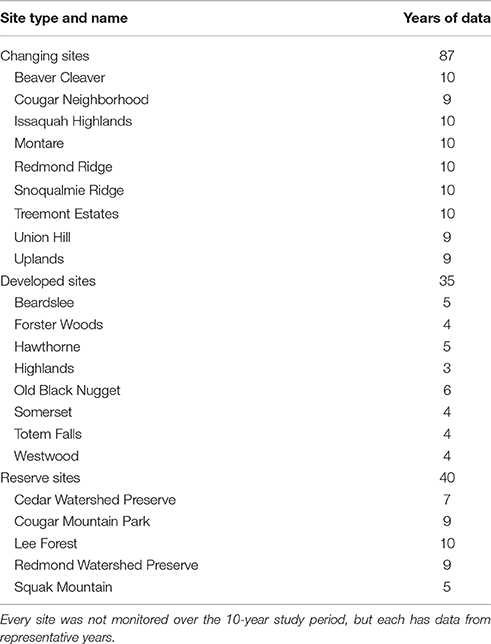
Table 3. Total number of years of data for each site type and site.
We used two-way ANOVAs followed by Tukey HSD, post-hoc analysis, to describe how bird richness and the abundance of each guild varied with year, site type, and the interaction of year and site.
We quantified the relationship between richness or guild abundance and NDVI or ENSO with univariate and partial correlations that included every adequately sampled year at a given site (Table 3). Correlation coefficients (e.g., between richness and NDVI) for each site became the raw data for subsequent description of effect size (average coefficient) and hypothesis testing (whether 95% CI of coefficient includes 0). Coefficients were Fisher-transformed, a variance-stabilizing transformation that makes correlation coefficients suitable for hypothesis testing, before being averaged for comparison among site types and guilds.
All statistical tests were done using SPSS (v.19; IBM, 2010).
Results
Variation in NDVI and Weather among Years and Sites
NDVI varied between reserve, developed and changing sites (F = 115.51, p < 0.01, df = 2, 207), but not across years at each site type (Figure 2). Reserve sites had the highest and most consistent annual, mean NDVI (0.83, S.E. = 0.004; n = 50). This exceeded NDVI at developed sites (mean = 0.68; S.E. = 0.006; p < 0.01; n = 70) and changing sites (mean = 0.72; S.E. = 0.007; p < 0.01; n = 90). Variance in mean annual NDVI was significantly less at reserve sites relative to developed sites (F = 4.98, p < 0.01, df = 4, 6) and changing sites (F = 4.02, p < 0.01, df = 4, 8). Changing and developed sites had similar variance (F = 1.25, p = 0.15, df = 8, 6).
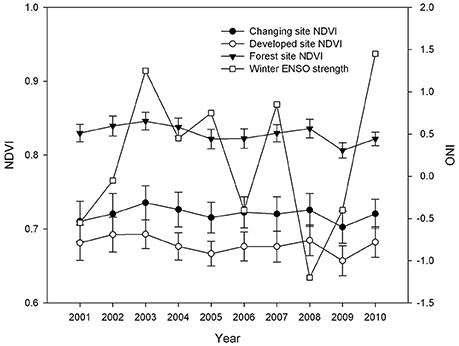
Figure 2. Annual changes in mean NDVI and ONI. NDVI was assessed 23 times yearly at each site from MODIS satellite images, and error free data was averaged to produce yearly data for each site. Error bars represent 95% confidence intervals around the mean. ONI is a measure of ENSO strength; data given here represents ENSO strength of the winter preceding the breeding season.
The large-scale weather pattern of ENSO (ONI) was a uniform variable across all study sites, but was variable from year to year (Figure 2; F = 20.4, p < 0.01, df = 9, 10). The winter of 2001 was a moderate La Niña year with the ONI equal to −0.55; the yearly mean low temperature was 6.72°C and there was 95.4 cm of precipitation. The winter of 2008 was a stronger La Niña with ONI < −1.0; the yearly mean low temperature was 6.89°C and there was 78 cm of precipitation (Table 2). Meanwhile, 2003 and 2010 experienced strong El Niño conditions, with ONI >1; the yearly mean low temperature was 7.61 and 7.67°C with 106.1 cm and 119.35 cm of precipitation, respectively (Table 2). Over the 10 years of this study winter ONI was strongly positively correlated with mean winter temperature in the Seattle area (r = 0.73, p = 0.016, N = 10), confirming that winter temperatures were warmer in El Niño years.
Annual Variation in Bird Species Richness
Bird species richness differed among site types over time (F = 6.34, p < 0.01, df = 2, 18; Figure 3, Table S5). Using yearly means for each site, the mean richness was 32.7 bird species (S.E. = 1.26, n = 9) at changing sites, 29.3 (S.E. = 0.89, n = 7) at developed sites and 26.0 (S.E. = 1.76, n = 5) at reserve sites. Reserve sites had significantly lower mean richness than changing sites (mean difference = 6.67, q = 5.02, p = 0.007, n = 6.6), but changing and developed sites were not statistically different (mean difference = 3.38, q = 2.55, p = 0.15, n = 6.6).
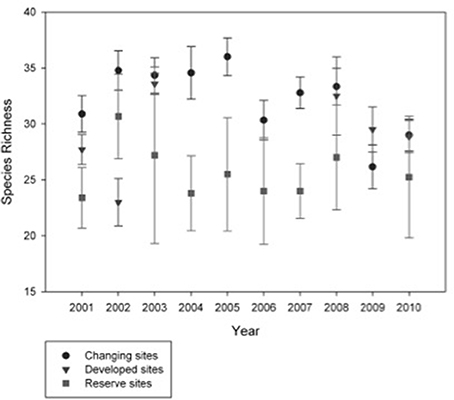
Figure 3. Species richness is greater at Changing sites than it is at Reserve sites. Point counts were conducted during the breeding season and species richness was calculated at the presence of any species in at least one of the point counts. Annual richness for each site was averaged by site type and the error bars are the standard error of those means.
Bird species richness varied by year at changing (F = 2.74, p < 0.01, df = 9, 77) and developed sites (F = 5.01, p < 0.01, df = 5, 25), but was similar across the 10 years at reserve sites, which were not undergoing any landscape changes (F = 0.97, p = 0.481, df = 9, 30; Figure 3). Mean richness at changing sites ranged from 36.0 in 2005 to 26.2 in 2009, which was the only significant pair-wise difference (Tukey HSD: mean difference = 9.83, q = 5.62, p = 0.02); over ten years the mean was 32.4 and the coefficient of variation was 0.185. Mean richness at developed sites ranged from 23.0 in 2002 to 33.57 in 2003, (mean difference = 10.6, q = 6.00, p < 0.01); the overall mean was 29.23 and the coefficient of variation was 0.159. Mean richness at developed sites ranged from 23.4 in 2001 to 30.7 in 2002, which was not a statistically significant pair-wise difference; the 10-year mean was 25.65 and the coefficient of variation was 0.19.
Does the Relationship of Richness to NDVI and Weather Vary with Site Type as Hypothesized?
Annual variation in richness was correlated with NDVI and weather, but this relationship depended on site type (Table 5). At changing sites, richness increased with increasing NDVI (the average of each site's univariate correlation: r = 0.26 ± S.E. = 0.10; the average of each site's partial correlation, holding weather constant: r = 0.29 ± S.E. = 0.10), and, as hypothesized, was very weakly correlated with weather (partial correlation controlling for variable NDVI indicates slightly higher richness during El Niño conditions, r = 0.03 ± S.E. = 0.11). Bird species richness varied with weather at developed sites, being greatest during El Niño conditions (mean r = 0.44 ± S.E. = 0.15; the annual change in NDVI, which was minimal, had little effect as hypothesized; Figure 2). Species richness was not significantly correlated with NDVI or weather at reserve sites (Table 5). This lack of association was as hypothesized for NDVI, but not for weather.
Variation in Abundance among Years and Sites
There were expected and obvious differences in the total abundance of various guilds in each site type (Table 4). Forest species were approximately twice as abundant in reserve sites than developed and changing sites (mean difference = 2.84, 2.50; q = 5.98, 5.26; p = 0.002, 0.005). Synanthropic species were most abundant in developed and changing sites (significantly greater in developed than reserve sites: mean difference = 2.38, q = 13.7, p = 0.004). Herbivores were over 60% more abundant at changing sites than reserve sites (mean difference = 1.46, q = 4.17, p = 0.024). Generalist relative abundance was nearly twice as great at developed sites than reserve sites (mean difference = 1.32, q = 5.11, p = 0.009), and both site types were similar in abundance to changing sites. Subsidy consumer annual relative abundance was 4.31 at reserve sites, which was significantly less than at changing sites (mean difference = 2.07, q = 4.16, p = 0.025) and developed sites (mean difference, 2.54, q = 5.10, p = 0.009). The relative abundance of migrants, residents, insectivores and subsidy avoiders was similar across all site types (Tables S2, S3, S4).
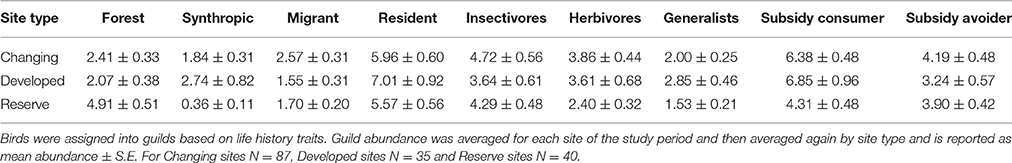
Table 4. Guild abundance varies by site type.
Relative abundance was most variable across years in changing sites and least variable in reserve sites (Figures 4, 5). At changing sites all nine guilds, except synanthropes (F = 1.54, p = 0.15, df = 9, 77), exhibited variable abundance from year to year; for example, forest species (F = 2.62, p = 0.01, df = 9, 77), residents (F = 4.51, p < 0.01, df = 9, 77) and generalists (F = 2.39, p = 0.02, df = 9, 77) were variable over time. There was slightly less annual variability (six of nine guilds) at developing sites than changing sites: residents (F = 3.17, p = 0.02, df = 5, 25), synanthropes (F = 2.92, p = 0.03, df = 5, 25), herbivores (F = 5.76, p < 0.01, df = 5, 25), insectivores (F = 5.64, p < 0.01, df = 5, 25), subsidy consumers (F = 3.53, p = 0.02, df = 5, 25) and subsidy avoiders (F = 2.93, p = 0.03, df = 5, 25) did not have consistent relative abundance from year to year. Unlike changing and developed sites, guild abundance was not significantly different from year to year at reserve sites (Figures 4, 5).
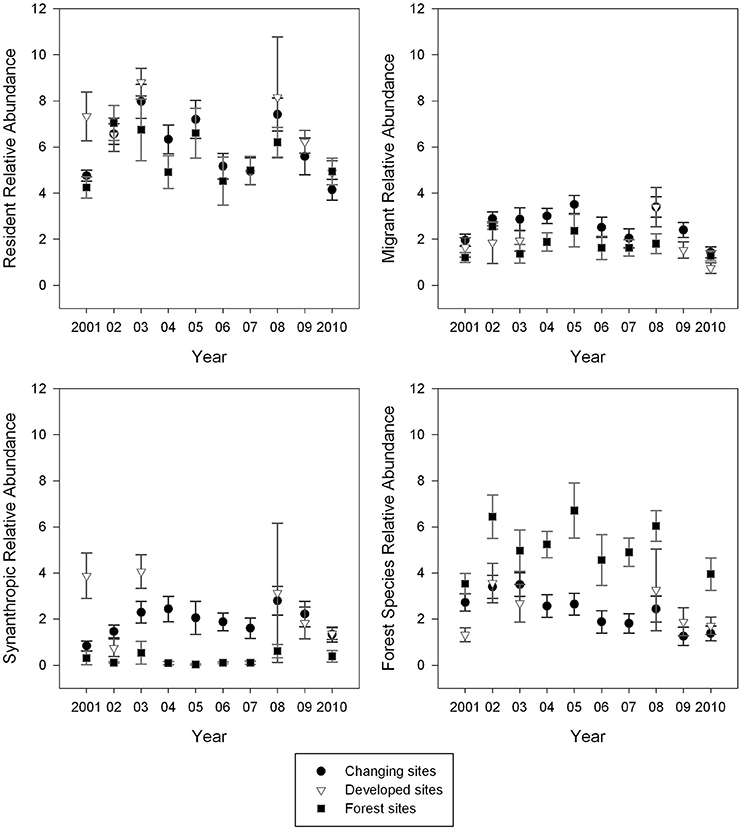
Figure 4. Mean guild abundance was most variable at Changing sites and least variable at Reserve (forest) sites. Point counts were conducted during the breeding season and relative abundance was calculated for each site. Sites were averaged by site type for each year. Those means are presented here with standard error as error bars.
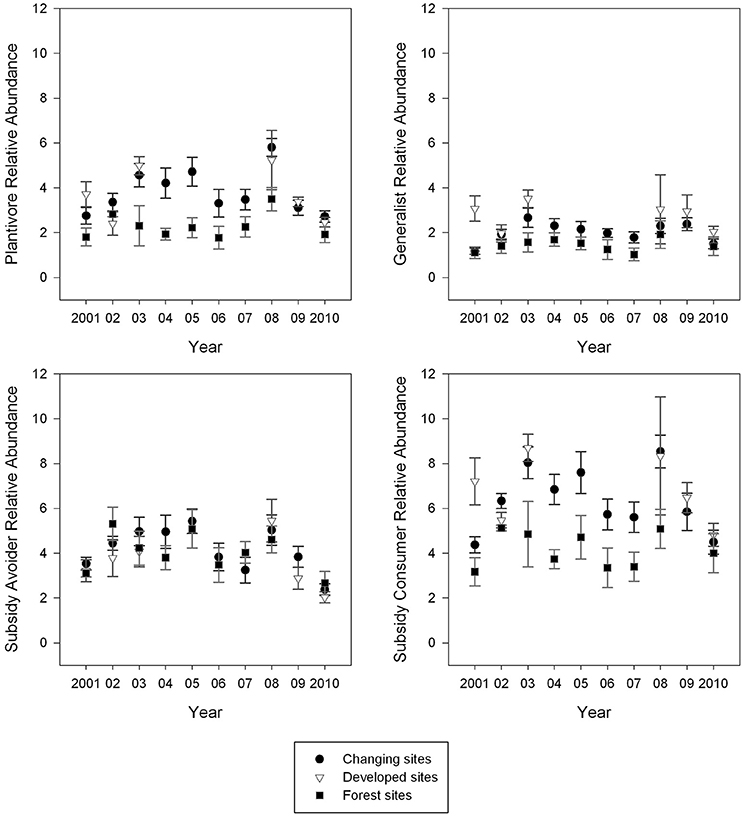
Figure 5. Mean guild abundance was most variable at changing sites and least variable at Reserve (forest) sites. Point counts were conducted during the breeding season and relative abundance was calculated for each site. Sites were averaged by site type for each year. Those means are presented here with error bars representing standard error.
Does the Relationship of Abundance to NDVI and Weather Vary with Site Type as Hypothesized?
Annual change in NDVI was strongly correlated with the abundance of all guild types in changing sites, as hypothesized (Table 5). The weakest relationship was with generalists (r = 0.27 ± S.E. 0.102 and the partial correlation, holding weather constant, was r = 0.26 ± S.E. 0.12). In contrast, as expected in changing sites only 2 of 18 correlations between a guild's abundance and weather were statistically significant. The strongest correlations were negative indicating that migrants, synanthropes, subsidy consumers and herbivores were more abundant following La Niña winters and/or less abundant following El Niño winters.
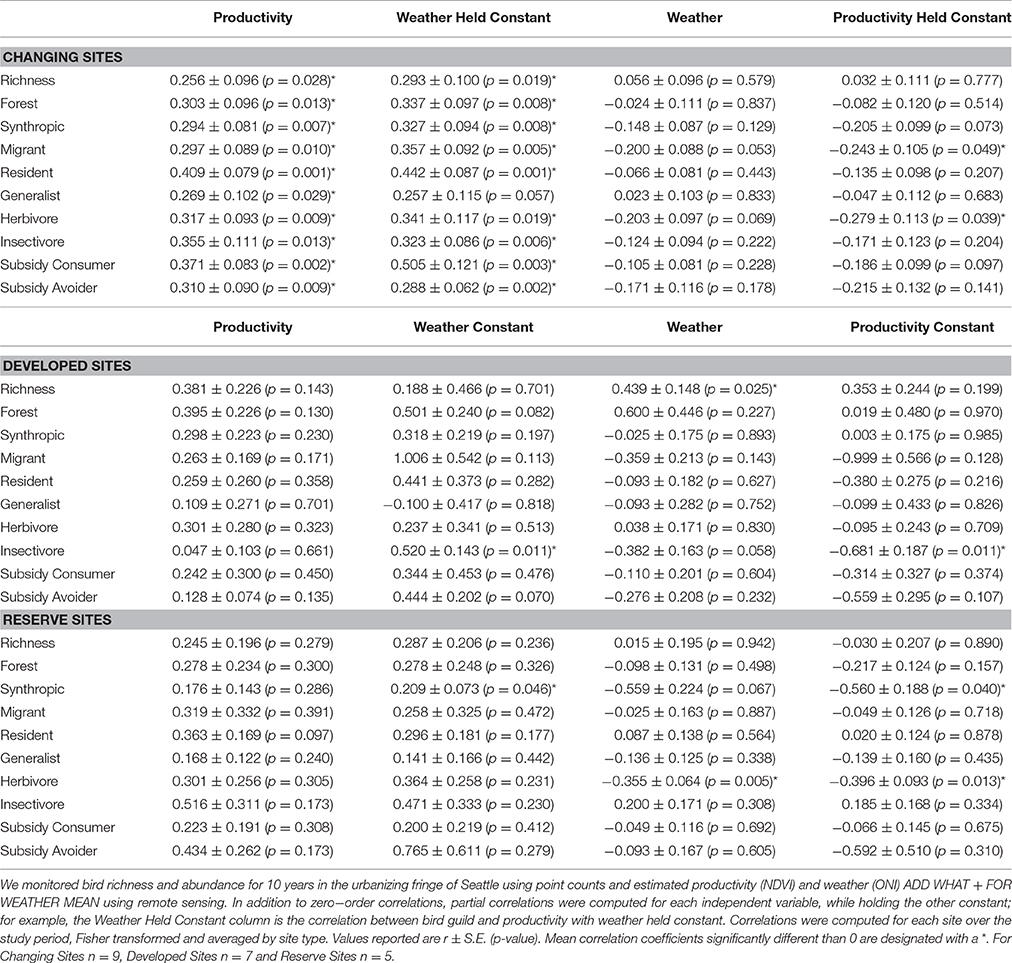
Table 5. Bird richness and abundance was primarily correlated with primary productivity at Changing Sites, weather at Reserve Sites, and weakly by both factors at Developed Sites.
Variation in abundance within reserve sites was rarely related to NDVI and slightly more correlated with weather as predicted; only 1 of 18 correlations between various guild abundances were significant for NDVI, while 3 of 18 were significant for weather (Table 5). Synanthropic species abundance was correlated with weather (partial correlation holding NDVI constant: mean r = 0.56 ± 0.19). There was also a strong negative correlation between herbivore species abundance and weather (univariate mean r = −0.36 ± 0.06; this improved nearly 15% when NDVI was held constant).
The correlation between bird abundance and weather or NDVI was weakest in developments (1 of 18 guilds correlated with NDVI in partial correlations and 1 of 18 guilds significantly correlated with weather; Table 5). Insectivore abundance was positively correlated with NDVI when weather was held constant (r = 0.52 ± 0.14). Insectivores were also strongly correlated with weather (r = −0.68 ± 0.19), albeit negatively; indicating that insectivores were more abundant following La Niña and/or less abundant following El Niño winters.
Discussion
The process of converting native forests to suburban housing developments significantly changes the interplay of forest productivity and weather on bird relative abundance and species richness. In changing sites, where forests are being converted to residential settlements, the relative abundance of various bird guilds and overall species diversity was influenced strongly by changes in NDVI, a proxy for the amount and productivity of forest, and, to a lesser extent, by variation in the winter weather. At changing sites this strong response to loss of native forest cover appears to overshadow typical breeding bird community responses to climate of the preceding winter resulting from El Niño or La Niña. However, even in these dynamic lands, migrants and herbivores were less abundant following warm El Niño winters, suggesting that detrimental reduction in fruit due to a lack of summer soil moisture was compounded by forest loss.
In the typical warm and dry summers of the PNW, water is often a limiting resource to plant growth, leaving plants to compete for moisture stored in the soil from the previous winter. If soil moisture is not replenished during the winter, plants can suffer drought effects, resulting in slower growth (Peterson et al., 2002) and reduced fruit and seed production during the subsequent breeding season (Herrera, 1991; Selås, 2000); changes in precipitation associated with ENSO have been shown to affect soil moisture content (Nott et al., 2002). It appears that the warmer, dryer winters associated with El Niño in the PNW (Thomson et al., 2003) exacerbate soil-moisture deficiencies for the upcoming breeding season and negatively affect summer herbivore abundance. Changes in rainfall associated with ENSO also correlate with avian reproductive success in the PNW (Nott et al., 2002). Thus, reduced herbivore abundance could result from reduced adult populations as well as reduced reproductive success of those adults. In contrast, the cooler and wetter winters associated with La Niña (Thomson et al., 2003) will ensure the soil is adequately moist to allow for greater fruit and seed production, which would likely result in a greater number of nesting birds and nest productivity.
In contrast to actively developing landscapes, in nearby forested reserves or established subdivisions annual variation in NDVI was not strongly correlated with relative abundance or diversity of birds. As in changing landscapes, partial correlations indicated that herbivores were negatively associated with ONI in reserve sites: abundance during the breeding season declined following a strong El Niño winter and increased following a La Niña. Similarly, insectivores in developments did poorly in years with dryer winters and better in years with wetter winters probably because vigorous plant growth throughout the summer supported a greater number of insects (Nott et al., 2002). In reserves, synanthropic species also declined following warm, dry El Niño winters perhaps because forests sites lack human supplements that could buffer the effects of a dry summer. Given our sampling methods, this correlation may be a result of local emigration or actual reduction in productivity.
Given that significant correlations between bird abundance and weather are relatively few compared to correlations between birds and NDVI, climate appears to play a secondary role to vegetative cover in shaping avian relative abundance. This emphasizes the importance of maintaining productive forest cover for birds, especially insectivores and herbivores given that they are also affected by climate. Moreover, in the face of expected changes in the PNW climate, the general finding that guilds fared best following cooler and wetter La Niña conditions (which are expected to be less common in the future) suggests that the composition of northwestern forest bird communities is likely to change. We would expect declines in the abundance of migrants and herbivores and increases in the abundance of permanent residents sensitive to winter cold, such as Bewick's and Pacific wrens. However, if future climate includes prolonged summer droughts that limit primary productivity of the forests that remain, then insectivores, even permanent residents, would likely suffer.
In the developed landscapes of the Pacific Northwest, reserves and developments may work together to buffer birds from some effects of our changing climate. Site preparation that minimizes forest loss during construction and practices that accelerate growth of fruit and seed-bearing shrubs and trees where forests are cleared would increase the resilience of bird populations in developments (Goddard et al., 2010). Supplemental water and food provided by residents would further bolster bird populations during extreme climatic events (Grubb and Cimprich, 1990). While subdivisions now support a great number of species (Marzluff, 2005) and this diversity may increase in a warmer environment (Table 5), native forest reserves are required by many species (e.g., Pacific wren; Marzluff et al., 2016). Reserves may also be necessary for a wider diversity of species in the dynamic urban landscape. By providing refuge, reserves enable mobile species to recolonize marginal areas following particularly stressed years (Neuschulz et al., 2013) or during development of neighboring habitat.
Principally homogenous, forested reserves support the fewest number of species over time, but annual mean richness, and abundance of all guilds does not fluctuate from year to year. The lack of correlation with weather was not expected. However, relative stability in reserve bird communities may be a result of the absence of large disturbances and mild weather conditions of the PNW that allow for consistent yearly habitat conditions. Although it may be possible that annual mean NDVI is simply not the correct remote sensing modality for predicting bird abundance in dense forest (Ranganathan et al., 2007), density-dependent factors are likely playing a more important role in shaping bird relative abundance at reserve sites than at changing sites.
The response of most guilds to differences in the landscapes we studied was as expected (more forest specialists in reserves, more synanthropic species association with developments, etc. Marzluff et al., 2016). Interestingly, herbivores were more abundant in changing sites than reserve sites, while being of intermediate abundance in developments. This is likely because reserve sites are dominated by dense overstory trees, with fewer fruiting shrubs in the understory. Developed sites, in contrast, may have fruit and seed producing shrubs included in the landscaping or present as weeds after land clearing. The landscaping at developed sites also includes numerous non-native species, which would increase the plant diversity and lengthen the time during which fruit is available to birds. Additionally, developed sites have more edge that could provide an area for fruiting understory shrubs to thrive. Meanwhile, changing sites may have a greater number of early successional weeds and shrubs that produce fruit or seeds during land clearing and subsequent landscaping with such plants. Particularly in the PNW, Himalayan blackberries (Rubus armeniacus) can become dominant in disturbed landscapes, so if the changing areas remain disturbed for an extended period, herbivores may become more abundant. Catterall et al. (1998) saw a similar pattern in some frugivore species and hypothesized that the landscaping, with fruiting and flowing plants, in suburban areas benefits these species.
Limitations and Future Directions
Our use of NDVI as a measure of forest productivity may have reduced our ability to ascertain the true influence of productivity on bird communities. A more direct measure of net primary productivity or an index, such as NDVI, that is derived at a spatial resolution finer than was available to us (250 m) may reveal a tighter link between productivity and birds. Determination of NDVI at a finer resolution may be especially important in urban areas where any annual variation in reflectance from vegetation in large pixels may be masked by annually consistent reflectance from impervious structures within the pixel. However, the seemingly contrary finding that weather and forest productivity, as gaged by NDVI, were not strongly correlated at our study sites, may reflect real patterns in a human-dominated land. For example, perhaps the intense land cover changes at changing sites resulting from anthropogenic forest clearing simply overshadow the changes in forest productivity associated with yearly weather fluctuations. In addition, developed sites, with their manicured landscaping likely receive enough supplemental water and human care to maintain a stable primary productivity through dryer summers of El Niño.
Reserve sites have the greatest and most consistent productivity of the three site types: yet even here the NDVI of established, dense conifer-dominated forests was insensitive to fluctuating weather conditions. This may represent a real limitation of our measure of NDVI. Although water may be limiting during the summer of El Niño years at reserve sites the overstory trees may be able to outcompete the understory for water well enough to maintain a photosynthetically-active canopy which is primarily measured with NDVI. Additionally, by using the yearly mean NDVI rather than a yearly peak NDVI some of the summer drought signals may have been masked. We used yearly mean NDVI because the study area is relatively temperate with a long growing season and there are many resident birds included in this study that may be sensitive to changes in productivity outside the summer months. Additionally, it is known that NDVI can become saturated as the ratio of reflectance approaches 1:1 (Wang et al., 2003), so minor changes that might have been correlated with changes in weather at reserve sites would not be evident due to errors associated with the NDVI measurement. Although beyond the scope of this study, it may be possible to eliminate some of the errors of saturation by utilizing either ground-based or airborne Light Detection and Ranging (LIDAR) to very accurately measure percent canopy cover and understory density, utilizing these variable to improve regressions. Despite these limitations, it has been shown that weather is strongly correlated with primary productivity on a large scale (Box et al., 1989), so partial correlations are appropriate for this study.
Future studies of the relationships between bird population demographics and large-scale variables such as primary productivity or climate should focus on addressing issues of spatial and temporal scales encountered in this study. At a finer scale, site-specific measurements of climatic variables may improve the correlations between productivity and weather and decrease the variability of the correlations between weather and bird abundance. This could be accomplished by installing relatively simple data loggers to record rainfall, temperature and soil moisture at each site. Understanding subtle changes in land cover and productivity at a finer resolution could be improved by utilizing finer spatial resolution imagery or LIDAR to quantify the area and distribution of gardens and small green spaces over time. Work to assess land cover change at very fine spatial resolution is already ongoing at these study sites and will likely yield an increased understanding of the nuanced factors that determine how birds respond to urbanization. Additionally, to assess not only the primary productivity, but also the “bird-friendliness” of these green spaces, on the ground surveying of the gardens for food, cover and nesting locations could be carried out alongside the bird surveys. The garden surveys would be a good opportunity for a partnership with a backyard wildlife group such as the Audubon Society or Backyard Wildlife Sanctuary Program Washington Department of Fish and Wildlife (2013) the partner group could also assess some of the gardens and make recommended improvements for wildlife. A longer-term study could then investigate if the garden improvements change the relationships between productivity and bird populations at developed or changing sites. A finer scale examination of the changes in productivity associated with urbanization may reveal further insights into their impacts on bird abundance and richness.
To understand how larger scale factors influence the correlations between birds, productivity and weather it would be ideal to examine how the productivity of the land surrounding the study sites differs between sites and site types. Collecting NDVI data from the same MODIS products in 2 km2 concentric around the bird survey sites would provide some insight about the surrounding land, which likely plays an important role in shaping these relationships. Considering weather patterns over a larger time scale could also improve understanding. We did not investigate lags in the effects of weather, though in some cases bird abundance (Pearce-Higgins et al., 2015; Gorzo et al., 2016) is related to the past as well as current year's weather. Future studies should account for possible influences of past weather conditions on birds and consider nonlinear as well as linear responses of birds to weather patterns (Pearce-Higgins et al., 2015).
The objectives of a study invariably drive the methods employed. In our case, our approach to surveying birds was influenced by our aim to understand how a community comprised of abundant as well as rare species responded to environmental conditions across three profoundly different landscapes. To do so, we opted to maximize spatial and annual replicates rather than temporal replicates within a season at a particular site. This decision compromises our ability to estimate occupancy, while increasing our ability to more accurately measure relative abundance. In addition, because distance estimation is difficult and likely biased by undetected movement of birds in forested lands and because developed lands are heterogeneous, we opted to control for imperfect detection in study design rather than with post-hoc statistical adjustments (Banks-Leite et al., 2014). We employed several strategies to increase and equalize the detection of birds across our survey plots (see Section Methods). However, even with these adjustments it is likely that we overestimated bird abundance in developed relative to reserve sites and through time at changing sites (Marzluff et al., 2016). Thus, if we found slightly lower abundance in reserves relative to developments or slight increases in abundance over time in changing landscapes, we would be cautious in interpreting this to be a result of ecological change. This was not the case in our study as changes between landscapes and through time were greater than expected based on detectability bias. This potential bias does not apply to our conclusions concerning the influence of weather or forest productivity on richness or abundance within reserves or developments.
Ethics Statement
All research was conducted in accordance with University of Washington Institutional Animal Care and Use Committee Protocol 3077-01, Washington Scientific Collection Permit 11-359, and US Scientific Collection Permit MB761139-1.
Author Contributions
BS conducted research, analyzed data, wrote paper. JM conducted research, analyzed data, designed study, wrote paper. LM analyzed data, wrote paper.
Funding
Funding was provided by the U.S. National Science Foundation (DEB-9875041, IGERT-0114351, BCS 0120024, and BCS 0508002), the German Research Foundation (RTG Graduiertenkolleg 780), and the University of Washington (Rachel Wood's Endowed Graduate Program).
Conflict of Interest Statement
The authors declare that the research was conducted in the absence of any commercial or financial relationships that could be construed as a potential conflict of interest.
Supplementary Material
The Supplementary Material for this article can be found online at: http://journal.frontiersin.org/article/10.3389/fevo.2017.00040/full#supplementary-material
Figure S1. Diagram of the tools utilized in ARCGIS 9.3.3 (ESRI, 2008) to extract the NDVI data at each of the 21 sites from the MODIS product. NDVI data is the first layer of the .HDF file so there is no need to extract it as a subdataset; however, the pixel reliability needed to be extracted because it is the fourth layer. We utilized the Set Null tool to remove any unreliable NDVI data, utilizing the new Pixel Reliability subdataset as the basis for removal; unreliable pixels were classified as “No Data” excluding them from Zonal Statistics calculations. With the reliable NDVI layer prepared, we created a 1 km circle around the center of each site using Mean Center and Buffer tools. The final output, produced with the Zonal Statistics as Table tool, is a table for each date that NDVI was collected by the MODIS satellite in the study area.
References
Alberti, M. (2005). The effects of urban patterns on ecosystem function. Int. Reg. Sci. Rev. 28, 168–192. doi: 10.1177/0160017605275160
Baker, I. T., Prihodko, L., Denning, A. S., Goulden, M., Milller, S., and da Rocha, H. (2008). Seasonal drought stress in the Amazon: reconciling models and observations. J. Geophys. Res. 113, G00B01. doi: 10.1029/2007JG000644
Banks-Leite, C., Pardini, R., Boscolo, D., Cassano, C. R., Puttker, T., Barros, C. S., et al. (2014). Assessing the utility of statistical adjustments for imperfect detection in tropical conservation science. J. Appl. Ecol. 51, 849–859. doi: 10.1111/1365-2664.12272
Bino, G., Levin, N., Darawshi, S., Van Der Hal, N., Reich-Solomon, A., and Kark, S. (2008). Accurate prediction of bird species richness patterns in an urban environment using Landsat-derived NDVI and spectral unmixing. Int. J. Remote Sens. 29, 3675–3700. doi: 10.1080/01431160701772534
Blake, R., Grimm, A., Ichinose, T., Horton, R., Gaffin, S., Jiong, S., et al. (2011). “Urban climate: processes, trends, and projections,” in Climate Change and Cities: First Assessment Report of the Urban Climate Change Research Network, eds C. Rosenzweig, Solecki, W. D. S. A. Hammer, and S. Mehrotra (Cambridge: Cambridge University Press), 43–81. doi: 10.1017/cbo9780511783142.009
Blewett, C. M., and Marzluff, J. M. (2005). Effects of urban sprawl on snags and the abundance and productivity of cavity-nesting birds. Condor 107, 678–693. doi: 10.1650/0010-5422(2005)107[0678:EOUSOS]2.0.CO;2
Bloxton, T. D. Jr. (2002). Prey Abundance, Space Use, Demography, and Foraging Habitat of Northern Goshawks in Western Washington. M.Sc. Thesis, University of Washington, Seattle, W.A.
Box, E. O., Holben, B. N., and Kalb, V. (1989). Accuracy of the AVHRR vegetation index as a predictor of biomass, primary productivity and Net CO2, Flux. Vegetatio 80, 71–89. doi: 10.1007/BF00048034
Buyantuyev, A., and Wu, J. (2009). Urbanization alters spatiotemporal patterns of ecosystem primary production: a case study of the Phoenix metropolitan region, USA. J. Arid Environ. 73, 512–520. doi: 10.1016/j.jaridenv.2008.12.015
Catterall, C. P., Kingston, M. B., Park, K., and Sewell, S. (1998). Deforestation, urbanization and seasonality: interacting effects on a regional bird assemblage. Biol. Conserv. 84, 65–81. doi: 10.1016/S0006-3207(97)00076-1
Chace, J. F., and Walsh, J. J. (2006). Urban effects on native avifauna: a review. Landsc. Urban Plan. 74, 46–69. doi: 10.1016/j.landurbplan.2004.08.007
Chen, Y., Randerson, J. T., Morton, D. C., DeFries, R., Collatz, G. J., Kasibhatla, P. S., et al. (2011). Forecasting fire season severity in South America using sea surface temperature anomalies. Science 334, 787–791. doi: 10.1126/science.1209472
Coleman, J. C., Miller, M. C., and Mink, F. L. (2011). Hydrologic disturbance reduces biological integrity in urban streams. Environ. Monit. Assess. 172, 663–687. doi: 10.1007/s10661-010-1363-1
Donnely, R., and Marzluff, J. M. (2004). Importance of reserve size and landscape context to urban bird conservation. Conserv. Biol. 18, 733–745. doi: 10.1111/j.1523-1739.2004.00032.x
Donnely, R., and Marzluff, J. M. (2006). Relative importance of habitat quantity, structure, and spatial pattern to birds in urbanizing environments. Urban Ecosyst. 9, 99–117. doi: 10.1007/s11252-006-7904-2
Goddard, M. A., Dougill, A. J., and Benton, T. G. (2010). Scaling up from gardens: biodiversity conservation in urban environments. Trends Ecol. Evol. (Amst). 25, 90–98. doi: 10.1016/j.tree.2009.07.016
Goetz, S., Steinberg, D., and Ehlers, M. (2007). Laser remote sensing of canopy habitat heterogeneity as a predictor of bird species richness in an eastern temperate forest, USA. Remote Sens. Environ. 108, 254–263. doi: 10.1016/j.rse.2006.11.016
Goldman, M. B., Groffman, P. M., Pouyat, R. V., McDonnell, M. J., and Pickett, S. T. A. (1995). CH4 uptake and N availability in forest soils along an urban to rural gradient. Soil Biol. Biochem. 27, 281–286. doi: 10.1016/0038-0717(94)00185-4
Gorzo, J. M., Pidgeon, A. M., Thogmartin, W. E., Allstadt, A. J., Radeloff, V. C., Heglund, P. J., et al. (2016). Using the North American breeding bird survey to assess broad-scale response of the continent's most imperiled avian community, grassland birds, to weather variability. Condor 118, 502–512. doi: 10.1650/CONDOR-15-180.1
Gottschalk, T., Huettmann, F., and Ehlers, M. (2005). Thirty years of analysing and modelling avian habitat relationships using satellite imagery data: a review. Int. J. Remote Sens. 26, 2631–2656. doi: 10.1080/01431160512331338041
Grubb, T. C. Jr., and Cimprich, D. A. (1990). Supplementary food improves the nutritional condition of wintering woodland birds: evidence from ptilochronology. Ornis Scand. 21, 277–281. doi: 10.2307/3676392
Herrera, C. M. (1991). Dissecting factors responsible for individual variation in plant fecundity. Ecology 72, 1436–1448. doi: 10.2307/1941116
Hoffmann, P., and Schlünzen, K. (2013). Weather pattern classification to represent the urban heat island in present and future climate. J. Appl. Meteorol. Climatol. 52, 2699–2714. doi: 10.1175/JAMC-D-12-065.1
Homer, C., Dewitz, J., Fry, J., Coan, M., Hossain, N., Larson, C., et al. (2007). Completion of the 2001 National land cover database for the conterminous United States. Photogramm. Eng. Remote Sens. 73, 337–341.
Hutto, R. L. (2016). Should scientists be required to use a model-based solution to adjust for possible distance-based detectability bias? Ecol. Appl. 26, 1287–1294. doi: 10.1002/eap.1385
IPCC. (2007). Climate Change 2007: The Physical Science Basis. Contribution of Working Group I to the 4th Assessment Report of the Intergovernmental Panel on Climate Change. Cambridge; New York, NY: Cambridge University Press.
Johnson, D. H. (2008). In defense of indices: the case of bird surveys. J. Wildl. Manage. 72, 857–868. doi: 10.2193/2007-294
Kaye, J. P., Groffman, P. M., Grimm, N. B., Baker, L. A., and Pouyat, R. V. (2006). A distinct urban biogeochemistry? Trends Ecol. Evol. 21, 193–199. doi: 10.1016/j.tree.2005.12.006
Kogan, F. N. (2000). Satellite-observed sensitivity of world land ecosystems to El Niño/La Niña. Remote Sens. Environ. 74, 445–462. doi: 10.1016/S0034-4257(00)00137-1
Land Processes Distributed Active Archive Center (2013). Vegetation Indices 16-Day L3 Global 250m. MOD13Q1. Land Processes Distributed Active Archive Center.
Laurent, E. J., Shi, H., Gatziolis, D., LeBouton, J. P., Walters, M. B., and Liu, J. (2005). Using the spatial and spectral precision of satellite imagery to predict wildlife occurrence patterns. Remote Sens. Environ. 97, 249–262. doi: 10.1016/j.rse.2005.04.015
Li, Z., and Kafatos, M. (2000). Interannual variability of vegetation in the United States and its relation to El Niño/southern oscillation. Remote Sens. Environ. 71, 239–247. doi: 10.1016/S0034-4257(99)00034-6
Liu, J. G., Dietz, T., Carpenter, S. R., Alberti, M., Folke, C., Moran, E., et al. (2007). Complexity of coupled human and natural systems. Science 317, 1513–1516. doi: 10.1126/science.1144004
Luck, G. W. (2006). The relationships between net primary productivity, human population density and species conservation. J. Biogeogr. 34, 201–212. doi: 10.1111/j.1365-2699.2006.01575.x
Marshal, J. P., Bleich, V. C., Krausman, P. R., Reed, M. L., and Andrew, N. G. (2006). Factors affecting habitat use and distribution of desert mule deer in an arid environment. Wildl. Soc. Bull. 34, 609–619. doi: 10.2193/0091-7648(2006)34[609:FAHUAD]2.0.CO;2
Marzluff, J. M. (2005). Island biogeography for an urbanizing world: how extinction and colonization may determine biological diversity in human-dominated landscapes. Urban Ecosyst. 8, 157–177. doi: 10.1007/s11252-005-4378-6
Marzluff, J. M. (2016). A decadal review of urban ornithology and a prospectus for the future. Ibis. 159, 1–13. doi: 10.1111/ibi.12430
Marzluff, J. M., Clucas, B., Oleyar, M. D., and DeLap, J. (2016). The causal response of avian communities to suburban development: a quasi-experimental, longitudinal study. Urban Ecosyst. 19, 1597–1621. doi: 10.1007/s11252-015-0483-3
Marzluff, J. M., Shulenberger, E., Endlicher, W., Alberti, M., Bradley, G., Ryan, C., et al. (2008). Urban Ecology: An International Perspective on the Interaction between Humans and Nature. New York, NY: Springer. doi: 10.1007/978-0-387-73412-5
Miller, J. R., and Hobbs, R. J. (2002). Conservation where people live and work. Conserv. Biol. 16, 330–337. doi: 10.1046/j.1523-1739.2002.00420.x
Møller, A. P. (2013). Biological consequences of global change for birds. Integr. Zool. 8, 136–144. doi: 10.1111/1749-4877.12006
Neuschulz, E. L., Brown, M., and Farwig, N. (2013). Frequent bird movements across a highly fragmented landscape: the role of species traits and forest matrix. Anim. Conserv. 16, 170–179. doi: 10.1111/j.1469-1795.2012.00582.x
Nott, P. M., Desante, D. F., Siegel, R. B., and Pyle, P. (2002). Influences of the El Niño/Southern Oscillation and the North Atlantic Oscillation on avian productivity in forests of the Pacific Northwest of North America. Global Ecol. Biogeogr. 11, 333–342. doi: 10.1046/j.1466-822X.2002.00296.x
Pearce-Higgins, J. W., Eglington, S. M., Martay, B., and Chamberlain, D. E. (2015). Drivers of climate change impacts on bird communities. J. Animal Ecol. 84, 943–954. doi: 10.1111/1365-2656.12364
Peterson, D. W., Peterson, D. L., and Ettl, G. J. (2002). Growth responses of subalpine fir to climatic variability in the Pacific Northwest. Canad. J. Forest Res. 32, 1503–1517. doi: 10.1139/x02-072
Piñeiro, P., Oesterheld, M., and Paruelo, J. M. (2006). Seasonal variation in aboveground production and radiation-use efficiency of temperate rangelands estimated through remote sensing. Ecosystems 9, 357–373. doi: 10.1007/s10021-005-0013-x
Praskievicz, S., and Chang, H. (2009). Winter precipitation intensity and ENSO/PDO variability in the Willamette Valley of Oregon. Int. J. Climatol. 29, 2033–2039. doi: 10.1002/joc.1838
Ralph, C. J., Geupel, G. R., Pyle, P., Martin, T. E., and DeSante, D. F. (1993). Handbook of Field Methods for Monitoring Landbirds. Gen. Tech. Rep. PSW-GTR-144, Dept. of Agriculture, Forest Service, Pacific Southwest Research Station, Albany, CA. doi: 10.2737/psw-gtr-144
Ranganathan, J., Chan, K. M. A., and Daily, G. C. (2007). Satellite detection of bird communities in tropical countryside. Ecol. Appl. 17, 1499–1510. doi: 10.1890/06-0285.1
Sehgal, R. M. (2010). Deforestation and avian infectious diseases. J. Exp. Biol. 213, 955–960. doi: 10.1242/jeb.037663
Selås, V. (2000). Seed production of a masting dwarf shrub, Vaccinium myrtillus, in relation to previous reproduction and weather. Can. J. Bot. 78, 423–429. doi: 10.1139/b00-017
Thomson, A. M., Brown, R. A., Rosenberg, N. J., Izaurralde, R. C., Legler, D. M., and Srinivasan, R. (2003). Simulated impacts of El Niño/southern oscillation on United States water resources. J. Am. Water Res. Assoc. 39:1565. doi: 10.1111/j.1752-1688.2003.tb04441.x
Todd, R. E., Rudnick, D., Davis, R., and Ohman, M. (2011). Underwater gliders reveal rapid arrival of El Niño effects off California's coast. Geophys. Res. Lett. 38:L03609. doi: 10.1029/2010GL046376
Tucker, C. J., Vanpraet, C. L., Sharman, M. J., and Van Ittersum, G. (1985). Satellite remote sensing of total herbaceous biomass production in the Senegalese sahel:1980-1984. Remote Sens. Environ. 17, 233–249. doi: 10.1016/0034-4257(85)90097-5
Washington Department of Fish and Wildlife. (2013). Backyard Wildlife Sanctuary Program. Available online at: http://wdfw.wa.gov (24 July, 2013).
Walther, G.-R. (2010). Community and ecosystem responses to recent climate change. Philos. Trans. R. Soc. B 365, 2019–2024. doi: 10.1098/rstb.2010.0021
Wang, Z., Liu, C., and Huete, A. (2003). From AVHRR-NDVI to MODIS-EVI: advances in vegetation index research. Acta Ecol. Sin. 23, 979–987.
Keywords: primary productivity, richness, avian community, El Niño-Southern Oscillation, NDVI, climate change
Citation: Shryock B, Marzluff JM and Moskal LM (2017) Urbanization Alters the Influence of Weather and an Index of Forest Productivity on Avian Community Richness and Guild Abundance in the Seattle Metropolitan Area. Front. Ecol. Evol. 5:40. doi: 10.3389/fevo.2017.00040
Received: 28 January 2017; Accepted: 18 April 2017;
Published: 05 May 2017.
Edited by:
Amanda D. Rodewald, Cornell University, USAReviewed by:
Iryna Dronova, University of California, Berkeley, USAMatthias Leu, College of William & Mary, USA
Copyright © 2017 Shryock, Marzluff and Moskal. This is an open-access article distributed under the terms of the Creative Commons Attribution License (CC BY). The use, distribution or reproduction in other forums is permitted, provided the original author(s) or licensor are credited and that the original publication in this journal is cited, in accordance with accepted academic practice. No use, distribution or reproduction is permitted which does not comply with these terms.
*Correspondence: John M. Marzluff, Y29ydmlkQHV3LmVkdQ==