 Rakesh Awale
 Micco A. Emeson2
 Stephen Machado
- 1Columbia Basin Agricultural Research Center, Oregon State University, Adams, OR, United States
- 2Department of Biological and Ecological Engineering, Oregon State University, Corvallis, OR, United States
Soil organic matter (SOM) is essential for sustaining soil health and crop productivity. However, changes in SOM stocks in response to agronomic practices are slow and show years later when it is too late for adjustments in management. Identifying early indicators of SOM dynamics will allow early management decisions and quick remedial action. The objectives of this study were to evaluate long-term effects of tillage intensity and timing on SOM pools and determine the most responsive SOM pools to tillage practice. Soil from a long-term (53 years) winter wheat (Triticum aestivum L.)-spring pea (Pisum sativum L.) rotation and undisturbed grass pasture (GP) in inland Pacific Northwest (iPNW) was sampled to evaluate the effect of four tillage systems [no-till (NT), disk/chisel (DT/CT), spring plow (SP), and fall plow (FP)] on soil organic carbon (SOC, proxy for SOM), total nitrogen (TN), particulate organic matter carbon (POM-C) and nitrogen (POM-N), permanganate oxidizable carbon (POXC), water extractable organic carbon (WEOC), total dissolved nitrogen (TDN), KCl-extractable nitrogen (KEN), microbial biomass carbon (MBC) and nitrogen (MBN), basal respiration (BR), carbon mineralization (Cmin), and metabolic quotient (qCO2). GP had higher levels of SOC pools than cultivated treatments. On average, tillage significantly decreased SOC and TN by 28 and 26%, respectively, compared to GP. Among the cultivated soils, tillage had no significant effect on SOC and TN, except for DT/CT that had slightly higher SOC than FP (P = 0.08). On the contrary, NT and DT/CT significantly (P < 0.05) increased levels of POM-C, POM-N, POXC, WEOC, MBC, BR, Cmin, and qCO2 over FP or SP. However, tillage did not affect TDN, MBN, and KEN. The C-pools (POM-C, POXC, MBC, WEOC, BR, and Cmin) were more strongly correlated with SOM than the N-pools (TDN, MBN, and KEN), with an exception to POM-N. Under wheat-pea rotation in the iPNW, reduced tillage systems (NT and DT/CT) have a potential to maintain or increase SOM, which can be assessed early through its physical (POM), chemical (POXC, WEOC), and microbiological (MBC, BR, Cmin) indicators. POXC and WEOC were the most sensitive indicators of tillage-induced changes in SOM dynamics.
Introduction
Anthropogenic loading of atmospheric CO2, a greenhouse gas, could be partially offset or mitigated by sequestering carbon into soil organic matter (SOM) through increasing net primary productivity of cropping systems (Lal, 2004). Accumulation of SOM is also crucial for soil fertility, water retention, and maintaining crop productivity (Machado et al., 2008; Machado, 2011). Over the long-term, the magnitude of SOM storage depends on land-use and management practices (West and Post, 2002). Usually, SOM tends to decline when native ecosystems are converted to cropping systems (Machado et al., 2006), but the effect of different management practices on SOM dynamics in dryland cropping systems varies and is site-specific (Ghimire et al., 2017; Wang et al., 2017).
Winter wheat (Triticum aestivum L.)-summer fallow cropping systems (WW-SF) dominate the inland Pacific Northwest (iPNW), an ecoregion receiving relatively low precipitation (<400 mm) and most (70%) of which is received during winter months (Purakayastha et al., 2008; Machado, 2011). To this end, fallowing is widely practiced as a means to store soil water for the next crop. Tillage is used to control weeds and facilitate water storage by breaking surface- and sub-soil pore continuum during fallow (Fuentes et al., 2004). In addition, tillage also facilitates seeding operations by removing surface residues and reducing weed germination by burying weed seeds (Young et al., 2014). Although reliable in terms of grain yield, WW-SF exacerbated soil erosion (Feng et al., 2011; Machado et al., 2015) and has depleted more than 50% of the original SOM in Walla Walla silt loam soil (0–60 cm) near Pendleton, Oregon (Ghimire et al., 2015). In response to high soil erosion rates and depletion of SOM, adoption of reduced tillage systems, including delaying tillage until crop seeding, minimum tillage, and no-till (NT), has increased in recent years (Machado, 2011; Machado et al., 2015). Erosion rates have dramatically decreased under conservation tillage systems but SOM build up has been slow (Williams et al., 2009; Machado, 2011; Ghimire et al., 2017).
Storage of SOM in cropping systems depends on the balance between C-additions primarily from crop residues and C-losses through SOM decomposition (Machado et al., 2006; Awale et al., 2013). Therefore, the degree to which a tillage technique influences SOM turnover is generally determined by the frequency and timing of soil disturbance, depth of soil disturbance, and degree of soil-residue mixing (Cookson et al., 2008; Dou et al., 2008; Machado, 2011). Usually, inversion tillage buries almost all residues and enhances their decomposition by increasing soil-residue contact. Tillage also enhances microbial decay of SOM by regulating soil temperature, introducing oxygen, and disintegrating soil aggregates (Six et al., 2000). Furthermore, tillage induced alterations on soil edaphic properties can significantly influence crop productivity and ultimately the quantity of residue input in soils (Payne et al., 2000). On the contrary, delaying residue incorporation or leaving it on soil surface may provide a steady substrate for microbial community (Balota et al., 2003; Machado et al., 2006).
Nevertheless, changes in SOM stocks in response to tillage management may be difficult to detect due to soil's inherent variability (Cookson et al., 2008). More importantly, due to the slow recovery of SOM stocks, it may take several years to observe significant changes in SOM, often leading to late decision making and delayed remedial actions (West and Post, 2002). It took more than 30 years to measure a significant decrease in SOM in a WW-SF long-term experiment near Pendleton, Oregon (Ghimire et al., 2015). Besides, other studies have also indicated that the magnitude and direction of tillage-induced changes are often site-specific (Purakayastha et al., 2008; Morrow et al., 2016). Recently, microbiological properties and readily decomposable pools of SOM, such as particulate organic matter (POM), permanganate oxidizable C (POXC), water extractable organic matter (WEOM), microbial biomass C (MBC) and N (MBN), and microbial respiration, have received more attention due to their sensitivity to management practices than bulk SOM (Dou et al., 2008; Awale et al., 2013; Culman et al., 2013; Morrow et al., 2016; Wang et al., 2017). These physical, chemical, and microbiological pools constitute relatively small fractions of SOM but have rapid turnover rates of weeks to months or few years compared with more recalcitrant bulk SOM pools (Haynes, 2005). Identifying early indicators of SOM dynamics would allow early interventions before significant SOM loss (Purakayastha et al., 2008).
SOM pools can represent a multitude of interrelated soil processes and functions (Awale et al., 2013). For instance, POM plays major roles in soil aggregation and production of WEOM, and serves as an energy source for soil microbial biomass (Gregorich et al., 2000; Six et al., 2000; Zotarelli et al., 2007). The WEOM includes C-substrates as well as other associated nutrients (such as N, P, and S), and therefore its turnover is crucial in nutrient cycling (Gregorich et al., 2006). Soil microbes are responsible for transforming organic matter and nutrients within soil (Mooshammer et al., 2014). Basal respiration (BR) and C-mineralization are adequate indicators of microbial activity, which is dependent on substrate availability and the soil edaphic environment (Balota et al., 2003). A build-up of POXC in soil indicates long-term SOM stabilization (Culman et al., 2012, 2013; Hurisso et al., 2016). To this end, analyzing SOM pools and characterizing their interrelationships could improve our understanding of management effects on SOM dynamics in the iPNW. The objectives of this study were to (i) evaluate the effects of tillage intensity and timing on SOM pools and (ii) determine the most responsive SOM pools to tillage under winter wheat-spring pea (Pisum sativum L.) rotation in the iPNW.
Materials and Methods
Site Description and Experimental
This study was conducted on an ongoing wheat-pea long-term rotation experiment (WP-LTE) located at the Columbia Basin Agricultural Research Center (CBARC) near Pendleton, Oregon (45°42′N, 118°35′W). The WP-LTE was initiated in 1963 on a nearly-level (0–1% slope) Walla Walla silt loam soil (coarse-silty, mixed, mesic Typic Haploxeroll) (Soil Survey Staff, 2014). The site is characterized by a semiarid climate with cool wet winters and hot dry summers. Long-term (1930–2015) average annual temperature is 8°C, and annual precipitation is 418 mm, 70% of which falls between September and April (CBARC, 2016).
The WP-LTE consisted of a 2-year winter wheat-spring pea rotation, with each phase of the rotation present every year in order to facilitate yearly data collection for both crops. The experimental design was a split-plot arrangement with crop phases (wheat and pea) as whole-plot factors and tillage systems as sub-plot factors and replicated four times. Each sub-plot measured 7.3 m wide by 36.5 m long. Semi-dwarf soft white winter wheat was planted in early October using a double disk drill with 18-cm row spacing and harvested in late July of the following year. Spring pea was sown in late March or early April and harvested in June or July of the same year. After 28 years of growing green peas, dry peas were introduced in 1991. For the last 20 years, all wheat plots received 90 kg N ha−1 as urea ammonium nitrate (32-0-0) shanked 12 cm deep before planting, while ammonium sulfate (21-0-0-24) or ammonium phosphate sulfate (16-20-0-14) was broadcast applied at the rate of 22 kg N ha−1 in pea. Payne et al. (2000) and Machado et al. (2008) reported further details on crop management prior to 1995. The WP-LTE consisted of four tillage treatments as follows:
(i) Fall plow (FP): The plots were moldboard-plowed (20–25 cm deep) after wheat harvest in fall, followed by one to three times of spring cultivation (15 cm deep) before planting pea. Pea vines were moldboard plowed in summer after pea harvest and cultivated twice (10 cm deep) before planting wheat in the fall.
(ii) Spring plow (SP): This treatment was identical to FP treatment, except that the plots were moldboard-plowed in spring before planting pea.
(iii) Disk/chisel (DT/CT): The plots were disked twice to a depth of 10 cm after wheat harvest in the fall, followed by sweep-cultivation (5 cm) in spring before planting pea. After pea harvest, the plots were chisel-plowed (20 cm) and sweep-cultivated before seeding wheat.
(iv) No-till (NT): No tillage was implemented in 1995 and weeds were controlled by herbicides. In earlier years (1963–1995), minimum tillage had been implemented in these plots, which included skew-treading (2.5 cm deep) once or twice after wheat harvest in fall followed by sweep-cultivation (5 cm deep) before planting pea, and skew-treading two to three times in summer after pea harvest. A skew-treader consists of tined wheels on two angled ganged shafts that break and uniformly distribute residues to improve drill performance during seeding.
An undisturbed grass pasture (GP) served as a reference for comparisons of changes in SOM dynamics in the WP-LTE. The GP plot (45 m wide by 108 m long) is in proximity to the WP-LTE at CBARC and is maintained under native vegetation (since 1931) that is predominantly tall fescue (Festuca arundinacea Scheeber) with lesser amounts of bulbous bluegrass (Poa bulbosa L.), green foxtail (Setaria viridis L.), and yellow foxtail [S. pumila (Poiret) Roemer and Schult]. The GP plot was divided into four transverse sections and represented four sub-plots.
Soil Sampling and Analyses
In June 2016, two soil cores (3.8 cm diameter) were collected from 0- to 15-cm surface layer within each sub-plot and composited. Samples were taken between crop rows after clearing surface residues. Soils were air-dried in a greenhouse for 72 h and finely ground in a mechanical grinder to pass through a 2-mm sieve after removing visible pieces of plant materials. To determine bulk density, three separate soil cores (1.84 cm diameter and 0–15 cm deep each) were also taken within 0.5 m radius of initially collected soil cores. These soil cores were oven dried at 105°C for 24 h and bulk density was computed by dividing oven dried soil mass with soil volume (Blake and Hartge, 1986).
Approximately 10 g subsamples of air-dried soils (<2 mm) were finely ground (<0.05 mm) in a Shatter Box 8530 ball mill (Spex Sample Prep., Metuchen, New Jersey, USA) for 3 min, and then analyzed for total C and N concentrations by dry combustion method (Purakayastha et al., 2008) at 950°C using a LECO CN628 analyzer (LECO Corp., St. Joseph, Michigan, USA). Previous investigations have confirmed the absence of inorganic carbon at 0–15 cm layer within the experimental site, and therefore, total C measured for all soils is safely assumed to be soil organic carbon (SOC) (Ghimire et al., 2015). This was confirmed by pH-values measuring below 6.7 in all soils (Table 1). Soil bulk density was used to convert SOC concentration (g kg−1) to SOC stock per area (Mg ha−1) to remove confounding effects of compaction when comparing all treatments. Soil pH of extracts from 5 g air-dried soils (<0.05 mm) in 10 mL of 0.01 M CaCl2 was measured electrometrically using an Orion Star A215 pH/conductivity bench top meter (Thermo Fisher Scientific Inc., Beverly, MA, USA) (Ghimire et al., 2015). Water holding capacity (WHC) of air-dried soil (<2 mm) was determined as described by Awale and Chatterjee (2015). Briefly, 10 g air-dried soil was saturated with deionized water in a conical funnel with a filter paper (Whatman no. 42) and WHC was determined as the water retained in soil after draining excess water for 1 h.
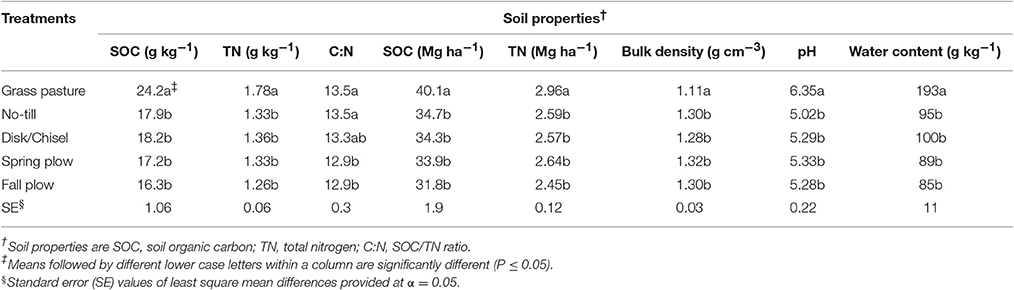
Table 1. Treatment effects on bulk soil characteristics in 0- to 15-cm Walla-Walla silt loam near Pendleton, Oregon.
Particulate organic matter carbon (POM-C) and nitrogen (POM-N) were assessed by following the procedure of Sollins et al. (1999). A 10 g air-dried soil sample (<2 mm) was dispersed in 30 mL of 5 g L−1 sodium hexametaphosphate and shook for 18 h on a reciprocal shaker (240 strokes per min). The mixture was then passed through a 53-μm sieve by rinsing several times with deionized water. The material retained on the sieve was dried in an oven at 105°C for 24 h, weighed, finely ground using mortar and pestle, and analyzed for C and N by dry combustion as described above. POM-C or POM-N (g kg−1) was then computed from the following equation:
where, Cs or Ns is % C or % N of sand fraction, and Ws is dry mass of sand fraction (g g−1).
Potassium permanganate oxidizable carbon (POXC) was determined as proposed by Weil et al. (2003) with a slight modification as discussed in Culman et al. (2012). A 2.5 g air-dried soil sample (<2 mm) was mixed with 20 mL of 0.02 M KMnO4 in a 50-mL polypropylene conical centrifuge tube. The mixture was vigorously shaken for 2 min on a reciprocal shaker (240 strokes per min) and allowed to settle for 10 min. Following settling, 0.5 mL of the supernatant from the upper 1 cm of the suspension was transferred into another 50-mL centrifuge tube and mixed with 49.5 mL of deionized water. Three subsamples from each diluted solution were measured for absorbance in a GENESYS 10S UV-VIS spectrophotometer (Thermo Fisher Scientific Inc., Madison, Wisconsin, USA) at 550 nm. POXC in a soil sample was calculated using the following equation:
where, 0.02 mol L−1 is the initial solution concentration, a is the intercept and b is the slope of the standard curve, 9,000 is mg C oxidized by 1 mol of MnO4 changing from Mn7+ to Mn4+, 0.02 L is the volume of KMnO4 solution reacted, and 0.0025 is the kg of soil used.
Soil inorganic nitrogen or KCl extractable-N (KEN) content (-N plus -N) was measured in duplicates according to Maynard et al. (2008). Briefly, 5 g air-dried soil (<2 mm) was mixed with 25 mL of 2 M KCl, shaken in a reciprocal shaker for 30 min, and the mixture was filtered through a Whatman no. 42 filter paper. The extract was analyzed for and concentrations colorimetrically using a phenol-nitroferricyanide method and a cadmium reduction method, respectively, in an automated micro-segmented flow Astoria analyzer (Astoria-Pacific Inc., Clackamas, Oregon, USA).
Water extractable organic carbon (WEOC) and total dissolved nitrogen (TDN) were determined by extraction of 10 g air-dried soil (<2 mm) using 40 mL deionized water (Cookson et al., 2008). The soil-water mixture was shaken in a reciprocal shaker for 1 h and then filtered through a Whatman no. 42 filter paper. The extract was frozen until analyzed for WEOC and TDN using a high-temperature combustion Torch TOC/TN analyzer (Teledyne Tekmar, Mason, OH, USA).
Carbon mineralization (Cmin) was estimated using a short-term incubation method following Sherrod et al. (2012), and Awale and Chatterjee (2017). Briefly, 100 g air-dried soil (<2 mm) was moistened to 60% WHC with de-ionized water using a pipette in a 1-L mason jar. The mason jar was closed with airtight screw-cap lid, fitted with a gas sampling port (butyl rubber septum) at the center, and was incubated at constant temperature of 25°C for 30 d. Soil moisture content was maintained at 60% throughout the incubation by monitoring the weight changes of the mason jar and adding deionized water as needed. Headspace air samples were collected from the jar on 1, 2, 3, 7, 8, 10, 13, 16, 22, and 30 d after incubation. At every sampling day, headspace air in the jar was mixed by withdrawing and injecting twice using a polypropylene syringe fitted with a 21-gauge needle and finally 30-mL air sample was collected into the syringe. The mason jar lid was then opened for at least 5–10 min to replenish with fresh air and to add deionized water (if necessary), sealed again, and returned to the incubator until 30-d. Triplicate subsamples of 7-mL air from each syringe were analyzed for CO2 concentrations within 2 h of their collection using a LI-820 CO2 analyzer (LICOR Inc., Lincoln, Nebraska, USA). Assuming ideal gas relations, the measured CO2 concentrations were then converted into mass units, expressed as mg CO2-C d−1 kg−1 soil. Cumulative CO2-C mineralized in 30 d (Cmin) was computed by summing all the CO2-C evolved at each time period.
Microbial biomass carbon (MBC) and nitrogen (MBN) were determined using chloroform fumigation-incubation method (Jenkinson and Powlson, 1976). Duplicate 10 g air-dried soils (<2 mm) were weighed into 60-mL French Square bottles, adjusted to 60% WHC by adding de-ionized water, and incubated at 25°C for 7 d. A set of empty bottles without soil was also incubated and processed similarly as those with soil. Following 7 d pre-incubation, one set of soils was fumigated with ethanol-free chloroform (CHCl3) in a vacuum chamber in the dark for 24 h while the other set was not and remained incubated (non-fumigated). Both the non-fumigated and fumigated soils (in bottles) were then placed inside 1-L mason jars consisting 2-mL of de-ionized water at the bottom (to maintain humidity). The mason jars were sealed with lids fitted with gas sampling ports and further incubated at 25°C for 10 d. Approximately, 30-mL gas samples were collected from the mason jars through the sampling ports, and analyzed for CO2 using infrared gas analyzer as described above. Soil MBC was calculated by dividing the difference of CO2-C produced between fumigated and non-fumigated samples by a correction factor (kc) of 0.41 (Collins et al., 1992). The measurement of CO2 evolved from the non-fumigated control following pre-incubation was considered as basal respiration (mg CO2-C kg−1 soil d−1), and metabolic quotient (qCO2) was calculated by dividing basal respiration with MBC (mg CO2-C g−1 MBC d−1). For MBN, the fumigated-incubated sample at 10 d was extracted with 50 ml of 2 M K2SO4 for 30 min and mineral N concentrations were determined colorimetrically as described above. Soil MBN was calculated by dividing the flush of mineral-N (-N + ) released during fumigation-incubation using a correction factor (kn) of 0.40 (Collins et al., 1992).
Data Analysis
Data were subjected to analysis of variance for a split-plot arrangement in a randomized block design using Proc Mixed of SAS (version 9.2, SAS Institute Inc., Cary, North Carolina)—assuming fixed crop and tillage effects and random replication term. We created dummy variables of GP data to conform to WP-LTE design for statistical comparisons. Treatment (tillage) means were compared using Fisher's least significant difference test when there was a significant treatment effect at 0.05 level of probability, unless otherwise stated. Univariate Pearson's correlation coefficients were used to evaluate relationships between SOM pools. Stepwise multiple linear regression analyses were conducted using Proc Reg of SAS with backward elimination to explore the relative importance of SOM pools in predicting SOC.
Results
Bulk Soil Characteristics
GP had significantly (P < 0.05) higher levels of SOC and total nitrogen (TN) concentrations as well as stocks than all cultivated treatments in the WP-LTE (Table 1). Compared to GP, on average, cultivated soils had 28 and 26% less SOC and TN concentrations and had 16 and 13% less SOC and TN stocks, respectively. Within WP-LTE, there were no significant differences in SOC and TN levels among tillage treatments. However, DT/CT had slightly higher SOC concentration than FP (P = 0.08). Soil C:N under GP, NT, and DT/CT were similar, but both SP and FP had lower C:N than GP and NT. Soil bulk density did not differ among cultivated treatments, and averaged 1.30 g/cm3, which was significantly higher than that of GP soil (Table 1). On the other hand, all cultivated treatments had significantly lower soil pH-values than GP (Table 1). Among the cultivated treatments, soil pH under NT was generally lower than other tillage practices (P < 0.10). Gravimetric water content was higher under GP than under cultivated treatments (Table 1).
Physical and Chemical Pools of SOM
Treatments significantly affected POM-C, POM-N, POXC, and WEOC (Table 2). In general, GP had the highest levels of physical and chemical C- and N-pools, which decreased with increasing tillage intensity. POM-C and POM-N were significantly lower under FP and SP than under either GP, NT, or DT/CT, which were not different among each other. On average, POM-C and POM-N were each 18% greater under reduced tillage systems (NT and DT/CT combined) than plowing (FP and SP combined). POXC and WEOC were the highest under GP. Among the cultivated treatments, POXC was similar between NT and DT/CT, but both had higher POXC than under FP. Under SP, POXC was intermediate between DT/CT and FP, but was significantly lower than NT. WEOC did not differ between NT and DT/CT soils, and averaged 182 mg kg−1, which was significantly higher (14%) than WEOC of FP and SP soils. There were no significant effects of treatments on POM-C:N, TDN, WEOC:TDN, and KEN.
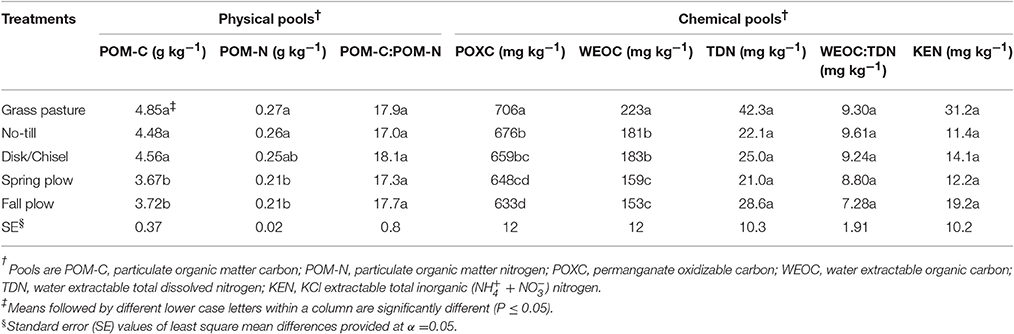
Table 2. Treatment effects on physical and chemical pools of SOM in surface 0- to 15-cm Walla Walla silt loam near Pendleton, Oregon.
Microbiological Pools of SOM
Soil microbial biomass values for C and N showed significant variation among treatments (Table 3). The greatest MBC was found under GP and the lowest under FP. Compared to GP, MBC was lower on average by 21% under NT, DT/CT, and SP soils. MBC among these latter three treatments was not significantly different. However, NT and DT/CT increased MBC by 27 and 36%, respectively, when compared to FP. Similar to MBC, soil MBN was the greatest under GP. On average, cultivated soils had about 55% less MBN relative to GP soil. There were no significant differences in MBN-values among cultivated treatments. The net result of the variations in soil MBC and MBN among treatments is that the ratio of microbial biomass C to N (MBC:MBN) was generally lower for GP soil than cultivated soils, in which the plow-tillage treatments exhibited slightly lower values compared to NT and DT/CT.
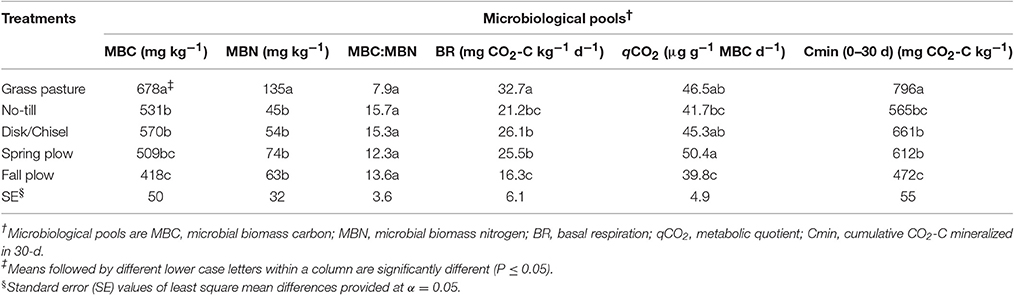
Table 3. Treatment effects on microbiological pools of SOM in surface 0- to 15-cm Walla Walla silt loam near Pendleton, Oregon.
The values of basal respiration (BR) showed significant variation among treatments (Table 3). GP had the highest BR among all treatments. DT/CT and SP had similar BR and both treatments had greater BR compared to FP. Basal respiration under NT did not differ from other cultivated treatments. qCO2 was higher under SP than under NT (by 17%) and FP (by 21%), with no statistical difference between the latter two. However, FP had lower qCO2 compared to both GP and DT/CT treatments.
Similar to BR, mineralized CO2-C differed significantly among treatments for all incubation sampling time periods, except for the initial 1 d of incubation (Figure 1, Table 3). However, the temporal pattern of CO2-C mineralized among treatments generally remained similar throughout the incubation period. The values for CO2-C mineralized were consistently highest and lowest under GP and FP, respectively, while NT, DT/CT, and SP were intermediate between them. At the end of 30 d, cumulative CO2-C (Cmin) produced under DT/CT and SP soils were similar and averaged 637 mg CO2-C kg−1, which was 20% lower than GP but 26% higher than FP. Cmin under NT was not statistically different from any other cultivated treatments, but was about 29% lower than that of GP.
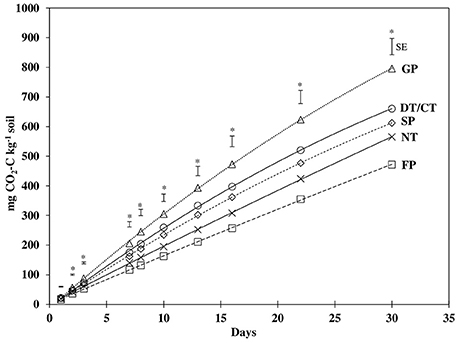
Figure 1. Carbon mineralization from soils under grass pasture (GP), no-till (NT), disk/chisel tillage (DT/CT), spring plow (SP), and fall plow (FP) in 30 days of incubation. Error bars are standard error (SE) values of least square mean differences for individual days. *Indicates significant (P ≤ 0.05) treatment differences for that day.
Fractions of SOM Pools
Proportions of labile C and N pools in SOM showed variation among treatments, with significant differences observed for POXC/SOC, Cmin/SOC, and POM-N/TN (Table 4). POXC/SOC was lower under GP than under cultivated treatments. Cmin/SOC was significantly lower under FP than under DT/CT and SP treatments, while GP and NT had intermediate levels of Cmin/SOC. POM-N/TN was higher under NT and DT/CT treatments compared to plow-tillage treatments and GP. In general, POM-C/SOC and MBC/SOC were lower, while N-pools in TN were higher under GP than under cultivated treatments, although such differences were not statistically significant (P > 0.05). On average, SOC had 22.8% POM-C, 3.6% POXC, 0.9% WEOC, 2.9% MBC, and 3.3% Cmin. Similarly, TN constituted about 17.1% PON, 1.9% TDN, 4.9% MBN, and 1.1% KEN.
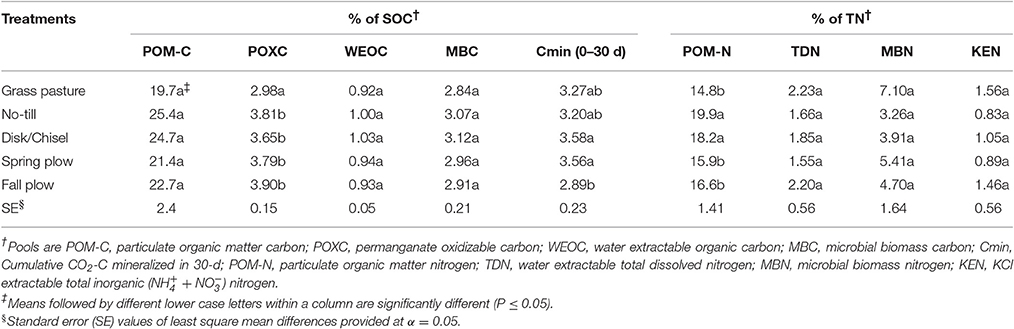
Table 4. Proportions of SOM pools in soil organic carbon (SOC) and total nitrogen (TN) in treatments at surface 0- to 15-cm Walla Walla silt loam near Pendleton, Oregon.
Relationships of SOM Pools
The values of univariate correlation coefficients (r) between the SOM pools are shown in Table 5. Across the study, the highest correlation coefficient value (r = 0.95) was observed between SOC and TN. Significant positive correlations were found for all SOM pools with SOC and TN, except for soil C:N, POM-C:N, and WEOC:TDN. In general, SOM pools were also correlated among each other. Nevertheless, the C-pools (POM-C, POXC, WEOC, and MBC) were more strongly correlated with SOM than the N-pools (TDN, MBN, and KEN). Among all the SOM pools, POXC and WEOC pools demonstrated the highest correlations with both SOC and TN. Stepwise multiple regression of all the tillage-responsive SOM pools on SOC showed that POXC and WEOC pools were the best predictors of SOC stock (Table 6). POXC and WEOC pools, in combination, could explain nearly 70% of the total variability in the model. Bulk density was generally negatively related to SOM pools, while both pH and gravimetric water content and SOM pools had positive relationships.
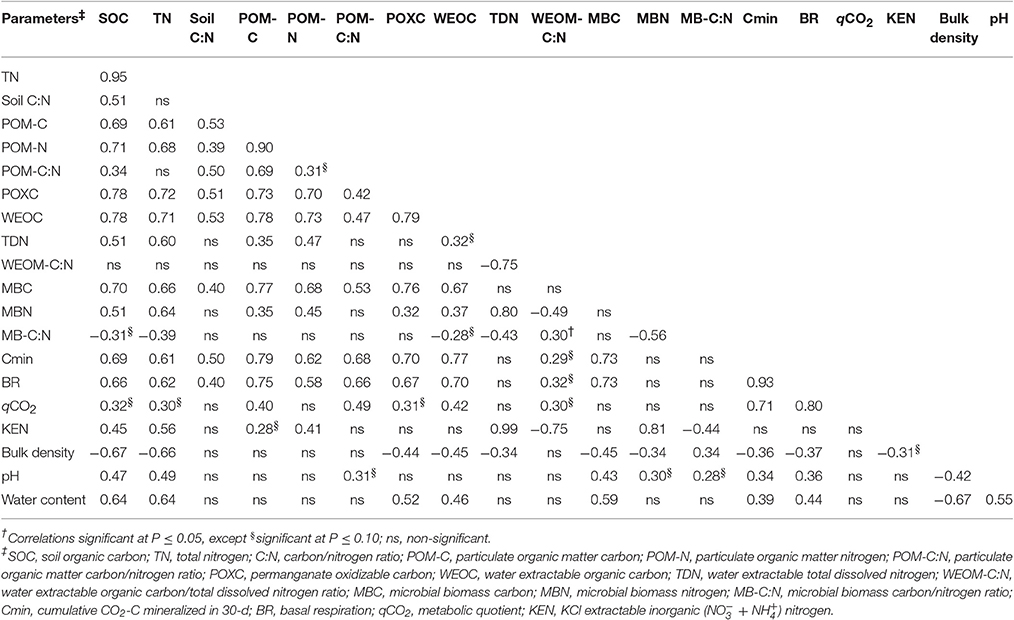
Table 5. Pearson correlation coefficients (r)† of soil parameters across the study.
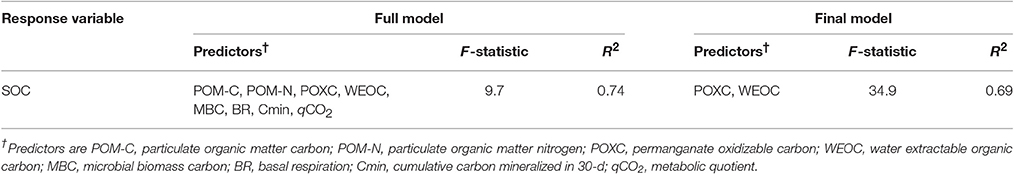
Table 6. F-statistic and total variability (R2) of the best stepwise multiple linear regression model for predicting soil organic carbon (SOC).
Discussion
Cultivation of native grasslands has led to depletion of SOC and TN levels from the 0–15 cm soil depth profile due to reduced biomass inputs, increased exposure of physically protected SOM to microbial decomposition, and accelerated residue decay from tillage induced aeration, increased soil temperature, and depletion of water content (Six et al., 2000; Purakayastha et al., 2008). For the current study site, the mean aboveground plant biomass inputs from GP and wheat-pea systems were estimated to be about 7 and 5 mg ha−1 year−1, respectively (Machado, 2011; Ghimire et al., 2015). Researchers have also asserted that undisturbed grasslands usually contain greater root density than cultivated systems (Gregorich et al., 2000; Beniston et al., 2014). Furthermore, legume-based (wheat-pea) cropping systems should result in residues that are more readily degraded than those in the GP system, which mostly consisted of annual and perennial grasses (Haynes, 2000). As a consequence of higher SOM levels, GP soil had lower bulk density and higher soil water retention (Franzluebbers et al., 1995).
Nevertheless, most studies claim that losses of SOM under arable systems can be minimized, at least within 0–15 cm top soil, by adopting reduced or conservation tillage systems (Machado et al., 2006; Dou et al., 2008; Chen et al., 2009; Awale et al., 2013). Such assertion was corroborated by our finding that DT/CT, a reduced tillage practice, tended to increase SOC content over FP. In fact, relative to GP, FP exhibited the highest reduction in SOC (33%) and TN (29%) levels, among all tillage systems. Crop residues accumulate at soil surface under reduced tillage systems, whereas intensive tillage such as FP buries crop residues and promotes their decomposition. Intensive tillage also disintegrates soil aggregates, introduces oxygen, increases soil temperature, and reduces soil water content—conditions favorable for rapid mineralization of residues and SOM (Zotarelli et al., 2007). In addition, the values of soil C:N for NT and DT/CT which were comparable to GP but higher than plow-treatments (SP and FP) further suggest that reduced tillage systems have potential to accumulate SOM and their adoption would lead to healthier soils.
NT and DT/CT increased POM-C and POM-N in soils over plow-treatments. Our results are in agreement with earlier studies that have also noticed higher POM pools with reduced tillage systems than more intensive tillage practices (Dou et al., 2008; Awale et al., 2013; Wang and Sainju, 2014). POM consists primarily of plant residues (Gregorich et al., 2006), physically protected within aggregates. Tillage breaks down these aggregates and exposes the protected POM to increased microbial consumption (Six et al., 2000; Zotarelli et al., 2007). Consequently, intensive tillage practices result in relatively less stabilization of POM than do reduced tillage systems. This is further supported by higher POM-C/SOC and POM-N/TN-values associated with reduced tillage systems than with plow-treatments. On the other hand, slightly greater assimilation of POM-N into MBN (MBN/TN) (Table 3) under plow-treatments might have also reduced POM-N/TN. Although weak, POM-N was significantly correlated (r = 0.45, P < 0.05) with MBN (Table 5). The greatest proportions of SOC and TN were found in POM-C and POM-N pools, respectively (Table 4). Purakayastha et al. (2008) found that POM-C was about 12.6–31% of SOC in eastern Washington with soils and management similar to this study. However, there were no significant differences in POM quality (POM-C:POM-N) among treatments because tillage induced changes in POM-C were closely matched by changes in POM-N, as demonstrated by significant correlation between POM-C and -N (Table 5). Higher values of C:N measured for POM (17.0–18.1) than bulk soil C:N (12.9–13.5) probably relates to the fact that POM is comprised of decomposing organic matter, often of recent origin (Gregorich et al., 2006).
The proportions of POXC in SOC measured in this study are higher than the reported range of 1.49–2.04% for soils across the iPNW by Morrow et al. (2016). Higher POXC-values obtained in this study could partly be explained by longer duration (53 years) of this study that allowed for more production of this pool when compared to shorter study periods of 3–31 years, as reported in Morrow et al. (2016). In addition, we sampled more soil (0–15 cm) compared to Morrow et al. (2016) who sampled less soil (0–10 cm). POXC levels can vary with soil depth in relation to concentration of roots and their exudation at different soil layers (Wang et al., 2017). Nevertheless, in our study, NT and DT/CT generally had more POXC compared to plow-treatments. This is in line with earlier findings that have also found higher POXC levels with reduced tillage systems than intensive tillage systems (Dou et al., 2008; Chen et al., 2009; Awale et al., 2013; Morrow et al., 2016). The POXC fraction of SOC is characterized based on its susceptibility to oxidation with weak potassium permanganate (KMnO4) solution, and thereby simulates microbial oxidation (Weil et al., 2003). According to Culman et al. (2012) and Hurisso et al. (2016), POXC reflects a more stabilized fraction of SOC and reduced tillage promotes POXC in soils compared to intensive tillage because the latter increases microbial oxidation of POXC. High correlations of POXC with MBC (r = 0.76) and with microbial activity (r = 0.67) corroborate this assertion. Also, POXC demonstrated strong correlation with POM (r = 0.73) and WEOC (r = 0.79). To this end, relative enrichment of POXC under reduced tillage systems over plow-treatments suggests greater accumulation and stabilization of SOM under the former. Accordingly, POXC pool can serve as a useful early indicator of SOC dynamics. Nevertheless, all cultivated treatments resulted in higher POXC/SOC as compared to GP. Greater microbial biomass and activity under GP could have rapidly oxidized or converted compounds within the POXC pools into more stabilized SOC forms (Wang et al., 2017).
Lower levels of WEOC and TDN were observed under cultivated treatments than under GP, mostly due to depletion of SOM levels with soil cultivation (Gregorich et al., 2000; Haynes, 2000). WEOM reflects the equilibrium between soluble and solid phases of SOM, whereby the amounts of native SOM primarily determines the production and concentration of WEOM (Flessa et al., 2000; Gregorich et al., 2000). Higher WEOM pools under GP could also be attributed to several other factors including higher soil water content and pH that increase the solubility of SOM (Table 1; Chantigny, 2003). Within the cultivated treatments, NT and DT/CT had significantly higher WEOC levels than plow-treatments. This is in accordance with earlier findings of Dou et al. (2008) and Carrillo-Gonzalez et al. (2013), where intensive tillage depleted WEOC levels by 41 and 37%, respectively, compared to NT. Intensive soil mixing breaks down soil macroaggregates and exposes microaggregate protected WEOC to microbial decomposition (Six et al., 2000; Dou et al., 2008). Studies have suggested that recent additions of SOM from residues can also contribute to WEOM, apart from native and more stabilized SOM pools (Flessa et al., 2000). This could be supported by strong and significant correlation of WEOC with POM-C (r = 0.78, P < 0.001), comparable to those found with bulk SOC (r = 0.78) or POXC (r = 0.79). Moreover, the production of WEOM is also believed to be microbially mediated (Gregorich et al., 2000), which is corroborated by the observed significant correlation between WEOC and MBC (r = 0.67). To this end, increases in WEOC with reduced tillage systems could be attributed to greater levels of POXC, POM-C, and microbial pools. Nevertheless, despite such evidence, relative contributions of native and recent SOM to WEOM pools may be clearly distinguished using advanced technologies, such as C isotope, which deserves further investigation.
No significant tillage induced changes in TDN or KEN were found, probably suggesting similar N-cycling rates across tillage gradients. The net result of significant variation in WEOC and no effect in TDN was that the values of WEOC:TDN were generally higher under reduced tillage than plow-tillage treatments, following a trend similar to MBC:MBN (discussed below). The WEOC:TDN ratio provides a hint of the quality of WEOM where the decline in WEOC:TDN ratio is usually associated with increased bioavailability of WEOM (Cookson et al., 2008). In the present study, the values of WEOC:TDN ranged from 7.28 to 9.30, lower than the reported range of 16 ± 4 for arable soils by Christou et al. (2005). Concentrations of WEOC and TDN may differ depending upon the type of extracting solution used, presenting a challenge when comparing WEOM pools across studies (Carrillo-Gonzalez et al., 2013). In addition, lower ratios observed in this study could be due to inclusion of soluble inorganic N in the computation of WEOM, as opposed to using only soluble organic N-pool. The values for WEOC/SOC and TDN/TN measured in this study are greater than the reported ranges of 0.05–0.40% for WEOC/SOC and 0.15–0.19% for TDN/TN in agricultural soils by Haynes (2005), probably due to variations in soil type and management.
As expected, GP soil contained highest C- and N-values in microbial biomass compared to cultivated soils because GP had greater SOM content. Among the cultivated treatments, the increase in MBC under reduced tillage systems compared to FP is attributed to greater C source availability (POM-C, POXC, and WEOC) and favorable soil environmental conditions for microbial activity (Wardle, 1992; Purakayastha et al., 2009). Crop residue accumulation at the soil surface not only provided organic C substrates for microbial biomass, but reduced soil disturbance likely favored the formation of stable soil aggregates that protected microbial biomass against soil temperature and water fluctuations (Collins et al., 1992; Franzluebbers et al., 1995; Balota et al., 2003). Nevertheless, SP exhibited intermediate MBC between reduced tillage systems and FP. Under FP, residue was plowed down immediately after crop harvest in the fall, while residue was incorporated only at seeding in the following spring under SP. Therefore, delaying residue incorporation under SP provided greater C-substrate availability for microbial biomass than FP. However, soil mixing of residue under SP accelerated residue decomposition and resulted in less C-substrate availability for microbes than reduced tillage systems, where residue left at soil surface provided steady C-source to microbes.
Although not significant, soil microbial N was higher under FP and SP than under NT and DT/CT, probably due to slightly greater assimilation of N from POM-N and WEOM with plow-treatments. Similarly, no significant changes were observed on both MBC/SOC- and MBN/TN-values among treatments. Consequently, it appeared that plow-tillage systems tended to have slightly lower MBC/SOC but higher MBN/TN than corresponding values under reduced tillage treatments. In fact, the percentage of SOM as MBC and MBN followed patterns similar to the absolute values for microbial biomass among the cultivated soils. Our results follow the trend reported by Balota et al. (2003), where plowing resulted in lower MBC and MBC/SOC levels than those measured under NT. Changes in proportions of microbial biomass C and N in SOM mainly arise due to differences in organic matter inputs (both quality and amount), and their availability to microorganisms (Anderson and Domsch, 1989). Using isotopic technology, other researchers have corroborated that C and N of microbial biomass are more closely associated with C and N of added residue than bulk soil C and N, suggesting that residue provide most of the microbial energy and nutrient requirements (Flessa et al., 2000; Gregorich et al., 2000). Soil mixing of residues under plow-treatments increases accessibility and availability of substrates to soil microbes and thereby enhances residue decomposition. However, low C but high N levels assimilated by soil microbes under plow-treatments would relate to more losses of C from soil via microbial respiration and greater risk of N leakage out of the soil system. Conversely, greater conversion efficiency of C into microbial biomass but with low N assimilation under reduced tillage treatments would imply more stabilization of organic C and slow release of N in soil. Overall, soil microbes are sustained for longer periods under reduced tillage with steady supply of substrates. Nevertheless, GP generally had low MBC/SOC but high MBN/TN-values compared to cultivated treatments. Wheat-pea residues in cultivated systems are likely more biodegradable compared to residues in GP. Addition of C-rich residues (high C:N) in soil would reduce microbial utilization efficiency of C, while increasing microbial N use efficiency and retention (Mooshammer et al., 2014). In our study, MBC represented 2.84–3.12% of total SOC, and MBN represented 3.3–5.3% of TN. Comparable values were reported for the same site in an earlier study (Collins et al., 1992), and for similar soils and management systems in eastern Washington (Purakayastha et al., 2008).
The trend observed for microbial biomass proportions in bulk SOM among treatments was further reflected in corresponding MBC:MBN-values. The values of microbial biomass C:N were generally higher under NT and DT/CT than under SP and FP. Similar results were observed by Balota et al. (2004), where increased tillage disturbance reduced microbial biomass C:N-values. Microbial biomass C:N ratio has been frequently used to define microbial community structure. A decline in microbial C:N is correlated with a gradual shift from fungal to bacterial predominance in microbial biomass because fungi have relatively higher C-demand than bacteria, whereas bacteria are more constrained by nutrient ratios (Cleveland and Liptzin, 2007). Fungal predominance in soils would lead to increased soil aggregation, greater accumulation, and stabilization of SOM, and improved nutrient cycling (Cookson et al., 2008).
The values of basal respiration (BR) and Cmin were highly correlated and had similar trends in all treatments (Table 5). It is worth noting that the relationships of BR with Cmin generally improved with increasing Cmin incubation time (data not shown). This could be due to the 7-d pre-incubation used before determining BR. Cmin was computed without accounting for such pre-incubation period. In addition, other studies have indicated that disturbances during soil sampling and processing could artificially stimulate and thereby overestimate values of C mineralization by exposing protected SOM in soils, especially under reduced tillage systems (Franzluebbers et al., 1995; Balota et al., 2004). However, the amounts of CO2-C evolution under plow-tillage treatments should reflect the field conditions.
Nevertheless, cultivated treatments had lower BR and Cmin than GP, which could be attributed to greater C availability and microbial biomass under GP (Fernandes et al., 2005). Higher pH, lower bulk density, and greater available water content of GP soils could have also favored greater soil microbial biomass and activity (Table 1; Franzluebbers, 1995; Jensen et al., 1997). Accordingly, among cultivated treatments, the lowest values of BR and Cmin under FP could be related to low MBC and C-availability (POXC, POM-C, WEOC) in this treatment. A similar result was observed for Cmin/SOC proportion, where FP exhibited the least value. Residue under FP was plowed under soon after crop harvest compared to SP treatment where residue was plowed down in spring of following year. Residues start decomposing immediately after incorporation under FP resulting in less C-substrate in this treatment compared to SP (Machado et al., 2006). On the other hand, higher microbial activity under reduced tillage systems can be attributed to more residues and MBC in the top soil compared to FP. Microbial activity was, however, comparable between reduced tillage treatments and SP. Recent mixing of residues under SP could have resulted in the flush of microbial activity (Franzluebbers, 1995; Franzluebbers et al., 1995). In general, high microbial activity in soil is regarded as improvement in soil health. However, studies have also suggested that the values of BR and Cmin can either provide an estimate of soil microbial index associated with the availability of large pools of C substrates, or relate to an ecological disorder (Aziz et al., 2013). Soil microbial index is considered a proxy for organic carbon cycling and its associated nutrients such as N, P, and S, indicating that higher microbial activity reflected greater soil productivity and vice-versa (Fernandes et al., 2005). Conversely, soils under ecophysiological disorder may also increase microbial respiration, as a mechanism to meet energy demand for cell integrity and maintenance by microbial biomass. Therefore, relating microbial activity with corresponding microbial biomass size (soil respiration per unit MBC or qCO2) may explain if a particular system is aggrading or degrading SOM (Fernandes et al., 2005).
Metabolic quotient (qCO2) showed significant variation among treatments, with FP and SP measuring lowest and highest rates, respectively, and intermediate rates under GP, NT, and DT/CT. qCO2 represents microbial utilization efficiency of soil C or C energy usage for maintaining metabolic activity (respiration) in relation to microbial growth. Therefore, lowest qCO2 rate under FP could be related to reduced microbial biomass (MBC) and its corresponding low microbial activity, as a result of C-substrate limitation from fall-plowing of residue (Balota et al., 2003). Such observation indicates that FP treatment would result in the lowest SOC accumulation. Compared to FP, qCO2 rate increased slightly under NT, but significantly under other treatments and this was attributed to corresponding increases in both microbial biomass and activity. Soil microbial activity (BR and Cmin) demonstrated positive correlation with MBC (Table 5). But interestingly, SP had the highest qCO2 rate among the treatments and that was significantly so when compared to qCO2 under NT. These results imply that during the metabolism of available SOM, SP would have greater proportion of CO2-C respiration losses and lower C assimilation into microbial biomass as compared to NT. Conversely, reduced tillage systems would likely increase SOM storage and improve nutrient cycling compared to spring plowing (Balota et al., 2003; Mooshammer et al., 2014).
It is also worth noting that neither microbial biomass nor its activity (BR, Cmin, qCO2) had any correlation with labile N-pools, including TDN, KEN, WEON, and MBN. Instead, these microbiological pools demonstrated significant correlations with SOC pools. These results suggested that microbial activity was primarily regulated by the availability of C-substrates across tillage gradients. Accordingly, relatively higher C-availability in NT treatment could have counter-balanced low soil pH effects on microbial biomass and its activity.
Overall, the study demonstrated that differences in bulk SOM (SOC and TN) of surface 0–15 cm soil was influenced by land use practices (GP vs. cultivated soils). However, no significant changes in bulk SOM levels were observed among cultivated treatments (tillage systems) within WP-LTE. Conversely, almost all SOC pools responded to tillage as well as to land-use. TN pools, with the exception of POM-N, were not influenced by tillage. These results suggested that tillage induced changes were probably associated more with long-term SOC sequestration than N-availability in soil under wheat-pea rotation. The SOM pools showed significant relationships among each other and with SOC and TN. These results are in accordance with those reported by Morrow et al. (2016), who observed that POXC, WEOC, WEON, MBC, MBN, Cmin (24-d), N-mineralization, acid hydrolysable, and non-hydrolysable C- and -N, SOC, and TN were all positively correlated with each other across soils under diverse agroecosystems within the iPNW. Similarly, significant interrelationships among SOM pools have also been reported in other arable soils in different agroecoregions (Cookson et al., 2008; Dou et al., 2008; Chen et al., 2009; Culman et al., 2012; Awale et al., 2013; Hurisso et al., 2016). Nevertheless, in the present study, C-pools were more strongly correlated with SOM compared to N-pools. These results corroborate previous findings that physical (POM), chemical (POXC and WEOC), and microbiological (MBC, BR, Cmin, and qCO2) pools of SOM are relatively more sensitive to tillage disturbance than total SOC and TN (Balota et al., 2003; Cookson et al., 2008; Awale et al., 2013). Among these sensitive SOC pools, POXC and WEOC exhibited highest correlations with SOC and TN. In addition, among all the sensitive SOM pools, stepwise regression analyses selected the combination of POXC and WEOC pools as the best predictors of SOC. These results identified POXC and WEOC pools as the most sensitive SOM pools to tillage under the wheat-pea cropping system near Pendleton, Oregon.
Conclusions
Our study demonstrated that physical (POM), chemical (POXC and WEOC), and microbiological (MBC, BR, Cmin, and qCO2) pools of SOM were more sensitive to long-term tillage management practices than bulk SOC and TN under a wheat-pea rotation. However, microbial measurements can exhibit seasonal variation due to changes in soil water content and temperature, and caution should be taken when extrapolating the results of this study to other situations (Collins et al., 1992; Fernandes et al., 2005). Analysis of microbiological SOM pools at different times during the season should provide more information needed for management decisions. Chemical pools of SOM were more sensitive than microbiological and physical indicators of tillage induced SOM dynamics. Therefore, given the complexity and time required to determine microbial pools, we recommend use of POXC or WEOC in the early detection of SOM trends for the purposes of adjusting management practices to enhance SOC accretion and improving soil health. From the perspective of long-term SOM storage, fall-plowing (FP) would likely contribute the least among all tillage systems studied. Differences in SOM storage between NT and reduced tillage (DT/CT) management are likely to continue to be negligible, reflecting the minimum disturbance nature of DT/CT. While these reduced tillage systems exhibit superiority over FP and SP in building up SOM, delaying tillage until spring (SP) sequestered more C than FP. Overall, adoption of reduced tillage systems (NT and DT/CT) should increase SOM storage under wheat-pea cropping system overtime in the iPNW.
Author Contributions
RA and SM: Conceived and designed the experiment. RA and ME: Performed the experiment. RA and SM: Analyzed data and wrote the manuscript.
Conflict of Interest Statement
The authors declare that the research was conducted in the absence of any commercial or financial relationships that could be construed as a potential conflict of interest.
Acknowledgments
This paper is based on work that is supported by the National Institute of Food and Agriculture, U.S. Department of Agriculture, under award no. 2011-68002-30191 and additional support from the Columbia Basin Agricultural Research Center. We are thankful to Larry Pritchett and Rodney Miller for assistance with laboratory analyses.
Abbreviations
BR, basal respiration; C, carbon; C:N, carbon-to-nitrogen ratio; CBARC, Columbia Basin Agricultural Research Center; Cmin, carbon mineralization; CO2, carbon dioxide; DT/CT, disk/chisel tillage; FP, fall plow; GP, grass pasture; KEN, KCl-extractable nitrogen; MBC, microbial biomass carbon; MBN, microbial biomass nitrogen; N, nitrogen; NT, no-till; PNW, Pacific Northwest; POM, particulate organic matter; POM-C, particulate organic matter carbon; POM-N, particulate organic matter nitrogen; POXC, permanganate oxidizable carbon; qCO2, metabolic quotient; SOC, soil organic carbon; SOM, soil organic matter; SP, spring plow; TDN, total dissolved nitrogen; TN, total nitrogen; WEOC, water extractable organic carbon; WEOM, water extractable organic matter; WHC, water holding capacity; WP-LTE, wheat-pea long-term experiment; WW-SF, winter wheat-summer fallow.
References
Anderson, T., and Domsch, K. H. (1989). Ratios of microbial biomass carbon to total organic carbon in arable soils. Soil Biol. Biochem. 21, 471–479. doi: 10.1016/0038-0717(89)90117-X
Awale, R., and Chatterjee, A. (2015). Soil moisture controls the denitrification loss of urea nitrogen from silty clay soil. Commun. Soil Sci. Plant Anal. 46, 2100–2110. doi: 10.1080/00103624.2015.1069317
Awale, R., and Chatterjee, A. (2017). Enhanced efficiency nitrogen products influence ammonia volatilization and nitrous oxide emission from two contrasting soils. Agron. J. 109, 47–57. doi: 10.2134/agronj2016.04.0219
Awale, R., Chatterjee, A., and Franzen, D. (2013). Tillage and N-fertilizer influences on selected organic carbon fractions in a North Dakota silty clay soil. Soil Till. Res. 134, 213–222. doi: 10.1016/j.still.2013.08.006
Aziz, I., Mahmood, T., and Islam, K. R. (2013). Effect of long term no-till and conventional tillage practices on soil quality. Soil Till. Res. 131, 28–35. doi: 10.1016/j.still.2013.03.002
Balota, E. L., Filho, A. C., Andrade, D. S., and Dick, R. P. (2003). Microbial biomass in soils under different tillage and crop rotation systems. Biol. Fert. Soils 38, 15–20. doi: 10.1007/s00374-003-0590-9
Balota, E. L., Filho, A. C., Andrade, D. S., and Dick, R. P. (2004). Long-term tillage and crop rotation effects on microbial biomass and C and N mineralization in a Brazilian Oxisol. Soil Till. Res. 77, 137–145. doi: 10.1016/j.still.2003.12.003
Beniston, J. W., DuPont, S. T., Glover, J. D., Lal, R., and Dungait, J. A. J. (2014). Soil organic carbon dynamics 75 years after land-use change in perennial grassland and annual wheat agricultural systems. Biogeochemistry 120, 37–49. doi: 10.1007/s10533-014-9980-3
Blake, G. R., and Hartge, K. H. (1986). “Bulk density,” in Methods of Soil Analysis, Part 1: Physical and Mineralogical Methods, ed A. Klute (Madison, WI: ASA, Inc. & SSSA, Inc.), 363–367.
Carrillo-Gonzalez, R., Gonzalez-Chavez, M. C. A., Aitkenhead-Peterson, J. A., Hons, F. M., and Loeppert, R. H. (2013). Extractable, DOC, and DON from a dry-land long-term rotation and cropping system in Texas, USA. Geoderma 197–198, 79–86. doi: 10.1016/j.geoderma.2012.12.019
Chantigny, M. H. (2003). Dissolved and water-extractable organic matter in soils: a review on the influence of land use and management practices. Geoderma 113, 357–380. doi: 10.1016/S0016-7061(02)00370-1
Chen, H., Hou, R., Gong, Y., Li, H., Fan, M., and Kuzyakov, Y. (2009). Effects of 11 years of conservation tillage on soil organic matter fractions in wheat monoculture in Loess Plateau of China. Soil Till. Res. 106, 85–94. doi: 10.1016/j.still.2009.09.009
Christou, M., Avramides, E. J., Roberts, J. P., and Jones, D. L. (2005). Dissolved organic nitrogen in contrasting agricultural ecosystems. Soil Biol. Biochem. 37, 1560–1563. doi: 10.1016/j.soilbio.2005.01.025
Cleveland, C. C., and Liptzin, D. (2007). C:N:P stoichiometry in soil: is there a “Redfield ratio” for the microbial biomass. Biogeochemistry 85, 235–252. doi: 10.1007/s10533-007-9132-0
Collins, H. P., Rasmussen, P. E., and Douglas, C. L. Jr. (1992). Crop rotation and residue management effects on soil carbon and microbial dynamics. Soil Sci. Soc. Am. J. 56, 783–788. doi: 10.2136/sssaj1992.03615995005600030018x
(CBARC) (2016). Data from: CBARC-Pendleton Coop Weather Data. Available online at: http://cbarc.aes.oregonstate.edu/
Cookson, W. R., Murphy, D. V., and Roper, M. M. (2008). Characterizing the relationships between soil organic matter components and microbial function and composition along a tillage disturbance gradient. Soil Biol. Biochem. 40, 763–777. doi: 10.1016/j.soilbio.2007.10.011
Culman, S. W., Snapp, S. S., Freeman, M. A., Schipanski, M. E., Beniston, J., Lal, R., et al. (2012). Permanganate oxidizable carbon reflects a processed soil fraction that is sensitive to management. Soil Sci. Soc. Am. J. 76, 494–504. doi: 10.2136/sssaj2011.0286
Culman, S. W., Snapp, S. S., Green, J. M., and Gentry, L. E. (2013). Short- and long-term labile soil carbon and nitrogen dynamics reflect management and predict corn agronomic performance. Agron. J. 105, 493–502. doi: 10.2134/agronj2012.0382
Dou, F., Wright, A. L., and Hons, F. M. (2008). Sensitivity of labile soil organic carbon to tillage in wheat-based cropping systems. Soil Sci. Soc. Am. J. 72, 1445–1453. doi: 10.2136/sssaj2007.0230
Feng, G., Sharratt, B., and Yound, F. (2011). Soil properties governing soil erosion affected by cropping systems in the U.S. Pacific Northwest. Soil Till. Res. 111, 168–174. doi: 10.1016/j.still.2010.09.008
Fernandes, S. A. P., Bettiol, W., and Cerri, C. C. (2005). Effect of sewage sludge on microbial biomass, basal respiration, metabolic quotient and soil enzymatic activity. Appl. Soil Ecol. 30, 65–77. doi: 10.1016/j.apsoil.2004.03.008
Flessa, H., Ludwig, B., Heil, B., and Merbach, M. (2000). The origin of soil organic C, dissolved organic C and respiration in a long-term maize experiment in Halle, Germany, determined by 13C natural abundance. J. Plant Nutr. Soil Sci. 163, 157–163. doi: 10.1002/(SICI)1522-2624(200004)163:2<157::AID-JPLN157>3.0.CO;2-9
Franzluebbers, A. J. (1995). Potential C and N mineralization and microbial biomass from intact and increasingly disturbed soils of varying texture. Soil Biol. Biochem. 31, 1083–1090. doi: 10.1016/S0038-0717(99)00022-X
Franzluebbers, A. J., Hons, F. M., and Zuberer, D. A. (1995). Tillage and crop effects on seasonal dynamics of soil CO2 evolution, water content, temperature, and bulk density. Appl. Soil Ecol. 2, 95–109. doi: 10.1016/0929-1393(94)00044-8
Fuentes, J. P., Flury, M., and Bezdicek, D. F. (2004). Hydraulic properties in a silt loam soil under natural prairie, conventional till, and no-till. Soil Sci. Soc. Am. J. 68, 1679–1688. doi: 10.2136/sssaj2004.1679
Ghimire, R., Machado, S., and Bista, P. (2017). Soil pH, soil organic matter, and crop yields in winter wheat-summer fallow systems. Agron. J. 109, 1–12. doi: 10.2134/agronj2016.08.0462
Ghimire, R., Machado, S., and Rhinhart, K. (2015). Long-term crop residue and nitrogen management effects on soil profile carbon and nitrogen in wheat-fallow systems. Agron. J. 107, 2230–2240. doi: 10.2134/agronj14.0601
Gregorich, E. G., Beare, M. H., McKim, U. F., and Skjemstad, J. O. (2006). Chemical and biological characteristics of physically uncomplexed organic matter. Soil Sci. Soc. Am. J. 70, 975–985. doi: 10.2136/sssaj2005.0116
Gregorich, E. G., Liang, B. C., Drury, C. F., Mackenzie, A. F., and McGill, W. B. (2000). Elucidation of the source and turnover of water soluble and microbial biomass carbon in agricultural soils. Soil Biol. Biochem. 32, 581–587. doi: 10.1016/S0038-0717(99)00146-7
Haynes, R. J. (2000). Labile organic matter as an indicator of organic matter quality in arable and pastoral soils in New Zealand. Soil Biol. Biochem. 32, 211–219. doi: 10.1016/S0038-0717(99)00148-0
Haynes, R. J. (2005). Labile organic matter fractions as central components of the quality of agricultural components of the quality of agricultural soils: an overview. Adv. Agron. 85, 221–268. doi: 10.1016/S0065-2113(04)85005-3
Hurisso, T. T., Culman, S. W., Howarth, W. R., Wade, J., Cass, D., Beniston, J. W., et al. (2016). Comparison of permanganate-oxidizable carbon and mineralizable carbon for assessment of organic matter stabilization and mineralization. Soil Sci. Soc. Am. J. 80, 1352–1364. doi: 10.2136/sssaj2016.04.0106
Jenkinson, D. S., and Powlson, D. S. (1976). The effects of biocidal treatment on metabolism in soil. V. A method for measuring soil biomass. Soil Biol. Biochem. 8, 209–213. doi: 10.1016/0038-0717(76)90005-5
Jensen, L. S., Mueller, T., Magid, J., and Nielsen, N. E. (1997). Temporal variation of C and N mineralization, microbial biomass and extractable organic pools in soil after oilseed rape straw incorporation in the field. Soil Biol. Biochem. 29, 1043–1055. doi: 10.1016/S0038-0717(97)00014-X
Lal, R. (2004). Carbon sequestration to mitigate climate change. Geoderma 123, 1–22. doi: 10.1016/j.geoderma.2004.01.032
Machado, S. (2011). Soil organic carbon dynamics in the pendleton long-term experiments: implications for biofuel production in Pacific Northwest. Agron. J. 103, 253–260. doi: 10.2134/agronj2010.0205s
Machado, S., Petrie, S., Rhinhart, K., and Ramig, R. E. (2008). Tillage effects on water use and grain yield of winter wheat and green pea in rotation. Agron. J. 100, 165–162. doi: 10.2134/agrojnl2006.0218
Machado, S., Pritchett, L., and Petrie, S. (2015). No-tillage cropping systems can replace traditional summer fallow in north-central Oregon. Agron. J. 107, 1863–1877. doi: 10.2134/agronj14.0511
Machado, S., Rhinhart, K., and Petrie, S. (2006). Long-term cropping system effects on carbon sequestration in eastern Oregon. J. Environ. Qual. 35, 1548–1553. doi: 10.2134/jeq2005.0201
Maynard, D. G., Kalra, Y. P., and Crumbaugh, J. A. (2008). “Nitrate and exchangeable ammonium nitrogen,” in Soil Sampling and Methods of Analysis, eds M. R. Carter and E. G. Gregorich (Boca Raton, FL: CRC Press), 71–80.
Mooshammer, M., Wanek, W., Hammerle, I., Fuchsluegger, L., Hofhansl, F., Knoltsch, A., et al. (2014). Adjustment of microbial nitrogen use efficiency to carbon:nitrogen imbalances regulates soil nitrogen cycling. Nat. Commun. 5, 3694. doi: 10.1038/ncomms4694
Morrow, J. G., Huggins, D. R., Carpenter-Boggs, L. A., and Reganold, J. P. (2016). Evaluating measures to assess soil health in long-term agroecosystem trials. Soil Sci. Soc. Am. J. 80, 450–462. doi: 10.2136/sssaj2015.08.0308
Payne, W. A., Rasmussen, P. E., Chen, C., Goller, R., and Ramig, R. E. (2000). Precipitation, temperature and tillage effects upon productivity of a winter wheat-dry pea rotation. Agron. J. 92, 933–937. doi: 10.2134/agronj2000.925933x
Purakayastha, T. J., Huggins, D. R., and Smith, J. L. (2008). Carbon sequestration in native prairie, perennial grass, no-till and cultivated Palouse silt loam. Soil Sci. Soc. Am. J. 72, 534–540. doi: 10.2136/sssaj2005.0369
Purakayastha, T. J., Smith, J. L., and Huggins, D. R. (2009). Microbial biomass and N cycling under native prairie, conservation reserve and no-tillage in Palouse soils. Geoderma 152, 283–289. doi: 10.1016/j.geoderma.2009.06.013
Sherrod, L. A., Reeder, J. D., Hunter, W., and Ahuja, L. R. (2012). Rapid and cost-effective method for soil carbon mineralization in static laboratory incubations. Commun. Soil Sci. Plan. 43, 958–972. doi: 10.1080/00103624.2012.653031
Six, J., Elliott, E. T., and Paustian, K. (2000). Soil macroaggregate turnover and microaggregate formation: a mechanism for C sequestration under no-tillage agriculture. Soil Biol. Biochem. 32, 2099–2103. doi: 10.1016/S0038-0717(00)00179-6
Soil Survey Staff (2014). Keys to Soil Taxonomy, 12th Edn. Washington, DC: USDA-Natural Resources Conservation Service.
Sollins, P., Glassman, C., Paul, E. A., Swanston, C., Lajtha, K., Heil, J. W., et al. (1999). “Soil carbon and nitrogen: pools and fractions,” in Standard Soil Methods for Long-Term Ecological Research, eds G. P. Robertson, D. C. Coleman, C. S. Bledsoe, and P. Sollins (New York, NY: Oxford University Press, Inc.), 89–105.
Wang, F., Weil, R. R., and Nan, X. (2017). Total and permanganate-oxidizable organic carbon in the corn rooting zone of US Coastal Plain soil as affected by forage radish cover crops and N fertilizer. Soil Till. Res. 165, 247–257. doi: 10.1016/j.still.2016.08.022
Wang, J., and Sainju, U. M. (2014). Soil carbon and nitrogen fractions and crop yields affected by residue placement and crop types. PLoS ONE 9:e105039. doi: 10.1371/journal.pone.0105039
Wardle, D. A. (1992). A comparative assessment of factors which influence microbial biomass carbon and nitrogen levels in soil. Biol. Rev. 67, 321–358. doi: 10.1111/j.1469-185X.1992.tb00728.x
Weil, R. R., Islam, K. R., Stine, M. A., Gruver, J. B., and Samson-Liebig, S. E. (2003). Estimating active carbon for soil quality assessment: a simplified method for laboratory and field use. Am. J. Altern. Agr. 18, 3–17. doi: 10.1079/AJAA2003003
West, T. O., and Post, W. M. (2002). Soil organic carbon sequestration rates by tillage and crop rotation: a global data analysis. Soil Sci. Soc. Am. J. 66, 1963–1946. doi: 10.2136/sssaj2002.1930
Williams, J. D., Gollany, H. T., Siemens, M. C., Wuest, S. B., and Long, D. S. (2009). Comparison of runoff, soil erosion, and winter wheat yields from no-till and inversion tillage production systems in northeastern Oregon. J. Soil Water Conserv. 64, 43–52. doi: 10.2489/jswc.64.1.43
Young, F. L., Ogg, A. G. Jr., and Alldredge, J. R. (2014). Postharvest tillage reduces downy brome (Bromus tectorum L.) infestations in winter wheat. Weed Technol. 28, 418–425. doi: 10.1614/WT-D-13-00151.1
Keywords: carbon sequestration, dissolved organic matter (DOM), labile carbon pools, microbial biomass, particulate organic matter, permanganate oxidizable carbon, soil organic matter, tillage
Citation: Awale R, Emeson MA and Machado S (2017) Soil Organic Carbon Pools as Early Indicators for Soil Organic Matter Stock Changes under Different Tillage Practices in Inland Pacific Northwest. Front. Ecol. Evol. 5:96. doi: 10.3389/fevo.2017.00096
Received: 20 February 2017; Accepted: 31 July 2017;
Published: 15 August 2017.
Edited by:
Jodi Lynn Johnson-Maynard, University of Idaho, United StatesReviewed by:
Mukhtar Ahmed, Pir Mehr Ali Shah Arid Agriculture University, PakistanAndrey S. Zaitsev, Justus Liebig Universität Gießen, Germany
Copyright © 2017 Awale, Emeson and Machado. This is an open-access article distributed under the terms of the Creative Commons Attribution License (CC BY). The use, distribution or reproduction in other forums is permitted, provided the original author(s) or licensor are credited and that the original publication in this journal is cited, in accordance with accepted academic practice. No use, distribution or reproduction is permitted which does not comply with these terms.
*Correspondence: Rakesh Awale, YXdhbGVyQG9yZWdvbnN0YXRlLmVkdQ==