 Masanori Takano
 Genki Ichinose
- 1Akihabara Laboratory, CyberAgent, Inc., Tokyo, Japan
- 2Department of Mathematical and Systems Engineering, Shizuoka University, Hamamatsu, Japan
Human social strategies have evolved as an adaption to behave in complex societies. In such societies, humans intensively tend to cooperate with their closer friends, because they have to distribute their limited resources through cooperation (e.g., time, food, etc.). It also makes the situation difficult to have uniform social relationships (social grooming) with all friends. Thus, the social relationship strengths often show a much skewed distribution (a power law distribution). Here we aim to show adaptivity of such social grooming strategies in order to explore the evolution of human social intelligence. We use a model in the framework of evolutionary games where the social grooming strategies evolve via building social relationships with cooperators. Simulation results demonstrate four evolutionary trends. One of the trends is similar to the strategy that humans use. We find that these trends depend on three parameters; individuals' richness, group sizes, and the amount of social grooming. The human-like strategy evolves in large poor groups. Moreover, the increase of the amount of social grooming makes the group size larger. Conversely, this implies that the same strategy evolves when the amount of social grooming is properly adjusted even if the group sizes are different. Our results are important in the sense that, between human and non-human primates, the differences of the group size and the amount of social grooming are significant.
1. Introduction
Cooperation is common among humans and it is fundamental to our society (Smith and Szathmáry, 2000; Fehr and Fischbacher, 2003). The amount of cooperation by other people is limited because they have to pay costs (e.g., money, time, opportunities, food, etc.) (Santos et al., 2006; Xu and Wang, 2015). Therefore, people carefully choose their friends in order to receive intensive cooperation (Rand et al., 2011; Grujić et al., 2012; Wang et al., 2012).
Actually, people tend to cooperate with close friends. An experimental study using the Donation Game shows that participants tend to cooperate more with closer friends (Harrison et al., 2011). Another study using the Public Goods Game shows that friend groups are more cooperative with each other than with other groups (Haan et al., 2006). Additionally, in a data analysis study dealing with the data set of a social network game, people's frequent communication increases their cooperative behavior (Takano et al., 2016a,b).
Thus, it is important that humans have stronger social relationships in greater numbers with cooperators than with others. We define social grooming as the behavior that constructs social relationships. Primarily, social grooming is the act of cleaning or maintaining the body of a social partner in primates (Dunbar, 2000, 2004; Nakamura, 2003). Social bonding is part of the functional aspect of social grooming. Therefore, human social bonding behavior is also called social grooming (Dunbar, 2000, 2004), as a hypothetical extrapolation of the findings in non-human animals.
The behavior constructing social relationships is not limited to humans but widely observed in primates (Kobayashi and Kohshima, 1997; Dunbar, 2000, 2004; Nakamura, 2003; Kobayashi and Hashiya, 2011; Takano et al., 2016a,b; Takano and Fukuda, 2017). In doing so, they face cognitive constraints (Dunbar, R. I. 2012) (e.g., memory and processing capacity) and time constraints (i.e., time costs) in constructing and maintaining social relationships. These time constraints are not negligible, as people spend a fifth of their day in social grooming (Dunbar, 1998) for maintaining the relationship (Hill and Dunbar, 2003; Roberts and Dunbar, 2011). Therefore, the strength of existing social relationships exhibits a negative correlation with the total number of social relationships (Roberts et al., 2009; Miritello et al., 2013b).
On the other hand, it is important to select cooperative partners in the evolution of cooperation because cooperators tend to be exploited by defectors (Axelrod, 2006). To select appropriate cooperative partners, it is known that reading others' intentions play an important role (Han et al., 2012, 2015; Arechar et al., 2017). Arechar et al. (2017) revealed that sending a message for their intentions (selecting a strategy in repeated games) when subjects play the games promotes cooperation even when an error is incorporated. Han et al. (2012, 2015) showed that, by theoretical models, others' intentions which are formed by past interactions in repeated games enhance cooperation. Moreover, commitments (e.g., prior agreements to cooperate) are other mechanisms to build long-term cooperative relationships, which enable cooperation to evolve by natural selection (Nesse, 2001; Martinez-Vaquero et al., 2015, 2017). Han et al. (2015) emphasized that the balance between intention and commitments is important for cooperative relationships. These are the mechanisms working in direct reciprocity. Spatial reciprocity and network reciprocity also suggest the necessity of fixed relationships (Perc and Szolnoki, 2010; Perc et al., 2017). Therefore, it is reasonable to consider that humans and other social animals tend to cooperate with their close partners (Haan et al., 2006; Harrison et al., 2011; Takano et al., 2016a,b).
Humans must construct and maintain social relationships within the constraints of this trade-off. We expect that strategies are employed to distribute the limited time resources to maximize benefits from their social relationships (Brown and Brown, 2006; Miritello et al., 2013a; Saramaki et al., 2014). As a result of such strategies, social relationship strengths, as measured by frequency of social grooming (Roberts and Dunbar, 2011; Arnaboldi et al., 2012, 2013; Song et al., 2013; Fujihara and Miwa, 2014; Saramaki et al., 2014; Takano and Fukuda, 2017), may often show a skewed distribution (Zhou et al., 2005; Arnaboldi et al., 2013), distributions following a power law (Hossmann et al., 2011; Arnaboldi et al., 2012; Hu et al., 2012; Pachur et al., 2012; Song et al., 2013; Fujihara and Miwa, 2014; Takano and Fukuda, 2017). Moreover, it has been demonstrated that social structures of non-human primates (Kanngiesser et al., 2011; Tung et al., 2015; Levé et al., 2016; Dunbar, R. I. M. 2012) are also skewed.
The skewed distributions of the relationships could be generated by a strategy where individuals select social grooming partners in proportion to the strength of their social relationships (Pachur et al., 2012; Takano and Fukuda, 2017); known as the Yule–Simon process (Yule, 1925; Simon, 1955; Newman, 2005). Individuals should pay time costs to win the competitions with others by strengthening their social relationships with cooperators, assuming that having strong social relationships is to receive cooperation.
Human societies using these strategies are much larger than those of non-human primates. Based on the social brain hypothesis, human intelligence has evolved to adapt to large societies. Therefore, the evolution of human strategies of social relationship construction may explain the origin of human intelligence. However, evolutionary stability of the strategies, i.e., the Yule–Simon process, is still open investigation.
In this paper, we aim to show the adaptivity of the social grooming strategies in order to explore the evolution of human social intelligence predicted by the social brain hypothesis. Especially, we focus on how environments drive the evolution of a social grooming strategy that humans use in their daily life. The evolution should depend on group size and the amount of resources for cooperation. For this purpose, we simulate the evolution of the strategy to receive cooperation from others with different environmental conditions for cooperations. We show that strategies evolve depending on the strength of social relationships.
2. Methods
We expand the model of Takano and Fukuda (2017) to an evolutionary game. They consider two types of individuals; social groomers and cooperative groomees (Figure 1 (Takano and Fukuda, 2017). In the real world, individuals are groomers and groomees, simultaneously. For simplicity, they use this classification to focus on the social grooming strategies for social structures. In this paper, we only focus on the evolution of social grooming strategies while cooperation from gromees' is static. This is because that cooperative behaviors are common in humans and primates (Silk, 2009; Rand and Nowak, 2013). Given that cooperation from groomees' is static, we can consider the evolution of groomers' strategies. While the evolutionary dynamics of cooperation are well-known (Nowak, 2006; Perc and Szolnoki, 2010; Rand and Nowak, 2013; Perc et al., 2017), there are few study on the evolutionary dynamics of social grooming. Groomers construct their social relationships with groomees depending on their social grooming strategies in a “grooming stage.” Cooperative groomees cooperate with groomers depending on social relationship strengths in a “cooperation stage.” Groomer strategies evolve based on their fitness which is the amount of cooperation from groomees in each generation. Groomees' cooperation strategies are static. Table 1 shows the parameters of this model.
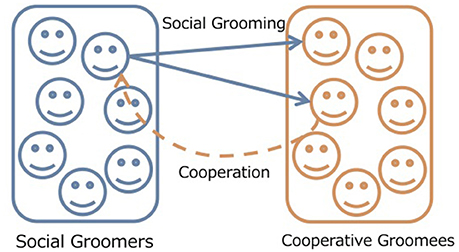
Figure 1. Concept of our model. Social groomers interact with cooperative groomees depending on their social grooming strategies. Cooperative groomees cooperate with social groomers who are top Rc on the strengths of social relationships. Groomer strategies evolve based on their fitness which is the amount of cooperation from groomees.
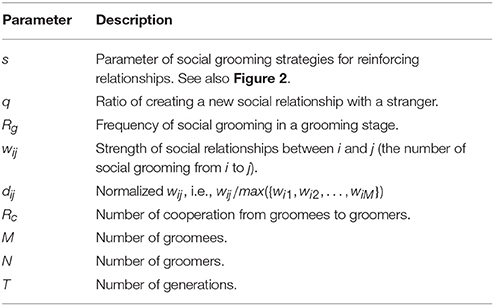
Table 1. Descriptions of model parameters.
In a grooming stage, groomer i repeatedly interacts with cooperative groomees Rg times depending on their social grooming strategy (si, qi). qi is a ratio that i constructs a new social relationship with a stranger, new groomee j, and si is a parameter of a probabilistic function p(dij; si) which selects existing social grooming partner j depending on dij (dij > 0). We used the following function (Figure 2) as a simple function to express various strategies depending on dij including concentrated investment to strong relationships (s = 4), diversified investment to weak relationships (s = −4), at random (s = 0), and the Yule–Simon process (s = 1; i.e., human-like strategy).
where αi = 1+si, βi = 1 when si ≥ 0 while αi = 1, βi = 1−si when si < 0. dij is wij/max({wi1, wi2, …, wiM}), where wij shows strength of social relationships, i.e., the number of social grooming from i to j. This function only depends on dij, because previous studies have revealed that people select their social grooming partners depending on the strength of social relationships (Pachur et al., 2012; Takano and Fukuda, 2017). Therefore, this function can simply represent human-like social grooming strategies. M is the number of groomees. b(x; α, β) is a normalized beta distribution xα−1(1−x)β−1/B(α, β), where B(·, ·) is a beta function. While using other functions which have fewer assumptions by using more dimensions is possible (e.g., nonparametric functions), we used Equation (1) because it is simple and is expressive enough to represent various social grooming strategies (Figure 2).
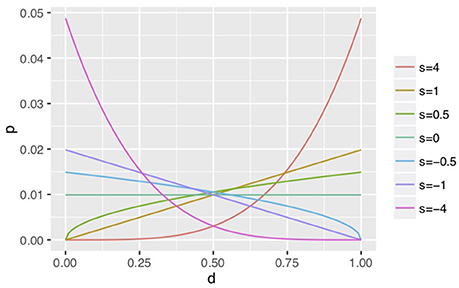
Figure 2. Examples of social grooming strategies. Social groomers with large s tend to interact with a groomee in a strong social relationship (large d). On the other hand, groomers with small s tend to interact with a groomee in a weak social relationship (small d). When s = 0, groomers interaction is independent from d. When s = 1, groomers interact in proportion to the strength of social relationships, i.e., the Yule–Simon process.
In a cooperation stage, groomee j cooperates with groomers in the top Rc as ranked by {w1j, w2j, …, wNj}. The total payoff (i.e., fitness) of each groomer is the number of cooperation (i.e., the number of times ranked in the top Rc of each cooperator). That is, cooperators cooperate in their close relationships according to their resources Rc. RcM shows all resources in the environment (Rc, M), i.e., the total amount of cooperation.
The next generation is generated by sampling with replacement in proportion to the groomers' fitness, i.e., the roulette wheel selection. In each generation, s mutates by the Gaussian distribution (μ = 0, σ = 0.2) and q mutates by the Gaussian distribution (μ = 0, σ = 0.05), where μ is a mean and σ is a standard deviation of the distribution, where q∈[0, 1] (if q is out of range by mutation, then it is set to the nearest value in 0 or 1). Groomers' s and q in an initial generation are set by the Gaussian distribution (μ = 0, σ = 5.0) and by uniform distribution [0, 1], respectively. Cooperators do not evolve.
We conducted evolutionary simulations 30 times on each Rc and M by using this model (Rc ∈ {5, 10, …, 50}, M ∈ {5, 10, …200}). The number of groomers N is 100, the number of social grooming actions Rg in each grooming stage is 300 (we also use Rg = 100 in experiments shown in Figures S1, S3, and S4), and the number of generation T is 200. The source code is available at “https://doi.org/10.6084/m9.figshare.5526850.v1.”
We set the mutation parameters to be small so that evolution converges at the equilibrium point. At the same time, we set those parameters to be large so that evolution reaches the equilibrium point within T generations. The initial range of parameters is widely distributed to cover the whole search space. All those values were determined based on the results of preliminary experiments.
3. Results
We found four evolutionary trends in the results of the simulations (Figure 3). These trends are explained by total resources RcM and the ratios of each cooperator's resources to the number of cooperators Rc/M (Figure 4, Figure S1).
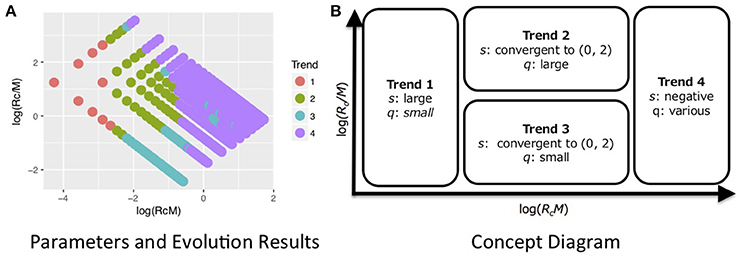
Figure 3. Summary of results of evolutionary simulations. We found four evolutionary trends (s and q of the final populations) depending on total resources RcM and the ratio of each cooperator's resources to the number of cooperators Rc/M (see details Figure 4, Figures S1, S2). (A) Shows the results of evolution with parameter Rc and M. Each color shows the most frequent trend in parameters of the point. This was created based on Figure 4. (B) Is the concept diagram. Trend 1 evolved when RcM was small. Trend 4 evolved when RcM was large. Trends 2 and 3 evolved in the intermediate range between trends 1 and 4 where Rc/M determined whether groomers evolved to trend 2 or 3. The behavior of trends 2 and 3 were similar to human strategies, although trend 2 was closer, as described.
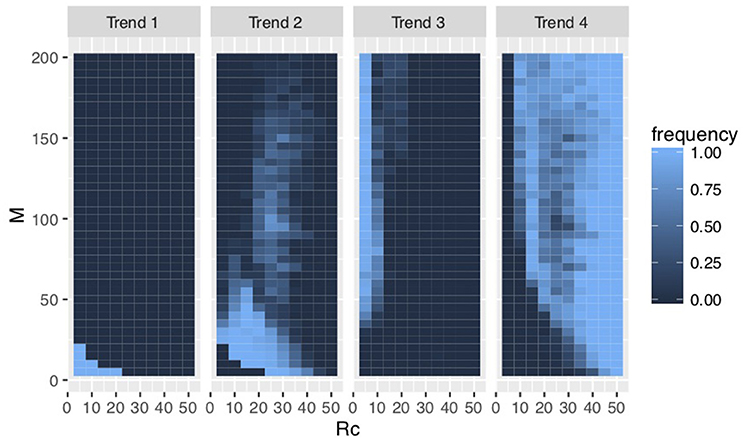
Figure 4. Frequencies of evolution in each trend (Rg = 300). Trend 1 evolved when RcM was small. Trend 4 evolved when RcM was large. Trends 2 and 3 evolved in the intermediate range between trends 1 and 4 where Rc/M determined whether groomers evolved to trend 2 or 3. Additionally, Rg increased a range of group sizes M in which social grooming strategies evolved to trend 2 or 3, i.e., a large amount of social grooming evolved to trends 2 and 3 in large groups.
Groomers evolved to trend 1 when RcM was small. Their s evolved larger and their q evolved smaller. This strategy concentrates investment into strong social relationships (e.g., s = 4 in Figure 2). Groomers tended to evolve to trend 4 when RcM was large with s < 0 . This strategy widely invests in many weak social relationships (e.g., s = −4 in Figure 2). These trends' s do not converge, meaning that they do not have characteristic values.
On the other hand, s converged to 0 < s < 2 in trends 2 and 3. Trends 2 and 3 evolved in the intermediate range between trend 1 and 4, and Rc/M determined whether groomers evolved to trend 2 or 3. Groomers evolved to trend 2 when Rc/M was large, where q evolved larger. They evolved to trend 3 when Rc/M was small, where q evolved smaller. s in trend 2 tends to be larger than s in trend 3. Both strategies are diversified investments (e.g., s = 1 and s = 0.5 in Figure 2), where groomers intensively invest in strong social relationships while also widely investing in weak social relationships. Additionally, M, where groomers evolved to trends 2 and 3 is larger, when Rg is large (see Figure 4, Figure S1).
Next, we demonstrate how the four trends emerged throughout the evolution and how groomers constructed social structures in each trend. Regarding the former, Figure 5, Figure S3 shows the evolutionary pressures (ds, dq) of each combination of s and q, and the typical orbits of evolution. Evolutionary pressures were calculated using the method of the average gradient of selection (AGoS) (Pinheiro et al., 2012). That is, we calculated the mean difference of s and q of the next generation of a population in which individuals' s and q obeyed the Gaussian distribution [(μ = s, σ = 0.2) and (μ = q, σ = 0.2)] on each cell (s, q). These orbits were drawn based on the average selection pressures and noises which are a normal distribution with μ = 0 and σ = 0.01. Incidentally, there is no cell in (ds, dq) = (0, 0). For the latter, Figure 6, Figure S4 shows strategies of social grooming, i.e. probability p of social grooming after each strength of social relationship w (Figures 6A–D) and social structures of each trend, i.e., distributions of w (Figures 6E–H).
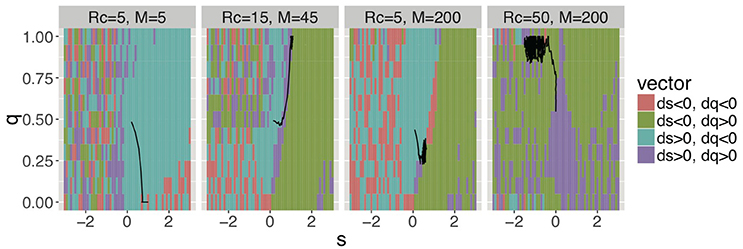
Figure 5. Average selection pressures (ds, dq) in four trends for (s, q) and typical orbits from (s, q) = (0, 0.5) (Rg = 300). These figures show trends 1, 2, 3, and 4 from left. The cell colors show the gradients of s and q (i.e., ds, dq). For example, the figures show s and q decrease when (s, q) is in a cell of ds < 0 and dq < 0. Areas, where the cell colors are mixed, show little gradients, that is, mutation noises were larger than selection pressures. For example, populations were random walk along the s axis and they were small along the q axis, when s < −1 in Rc = 5 and M = 200. Evolutionary dynamics in Rg = 100 showed similar trends (see Figure S3).
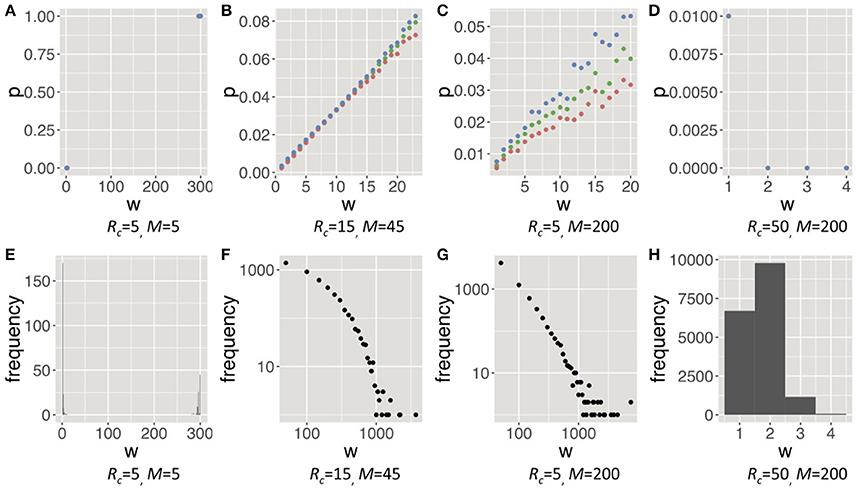
Figure 6. Strategies of social grooming (A–D), i.e., probability p of social grooming after each strength of social relationship w, and social structures of each trend (E–H), i.e., distribution of w in each trend (Rg = 300). These figures show trend 1, 2, 3, and 4 from left. These trends in Rg = 100 are similar to them (see Figure S4). In (A–D), the orange points are the 25th percentile, the green points are the 50th percentile and the blue points are the 75th percentile. In the (A–D), we drew w when the number of samples was more than 20. The figures of trend 2 and 3 of the (F,G) are shown by using a logarithmic scale in both axes. In the social structure of trend 1 (E), many weak relationships were caused by mutation noises of q.
Trend 1 evolved in environments with small RcM. Groomers are in intense competition for receiving cooperation from groomees in the environments. Therefore, they evolved to concentrate investments to a few poor groomees, i.e., large s and small q [(Rc, M) = (5, 5) in Figures 5, 6A]. The results show that they only had very strong social relationships in environments with small RcM (Figure 6E). That is, most w were very large and the number of relationships was low.
Trend 4 evolved in environments with large RcM. Groomers easily receive cooperation from groomees in these environments. Thus, they constructed many weak social relationships with many rich cooperators [(Rc, M) = (50, 200) in Figures 5, 6D,H]. That is, most w were very small and the number of relationships was high.
Trends 2 and 3 evolved between trend 1 and trend 4. Their s converge to (0, 2), this means groomers with these strategies intensively invest in strong social relationships while they also widely invest in weak social relationships [(Rc, M) = (15, 45) and (5, 200) in Figure 5]. Their social grooming probability is in proportion to each strength of the social relationships (Figures 6B,C), so their construction processes of social relationships are similar to the Yule–Simon process. As a result, their social structures were similar to power law distributions (Figures 6F,G).
The main difference between trends 2 and 3 is how q is affected by Rc/M. When Rc/M is small, groomers have to confine the number of social relationships with groomees to construct strong social relationships, because they compete intensively in each social relationship (i.e., small Rc). Therefore, they evolved to small q with small Rc/M [trend 3; (Rc, M) = (5, 200) in Figure 5]. In contrast, when Rc/M is large, they do not have to restrict the number of social relationships with groomees, because their competition is not intense in each social relationship (i.e., large Rc) and the maximum number of their social relationships is small (i.e., small M). Thus, they evolved to large q with large Rc/M [trend 2; (Rc, M) = (15, 45) in Figure 5]. Interestingly, these trends of evolution show non-continuous transition (see Figure S5).
4. Discussion
We analyzed the evolutionary dynamics of social grooming strategies and social structures. As a result, we find that the evolutionary dynamics depend on total resources (i.e., RcM) and the ratios of each cooperator's resources to the number of cooperators (i.e., Rc/M). In the poor small groups, individuals' strategies evolved to concentrate investment among strong social relationships. In the rich large groups, their strategies evolved to wide investment among many weak social relationships. In the middle groups, their strategies evolved according to the Yule–Simon process. These strategies invest intensively in strong social relationships while also investing widely in weak social relationships. As a result of these strategies, skewed distributions of social relationship strengths were generated.
There are two trend strategies which are similar to the Yule–Simon process (Pachur et al., 2012; Takano and Fukuda, 2017). One evolved in relatively rich and small groups in the middle groups. Individuals with this strategy constructed social relationships with all group members, and reinforced their relationships in proportion to the strength of social relationships. The other one evolved in relatively poor and large groups in the middle groups. Individuals with this strategy constructed social relationships with parts of their groups, and reinforced their relationships. In primitive human groups, individuals belong to large groups and interact in small cliques within them (Dunbar, R. I. M. 2012). Hence, humans' social grooming strategy may have evolved in the latter group. Non-human primates may also have similar strategies, because they also construct skewed social structures even though their group sizes are different from humans (Kanngiesser et al., 2011; Tung et al., 2015; Levé et al., 2016; Dunbar, R. I. M. 2012). Their strategies' similarity may be explained by the difference of the amount of social grooming Rg. Our experiments show the increase in the amount of social grooming Rg results in the increase of group sizes M, in which social grooming strategies evolve according to the Yule–Simon process (see Figure 4). The same social grooming strategies are stable in different group sizes. Actually, there is a positive correlation between group sizes and the amount of social grooming in primates (Dunbar, 1993, 2016).
If a social grooming strategy based on the Yule–Simon process is universal in primates not limited to humans, and group sizes depend on external factors (e.g., predators, food, etc.), then social grooming strategies of humans and non-human primates evolved to the same strategies by automatically adjusting their amount of social grooming. This relationship between group sizes and strategies may be clearly demonstrated by comparison among humans, non-human primates, and other social animals. This will contribute toward an explanation of the evolution of humans' large social groups.
It is also important how cooperators select other cooperators as their interaction partners (Hauert et al., 2002). For example, if cooperators maintain relationships with other cooperators and break relationships with exploiters, their reciprocal relationships will be maintained and their inegalitarian relationships will be broken (Perc and Szolnoki, 2010; Perc et al., 2017). This mechanism to keep cooperation is known as network reciprocity. Social grooming strategies are network construction strategies. Actually, social grooming has a beneficial effect on the construction of reciprocal relationships (Takano et al., 2016a,b). Our results suggest that the evolution of human-like strategies for network construction depends on the resources of environments and their group size. In this paper, we focused on the evolutionary dynamics of social grooming with stable cooperative behavior. The co-evolutionary dynamics of both behaviors is an issue to be addressed in the future.
Comparison among various species' data sets will be needed in order to clear the relationships between environments and the four evolutionary scenarios of social grooming strategies.
Author Contributions
MT: Designed the research, Constructed the model and Performed the simulation; MT and GI: Discussed and analyzed the results and Wrote the main manuscript text; All authors reviewed the manuscript.
Conflict of Interest Statement
MT is an employee of CyberAgent, Inc.
The other author declares that the research was conducted in the absence of any commercial or financial relationships that could be construed as a potential conflict of interest.
Supplementary Material
The Supplementary Material for this article can be found online at: https://www.frontiersin.org/articles/10.3389/fevo.2018.00008/full#supplementary-material
References
Arechar, A. A., Dreber, A., Fudenberg, D., and Rand, D. G. (2017). “I'm just a soul whose intentions are good”: the role of communication in noisy repeated games. Games Econ. Behav. 104, 726–743. doi: 10.1016/J.GEB.2017.06.013
Arnaboldi, V., Conti, M., Passarella, A., and Pezzoni, F. (2012). “Analysis of ego network structure in online social networks,” in 2012 International Conference on Privacy, Security, Risk and Trust and 2012 International Confernece on Social Computing (Amsterdam), 31–40.
Arnaboldi, V., Conti, M., Passarella, A., and Pezzoni, F. (2013). “Ego networks in twitter: an experimental analysis,” in 2013 Proceedings IEEE INFOCOM (Turin), 3459–3464.
Brown, S. L., and Brown, R. M. (2006). TARGET ARTICLE: selective investment theory: recasting the functional significance of close relationships. Psychol. Inq. 17, 1–29. doi: 10.1207/s15327965pli1701_01
Dunbar, R. (1998). “Chapter 6: Theory of mind and the evolution of language,” in Approaches to the Evolution of Language: Social and Cognitive Bases, eds J. R. Hurford, M. Studdert-Kennedy, and C. Knight (Cambridge, UK: Cambridge University Press), 92–110.
Dunbar, R. (2000). “On the origin of the human mind,” in Evolution and the Human Mind, eds P. Carruthers and A. Chamberlain (Cambridge, UK: Cambridge University Press), 238–253.
Dunbar, R. I. (1993). Coevolution of neocortical size, group size and language in humans. Behav. Brain Sci. 16:681. doi: 10.1017/S0140525X00032325
Dunbar, R. I. (2004). Gossip in evolutionary perspective. Rev. Gen. Psychol. 8, 100–110. doi: 10.1037/1089-2680.8.2.100
Dunbar, R. I. (2012). Social cognition on the internet: testing constraints on social network size. Philos. Trans. R. Soc. Lond. Ser. B Biol. sci. 367, 2192–201. doi: 10.1098/rstb.2012.0121
Dunbar, R. I. M. (2012). Bridging the bonding gap: the transition from primates to humans. Philos. Trans. R. Soc. Lond. B Biol. Sci. 367, 1837–1846. doi: 10.1098/rstb.2011.0217
Fehr, E., and Fischbacher, U. (2003). The nature of human altruism. Nature 425, 785–791. doi: 10.1038/nature02043
Fujihara, A., and Miwa, H. (2014). “Homesick lévy walk: a mobility model having ichi-go ichi-e and scale-free properties of human encounters,” in 2014 IEEE 38th Annual Computer Software and Applications Conference (Vasteras), 576–583.
Grujić, J., Röhl, T., Semmann, D., Milinski, M., and Traulsen, A. (2012). Consistent strategy updating in spatial and non-spatial behavioral experiments does not promote cooperation in social networks. PLoS ONE 7:e47718. doi: 10.1371/journal.pone.0047718
Haan, M., Kooreman, P., and Riemersma, T. (2006). “Friendship in a public good experiment,” in IZA Discussion Paper, Vol. 2108 (Bonn).
Han, T. A., Pereira, L. M., and Santos, F. C. (2012). Corpus-based intention recognition in cooperation dilemmas. Artif. Life 18, 365–383. doi: 10.1162/ARTL_a_00072
Han, T. A., Santos, F. C., Lenaerts, T., and Pereira, L. M. (2015). Synergy between intention recognition and commitments in cooperation dilemmas. Sci. Rep. 5:9312. doi: 10.1038/srep09312
Harrison, F., Sciberras, J., and James, R. (2011). Strength of social tie predicts cooperative investment in a human social network. PLoS ONE 6:e18338. doi: 10.1371/journal.pone.0018338
Hauert, C., De Monte, S., Hofbauer, J., and Sigmund, K. (2002). Volunteering as red queen mechanism for cooperation in public goods games. Science 296, 1129–1132. doi: 10.1126/science.1070582
Hill, R. A., and Dunbar, R. I. (2003). Social network size in humans. Hum. Nat. 14, 53–72. doi: 10.1007/s12110-003-1016-y
Hossmann, T., Spyropoulos, T., and Legendre, F. (2011). “A complex network analysis of human mobility,” in 2011 IEEE Conference on Computer Communications Workshops (INFOCOM WKSHPS) (Shanghai), 876–881.
Hu, T., Wenning, B.-L., Görg, C., Toseef, U., and Guo, Z. (2012). “Statistical analysis of contact patterns between human-carried mobile devices,” in 4th International Conference on Mobile Networks and Management MONAMI 2012, Vol. 58 of Lecture Notes of the Institute for Computer Sciences, Social Informatics and Telecommunications Engineering (Berlin, Heidelberg: Springer Berlin Heidelberg), 244–257.
Kanngiesser, P., Sueur, C., Riedl, K., Grossmann, J., and Call, J. (2011). Grooming network cohesion and the role of individuals in a captive Chimpanzee group. Am. J. Primatol. 73, 758–767. doi: 10.1002/ajp.20914
Kobayashi, H., and Hashiya, K. (2011). EnglishThe gaze that grooms: contribution of social factors to the evolution of primate eye morphology. Evol. Hum. Behav. 32, 157–165. doi: 10.1016/j.evolhumbehav.2010.08.003
Kobayashi, H., and Kohshima, S. (1997). Unique morphology of the human eye. Nature 387, 767–768. doi: 10.1038/42842
Levé, M., Sueur, C., Petit, O., Matsuzawa, T., and Hirata, S. (2016). Social grooming network in captive Chimpanzees: does the wild or captive origin of group members affect sociality?. J. Primatol. 57, 73–82. doi: 10.1007/s10329-015-0494-y
Martinez-Vaquero, L. A., Han, T. A., Pereira, L. M., and Lenaerts, T. (2015). Apology and forgiveness evolve to resolve failures in cooperative agreements. Sci. Rep. 5:10639. doi: 10.1038/srep10639
Martinez-Vaquero, L. A., Han, T. A., Pereira, L. M., and Lenaerts, T. (2017). When agreement-accepting free-riders are a necessary evil for the evolution of cooperation. Sci. Rep. 7:2478. doi: 10.1038/s41598-017-02625-z
Miritello, G., Lara, R., Cebrian, M., and Moro, E. (2013a). Limited communication capacity unveils strategies for human interaction. Sci. Rep. 3:1950. doi: 10.1038/srep01950
Miritello, G., Moro, E., Lara, R., Martínez-López, R., Belchamber, J., Roberts, S. G., et al. (2013b). Time as a limited resource: communication strategy in mobile phone networks. Soc. Netw. 35, 89–95. doi: 10.1016/j.socnet.2013.01.003
Nakamura, M. (2003). ‘Gatherings’ of Social Grooming among Wild Chimpanzees: implications for evolution of sociality. J. Hum. Evol. 44, 59–71. doi: 10.1016/S0047-2484(02)00194-X
Newman, M. E. J. (2005). Power laws, pareto distributions and Zipf's law. Contemp. Phys. 46, 323–351. doi: 10.1016/j.cities.2012.03.001
Nowak, M. A. (2006). Five rules for the evolution of cooperation. Science 314, 1560–1563. doi: 10.1126/science.1133755
Pachur, T., Schooler, L. J., and Stevens, J. R. (2012). “When will we meet again? regularities of social connectivity and their reflections in memory and decision making,” in Simple Heuristics in a Social World, eds R. Hertwig, U. Hoffrage and ABC Research Group (Oxford, UK: Oxford University Press), 199–224.
Perc, M., Jordan, J. J., Rand, D. G., Wang, Z., Boccaletti, S., and Szolnoki, A. (2017). Statistical physics of human cooperation. Phys. Rep. 687, 1–51. doi: 10.1016/j.physrep.2017.05.004
Perc, M., and Szolnoki, A. (2010). Coevolutionary Ggames–a mini review. Biosystems 99, 109–125. doi: 10.1016/j.biosystems.2009.10.003
Pinheiro, F. L., Pacheco, J. M., and Santos, F. C. (2012). From local to global dilemmas in social networks. PLoS ONE 7:e32114. doi: 10.1371/journal.pone.0032114
Rand, D. G., Arbesman, S., and Christakis, N. (2011). Dynamic social networks promote cooperation in experiments with humans. Proc. Natl. Acad. Sci. U.S.A. 108, 19193–19198. doi: 10.1073/pnas.1108243108
Rand, D. G., and Nowak, M. A. (2013). Human cooperation. Trends Cogn. Sci. 17, 413–425. doi: 10.1016/j.tics.2013.06.003
Roberts, S. G., Dunbar, R. I., Pollet, T. V., and Kuppens, T. (2009). Exploring variation in active network size: constraints and ego characteristics. Soc. Netw. 31, 138–146. doi: 10.1016/j.socnet.2008.12.002
Roberts, S. G. B., and Dunbar, R. I. (2011). Communication in social networks: effects of kinship, network size, and emotional closeness. Pers. Relationsh. 18, 439–452. doi: 10.1111/j.1475-6811.2010.01310.x
Santos, F. C., Rodrigues, J. F., and Pacheco, J. M. (2006). Graph topology plays a determinant role in the evolution of cooperation. Proc. R. Soc. B Biol. Sci. 273, 51–55. doi: 10.1098/rspb.2005.3272
Saramaki, J., Leicht, E. A., Lopez, E., Roberts, S. G. B., Reed-Tsochas, F., and Dunbar, R. I. (2014). Persistence of social signatures in human communication. Proc. Natl. Acad. Sci. U.S.A. 111, 942–947. doi: 10.1073/pnas.1308540110
Silk, J. B. (2009). Nepotistic cooperation in non-human primate groups. Philos. Trans. R. Soc. Lond. Ser. B Biol. Sci. 364, 3243–54. doi: 10.1098/rstb.2009.0118
Smith, J. M., and Szathmáry, E. (2000). The Origins of Life: From the Birth of Life to the Origin of Language. Oxford, UK: Oxford University Press.
Song, C., Wang, D., and Barabasi, A.-L. (2013). Connections between human dynamics and network science. arXiv:1209.1411.
Takano, M., and Fukuda, I. (2017). Limitations of time resources in human relationships determine social structures. Palgrave Commun. 3:17014. doi: 10.1057/palcomms.2017.14
Takano, M., Wada, K., and Fukuda, I. (2016a). “Lightweight interactions for reciprocal cooperation in a social network game,” in Proceedings of The 8th International Conference on Social Informatics (SocInfo) (Seattle, WA), 125–137.
Takano, M., Wada, K., and Fukuda, I. (2016b). Reciprocal altruism-based cooperation in a social network game. New Gener. Comput. 34, 257–271. doi: 10.1007/s00354-016-0304-0
Tung, J., Barreiro, L. B., Burns, M. B., Grenier, J.-C., Lynch, J., Grieneisen, L. E., et al. (2015). Social networks predict gut microbiome composition in wild baboons. eLife 4:e1002358. doi: 10.7554/eLife.05224
Wang, J., Suri, S., and Watts, D. J. (2012). Cooperation and assortativity with dynamic partner updating. Proc. Natl. Acad. Sci. U.S.A. 109, 14363–14368. doi: 10.1073/pnas.1120867109
Xu, B., and Wang, J. (2015). The emergence of relationship-based cooperation. Sci. Rep. 5:16447. doi: 10.1038/srep16447
Yule, G. U. (1925). A mathematical theory of evolution, based on the conclusions of Dr. J. C. Willis, F.R.S. Philos. Trans. R. Soc. B Biol. Sci. 213, 21–87.
Keywords: social grooming, evolutionary game, social structure, Yule–Simon process, cooperation
Citation: Takano M and Ichinose G (2018) Evolution of Human-Like Social Grooming Strategies Regarding Richness and Group Size. Front. Ecol. Evol. 6:8. doi: 10.3389/fevo.2018.00008
Received: 12 September 2017; Accepted: 16 January 2018;
Published: 31 January 2018.
Edited by:
Isamu Okada, Sōka University, JapanReviewed by:
Matjaž Perc, University of Maribor, SloveniaThe Anh Han, Teesside University, United Kingdom
Copyright © 2018 Takano and Ichinose. This is an open-access article distributed under the terms of the Creative Commons Attribution License (CC BY). The use, distribution or reproduction in other forums is permitted, provided the original author(s) and the copyright owner are credited and that the original publication in this journal is cited, in accordance with accepted academic practice. No use, distribution or reproduction is permitted which does not comply with these terms.
*Correspondence: Masanori Takano, dGFrYW5vX21hc2Fub3JpQGN5YmVyYWdlbnQuY28uanA=