 Elisa Bayraktarov1*
 Glenn Ehmke1,2James O'Connor2
 Emma L. Burns3Hoang A. Nguyen4Louise McRae5Hugh P. Possingham1,6David B. Lindenmayer7
- 1Centre for Biodiversity and Conservation Science, University of Queensland, Brisbane, QLD, Australia
- 2BirdLife Australia, Melbourne, VIC, Australia
- 3Research School of Biology, Australian National University, Canberra, ACT, Australia
- 4Research Computing Centre, University of Queensland, Brisbane, QLD, Australia
- 5Institute of Zoology, Zoological Society of London, London, United Kingdom
- 6The Nature Conservancy, Arlington, VA, United States
- 7Fenner School of Environment and Society, Australian National University, Canberra, ACT, Australia
Conserving species biodiversity demands decisive and effective action. Effective action requires an understanding of species population dynamics. Therefore, robust measures which track temporal changes in species populations are needed. This need, however, must be balanced against the scale at which population change is being assessed. Advances in citizen science and remote sensing technology have heralded an era of “big unstructured data” for biodiversity conservation. However, the value of big unstructured data for assessing changes in species populations, and effectively guiding conservation management has not been rigorously assessed. This can be achieved only by benchmarking big unstructured data against high-quality structured datasets, and ensuring the latter are not lost through an over-emphasis on “big data.” Here, we illustrate the current trend to disproportionately prioritize data quantity over data quality and highlight the discrepancy in global availability between both data types. We propose a research agenda to test whether this trend will result in a net decrease of useful knowledge for biodiversity conservation. We exemplify this by examining the availability of big unstructured data vs. standardized data using data from global repositories on birds as an example. We share experiences from the data collation exercise needed to develop the Australian Threatened Species Index. We argue there is an urgent need to validate and enhance the utility of big unstructured data by: (1) maintaining existing well-designed, standardized long-term species population studies; (2) strengthening data quality control, management, and curation of any type of dataset; and (3) developing purpose-specific rankings to assess data quality.
Background
How is global biodiversity faring? Do we know how we are progressing against international conservation targets designed to limit species extinctions globally? These questions can be answered well only if robust knowledge exists on the state and trajectory of biodiversity. This knowledge is crucial to support effective conservation policies and sound environmental management to improve species population trajectories and their conservation status. As data users charged with creating the World's first Threatened Species Index as a robust national headline indicator for Australia's threatened species (www.tsx.org.au), we share our experiences from the data collation exercise bringing together all existing data which can be used for trend analyses of threatened species populations. Several indicators have been developed to track changes in species populations nationally (van Strien et al., 2016) and globally (Butchart et al., 2010; Brummitt et al., 2017). Some of them have been adopted as official “environmental health” statistics (Gregory and van Strien, 2010), while others report on progress against international targets such as those in the Convention on Biological Diversity (Collen et al., 2009; Tittensor et al., 2014). Biodiversity indicators, environmental management, and questions around which conservation interventions to prioritize have a common need for knowledge generated by high-quality data from consistent long-term monitoring.
But do we know what data we are dealing with and whether they are fit for the purpose of answering questions of conservation concern? We suggest that “big unstructured data,” which comprise large amounts of data collected for loosely defined “observatory purposes” may have less utility than currently assumed for measuring changes in populations of species. At present, vast datasets are being accumulated from a range of sources such as Earth Observation networks (e.g., National Ecological Observatory Network (NEON)] (Lindenmayer et al., 2018) and citizen science initiatives (Isaac et al., 2014) with an assumption that they can detect changes in species populations. However, to date, these have not been sufficiently benchmarked against traditional ways of measuring changes in populations of species (e.g., repeat measure animal tracking data) to understand their utility. Undoubtedly, remote sensing data can be valuable for some biodiversity tracking approaches, especially when used in concert with targeted long-term population data. While there are cases where remote sensing products were effectively used and validated to assess, for example, global forest cover change over time (Buchanan et al., 2013; Hansen et al., 2013), no remote sensing technology exists to quantify the trajectory of populations of mobile species of conservation concern unless combined with animal tracking data from telemetry devices (Tibbetts, 2017). Studies have tested the effectiveness of opportunistic citizen science data with no success detecting long-term population declines (Isaac et al., 2014; Kamp et al., 2016) unless rigorous models correct for observation, reporting and detection biases and data were validated against reliable survey data (van Strien et al., 2013; Walker and Taylor, 2017). Other research used the IUCN Red List of Ecosystems criteria to assess the mountain ash forest ecosystem in south-eastern Australia. Using data from long-term monitoring on the ground the ecosystem was classified as Critically Endangered (Burns et al., 2015). In contrast, based on remote sensing data the ecosystem was classified as Least Concern (Burns et al., 2015). It is an open question as to whether big unstructured data are useful to assess the effectiveness of key conservation management interventions such as species-specific restoration or the control of invasive species. That is, not all datasets are created equal for tackling species conservation and management problems. Equally important is that the increasing prevalence of big unstructured data may distract policy makers and resource managers from the need to invest in gathering high-quality time series datasets for making informed decisions. This statement is based on our experience working with multiple stakeholders for the development of a Threatened Species Index in Australia where the general perception is that there is a lot of existing data in public data repositories. A closer look into the suitability of these data for the purpose of calculating species population trends revealed issues around data collation and curation. For instance, species were often not defined to the subspecies level or there was no metadata on the specific method used for monitoring or the unit of measurement (e.g., number of individuals, nests, traps, etc. recorded). Likewise, often it was not clear whether the species were monitored repeatedly at the same fixed site over time.
We illustrate these problems using a global example on birds and show the discrepancy in quantity between data from standardized monitoring vs big unstructured data. We conclude with five key lessons for avoiding the “data trap” i.e., where massive quantities of unstructured data are accumulated without us knowing what questions they can be used to answer (Rillig et al., 2015). Big unstructured data produced without a scientific question may be useful for the generation of hypotheses, but not necessarily for testing them. We call for more evidence to determine if the analysis of big unstructured data can provide accurate trends in species populations to avoid “swimming” in data but with no wisdom.
The Data Deficiency for Robust Species Management
One of the greatest problems faced by conservation managers and policy makers is the availability, consistency and continuity of well-designed long-term monitoring data to support robust decision-making under dwindling conservation budgets (Lindenmayer et al., 2018). Such data are critical for conserving threatened species which are often cryptic and difficult to monitor (Legge et al., 2018). Equally challenging is establishing and tracking drivers of biodiversity change. Meeting these challenges requires careful planning, a robust design for and implementation of question-driven monitoring, stable funding, good infrastructure supporting data collection as well as data storage, curation, and sharing (Legge et al., 2018). Data collection systems need to adhere to scientific standards over generational time-scales of species. However, efforts to collect data are often directed toward short-term research, reflecting the time needed to complete a PhD or a short-term report. Data from such short-term studies are often fragmented and inconsistent and while some insights can be gained from them, they are not a robust foundation to provide strategic knowledge to manage biodiversity through time (Estes et al., 2018).
The Value of Data
Data, by definition, are information, especially facts or numbers, collected to then be examined and considered and used to help decision-making (sensu Cambridge English Dictionary, 2018). A common opinion when monitoring is being planned or evaluated is “all data are valuable” or “more data are better.” However, these assumptions are largely untested and whether they are true may be context specific. For example, it is difficult to determine if population declines or increases are real or identify the drivers of temporal change from incidental records of a threatened species without having information on context (e.g., whether habitat was logged, burned, or restored). The value of data depends on how useful they are to those charged with achieving outcomes (e.g., to stop species extinction or improve environmental management Field et al., 2005). If data cannot generate this type of knowledge, an investment in any derived action can fail to achieve a useful outcome. In this way, the value of data depends on the problem sought to be solved. For instance, the Keeling curve provides critical long-term data on atmospheric carbon dioxide levels and thereby influences policies to reduce carbon emissions. High quality data from long-term monitoring measuring Essential Biodiversity Variables are especially needed for policies depending on understanding temporal trends in biodiversity (Brummitt et al., 2017). In general, the value of data increases the longer a scientifically robust monitoring program has been running (Cunningham and Lindenmayer, 2017) and more comparable data points are collected (Lindenmayer et al., 2018). This is because some environmental trends become apparent only after 10, 15, or 20 years of data collection (Lindenmayer et al., 2018). Indeed, well established long-term and fit-for-purpose monitoring not only generates the most ecologically effective data in the most cost-effective way but has also led to major key discoveries (Legge et al., 2018). We therefore argue that question-driven long-term studies must be maintained as a benchmark for quality datasets and to validate and/or enhance the utility of big unstructured data.
Avoiding the Data Trap–Bird Data as a Global Example
More data globally are being gathered on birds now than ever before (Figure 1). The Global Biodiversity Information Facility (GBIF) is an international network funded by the world's governments to integrate and provide open access to biodiversity data. In the case of birds, the broad-scale citizen-science project eBird is providing roughly 20% of the data available on birds in GBIF (Sullivan et al., 2017) and the initiative is investing in efforts to develop statistical approaches to assess temporal trends based on occupancy probabilities. Currently, the GBIF database hosts >500 million bird occurrence records published between 1970 and 2018. At first glance, this large volume of data appears to be great news. However, the database contains very few sites with “structured” bird surveys i.e., monitoring the same location over time using consistent, scientifically-determined methods such as those collated by the Living Planet Index (LPI). There are presently over 9,000 site-based time series from structured bird monitoring in the LPI database, including data from schemes such as the North American Breeding Bird Survey, between 1970 and 2018 (< 1% of the GBIF database). Our efforts to aggregate GBIF data to create site-based time series for trend analyses and compare to trends produced with LPI data were unsuccessful. This was because the former represents specimen records collected with different monitoring methods and variable effort and/or for which reliable meta-data are lacking, i.e., point-location data.
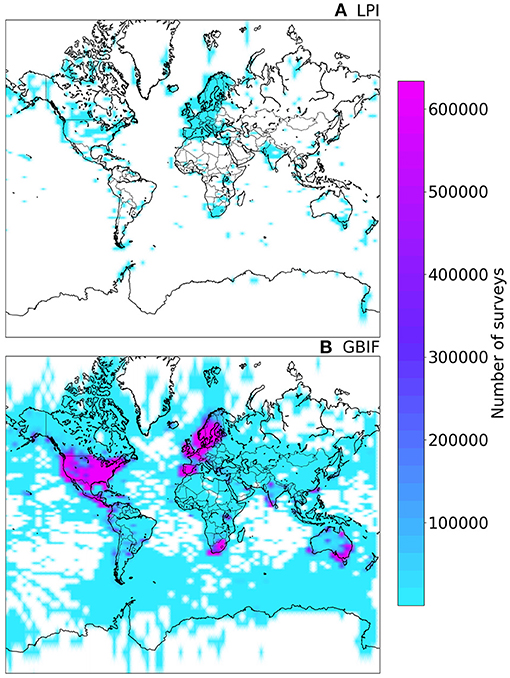
Figure 1. Comparison of global bird data collection of standardized (A) vs. big data (B) between 1970 and 2018. Data in (A) from the Living Planet Index (LPI) database are sites with time series information from repeated observations of species using the same monitoring method and in (B) from the Global Biodiversity Information Facility (GBIF) are occurrence records without monitoring method information which were aggregated to unique latitudes and longitudes per species. LPI data contain 9,230 site-based time series aggregated from data collected with a consistent monitoring method (sites can be small monitoring plots/areas/transects or aggregated to the state/province/country level). GBIF data contain information on 16,800,224 distinct survey locations with unique latitudes and longitudes aggregated from 537,424,092 total surveys with spatial information while omitting 2,188,462 surveys without spatial information (not shown here). Density estimation of the number of surveys is created by histograms of LPI and GBIF data using the same scale for comparison. Data sources: Legge et al. (2018) Living Planet Index database www.livingplanetindex.org, downloaded on 13 March 2018 and GBIF.org (2018), downloaded on 14 March 2018.
Reasons for the paucity of structured vs. unstructured data may include people simply running out of funding and therefore having to abandon scientifically-based bird monitoring programs. Some may assume that ad hoc practices for “recreational” or “outreach” purposes may be good enough to produce information for species monitoring. We share five lessons learned from the data collation exercise to develop the Australian Threatened Species Index which are applicable globally when assembling datasets to underpin sound species conservation and management. We urge decision-makers to consider these lessons before relying solely on big unstructured data for biodiversity conservation:
1. Not all datasets are created equal. The usefulness or value of data is ultimately dictated by the knowledge generated to answer questions of interest. For example, to inform trends in species populations, a high-quality dataset is one produced by standardized measures with monitoring effort repeated at the same place over time. Modifications of sampling protocols during a monitoring program may confound temporal trends with method changes (Lindenmayer et al., 2018). Big unstructured data, although abundant, typically have a high level of noise to signal ratio which obscures the signal on real trends (Cunningham and Lindenmayer, 2017). Moreover, data collection without specified (testable) objectives may not measure the “correct” variables to answer questions about biodiversity.
2. Big unstructured data may not deliver useful knowledge to address species declines. They may even create misinformation because they often do not tell us about the trajectories of species of conservation concern, key ecological processes, or management interventions. For much of the biodiversity at risk, there are often few data points. While methods to exploit big unstructured data (Szabo et al., 2010) on biodiversity are emerging, their usefulness for facilitating key needs (e.g., threatened species listing, species protection and prioritization) are not yet proven (Isaac et al., 2014) and unstructured data have often failed to detect long-term population declines (Kamp et al., 2016). We highlight two pervasive issues with big unstructured data: (a) they are increasingly being collected without reference to appropriate scientific standards; and (b) key meta-data such as survey method, timing and effort, and spatial coordinates, are often lacking or inaccurate (e.g., point-location data in GBIF).
3. Once key time series datasets are identified that report on changes in biodiversity over time, their ongoing collection must be maintained. Data in the form of time series can track change in species population abundance over time (Collen et al., 2009). A time series is a sequence of population samples for one or more species taken at multiple time points and that uses the same method of collection at the same location. Time series are vital for the development of multi-species trends. Once time series are broken, infrastructure uprooted and expertise lost, the monitoring programs that gather them can be very difficult, and sometimes impossible, to re-establish.
4. Data curation and sharing is as important as data collection. To identify valuable data among the enormous quantities of data, they have to be discoverable, quality controlled, appropriately managed (i.e., curated to a standard that enables re-use). It currently remains unclear whether more sophistication in analytical techniques and informatics can enhance the utility of big unstructured data to better quantify species declines (Kamp et al., 2016). Indeed, we will not know this if we do not have well designed time series data for benchmarking (van Strien et al., 2013; Isaac et al., 2014; Walker and Taylor, 2017).
5. Identify key time series datasets that meet certain criteria for robustness, the categorization of their suitability for the specific purpose is essential. This allows for transparent, defensible decisions about which datasets to exclude from analyses to avoid biased conclusions. Categorizing data based on their suitability for a specific purpose can help avoid the data trap and limit the risk of misleading results from inadequately chosen data.
Long-term ecological research (LTER) networks are invaluable for gathering the data needed for biodiversity conservation and environmental management. For example, the LTER network in Australia had 12 monitoring networks, which for decades, specialized in conducting stratified and well-designed repeat-measure ecological monitoring to detect and predict environmental change. Data collected and published by such networks are at the top of the hierarchy of the data value proposition compared with the generally disparate alternatives. However, despite their inherent value and rarity, these long-term ecological research networks are no longer supported in Australia (Lindenmayer and 68 others, 2017).
Whether or not the big unstructured data on birds can, or cannot, be mined to deliver meaningful trends and infer causality about temporal changes in populations and especially declines is an unanswered question. We aim to resolve this question for threatened birds in Australia by comparing Threatened Species Index trends produced with standardized vs. big unstructured data using the same suite of species in the future. Clearly, big unstructured data cannot substitute for long-term standardized datasets. The availability of high-quality data is a prerequisite to enable robust statistical comparisons to outputs from big unstructured data to validate and/or enhance their utility. In the current global extinction crisis, long-term time series datasets from well-designed monitoring programs are essential to guide informed decision-making for biodiversity conservation and management.
We conclude with a call for action for researchers, managers and decision-makers alike to support long-term data collection and not to confuse data quantity with data quality. We propose a new research agenda that tests the utility of big unstructured data benchmarked against long-term high-quality datasets. However, without long-term funding for robust scientific monitoring programs, expanding their taxonomic and spatial extent particularly for developing countries (Stephenson et al., 2017; Wotton et al., 2017), as well as associated long-term data management and curation, our collective knowledge on the biodiversity we care about may diminish with time, and our ability to exploit the “information revolution” will be negligible.
Author Contributions
EB, GE, ELB, and DBL conceptualized the study. EB, GE, and HAN developed the methodology and performed the analyses. EB, GE, and DBL wrote the initial draft. EB, GE, JO, ELB, HAN, LM, HPP, and DBL contributed to the final version of the manuscript.
Conflict of Interest Statement
The authors declare that the research was conducted in the absence of any commercial or financial relationships that could be construed as a potential conflict of interest.
Acknowledgments
This research is largely drawn from lessons learnt during the development of a Threatened Birds Index within the Australian Government's National Environmental Science Program's Threatened Species Recovery Hub. We acknowledge the Living Planet Index at the Zoological Society of London/WWF and the Global Biodiversity Information Facility for data to support our global data example. We acknowledge UQ-Research Computing Centre and QCIF for accessing the clusters and QRISCloud computing infrastructure to perform the analysis.
References
Brummitt, N., Regan, E. C., Weatherdon, L. V., Martin, C. S., Geijzendorffer, I. R., Rocchini, D., et al. (2017). Taking stock of nature: essential Biodiversity Variables explained. Biol. Conserv. 213, 252–255. doi: 10.1016/j.biocon.2016.09.006
Buchanan, G. M., Fishpool, L. D., Evans, M. I., and Butchart, S. H. (2013). Comparing field-based monitoring and remote-sensing, using deforestation from logging at Important Bird Areas as a case study. Biol. Conserv. 167, 334–338. doi: 10.1016/j.biocon.2013.08.031
Burns, E. L., Lindenmayer, D. B., Stein, J., Blanchard, W., McBurney, L., Blair, D., et al. (2015). Ecosystem assessment of mountain ash forest in the Central Highlands of Victoria, south-eastern Australia. Austral Ecol. 40, 386–399. doi: 10.1111/aec.12200
Butchart, S. H., Walpole, M., Collen, B., van Strien, A., Scharlemann, J. P., Almond, R. E., et al. (2010). Global biodiversity: indicators of recent declines. Science 328, 1164–1168. doi: 10.1126/science.1187512
Cambridge English Dictionary (2018). Data Meaning in the Cambridge English Dictionary. [online] Dictionary.cambridge.org. Available online at: https://dictionary.cambridge.org/dictionary/english/data (Accessed March 13, 2018).
Collen, B., Loh, J., Whitmee, S., McRae, L., Amin, R., and Baillie, J. E. (2009). Monitoring change in vertebrate abundance: the living planet index. Conserv. Biol. 23, 317–327. doi: 10.1111/j.1523-1739.2008.01117.x
Cunningham, R. B., and Lindenmayer, D. B. (2017). Approaches to landscape scale inference and study design. Curr. Landsc. Ecol. Rep. 2, 42–50. doi: 10.1007/s40823-016-0019-4
Estes, L., Elsen, P. R., Treuer, T., Ahmed, L., Caylor, K., Chang, J., et al. (2018). The spatial and temporal domains of modern ecology. Nat. Ecol. Evol. 2, 819–826. doi: 10.1038/s41559-018-0524-4
Field, S. A., Tyre, A. J., and Possingham, H. P. (2005). Optimizing allocation of monitoring effort under economic and observational constraints. J. Wildl. Manag. 69, 473–482. doi: 10.2193/0022-541X(2005)069[0473:OAOMEU]2.0.CO;2
GBIF.org (2018). GBIF Occurrence Download. Available online at: https://doi.org/10.15468/dl.a2xpqm (accessed March 14, 2018).
Gregory, R. D., and van Strien, A. J. (2010). Wild bird indicators: using composite population trends of birds as measures of environmental health. Ornitho. Sci. 9, 3–22. doi: 10.2326/osj.9.3
Hansen, M. C., Potapov, P. V., Moore, R., Hancher, M., Turubanova, S. A., Tyukavina, A., et al. (2013). High-resolution global maps of 21st-century forest cover change. Science 342, 850–853. doi: 10.1126/science.1244693
Isaac, N. J. B., van Strien, A. J., August, T. A., de Zeeuw, M. P., and Roy, D. B. (2014). Statistics for citizen science: extracting signals of change from noisy ecological data. Methods Ecol. Evol. 5, 1052–1060. doi: 10.1111/2041-210X.12254
Kamp, J., Oppel, S., Heldbjerg, H., Nyegaard, T., and Donald, P. F. (2016). Unstructured citizen science data fail to detect long-term population declines of common birds in Denmark. Div. Distrib. 22, 1024–1035. doi: 10.1111/ddi.12463
Legge, S. M., Robinson, N., Lindenmayer, D. B., Scheele, B., Southwell, D., Wintle, B., et al. (eds.). (2018). Monitoring Threatened Speciesand Ecological Communities. (CSIRO PUBLISHING, 2018). Living Planet Index Database. Available online at: www.livingplanetindex.org (Accessed Mar 13, 2018).
Lindenmayer, D., and 68 others. (2017). Save Australia's ecological research. Science 357, 557–557. doi: 10.1126/science.aao4228
Lindenmayer, D. B., Likens, G. E., and Franklin, J. F. (2018). Earth Observation Networks (EONs): finding the right balance. Trends Ecol. Evol. 33, 1–3. doi: 10.1016/j.tree.2017.10.008
Rillig, M. C., Kiessling, W., Borsch, T., Gessler, A., Greenwood, A. D., Hofer, H., et al. (2015). Biodiversity research: data without theory—theory without data. Front. Ecol. Evol. 3:20. doi: 10.3389/fevo.2015.00020
Stephenson, P. J., Bowles-Newark, N., Regan, E., Stanwell-Smith, D., Diagana, M., Höft, R., et al. (2017). Unblocking the flow of biodiversity data for decision-making in Africa. Biol. Conserv. 213, 335–340. doi: 10.1016/j.biocon.2016.09.003
Sullivan, B. L., Phillips, T., Dayer, A. A., Wood, C. L., Farnsworth, A., Iliff, M. J., et al. (2017). Using open access observational data for conservation action: A case study for birds. Biol. Conserv. 208, 5–14.
Szabo, J. K., Vesk, P. A., Baxter, P. W., and Possingham, H. P. (2010). Regional avian species declines estimated from volunteer-collected long-term data using List Length Analysis. Ecol. Applic. 20, 2157–2169. doi: 10.1890/09-0877.1
Tibbetts, J. H. (2017). Remote sensors bring wildlife tracking to new level: trove of data yields fresh insights—and challenges. BioScience 67, 411–417. doi: 10.1093/biosci/bix033
Tittensor, D. P., Walpole, M., Hill, S. L., Boyce, D. G., Britten, G. L., Burgess, N. D., et al. (2014). A mid-term analysis of progress toward international biodiversity targets. Science 346, 241–244.
van Strien, A. J., Meyling, A. W. G., Herder, J. E., Hollander, H., Kalkman, V. J., Poot, M. J. M., et al. (2016). Modest recovery of biodiversity in a western European country: the Living Planet Index for the Netherlands. Biol. Conserv. 200, 44–50. doi: 10.1016/j.biocon.2016.05.031
van Strien, A. J., van Swaay, C. A. M., and Termaat, T. (2013). Opportunistic citizen science data of animal species produce reliable estimates of distribution trends if analysed with occupancy models. J. Appl. Ecol. 50, 1450–1458.
Walker, J., and Taylor, P. D. (2017). Using eBird data to model population change of migratory bird species. Avian Conserv. Ecol. 12, 24.
Keywords: environmental policies, sound decision-making, species monitoring, species population trends, structured long-term monitoring data, threatened species, value of big data for conservation
Citation: Bayraktarov E, Ehmke G, O'Connor J, Burns EL, Nguyen HA, McRae L, Possingham HP and Lindenmayer DB (2019) Do Big Unstructured Biodiversity Data Mean More Knowledge? Front. Ecol. Evol. 6:239. doi: 10.3389/fevo.2018.00239
Received: 21 September 2018; Accepted: 27 December 2018;
Published: 24 January 2019.
Edited by:
Laurentiu Rozylowicz, University of Bucharest, RomaniaReviewed by:
William Ernest Magnusson, National Institute of Amazonian Research, BrazilLuca Santini, Radboud University Nijmegen, Netherlands
Copyright © 2019 Bayraktarov, Ehmke, O'Connor, Burns, Nguyen, McRae, Possingham and Lindenmayer. This is an open-access article distributed under the terms of the Creative Commons Attribution License (CC BY). The use, distribution or reproduction in other forums is permitted, provided the original author(s) and the copyright owner(s) are credited and that the original publication in this journal is cited, in accordance with accepted academic practice. No use, distribution or reproduction is permitted which does not comply with these terms.
*Correspondence: Elisa Bayraktarov, ZS5iYXlyYWt0YXJvdkB1cS5lZHUuYXU=