 Erik Kleyheeg1*†
 Wolfgang Fiedler1
 Kamran Safi1
 Jonas Waldenström2
 Martin Wikelski1
 Mariëlle Liduine van Toor2†
- 1Department of Migration and Immuno-Ecology, Max Planck Institute for Ornithology, Radolfzell am Bodensee, Germany
- 2Centre for Ecology and Evolution in Microbial Model Systems, Linnaeus University, Kalmar, Sweden
Long-distance seed dispersal is an important ecosystem service provided by migratory animals. Plants inhabiting discrete habitats, like lakes and wetlands, experience dispersal limitation, and rely heavily on zoochory for their spatial population dynamics. Granivorous waterbirds may disperse viable seeds of wetland plants over long distances during migration. The limited knowledge of waterbird migration has long hampered the evaluation of the importance of waterbirds in seed dispersal, requiring key metrics such as realistic dispersal distances. Using recent GPS tracking of mallards during spring migration, we built a mechanistic seed dispersal model to estimate realistic dispersal distances. Mallards are abundant, partially migratory ducks known to consume seeds of >300 European plant species. Based on the tracking data, we informed a mallard migration simulator to obtain a probabilistic spring migration model for the mallard population wintering at Lake Constance in Southern Germany. We combined the spring migration model with seed retention curves to develop seed dispersal kernels. We also assessed the effects of pre-migratory fasting and the availability of suitable deposition habitats for aquatic and wetland plants. Our results show that mallards at Lake Constance can disperse seeds in the northeastern direction over median distances of 293 and 413 km for seeds with short and long retention times, respectively, assuming a departure immediately after foraging. Pre-migratory fasting strongly affected the dispersal potential, with only 1–7% of ingested seeds left for dispersal after fasting for 12 h. Availability of a suitable deposition habitat was generally <5% along the migratory flyway. The high probability of seed deposition in a freshwater habitat during the first stopover, after the mallards completed the first migratory flight, makes successful dispersal most likely to happen at 204–322 km from Lake Constance. We concluded that the directed long-distance dispersal of plant seeds, realized by mallards on spring migration, may contribute significantly to large scale spatial plant population dynamics, including range expansion in response to shifting temperature and rainfall patterns under global warming. Our dispersal model is the first to incorporate detailed behavior of migratory waterbirds and can be readily adjusted to include other vector species when tracking data are available.
Introduction
Facilitation of long-distance seed dispersal is considered one of the many important ecosystem services provided by migratory animals across the globe (Bauer and Hoye, 2014; Green and Elmberg, 2014). Plant seeds may stick to the outside of animals (epi- or ectozoochory) or may be retained inside the digestive system (endozoochory) while these animals undertake their migrations (Costa et al., 2014; Albert et al., 2015; van Leeuwen, 2018). The distances covered by animal vectors often far exceed the dispersal distances of seeds transported by abiotic vectors (Vittoz and Engler, 2007). If seeds remain attached to an animal long enough to be transported over at least part of the migratory journey, they may be shed or excreted at locations hundreds of kilometers away from their origin (Nathan et al., 2008; Viana et al., 2016). Thereby, migratory animals do not only help seeds to avoid kin competition, high pathogen loads, and predation pressure near the parent population, they also allow them to colonize newly available habitat, thereby contributing to the spatial population dynamics of plants (Nathan et al., 2008). Moreover, animal migrations are characterized by strong directionality, resulting in non-random or directed seed dispersal by sequentially visiting similar habitat types along the migratory trajectory (Nathan and Muller-Landau, 2000). With anthropogenic and climatic pressures on plant populations building up in recent decades, a thorough understanding of the mechanisms underlying long-distance zoochorous dispersal can help prioritize conservation and management measures (Bauer and Hoye, 2014; Viana, 2017).
Due to their limited dispersal capacity, plants growing in fragmented or isolated habitats with low inter-patch connectivity are particularly sensitive to environmental changes (Pimm and Raven, 2000). Freshwater aquatic and riparian plants are classic examples of plants with a preference for an inherently discrete habitat. Many of these species are typically dispersed by water (hydrochory; Kleyer et al., 2008), making it challenging to reach other catchments or unconnected water bodies. However, in recent decades it has become increasingly evident that zoochory, and especially endo-zoochory (Figuerola and Green, 2002; van Leeuwen et al., 2012a) by waterbirds plays a key role in the long-distance dispersal of plants growing in a freshwater habitat (hereafter “wetland plants”; Amezaga et al., 2002; Santamaría, 2002). Many waterbird species are involved in endozoochory, including ducks, coots, waders, and gulls, of which individual birds may consume large quantities of seeds of a wide range of species (Figuerola and Green, 2002; Soons et al., 2016). While most seeds are destroyed and digested in the process, a proportion of seeds typically pass the digestive tract unharmed and remain viable (Figuerola and Green, 2002; van Leeuwen et al., 2012a). Given that many waterbirds in temperate and (sub)arctic regions are migratory, their seed consumption probably results in large-scale long-distance dispersal of wetland plants.
To understand the spatial population dynamics of wetland plants, it is important to estimate the scale and potential distances of waterbird-facilitated dispersal. Yet, field observations of long-distance dispersal by waterbirds are lacking due to practical challenges regarding seed collection from birds with a known movement history as well as determining the origin of the seeds. For this reason, mechanistic models are being used to estimate dispersal distances. Essentially, these models combine information on the digestive tract passage of seeds with information on bird movements. Gut retention time, the time between seed ingestion and excretion, can be identified in feeding experiments with captive birds (e.g., Charalambidou et al., 2005; Soons et al., 2008; van Leeuwen et al., 2012a for waterbirds) and linked to the movement of a bird in the field. Although increasing, the amount and detail of information on long-distance movements of waterbirds is still limited. Most previous studies have estimated long-distance dispersal by migratory birds mainly by multiplying retention time distributions with the known flight speed of a bird (Charalambidou et al., 2005; Soons et al., 2008; Kleyheeg et al., 2015). This provides maximum dispersal distances based on the assumption of unidirectional flight at a constant speed, initiated directly after seed ingestion. It is well-recognized that these are unrealistic assumptions for at least three reasons: (1) migratory movements are unlikely uninterrupted or in a straight line; (2) birds may not depart immediately after seed ingestion; and (3) seeds deposited during flight may not end up in a suitable habitat, leading to unsuccessful dispersal (Clausen et al., 2002).
Viana et al. (2013a,b) obtained more realistic estimates of migration speed and dispersal distances by using ring recovery data within one or a few days after ringing. Major limitations of this approach, however, are that the number of useful records is very low, information on bird behavior in the period between ringing and recovery is still lacking, and the temporal resolution is typically too coarse to match the process of endozoochory (seed retention times are in the order of hours rather than days; van Leeuwen et al., 2012a). Recent advances in the tracking of birds, using high-tech tracking devices such as GPS transmitters, removes most of the uncertainties about bird movement at scales relevant for endozoochorous dispersal. Movements of individual waterbirds recorded at a high spatial and temporal resolution have already been implemented in a mechanistic model for seed dispersal outside the migratory period (Kleyheeg et al., 2017a). However, due to the limited availability of high-resolution tracks of migrating waterbirds, it remains challenging to estimate seed dispersal distances resulting from their migratory movements.
Here, we present a novel approach to estimate realistic dispersal distances of seeds transported by mallards (Anas platyrhynchos) on spring migration. We used a set of GPS tracks of migrating mallards, combined with ring recovery data from the same population to inform a mallard migration simulation model with properties of the empirical migration trajectories, such as step lengths, turning angles, and timing of stopovers. This model allowed us to generate a large number of spring migration trajectories expected for the study population of mallards, which we converted into a spatially explicit probability map of mallard passage over time. We matched these predictions of mallard migrations with previously identified seed retention time curves, representative of small and large seeds, to model dispersal distances. To facilitate application of this novel approach to other systems of long-distance zoochorous dispersal, we present a detailed step-by-step description of the modeling procedure including R code in the Supplementary Material (Data sheets 1, 2).
We based our estimates of seed dispersal distances on the behavior of spring-migrating mallards, which typically follow a stepping stone migration strategy with migratory flights intermitted by staging at stopover locations (Krementz et al., 2011). Conceptually we distinguished between three relevant phases of mallard migration, each with implications for seed dispersal (Figure 1). Chiefly, the three phases were: the first migratory flight (phase I), the first stopover (phase II), and the second migratory flight (phase III). Note that phase I can be the first migratory flight after leaving the wintering site, or the first flight after stopping over at any location along the migratory journey. We expected that the time allocation of mallards into these different phases has major implications for seed dispersal, as the duration of phase I probably determines the dispersal distance of the majority of seeds, phase II provides an opportunity for seeds of aquatic and wetland plants to end up in a suitable habitat for germination and establishment, and those seeds that are retained until phase III are able to achieve extremely long dispersal distances. We further extended our mechanistic dispersal model to explore the effect of pre-migratory fasting (or departure lag time; Viana et al., 2013a) on the realized dispersal distances and explicitly accounted for availability of a suitable habitat to estimate the impact of stopover behavior on the probability of effective (successful) dispersal.
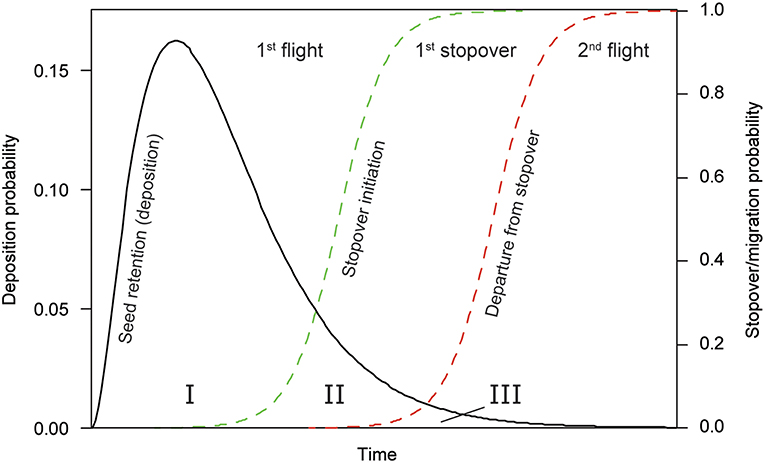
Figure 1. Conceptual graph of seed dispersal during the migratory flight of a mallard. The seed retention time determines the excretion and therefore deposition probability, starting at t0 for seeds consumed just prior to departure. Seeds are deposited during the first migratory flight (phase I), the first stopover (phase II) or during the second migratory flight (phase III). The probability of arriving at (green dotted line) or departing from a stopover (red dotted line) is a function of time.
Methods
Study System
We used GPS tracking data from mallards wintering at Lake Constance on the border between Germany, Switzerland, and Austria as the basis for this study. Mallards are abundant across the Northern hemisphere and have a winter diet of mainly seeds and other plant material (del Hoyo et al., 1992). A review of mallard diet studies revealed that they consume seeds of more than 300 different plant species in Europe alone (Soons et al., 2016). The mallard's digestive strategy is to maintain the throughput of large amounts of food rather than investing in the digestion of all food items, allowing many hard parts to rapidly pass the digestive tract unharmed (van Leeuwen et al., 2012a). Mallards are therefore considered a key seed dispersal vector in freshwater habitats of temperate regions (Kleyheeg et al., 2017a; Bartel et al., 2018). In the Lake Constance region, mallards are among the most numerous wintering waterbird species with numbers up to ~15,000 individuals in December and January. A large proportion of mallards in the Lake Constance region are resident year-round, while a smaller proportion migrates over short to long distances (Werner et al., 2018).
We used the GPS tracking data of mallard spring migration from Lake Constance, to inform our mallard migration simulator. We extracted the data from Movebank.org (LifeTrack Ducks Lake Constance, Movebank ID 236953686). The entire tracking dataset included 51 individual mallards, but the vast majority of them were year-round residents. We used the tracks of eight mallards leaving the Lake Constance region on spring migration in a northern to eastern direction between March 08 and May 20, 2018. During the migratory period, the data for these eight individuals amounted to 36,331 relocations in total. These birds migrated toward locations in Germany, Austria, Czech Republic, Belarus, and Lithuania (Figure 2). Tracking data were collected by 25 g GPS-GSM transmitters with an elevated solar panel (OrniTrack E25 from Ornitela) that were mounted on the mallards' back using a Teflon ribbon harness as described by Roshier and Asmus (2009). As long as mallards stayed within a geofence around their wintering sites at Lake Constance (lat/lon coordinates NW corner: 47.78, 8.85; SE corner: 47.63, 9.16), the tags were programmed to record GPS-fixes with a 1-h interval. As soon as ducks left the geofenced area for migration, the tags instead recorded a burst of 15 fixes with a 1 Hz frequency at the same sampling interval. Trapping and GPS tracking of mallards was licensed by Regierungspräsidium Freiburg under registration number G-13/28.
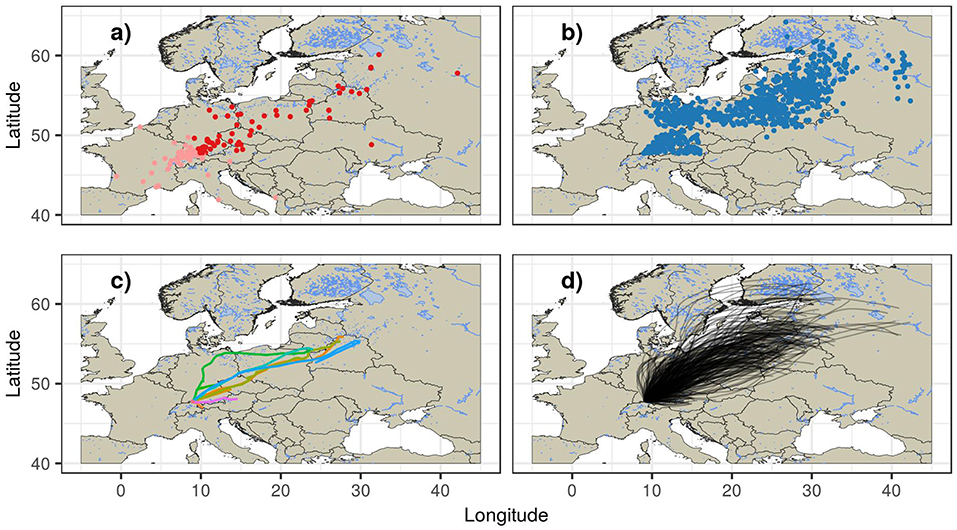
Figure 2. Migration of mallards from the Lake Constance region based on empirical and simulated ring recoveries and migration trajectories. Panel (a) shows empirical ring recoveries with those relevant for spring migration in dark red, (b) shows 1,000 simulated destination locations for spring migrating mallards, (c) shows the empirical spring migration routes of mallards equipped with a GPS-GSM transmitter, and (d) shows 500 simulated spring migration trajectories.
Mallard Migration Simulation
To obtain a general pattern of mallard spring migration from the Lake Constance region, we simulated a total of 50,000 mallard migrations using the empirical Random Trajectory Generator (eRTG; Technitis et al., 2016) in the R environment (R Core Team, 2018). This algorithm simulates the movement between two pre-defined locations with a fixed number of steps, based on a dynamic drift derived from a step-wise joint probability surface. The process is attracted to the destination location, and the strength of attraction is modulated by the time left to reach the target. The eRTG is thus similar to a biased correlated random walk and can be best described as a mean-reverting Ornstein-Uhlenbeck process (Smouse et al., 2010). One main advantage of the eRTG over traditional random trajectory generators is that the trajectories it simulates retain the geometric characteristics of the empirical tracking data, as it relies entirely on empirical distribution functions. Consequently, if a destination cannot be reached within the realms of the empirical distributions derived from the movement data, the simulation fails rather than forcing the last step toward the destination.
Simulating migratory trajectories of mallards using the eRTG requires: (i) empirical estimates of movement parameters (step length, turning angles, their autocorrelation at a lag of one step, and the covariance of step length and tuning angle) with a relevant sampling interval; and (ii) destination locations representing realistic breeding locations of mallards wintering at Lake Constance.
Empirical Distributions for Step Length and Turning Angles
We first classified the mallard GPS tracking data with movement behavior using Hidden Markov models (HMMs) to derive empirical distributions of step lengths and turning angles for different states of movement behavior (i.e., migratory or local movements). We identified the behavioral state of each location using the R-package momentuHMM (version 1.4.2; McClintock and Michelot, 2018). HMMs expect regularly sampled data, so we initially calculated the average ground speed recorded in each burst, and then reduced the 15-s GPS-bursts to single locations (retaining only the first location of each burst), and included missed fixes in the dataset, which occur when scheduled sampling does not take place, e.g., when the tag fails to find a GPS-signal. We further filtered the tracking data to only retain the migratory individuals during the migratory period. This filtered dataset contained a total of 8,817 locations at a sampling interval of 1 h. Missed fixes accounted for about 5% of the data (471 out of the final 8,817 relocations).
We applied a 3-state HMM with three data streams; specifically, the average ground speed of each burst (GPS-derived speed), step length (geodesic distances), and turning angle between subsequent locations. After visual inspection of the distribution of the data streams and exploratory runs using HMMs, we decided to assume a Gamma distribution for ground speed, a Weibull distribution for step length, and a wrapped Cauchy distribution for turning angles. The three states that were distinguished represent “resting” behavior, “local movement,” and “flight.” We listed the details for the final HMM, and the parameters estimated for the models for all three states in the Supplementary Material (Data sheet 2). The decision for the final model was informed by visual exploration and an AIC-guided model selection on an initial set of alternative HMMs with two, three, and four states, and different starting parameters and distributions for the different data streams. In the final HMM, we additionally included time of day as a predictor for state transitions. We calculated the time of day as fractional hours relative to the solar noon at the respective locations in the tracking dataset using the R-package maptools (version 0.9.2; Bivand and Lewin-Koh, 2017).
We applied the Viterbi-algorithm, an efficient algorithm to determine the most likely sequence of states provided in the momentuHMM package and the final HMM to annotate the locations of mallard migration trajectories with their corresponding state. For the subsequent calculations of step lengths and turning angles, we only used the locations classified as “flight.” To inform our eRTG, subsequently termed Mallard Migration Simulator (MMS), we calculated step lengths, turning angles, the covariance of step lengths and turning angles, as well as their autocorrelation (the difference in step length and turning angles at a lag of one location) for each 15-s GPS-burst in “flight state.” The final sample size for these parameters was n = 535.
This initial set of empirical distributions for the MMS describes mallard flight at a sampling interval of one second. Simulating mallard migrations with this high temporal resolution is however computationally demanding, and thus we decided to thin the MMS for a 300 s interval. To maintain realistic distributions of the movement parameters at this reduced sampling interval, we simulated a long unconditional trajectory with 3,000,000 steps using the sampling interval of 1 s. We subsequently thinned this long simulated trajectory to a sampling rate of 300 s, and calculated the step lengths, turning angles, the autocorrelation of both step lengths, and turning angles at a lag of one step, and the covariance of step lengths and turning angles for the new sampling rate (see also van Toor et al., 2018a).
Sampling Destinations for Simulated Mallard Migrations
We used ring recoveries of mallards to derive a sampling tool for destination locations for the migration simulations (Figures 2a,b). A total of 696 ring recoveries from 494 individuals were available to us. The dataset contained data for mallards ringed between 1934 and 2016, and recoveries recorded between 1934 and 2017. We filtered the pairs of ringing and recovery events so the dataset would only contain individuals (i) ringed at a location within 50 km distance from Lake Constance, and recovered at a distance > 50 km from Lake Constance, (ii) recoveries that were made within a year from the marking of the individual, and (iii) recoveries made between January and June to represent spring migratory movements. This restrictive filtering reduced the initial dataset to 28 ring recoveries. We supplemented these recoveries with locations from the migratory individuals in the tracking dataset, using only the location farthest away from Lake Constance for each individual. This supplemented dataset contained an additional eight destination locations, and thus 36 destination locations in total. Subsequently, we computed the distance (geodesic distance, in meters), and bearing (initial great circle bearing) between the ringing location and the recovery location. We then further restricted the recoveries to the supposed spring migratory flyway for these mallards, retaining only recoveries with a bearing between 0 and 90 degrees from Lake Constance, representing a north to east migratory direction (final sample size of 30 observations).
Our sampling tool for destination locations consisted of a 2D-kernel density estimator with bearing from Lake Constance on the x-axis, and distance to Lake Constance on the y-axis. We first determined the optimum kernel bandwidth, a parameter determining smoothness of the resulting estimate, for both bearing and distance using cross-validation (R-package sm, version 2.2–5.5; Bowman and Azzalini, 2014), which suggested a bandwidth of 19.32° for bearing, and 366.70 km for distance. We then computed the 2D-kernel density estimator using the suggested bandwidths with a resolution of 1 degree for bearing, and a resolution of 2.5 km for distance from the start location. We used this tool by sampling a unique bearing and distance from Lake Constance and calculated the corresponding location in space from the starting location using Great Circle methods.
Simulating Mallard Migrations
Using the MMS, we simulated spring migration trajectories for mallards from Lake Constance (Figures 2c,d). We chose a shallow bay in the Lower Lake, the Markelfinger Winkel, as the starting location for each simulation (47.766931° N, 8.996157° E). We limited the simulations to this departure location for two reasons: firstly, because migration routes may vary with geography and the characteristics of the migratory trajectories are therefore likely different in other regions, and secondly because the ring recoveries we used provided destination locations specifically for mallards wintering at this site. We sampled destination locations for each simulation using the destination sampling tool described above. Next, we needed to determine the number of steps available for the simulated duck to reach its destination. This parameter determines how strongly the simulation is pulled to the target destination, and thus affects the ratio between total migration distance to displacement distance from the starting location. To pick a number of available steps that captured the ratio between migratory distance and migration duration observed in the tracking data we first divided the geographic distance between start and destination by the average step length represented in the MMS (6647.89 m per 300 s). However, it was evident from the tracking data that duck trajectories deviate from a straight line between start and destination, and so we determined the ratio between time spent on migration and migratory distance in the tracking data by calculating the distance between consecutive locations in mallard migratory flights and the expected flight time based on the average flight speed in the MMS. We used these metrics to calculate the ratio between observed and expected flight speed. We found that this mallard flight time, relative to expected flight time, followed a normal distribution with a mean of 0.982 and a standard deviation of 0.154. For each simulation, we randomly sampled a ratio for observed/expected flight time from the normal distribution and multiplied the number of steps with the sampled ratio to derive the number of steps available for the simulation.
We simulated 50,000 migratory simulations using the MMS ignoring potential stopovers along the way in this step, but accounting for staging behavior of migratory mallards during the seed dispersal simulations.
Stopover Probability and Stopover Duration
We determined stopover periods from the tracking data to be able to account for the use of suitable staging locations by mallards during migration. We first determined the minimum expected flight speed from the HMM. We calculated the 0.1—percentile of the Gamma distribution for ground speed in the migratory state, corresponding to 4.36 m/s, or 15.68 km/h. Using this cut-off value for flight speed, we excluded every individual that had not moved at least 50 km from the location of deployment and retained only locations associated with a ground speed smaller than the minimum expected flight speed. We then applied a fuzzy clustering on the spatial location for each individual (R-package cluster, version 2.0.7–1; Maechler et al., 2018), assuming that locations collected during stopover periods would be clumped in space. First, we applied the clustering with the number of suggested clusters, or stopovers, ranging from 2 to 10. We then chose the optimal number of clusters based on the cluster silhouettes (Rousseeuw, 1987). The width of cluster silhouettes is an indication of separation between points in a cluster and can range from −1 (indicating that samples might be allocated to the wrong cluster) to +1 (samples are far away from neighboring clusters). The median silhouette width for the clustering applied in this study ranged from 0.87 to >0.99 for the different individuals.
We computed the centroid location for each stopover and calculated the geodesic distance between the deployment location and the first stopover location, as well as the geodesic distance between subsequent stopover locations. We used these distances to inform an empirical cumulative density function (n = 27), reflecting the probability of a migratory duck making the decision to end the leap of migration as a function of distance from the starting location. Similarly, we determined the duration of stopovers (in hours) and used these estimates to inform an empirical cumulative density function (n = 27) reflecting the proportion of ducks remaining at the stopover site as a function of time since beginning of the staging period (Figure 3).
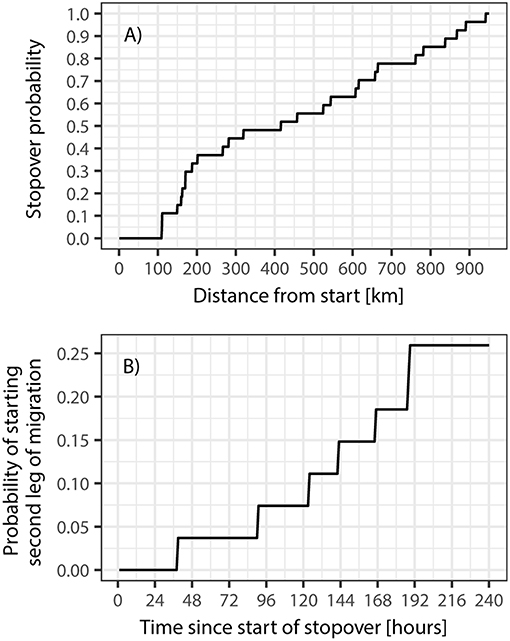
Figure 3. Stopover probability over time for mallards on spring migration from the Lake Constance region (A) and probability of starting a second leg of migration as a function of time since arriving at the stopover (B). Note that the y-axis of the latter does not reach 1 due to the very long stopover times for most mallards (exceeding 240 h). Furthermore, it should be noted that not every individual will embark on a second, or even third, leg of migration.
Seed Retention Parameters
We used gut retention time curves of seeds passing the digestive tract of mallards from a previous study by Kleyheeg et al. (2017a) to model the dispersal distances of mallard-dispersed seeds. The retention curves for different plant species were assumed to follow a Gamma distribution with a constant shape parameter (k = 2.7) and a rate parameter that depends on seed volume following a logarithmic function. This indicates that larger seeds typically have longer retention times than smaller seeds, with the survival rate of small seeds being generally higher (Soons et al., 2008). Here, we compared dispersal under a short retention time (small seeds) scenario and a long retention time (large seeds) scenario. The size of seeds consumed by mallards ranges from <0.001 to >1,000 mm3, but typically lies around 1–10 mm3 (Soons et al., 2016). For our two scenarios, we selected a seed volume of 0.2 and 20 mm3, corresponding to a rate parameter of 0.63 (short retention time) and 0.44 (long retention time), respectively (Kleyheeg et al., 2017a).
Seed Deposition Habitat
We assessed the availability of wetlands in the mallard migration corridor to estimate the probability of seed dispersal into wetlands. We used the Global Lakes and Wetlands Database (GLWD; Lehner and Döll, 2004) to calculate the availability of wetlands. The GLWD contains worldwide information for 3,067 lakes with a surface area > 50 km2 and 654 reservoirs with a storage capacity > 0.5 km3, as well as detailed data on permanent open water bodies with a surface area > 0.1 km2. First, we computed a circle with a radius equivalent to the maximum expected dispersal distance dmax around the migration starting location. We calculated dmax as the maximum observed distance in the simulated migratory trajectories for an excretion probability greater than zero (from the gut retention curves) and a stopover probability smaller than 1, assuming long retention time scenario with no fasting. This resulted in a dmax of 941 km, which we rounded to a circle radius of 950 km. This distance corresponds to the 98.5%-percentile of migratory distances in the ring recovery data set. We then computed circular sectors between 0 and 90 deg, representing the migratory corridor, in 5-degree increments, and subdivided the circular sectors at 50 km increments from the starting location.
We then computed the total wetland area (including lakes, large reservoirs, and permanent open waterbodies) in each of these segments of the circular sectors (hereafter called annulus section). We subsequently calculated the proportion of wetland area per annulus section by dividing the wetland area by the area of the annulus section.
Effective Seed Dispersal Kernels
Finally, we combined the gut retention curves with pre-migratory fasting and staging behavior to determine general dispersal kernels for mallard migration, and added wetland availability to determine a specific dispersal kernel describing the probability of seeds being dispersed from Lake Constance to a potentially suitable habitat. For every location in a simulated trajectory, we calculated the geodesic distance from the starting location, hereafter d, and the time since start of migration, hereafter t. We then defined the stopover probability, derived from the empirical cumulative density function described above, as σ(d). The inverse of σ(d), 1-σ(d), consequently defines the probability of individuals being migratory for the same d. We first defined the proportion of seeds excreted during spring migration (ψtot), and not on the wintering site, as a function of the duration of pre-migratory fasting (f) using the gut retention curve for the respective seed size:
which is composed of the proportion of seeds excreted during migratory flight (ψm) and the proportion of seeds excreted at stopover sites (ψs):
We could calculate ψm directly for each simulated trajectory. We defined the probability of a seed being dispersed over any distance d at time τ by a migratory individual, γm, with τ = t + f, as:
By calculating the cumulative sum for all γm(τ, d) along a simulated trajectory, we obtained the proportion of seeds dispersed during flight:
Similarly, the probability of a seed being dispersed over any distance d at time τ by a staging individual, γs, can be calculated as:
Because the staging duration observed in the spring migration trajectories was ≥ the duration for which gut retention was estimated, we integrated excretion probability for the entire curve > τ. This however leads to dispersal probabilities along a trajectory with a total sum > 1 for γs. We corrected for this using the total proportion of seeds dispersed at stopover sites, which we determined as:
We thus normalized γs, resulting in γ's, using:
which ensures that .
Finally, we combined γm(τ, d) with γ's(τ, d) to determine the probability of a seed being dispersed from the starting location during both migratory flight and staging as:
We further calculated the probability of seeds being dispersed into a suitable wetland habitat, again accounting for migratory and staging behavior. It was previously shown that during stopover, mallards spend about 95% of their time in wetland areas, and consequently the probability of seeds being dispersed into a suitable habitat during stopover is high (Jorde et al., 1984; Sauter et al., 2012; Kleyheeg et al., 2017b). During migration, however, the probability of a seed to be excreted above a suitable habitat is dependent on the availability of wetlands. Therefore, we defined the probability of seed excretion in a wetland as a function of mallard behavior, with the probability of a duck being in a wetland during stopover being βs = 0.95. The probability of flying over a wetland during migration, in turn, was defined as βm(d) = u(d), where u is the average area percentage of wetlands of all annulus sections corresponding to d, weighted by the proportion of simulated tracks passing through the corresponding annulus section. Finally, we defined the probability of successful dispersal, i.e., the probability of a seed being dispersed into a potentially suitable wetland habitat, during mallard spring migration Γtot, wdas:
We computed Γtot and Γtot, wd for both the small and large seed scenario, and for three different fasting durations (f = {0, 1, 12 h}), for all simulated trajectories.
Results
Seed Dispersal Shadows
We initially considered the simplest case by describing the probability of a seed being dispersed by a migrating mallard over a certain distance. For this scenario, we assumed that mallards fly non-stop (without staging at stopover locations), do not undergo pre-migratory fasting, and that dispersal occurs at every location with a non-zero excretion probability. We then calculated the time after which 50 and 99% of the seeds had passed through the gut and calculated the mean geodesic distance from the corresponding location in the simulated tracks to the starting location (rounded down to the closest 5 min). We found that the resulting mean dispersal distance for small seeds was 294 km at the time that 50% of seeds had passed through the guts, and 970 km after 99% of seeds had passed through the gut. For large seeds, the mean expected dispersal distance was 417 km after 50% of seeds passed through the gut, and 1,369 km after 99% of the seeds had passed. These results are summarized in Figure 4, which additionally shows the density of simulated trajectories.
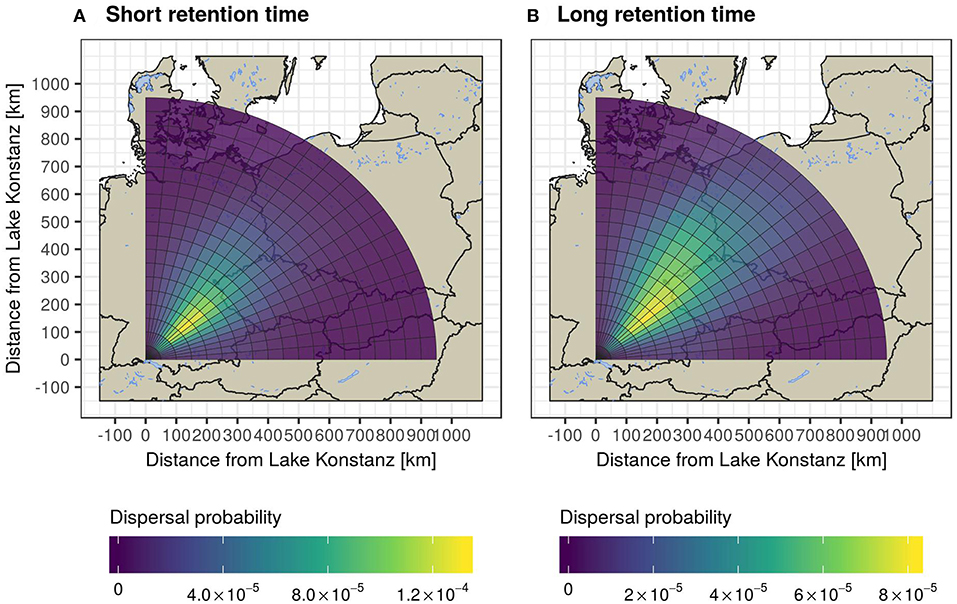
Figure 4. Seed dispersal shadows for short (a) and long (b) retention time scenarios, resulting from endozoochorous dispersal of mallards on spring migration from the Lake Constance region. In this figure, mallards are assumed to ingest seeds just before departing on migration and to not use stopovers. Here, seed dispersal probability represents the product of excretion probability as suggested by gut retention curves and the proportion of simulated mallards passing through a given annulus section.
When correcting expected distances of the first migration leg for the mallards' stopover behavior, we found that the dispersal distances became substantially shorter. After accounting for the increasing probability of stopovers with increasing migratory distance, a mean distance of 254 km from the starting location would be expected after a passage of 50% of seeds (99% of seeds: 382 km) for small seeds. For large seeds with a longer retention time, 50% of the seeds were expected to have passed after ducks covered a mean distance of 332 km (99% of seeds: 379 km).
In the subsequent paragraphs, we extend from this simple scenario by accounting for the effects of pre-migratory fasting, the availability of suitable wetland habitat along the main migratory corridor and consider the time spent at the first stopover.
Pre-migratory Fasting
As dispersal distance is a function of time since the ingestion of seeds, pre-migratory fasting strongly affects the expected seed dispersal distances, and the overall probability of dispersal events (Figure 5). We found that every hour of fasting reduced the expected median dispersal distance of small seeds by about 78 km for both small and large seeds. Consequently, whereas the median dispersal distance without accounting for fasting was about 294 km, a fasting duration of 1 h will result in a median dispersal distance of 215 km (99th percentile: 893 km), whereas a fasting duration of 12 h will result in a median dispersal distance of 0 km (99th percentile: 39 km). For large seeds, the corresponding median dispersal distance accounting for 1 h of fasting was 339 km (99th percentile: 1,296 km), and 0 km for 12 h of fasting (99th percentile: 462 km).
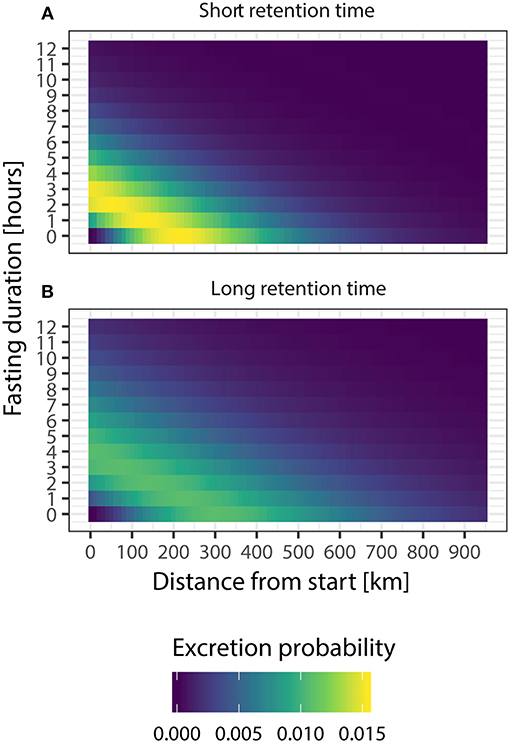
Figure 5. The effect of the duration of pre-migratory fasting on seed dispersal kernels, expressed as the excretion probability over distance from the departure location, for the short (a) and long (b) retention time scenarios. Note that the probability of seeds to be dispersed away from the location where they are consumed drops to close to 0 if mallards would stop foraging 12 h prior to departure. In this figure, mallards are assumed to fly to their destination without using stopovers.
Dispersal Into Wetlands
The availability of wetlands along the migratory flyway for mallards departing from Lake Constance is generally low (Figure 6). The highest proportion of wetlands is found in the northeast of Germany, where a large lake and canal region known as the Mecklenburg Lake Plateau is located. Other areas with above-average wetland availability are located in Southern Bavaria, Germany (e.g., Lake Ammer, Lake Starnberg, and Lake Chiem), Lake Neusiedl in eastern Austria, and North-West Poland. However, with a maximum area percentage of wetlands below 10%, the probability of a seed ending up in a suitable habitat after excretion by a mallard in migratory flight was low.
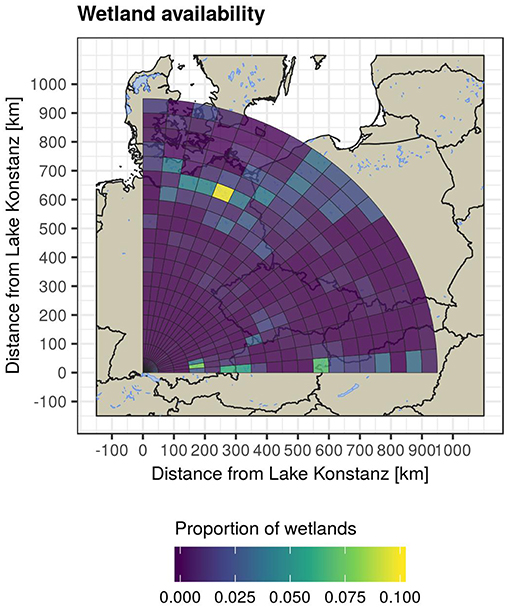
Figure 6. Wetland availability within the reach of mallard spring migration from Lake Constance, expressed as the area-percentage of freshwater habitat within each annulus section. Note that the availability of wetlands is generally low, making it unlikely for seeds to end up in wetland habitat when excreted during the mallard migratory flight.
Effective Dispersal Kernels
Finally, we combined the gut retention curves, simulated mallard migration trajectories and detailed stopover behavior (Figures 7a,b), for which we specifically accounted for seed excretion at stopover locations. We found that in the absence of migratory fasting, 50% of small seeds would be transported over distances up to 293 km (99%: 675 km), and large seeds over distances up to 413 km (99%: 675 km). If ducks fasted for 1 h before migration, these distances are reduced to 215 km (99%: 675 km) for small seeds, and 338 km (99%: 675 km) for large seeds. A fasting duration of 12 h led to expected distances of 0 km (99%: 40 km) for small seeds, and 0 km (99%: 457 km) for large seeds.
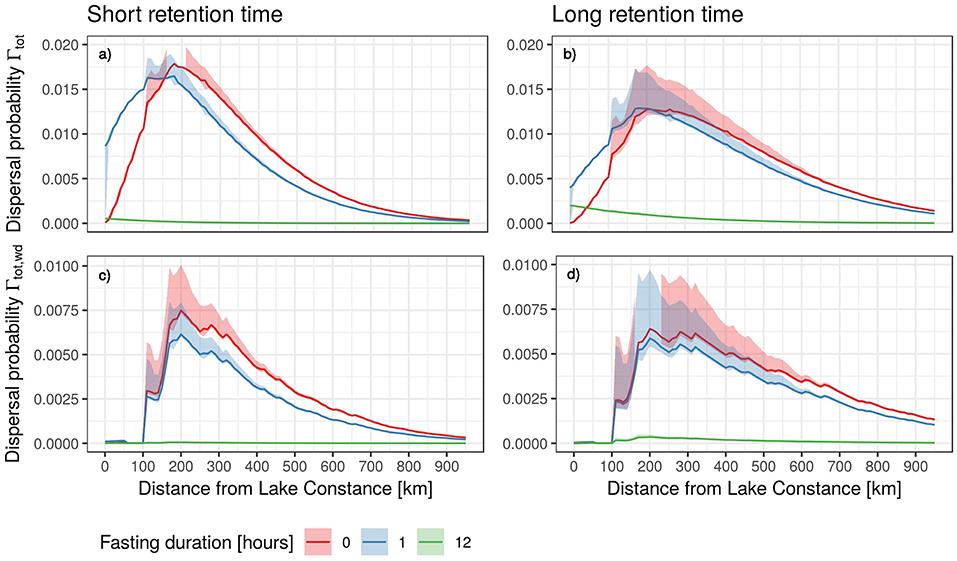
Figure 7. Effective seed dispersal kernels accounting for staging behavior. The upper panels show Γtot as a function of distance from Lake Constance for the short (a) and long (b) retention time scenarios. Lower panels show dispersal into suitable wetland habitat (Γtot, wd) for the short (a) and long (b) retention time scenarios. Line color shows dispersal kernels for different fasting durations. Note the different scaling of the y-axes of the lower panels.
However, these dispersal distances did not match the distances of peak dispersal probability (Figures 7a,b). Consequently, we calculated the distances over which the dispersal of seeds is most likely to occur. We found that for small seeds, the dispersal probability peaked at a distance of 203 km in the absence of fasting (1 h of fasting: 173 km; 12 h of fasting: 7 km). Large seeds were most likely transported over distances of 284 km (no fasting), 158 km (1 h of fasting), and 7 km (12 h of fasting).
Inversely, we also estimated the proportion of seeds ingested at the wintering site that are expected to be dispersed farther than 50 km from the site of ingestion. We found that 98.8% of all small seeds ingested prior to migration would be dispersed >50 km in the case of no pre-migratory fasting (fasting duration of 1 h: 88.2%, fasting duration of 12 h: 1.0%). For large seeds, we estimated that approximately 99.5% of the seeds would be transported over distances exceeding 50 km if ducks did not fast prior to migration (fasting duration of 1 h: 94.5%, fasting duration of 12 h: 6.3%). The proportion of seeds transported over distances > 50 km that also end up in a potentially suitable wetland habitat was much smaller. For small seeds, we estimated that 39.9% would be dispersed into wetlands in the no-fasting scenario (fasting duration of 1 h: 30.3%, fasting duration of 12 h: 0.2%), whereas for large seeds, this estimate was 52.3% in the absence of fasting (fasting duration of 1 h: 44.3%, fasting duration of 12 h: 1.9%).
The probabilities of seed dispersal into wetlands, Γtot, wd, were ~ 50–60% lower than the probabilities predicted by Γtot without pre-migratory fasting (Figures 7c,d). Peak dispersal probabilities, however, were at relatively long distances compared to overall dispersal, with an estimated 204 km for small seeds, and 322 km for large seeds. Pre-migratory fasting of 1 h did not affect the peak of dispersal probability. For a longer fasting duration of 12 h, the most likely dispersal distances became only slightly shorter (174 km for small seeds and 282 km for large seeds).
Discussion
The fast movements by migrating birds contribute substantially to the long-distance dispersal and global distribution of plants. We used a novel approach to estimate realistic seed dispersal distances realized by an important dispersal agent on its northbound spring migration. Our mechanistic model shows that mallards wintering in central Europe may commonly disperse seeds over distances of 293–413 km when embarking on spring migration toward Northeast-Europe, with relatively high probabilities of deposition in freshwater habitat after a 204–322 km migratory flight.
Mechanistic Model
The outcome of mechanistic dispersal models critically depends on the realistic parameter estimates of both seed and vector traits. The novel aspect of this study is that we, in contrast to earlier studies, used high-resolution tracking data for implementation of mallard movement in the model described here. Thereby, we considered the tortuous nature of migration trajectories as well as stopover behavior, which both strongly affect the dispersal distances and deposition habitat. Tracking data of mallards and other duck species in Europe are still scarce and in this study, we were able to use only eight GPS tracks, from a total of 51 tagged individuals of this partially migratory population. Although inclusion of more tracks likely would have reduced the confidence intervals around the estimated migration parameter values, the method relies more critically on a high sampling rate within tracks. Moreover, the simulation algorithm we used was designed specifically to overcome the limited availability of empirical tracks by generating trajectories with properties mimicking real trajectories from GPS tracking studies (Technitis et al., 2016), which has been applied successfully in earlier studies (van Toor et al., 2018a,b). It distinguishes itself from other random trajectory generation techniques in its reliance on parameter values from empirical tracking data. The specificity of these parameters by (sub)populations or species does require the availability of detailed tracking data from the animals of interest.
Seed retention curves were obtained from an earlier study and considered representative of relatively small and large seeds passing through the mallard digestive tract (Kleyheeg et al., 2017a). The shape of the retention curve is, however, affected by more seed traits than size alone and looks different for different plant species. Most importantly, seed survival (intact passage) interacts with retention time, whereby resistant seeds are able to survive sustained exposure to digestive processes, resulting in a fatter tail of the retention time distribution and longer dispersal distances (Kleyheeg et al., 2015). Resistance to digestion of seeds within the same size range depends among other factors on seed shape and seed coat traits (Wongsriphuek et al., 2008; Kleyheeg et al., 2018), which should be considered when estimating dispersal distances for specific plant species.
Dispersal Distances
The integration of the detailed movement behavior of the dispersal agent into mechanistic models inevitably yields lower dispersal distance estimates than when assuming continuous unidirectional flight. Previous studies multiplying retention times with mallard flight speed estimated dispersal distances in the range of 300–1,400 km for mallards in North-America (Mueller and van der Valk, 2002), while others reported distances typically around 200 km and rarely exceeding 450 km (Kleyheeg et al., 2015), at least up to 312 km (Farmer et al., 2017), or a vast majority of dispersal events within 350 km (Soons et al., 2008). Viana et al. (2013b) compared these calculations with estimations based on ring recovery data during autumn migration and found median dispersal distances of 21–63 km based on ring recovery data vs. 148–840 km based on average flight speed of mallard and teal (A. crecca). The ring recovery data however did not only include birds on active migration.
Based on our estimates, mean dispersal distances resulting from transportation by migrating mallards after median seed retention times are 293–413 km. This corresponds with the higher range of distances reported by Clausen et al. (2002), who argue in a critical review of waterbird-mediated dispersal that the bulk of seeds will be dispersed over 100–500 km by birds on a long-distance flight. Although overall dispersal probabilities are strongly reduced when only dispersal into wetlands is considered potentially successful, the peaks of dispersal probability are at slightly longer distances for Γtot, wd than for Γtot. Average distances of 204–322 km for a maximum Γtot, wd match or exceed many estimates from mechanistic models assuming continuous flights, even though stopover behavior in wetlands is accounted for in the calculation of these distances. This is likely due to three factors: (1) for mallards departing from Lake Constance, the availability of freshwater habitat is higher at longer distances, (2) seeds are unlikely to end up in freshwater habitat during the migratory flight, i.e., within several hundreds of kilometers from the departure location, and (3) the flight speed of migrating mallards is often higher than the average flight speed used in earlier mechanistic models. Seeds with fat-tailed gut retention curves benefit in particular from these factors. Long dispersal distances are thus caused mainly by very low probabilities of effective dispersal at shorter distances.
Although rare, seeds retained long enough to be transported on a second leap of migration may reach extremely far dispersal distances. In the tracking data used here, the shortest stopover duration was recorded at 38 h, and some individuals never started a second leap of migration. Our analyses were cut off at 48 h, but longer retention times have been recorded in experimental feeding trials. Viable Sparganium emersum seeds were found at the end of a 60 h feeding trial with mallard and teal (Pollux et al., 2005), Scirpus seeds were found in blue-winged teal (A. discors) after 72 h (Swanson and Bartonek, 1970) and a maximum retention time of 93 h was found in mallard for an Eleocharis quadrangulata seed (de Vlaming and Proctor, 1968). It is unclear whether seeds were still viable after >72 h. Due to the long stopovers (Figure 3), the probability of mallards being in a migratory flight 72 h after departure is effectively zero in our study population.
Pre-migratory Fasting
Pre-migratory fasting strongly affects the long-distance dispersal potential of plant seeds. It is poorly known whether waterbirds keep foraging until shortly before embarking on a migratory flight. Some bird species are known to fast before migration and fly with empty digestive tracts to minimize wing loading, while only few examples exist of birds being observed foraging until right before departure (Clausen et al., 2002). According to the mallard tracking data we used, mallards tended to depart on migration at dusk, the same time when mallards normally leave their day roost to fly to nocturnal foraging sites. Although daytime foraging also occurs, mallards forage primarily at night (Bengtsson et al., 2014; Kleyheeg et al., 2017b), suggesting that most food items would have left the digestive tract when mallards start their migratory flight in the evening. With a pre-migratory fasting time of 12 h, 93–99% of ingested seeds would already have been excreted by a mallard before the onset of migration, based on the retention curves used in this study. This drastically reduces the predicted dispersal distances for both small and large seeds. More research is needed to determine whether mallards and other waterbirds use a period of pre-migratory fasting.
Seed Deposition Habitat
Seeds that are in the mallard digestive tract during the initiation of migration are likely excreted during the migratory flight or the first stopover. For aquatic and wetland plants, dispersal is successful only if their seeds are deposited in freshwater habitat, where conditions are suitable for germination and establishment. Seeds deposited during the migratory flight, i.e., those in phase I in Figure 1, have a very low probability of ending up in a wetland. Successful long-distance dispersal is approximately 20 times more likely if seeds are retained until mallards reach their first stopover site (phase II, Figure 1). Mallards typically spend >48 h at a stopover site (Figure 3), making it very unlikely that seeds remain inside the digestive system until the second leap of migration (phase III, Figure 1). To predict where seeds from a source population end up via endozoochorous dispersal, it is therefore critical to consider the first stopover sites for migratory birds departing from the area of interest.
Implications for Spatial Plant Population Dynamics
At the local scale, resident and staging mallards disperse seeds in all directions over distances ranging from a few hundred meters up to several dozens of kilometers, depending on landscape use (Kleyheeg et al., 2017a; Bartel et al., 2018). Both the number of mallards and the number of seeds involved in local scale dispersal are much higher than the numbers involved in dispersal during migration. Yet, mallards on spring migration could contribute disproportionately to large-scale population dynamics, including poleward range expansion of plant populations, for example in response to climate change. Mallard spring migration is typically northward in the Northern Hemisphere and therefore in roughly the same direction as the moving climatic envelopes under global warming. The dispersal distances achieved by spring-migrating mallards far exceeded predicted annual rates of the climate envelope shift between 2,000 and 2,100, averaging 0.42 and 0.22 km y−1 for mean annual temperature and precipitation, respectively (Loarie et al., 2009). This supports the conclusions of Viana (2017), who argued that aquatic plants may be able to keep pace with climate change when they are dispersed by waterfowl. It should be noted, however, that despite the long potential dispersal distances toward a potentially suitable habitat, successful establishment depends on a wide range of biotic and abiotic factors, including inter-specific competition and water chemistry, which may vary strongly from site to site (Peterson et al., 2011).
Priorities for Future Research
An important question that remains is how many seeds of which species remain available and are consumed by mallards by the end of winter, when most seeds produced in summer and fall may be eaten or decomposed. The composition of seed species in the mallard diet was shown to vary considerably throughout the winter season in the Netherlands (Kleyheeg et al., 2016). Only those species still available to mallards in early spring are able to benefit from their northbound spring migration. Since mallards and many other waterbird species forage in the sediment, plant species forming a persistent seed bank may have a relatively high probability of being ingested during spring migration (Green et al., 2002).
A second long-standing question is how does the digestive tract behave during migration? Does increased physical activity speed up gut passage during the migratory flight (van Leeuwen et al., 2012b; Kleyheeg et al., 2015) or does the digestive system shut down during migration, only to pass food items again during a stopover? Either option would have major implications on the dispersal probability over distance. Wind tunnel experiments could shed more light on this.
Finally, as with all mechanistic dispersal models, field validation is required to confirm the dispersal phenomenon and verify the quantitative model outcomes. The large scale of animal-mediated long-distance dispersal and the multitude of other factors interfering with this process make validation in the field exceedingly challenging. Molecular analysis on seeds collected from feces of migrating birds or fecal analysis of birds with GPS tracking devices could provide field evidence for long-distance seed dispersal by waterbirds.
Conclusions
In this study, we developed a novel method to estimate seed dispersal distances via endozoochory in a migratory population of mallards. With the rapidly increasing availability of high-resolution GPS tracks of migratory animals, further applications of our model are numerous. Applications are not limited to the field of seed dispersal by waterbirds, but also for dispersal by other migrating animals, as well as the spread of other organisms, including pathogens. Until the unlikely scenario where significant proportions of migratory animal populations are being tracked, modeling approaches such as described in this study will provide a useful tool for estimating the impact of animal migration on ecological processes. Improved understanding and appreciation of the ecological services provided by the billions of animals that undertake seasonal migrations may help secure the future of this important phenomenon.
Author Contributions
EK and MvT designed the study, performed the analyses and wrote the first version of the manuscript. WF, KS, JW, and MW provided guidance and assisted in the writing. EK and WF collected and administrated the tracking data.
Funding
This project was supported by funding from the Netherlands Organization for Scientific Research under Rubicon grant No 019.162LW.009 and the European Union's Horizon 2020 research and innovation program under grant agreement No 727922 (Delta-Flu).
Conflict of Interest Statement
The authors declare that the research was conducted in the absence of any commercial or financial relationships that could be construed as a potential conflict of interest.
Acknowledgments
We thank Hans-Günther Bauer for kindly providing information on mallard numbers wintering in the Lake Constance region based on monthly waterbird census data.
Supplementary Material
The Supplementary Material for this article can be found online at: https://www.frontiersin.org/articles/10.3389/fevo.2019.00040/full#supplementary-material
References
Albert, A., Auffret, A. G., Cosyns, E., Cousins, S. A., D'hondt, B., Eichberg, C., et al. (2015). Seed dispersal by ungulates as an ecological filter: a trait-based meta-analysis. Oikos 124, 1109–1120. doi: 10.1111/oik.02512
Amezaga, J. M., Santamaría, L., and Green, A. J. (2002). Biotic wetland connectivity—supporting a new approach for wetland policy. Acta Oecol. 23, 213–222. doi: 10.1016/S1146-609X(02)01152-9
Bartel, R. D., Sheppard, J. L., Lovas-Kiss, Á., and Green, A. J. (2018). Endozoochory by mallard in New Zealand: what seeds are dispersed and how far? PeerJ 6:e4811. doi: 10.7717/peerj.4811
Bauer, S., and Hoye, B. J. (2014). Migratory animals couple biodiversity and ecosystem functioning worldwide. Science 344:1242552. doi: 10.1126/science.1242552
Bengtsson, D., Avril, A., Gunnarsson, G., Elmberg, J., Söderquist, P., Norevik, G., et al. (2014). Movements, home-range size and habitat selection of mallards during autumn migration. PLoS ONE 9:e100764. doi: 10.1371/journal.pone.0100764
Bivand, R., and Lewin-Koh, N. (2017). R Package ‘Maptools’: Tools for Reading and Handling Spatial Objects (version 0.9-2). Available online at: https://CRAN.R-project.org/package=maptools.
Bowman, A. W., and Azzalini, A. (2014). R package ‘sm’: Nonparametric Smoothing Methods (version 2.2-5.5). Available online at: http://www.stats.gla.ac.uk/~adrian/sm
Charalambidou, I., Santamaría, L., Jansen, C., and Nolet, B. A. (2005). Digestive plasticity in Mallard ducks modulates dispersal probabilities of aquatic plants and crustaceans. Funct. Ecol. 19, 513–519. doi: 10.1111/j.1365-2435.2005.00998.x
Clausen, P., Nolet, B. A., Fox, A. D., and Klaassen, M. (2002). Long-distance endozoochorous dispersal of submerged macrophyte seeds by migratory waterbirds in northern Europe—a critical review of possibilities and limitations. Acta Oecol. 23, 191–203. doi: 10.1016/S1146-609X(02)01150-5
Costa, J. M., Ramos, J. A., da Silva, L. P., Timoteo, S., Araújo, P. M., Felgueiras, M. S., et al. (2014). Endozoochory largely outweighs epizoochory in migrating passerines. J Avian Biol. 45, 59–64. doi: 10.1111/j.1600-048X.2013.00271.x
de Vlaming, V., and Proctor, V. W. (1968). Dispersal of aquatic organisms: viability of seeds recovered from the droppings of captive killdeer and mallard ducks. Am. J. Bot. 55, 20–26. doi: 10.1002/j.1537-2197.1968.tb06939.x
del Hoyo, J., Elliot, A., and Carbot, J. (1992). Handbook of the Birds of the World, Vol 1: Ostrich to Ducks. Barcelona: Lynx Edicions.
Farmer, J. A., Webb, E. B., Pierce, R. A., and Bradley, K. W. (2017). Evaluating the potential for weed seed dispersal based on waterfowl consumption and seed viability. Pest Manage. Sci. 73, 2592–2603. doi: 10.1002/ps.4710
Figuerola, J., and Green, A. J. (2002). Dispersal of aquatic organisms by waterbirds: a review of past research and priorities for future studies. Freshw. Biol. 47, 483–494. doi: 10.1046/j.1365-2427.2002.00829.x
Green, A. J., and Elmberg, J. (2014). Ecosystem services provided by waterbirds. Biol. Rev. 89, 105–122. doi: 10.1111/brv.12045
Green, A. J., Figuerola, J., and Sánchez, M. I. (2002). Implications of waterbird ecology for the dispersal of aquatic organisms. Acta Oecol. 23, 177–189. doi: 10.1016/S1146-609X(02)01149-9
Jorde, D. G., Krapu, G. L., Crawford, R. D., and Hay, M. A. (1984). Effects of weather on habitat selection and behavior of mallards wintering in Nebraska. Condor 86, 258–265. doi: 10.2307/1366993
Kleyer, M., Bekker, R. M., Knevel, I. C., Bakker, J. P., Thompson, K., Sonnenschein, M., et al. (2008). The LEDA Traitbase: a database of life-history traits of the Northwest European flora. J. Ecol. 96, 1266–1274. doi: 10.1111/j.1365-2745.2008.01430.x
Kleyheeg, E., Claessens, M., and Soons, M. B. (2018). Interactions between seed traits and digestive processes determine the germinability of bird-dispersed seeds. PLoS ONE 13:e0195026. doi: 10.1371/journal.pone.0195026
Kleyheeg, E., Klaassen, M., and Soons, M. B. (2016). Seed dispersal potential by wild mallard duck as estimated from digestive tract analysis. Freshw. Biol. 61, 1746–1758. doi: 10.1111/fwb.12814
Kleyheeg, E., Treep, J., de Jager, M., Nolet, B. A., and Soons, M. B. (2017a). Seed dispersal distributions resulting from landscape-dependent daily movement behaviour of a key vector species, Anas platyrhynchos. J. Ecol. 105, 1279–1289. doi: 10.1111/1365-2745.12738
Kleyheeg, E., van Dijk, J. G. B., Tsopoglou-Gkina, D., Woud, T. Y., Boonstra, D. K., Nolet, B. A., et al. (2017b). Movement patterns of a keystone waterbird species are highly predictable from landscape configuration. Movement Ecol. 5:2. doi: 10.1186/s40462-016-0092-7
Kleyheeg, E., Van Leeuwen, C. H., Morison, M. A., Nolet, B. A., and Soons, M. B. (2015). Bird-mediated seed dispersal: reduced digestive efficiency in active birds modulates the dispersal capacity of plant seeds. Oikos 124, 899–907. doi: 10.1111/oik.01894
Krementz, D. G., Asante, K., and Naylor, L. W. (2011). Spring migration of mallards from Arkansas as determined by satellite telemetry. J. Fish Wildl. Manag. 2, 156–168. doi: 10.3996/042011-JFWM-026
Lehner, B., and Döll, P. (2004). Development and validation of a global database of lakes, reservoirs and wetlands. J. Hydrol. 296, 1–22. doi: 10.1016/j.jhydrol.2004.03.028
Loarie, S. R., Duffy, P. B., Hamilton, H., Asner, G. P., Field, C. B., and Ackerly, D. D. (2009). The velocity of climate change. Nature 462, 1052–1055. doi: 10.1038/nature08649
Maechler, M., Rousseeuw, P., Struyf, A., Hubert, M., and Hornik, K. (2018). Cluster: Cluster Analysis Basics and Extensions. R package version 2.0.7–1. Available online at: https://CRAN.R-project.org/package=cluster
McClintock, B. T., and Michelot, T. (2018). momentuHMM: R package for generalized hidden Markov models of animal movement. Methods Ecol. 9, 1518–1530. doi: 10.1111/2041-210X.12995
Mueller, M. H., and van der Valk, A. G. (2002). The potential role of ducks in wetland seed dispersal. Wetlands 22, 170–178. doi: 10.1672/0277-5212(2002)022[0170:TPRODI]2.0.CO2;
Nathan, R., and Muller-Landau, H. C. (2000). Spatial patterns of seed dispersal, their determinants and consequences for recruitment. Trends Ecol. Evol. 15, 278–285. doi: 10.1016/S0169-5347(00)01874-7
Nathan, R., Schurr, F. M., Spiegel, O., Steinitz, O., Trakhtenbrot, A., and Tsoar, A. (2008). Mechanisms of long-distance seed dispersal. Trends Ecol. Evol. 23, 638–647. doi: 10.1016/j.tree.2008.08.003
Peterson, A. T., Soberón, J., Pearson, R. G., Anderson, R. P., Martínez-Meyer, E., Nakamura, M., et al. (2011). Ecological Niches and Geographic Distributions (MPB-49). Vol 56. Princeton, NJ: Princeton University Press. doi: 10.23943/princeton/9780691136868.001.0001
Pimm, S. L., and Raven, P. (2000). Biodiversity: extinction by numbers. Nature 403, 843–845. doi: 10.1038/35002708
Pollux, B. J. A., Santamaria, L., and Ouborg, N. J. (2005). Differences in endozoochorous dispersal between aquatic plant species, with reference to plant population persistence in rivers. Freshw. Biol. 50, 232–242. doi: 10.1111/j.1365-2427.2004.01314.x
R Core Team (2018). R: A Language and Environment for Statistical Computing. Vienna: R Foundation for Statistical Computing. Available online at: https://www.R-project.org/.
Roshier, D. A., and Asmus, M. W. (2009). Use of satellite telemetry on small-bodied waterfowl in Australia. Mar. Freshw. Res. 60, 299–305. doi: 10.1071/MF08152
Rousseeuw, P. J. (1987). Silhouettes: a graphical aid to the interpretation and validation of cluster analysis. J. Comput. Appl. Math. 20, 53–65. doi: 10.1016/0377-0427(87)90125-7
Santamaría, L. (2002). Why are most aquatic plants widely distributed? Dispersal, clonal growth and small-scale heterogeneity in a stressful environment. Acta Oecol. 23, 137–154. doi: 10.1016/S1146-609X(02)01146-3
Sauter, A., Korner, P., Fiedler, W., and Jenni, L. (2012). Individual behavioural variability of an ecological generalist: activity patterns and local movements of Mallards Anas platyrhynchos in winter. J. Ornithol. 153, 713–726. doi: 10.1007/s10336-011-0788-9
Smouse, P. E., Focardi, S., Moorcroft, P. R., Kie, J. G., Forester, J. D., and Morales, J. M. (2010). Stochastic modelling of animal movement. Philos. Trans. R. Soc. B 365, 2201–2211. doi: 10.1098/rstb.2010.0078
Soons, M. B., Brochet, A. L., Kleyheeg, E., and Green, A. J. (2016). Seed dispersal by dabbling ducks: an overlooked dispersal pathway for a broad spectrum of plant species. J. Ecol. 104, 443–455. doi: 10.1111/1365-2745.12531
Soons, M. B., Van Der Vlugt, C., Van Lith, B., Heil, G. W., and Klaassen, M. (2008). Small seed size increases the potential for dispersal of wetland plants by ducks. J. Ecol. 96, 619–627. doi: 10.1111/j.1365-2745.2008.01372.x
Swanson, G. A., and Bartonek, J. C. (1970). Bias associated with food analysis in gizzards of blue-winged teal. J. Wildl. Manage. 34, 739–746. doi: 10.2307/3799138
Technitis, G., Weibel, R., Kranstauber, B., and Safi, K. (2016). “An algorithm for empirically informed random trajectory generation between two endpoints,” in International Conference on GIScience Short Paper Proceedings (Montreal, QC). doi: 10.21433/B31194g0c634
van Leeuwen, C. H. (2018). Internal and external dispersal of plants by animals: an aquatic perspective on alien interference. Front. Plant Sci. 9:153. doi: 10.3389/fpls.2018.00153
van Leeuwen, C. H., Tollenaar, M. L., and Klaassen, M. (2012b). Vector activity and propagule size affect dispersal potential by vertebrates. Oecologia 170, 101–109. doi: 10.1007/s00442-012-2293-0
van Leeuwen, C. H., Van der Velde, G., van Groenendael, J. M., and Klaassen, M. (2012a). Gut travellers: internal dispersal of aquatic organisms by waterfowl. J. Biogeogr. 39, 2031–2040. doi: 10.1111/jbi.12004
van Toor, M. L., Avril, A., Wu, G., Holan, S. H., and Waldenström, J. (2018a). As the duck flies – estimating the dispersal of low-pathogenic avian influenza viruses by migrating mallards. Front. Ecol. Evol. 6:208. doi: 10.3389/fevo.2018.00208
van Toor, M. L., Kranstauber, B., Newman, S. H., Prosser, D. J., Takekawa, J. Y., Technitis, G., et al. (2018b). Integrating animal movement with habitat suitability for estimating dynamic migratory connectivity. Landscape Ecol. 33, 879–893. doi: 10.1007/s10980-018-0637-9
Viana, D. S. (2017). Can aquatic plants keep pace with climate change? Front. Plant Sci. 8:1906. doi: 10.3389/fpls.2017.01906
Viana, D. S., Santamaría, L., and Figuerola, J. (2016). Migratory birds as global dispersal vectors. Trends Ecol. Evol. 31, 763–775. doi: 10.1016/j.tree.2016.07.005
Viana, D. S., Santamaría, L., Michot, T. C., and Figuerola, J. (2013a). Allometric scaling of long-distance seed dispersal by migratory birds. Am. Nat. 181, 649–662. doi: 10.1086/670025
Viana, D. S., Santamaría, L., Michot, T. C., and Figuerola, J. (2013b). Migratory strategies of waterbirds shape the continental-scale dispersal of aquatic organisms. Ecography 36, 430–438. doi: 10.1111/j.1600-0587.2012.07588.x
Vittoz, P., and Engler, R. (2007). Seed dispersal distances: a typology based on dispersal modes and plant traits. Bot. Helv. 117, 109–124. doi: 10.1007/s00035-007-0797-8
Werner, S., Bauer, H.-G., Heine, G., Jacoby, H., and Stark, H. (2018). 55 Jahre Wasservogelzählung am Bodensee: Bestandsentwicklung der Wasservögel von 1961/62 bis 2015/16. Ornithol. Beob. Beiheft 13.
Keywords: Anas platyrhynchos, climate change, endozoochory, global warming, migration, range shift, seed dispersal, waterbirds
Citation: Kleyheeg E, Fiedler W, Safi K, Waldenström J, Wikelski M and van Toor ML (2019) A Comprehensive Model for the Quantitative Estimation of Seed Dispersal by Migratory Mallards. Front. Ecol. Evol. 7:40. doi: 10.3389/fevo.2019.00040
Received: 26 October 2018; Accepted: 04 February 2019;
Published: 26 February 2019.
Edited by:
Casper H. A. Van Leeuwen, Netherlands Institute of Ecology (NIOO-KNAW), NetherlandsReviewed by:
Duarte S. Viana, German Center for Integrative Biodiversity Research, GermanyAlex Bush, Lancaster University, United Kingdom
Copyright © 2019 Kleyheeg, Fiedler, Safi, Waldenström, Wikelski and van Toor. This is an open-access article distributed under the terms of the Creative Commons Attribution License (CC BY). The use, distribution or reproduction in other forums is permitted, provided the original author(s) and the copyright owner(s) are credited and that the original publication in this journal is cited, in accordance with accepted academic practice. No use, distribution or reproduction is permitted which does not comply with these terms.
*Correspondence: Erik Kleyheeg, ZXJpa2tsZXloZWVnQGdtYWlsLmNvbQ==
†These authors have contributed equally to this work