 Thomas E. Dilts1
 Madeline O. Steele2Joseph D. Engler2
 Emma M. Pelton3
 Sarina J. Jepsen3Stephanie J. McKnight3Ashley R. Taylor3
 Candace E. Fallon3Scott H. Black3Elizabeth E. Cruz2Daniel R. Craver2
 Matthew L. Forister4*
- 1Department of Natural Resources and Environmental Science, University of Nevada Reno, Reno, NV, United States
- 2U. S. Fish and Wildlife Service, Portland, OR, United States
- 3Xerces Society for Invertebrate Conservation, Portland, OR, United States
- 4Program in Ecology, Evolution, and Conservation Biology, Department of Biology, University of Nevada Reno, Reno, NV, United States
The monarch butterfly is one of the most easily recognized and frequently studied insects in the world, and has recently come into the spotlight of public attention and conservation concern because of declining numbers of individuals associated with both the eastern and western migrations. Historically, the larger eastern migration has received the most scientific attention, but this has been changing in recent years, and here we report the largest-ever attempt to map and characterize non-overwintering habitat for the western monarch butterfly. Across the environmentally and topographically complex western landscape, we include 8,427 observations of adults and juvenile monarchs, as well as 20,696 records from 13 milkweed host plant species. We find high heterogeneity of suitable habitats across the geographic range, with extensive concentrations in the California floristic province in particular. We also find habitat suitability for the butterfly to be structured primarily by host plant habitat associations, which are in turn structured by a diverse suite of climatic variables. These results add to our knowledge of range and occupancy determinants for migratory species and provide a tool that can be used by conservation biologists and researchers interested in interactions among climate, hosts and host-specific animals, and by managers for prioritizing future conservation actions at regional to watershed scales.
Introduction
Species with exceptionally large geographic ranges are not often the focus of conservation and management attention, simply because large ranges typically encompass many populations or subpopulations, which buffer against stressors that are of concern in species with more restricted distributions (Brook et al., 2008). However, in at least some cases, migratory species are an exception in that they can be composed of a single population that covers a large geographic area, and thus may be uniquely exposed to stressors but without the resilience afforded by metapopulation structure (Drechsler et al., 2003). With such species, one of the central challenges is to understand habitat requirements or associations in different parts of the range so that conservation and management effort can be focused appropriately (Martin et al., 2007). Depending on requirements or preferences at different life history stages or at different times of the year, a widespread migratory species might have relatively simple or complex habitat associations. This may be of applied interest if the goal is to target certain habitats for protection (Guisan and Thuiller, 2005). The issue is of basic interest as well, as it bears on the structure and limits of broad geographic ranges. Here we examine habitat and host associations for the western migration of the monarch butterfly, Danaus plexippus plexippus.
The monarch is a relatively large butterfly in the family Nymphalidae that specializes on milkweed larval hosts in the genus Asclepias. The geographic range of the monarch encompasses a large portion of the North American continent and Caribbean islands, with disjunct populations in other areas including northern South America, Australia, the Iberian Peninsula, and islands in the Pacific. In North America, the monarch range is primarily composed of two subpopulations with mostly independent migratory phenomena that are genetically very similar (Zhan et al., 2014). In the eastern migration, monarchs overwinter in Mexico and move north during the summer, expanding across more than half of the continent. In the western migration, the overwintering sites are along the Pacific coast of North America, while the breeding ground is roughly characterized as west of the Rocky Mountains, but has not been described with greater precision [an unknown proportion of monarchs breed west of the Rocky Mountains but overwinter in Mexico (Morris et al., 2015)]. In recent years, both the eastern and western migrations have shown dramatic declines in numbers of individuals: in the East, this has been most evident at the overwintering grounds (Brower et al., 2012; Inamine et al., 2016; Semmens et al., 2016); in the West, the decline has been notable both in overwintering numbers (Schultz et al., 2017) and in observations during the breeding season (Espeset et al., 2016). The decline in the western population has been estimated at >95% since the 1980s (Schultz et al., 2017), which is arguably more severe than the magnitude of the decline in the larger eastern population (Semmens et al., 2016). These declines have triggered conservation concern (Oberhauser et al., 2017), and the monarch butterfly is currently under consideration for listing as threatened under the Endangered Species Act (79 FR 78775). Though smaller, the western population is significant to the species' viability as a whole in that it adds resiliency, or ability to withstand environmental stochasticity, and redundancy, or ability to withstand environmental catastrophes (Shaffer and Stein, 2000) by having healthy populations distributed across multiple heterogenous geographic regions. Monarchs have also experienced heightened interest within the general public in recent years and have long been one of the most widely-recognized and appreciated insects (Gustafsson et al., 2015).
Despite an increase in professional and amateur interest in monarch butterflies in recent years, very little has been quantified with respect to habitat associations for the western migration, especially during the breeding season. Informally, the monarch is often considered a host specialist but a habitat generalist, since adults travel great distances and are expected to find host plants under a wide range of conditions, but this assumption has not been tested. One of the challenges of working with a widespread species in the western U.S. is the occupancy of large stretches of unpopulated, inaccessible, and infrequently studied areas. The state of Nevada, for example, has over 150 individual mountain ranges, many of which are not easily accessed by roads. Given that challenge, we have crowd sourced a diversity of records and monitoring efforts with the goal of developing a better understanding of habitat and climate associations and requirements for the western monarch and its major host plant species. Specifically, we address the following questions (and note that habitat associations include climate variables in all cases). (1) What are the environmental habitat associations of 13 western Asclepias species (Figure 1, Table 1) that are known to be larval hosts of monarch butterflies? These species include both widespread, abundant plants, and species with more restricted distributions for which we had sufficient data. (2) What are the non-overwintering habitat requirements of the western monarch? How do habitat requirements change when considering different life history stages? In particular, we consider adult observations as distinct from breeding records (observations of eggs and caterpillars), and we develop a model including all three life history stages (eggs, caterpillars, and adults). (3) Finally, we ask: how do non-overwintering habitat requirements or characteristics differ across the monarch models, from host plants to breeding records to adults and to all monarch observations combined? The first two questions are directly relevant to conservation and management of the monarch, while the last question is of general interest to the extent that it gives insight into the spatial scale of habitat specialization and generalization in a widespread species. In particular, it is of interest to know if monarch habitat associations are structured primarily by host plants alone or by host plants as well as climatic factors (either directly or indirectly through climatic effects on hosts). The distinction between those possibilities bears on our expectations as to how the monarch will respond to climate change and shifting abiotic conditions in the western U.S.
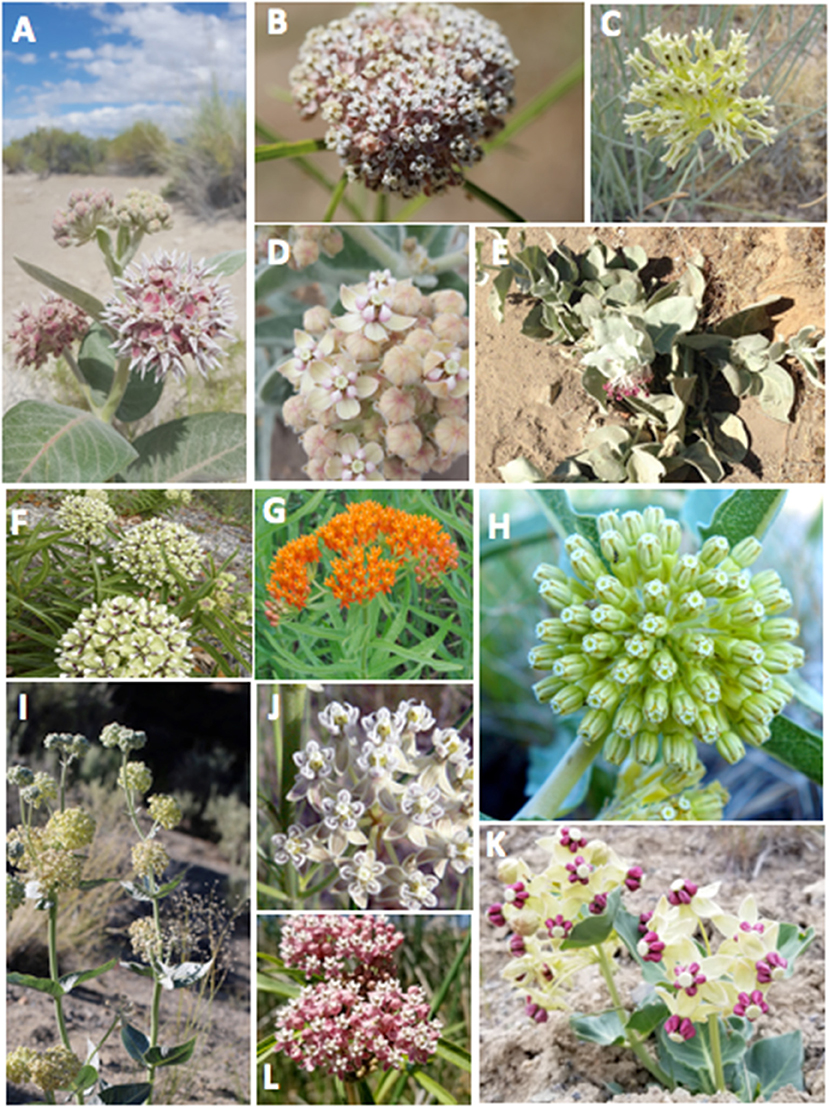
Figure 1. Focal milkweed species: (A) Asclepias speciosa, (B) A. fascicularis, (C) A. subulata, (D) A. eriocarpa, (E) A. californica, (F) A. asperula, (G) A. tuberosa, (H) A. viridiflora, (I) A. erosa, (J) A. subverticillata, (K) A. cryptoceras, (L), A. incarnata. All photo credits Stephanie McKnight, except as follows: Brianna Borders (A. subulata); Kathryn Price (A. californica); Lee Adamson (A. asperula); Aaron Carlson (A. tuberosa); National Park Service (A. viridiflora); Sally King (A. subverticillata).
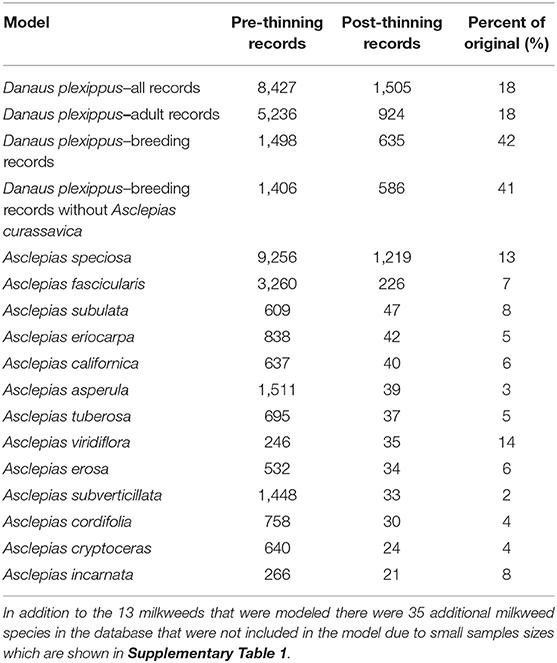
Table 1. Model name, number of records prior to applying geographic thinning, number of records after applying geographic thinning, and the ratio of pre- to post-thinning records.
Materials and Methods
Occurrence Data and Study Extent
We used occurrence records from 11 U.S. states whose boundaries lay entirely or at least partially west of the Continental Divide (California, Oregon, Washington, Idaho, Nevada, Arizona, Utah, Montana, Wyoming, Colorado, and New Mexico) to create four models partitioned by life history stages, using only non-overwintering records (i.e., occurrences that were recorded April through October). The first model used all occurrence records regardless of life history stage (adults, eggs, and caterpillars). We refer to this as the “all” model. The second model used only those occurrence records that were recorded as “adult,” thus omitting records that were only of larvae and eggs. The third model included only records that indicate breeding (eggs and caterpillars) which we refer to as the “breeding” model. The breeding records necessarily involve observations on milkweed hosts, while the adult records include both observations of adults in association with host plants and in other settings (e.g., nectaring on other flowering plants). Finally, since tropical milkweed (Asclepias curassavica)—a non-native species commonly planted in gardens, which persists year-round in areas with mild winters—has been implicated as a contributing factor for parasitism by the protozoan parasite, Ophryocystis elektroscirrha, and in disruption of reproductive behavior (Satterfield et al., 2016, 2018; Malcolm, 2018), we considered a fourth model of only breeding records that occur in areas >3.6 km from known occurrences of A. curassavica (based on a 3,600 m grid), which we refer to as our “non-tropical breeding” model.
In addition to modeling habitat suitability for the monarch butterfly, we created models for its host plants in the Asclepias (milkweed) genus (Figure 1). We selected 13 species with enough occurrence records to generate models with good predictive performance based upon area-under-the-curve of the receiver-operator characteristic plot (validation AUC > 0.7). AUC is a threshold independent measure of model performance that has been commonly used in many fields including ecology (Fielding and Bell, 1997). Similar to the monarch models, we used data from the 11 western states as training and validation for milkweed models (more details on training and validation are given below).
Although the combined monarch and milkweed database contained 39,327 occurrence points, these data were collected from a variety of sources, including museum databases such as CalFlora and the Global Biodiversity Information Facility, citizen science efforts, such as the Southwest Monarch Study, Journey North, and iNaturalist, and targeted field sampling by a wide variety of state and federal agencies, non-governmental organizations, and university groups, and were often collected opportunistically (see Supplementary Table 1 for details on databases). Data used in this model and additional data can be accessed via the Western Monarch Milkweed Mapper website (www.monarchmilkweedmapper.org) (Western Monarch Milkweed Occurrence Database, 2018) and included records through January of 2017. To minimize the effects of sampling bias in our data we used geographic thinning, which has been shown to be one of the more effective approaches for reducing sampling bias in occurrence data (Kramer-Schadt et al., 2013; Fourcade et al., 2014). To implement geographic thinning, we first removed records with a known accuracy coarser than 270 m, leaving mostly data from the GPS era (starting in the mid 1990's), then we applied a 3,600 m grid over the study area and retained a single occurrence point closest to the centroid of each cell. The 3,600 m grid was identified by Steele et al. (2016) because it minimized spatial clustering of occurrence points that typically occur due to biased sampling (for example along roads or near urban areas) and was found to result in more generalizable models in that study. The resulting occurrence dataset contained 4,569 records among the 13 milkweed species and four categories of monarch models (all records, adult-only records, breeding records, and breeding records without A. curassavica; Table 1). We did not apply other methods of bias correction, such as target group sampling, because that approach assumes an equal probability of detection for all species (Ponder et al., 2001). We could not assume that observers would necessarily have observed or recorded any milkweed had it been present, nor could we be certain that evidence of monarchs and lack of milkweeds represents a true absence of host plants.
Environmental Covariates
Since the goal of our work was to assess the general characteristics of habitat associates between monarch butterflies, milkweeds, and the abiotic environment, we tested a wide range of environmental variables in the models that represented topographic, climatic, edaphic, hydrologic, and land use gradients (Table 2). Variables assessed in the model included actual evapotranspiration, climatic water deficit, number of degree days, annual precipitation, precipitation of the coldest season, precipitation seasonality, precipitation of the warmest season, temperature range, temperature seasonality, maximum temperature of the warmest season, soil bulk density, clay content, sand content, silt content, pH, aspect, slope, compound topographic index (topographic wetness index), distance to intermittent stream, distance to perennial stream, and land cover types. All variables are on a continuous scale except for land cover, which is a categorical variable, and it included classes such as urban, suburban, agriculture, shrubland, coniferous forest, and deciduous forest (further discussion of the land cover variables are in Supplementary Materials—additional methods and Supplementary Table 3). All covariates were resampled to a common resolution of 270 m. Details about the environmental covariates and how they were resampled to a single resolution for modeling are included in the Supplementary Material and the native resolution of each covariate is shown in Table 2.
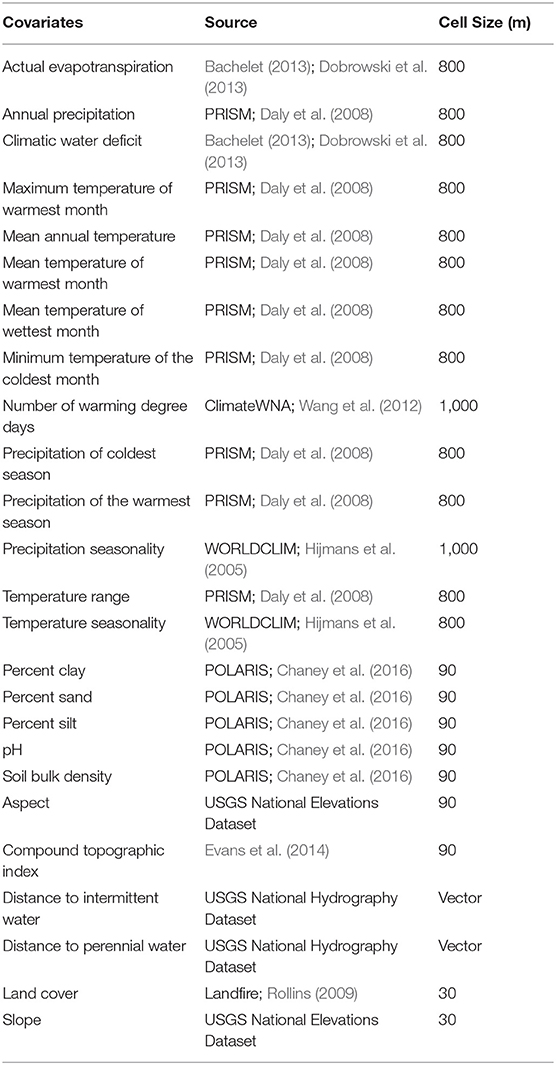
Table 2. Environmental covariates used in modeling, their data source, and original cell size of the raster data. Further details about the variables are in Supplementary Table 2.
Background Selection
Our habitat modeling approach builds off of the previous monarch habitat modeling effort by Steele et al. (2016) in that it takes a four step approach that includes optimal background selection, optimization of Maxent parameters (feature types and regularization), variable reduction, and finally map projection. We applied a presence-background habitat modeling approach known as maximum entropy (Maxent) to create relative habitat suitability models (Phillips et al., 2006). In contrast to presence-absence modeling methods, presence-background approaches, such as Maxent, randomly select background points from a frame of pixels that may include both presence and absence locations. We selected restricted background areas on a species-specific basis for each of the milkweed species (VanDerWal et al., 2009), with the exception of Asclepias speciosa, for which we used the entire 11 western states. Likewise, all four Danaus plexippus plexippus models used the entire 11 states. For the remaining milkweed species we used the approach presented by Iturbide et al. (2015), in which species occurrence points are buffered by increasingly large buffers, models are run using default Maxent parameters, and selected based upon their inflection curves. We calculated a Michaelis-Menten function (Iturbide et al., 2015) to identify the saturation point and selected the first model that was within the 95% confidence interval for that point. Buffer distances ranged from 175 to 300 km depending upon the species and are shown in more detail in Supplementary Table 4.
Optimization of Regularization and Feature Types in Maxent (Model Selection)
Several recent studies recommend species-specific tuning of the default settings for the regularization parameter and feature types (i.e., linear, quadratic, product, threshold, and hinge) (Anderson and Gonzalez, 2011; Warren and Seifert, 2011; Radosavljevic and Anderson, 2014). To perform species-specific tuning for the 17 milkweed and monarch models, we tested a combination of five regularization levels (1–5) and five combinations of feature types (linear, linear + quadratic, linear + quadratic + product, linear + quadratic + product + threshold, hinge), representing a gradient of models ranging from simple to complex. Determining the best model that optimizes both fit and generalizability is an ongoing area of research in species distribution modeling and no clear consensus has yet emerged as to how to create an optimal model (Merow et al., 2013; Radosavljevic and Anderson, 2014; Warren et al., 2014). We derived validation AUC withholding 50% of records as a measure of model fit and the difference between training and validation AUC (AUCdiff) as a measure of model overfit (Warren and Seifert, 2011). Combining these two approaches, we define in this paper a new metric that we term “penalized AUC” (pAUC), which combines validation AUC and AUCdiff order to identify models that maximize model fit while minimizing overfit. We calculate
For each species, we chose the model with the highest pAUC and identified the combination of regularization values and feature types that produced that model (Supplementary Table 2).
Variable Reduction
Although Maxent can accommodate a large number of predictor variables, to aid in the interpretation of the models and to reduce multicollinearity we used a variable reduction approach with the following steps. First, models were run using all covariates present (25 for the milkweed models and 38 for the monarch models; the latter have more variables because they include milkweeds as covariates). Maxent software allows variables to be ranked based upon a measure that the authors call permutation importance. Second, we ranked variables based on their permutation importance and variables with <3% contribution were removed from the model. Permutation importance, a standard output from Maxent software, is calculated by randomly permuting the values of each predictor variable among the training points and measuring the decrease in training AUC (Phillips et al., 2006). Three percent was chosen as a threshold for dropping variables because it allowed us to assess the impact that removing a handful of variables at a time has on the importance of the other variables. Third, variables that remained but had a correlation of > 0.7 with another variable were removed keeping the variable with the higher permutated importance value. This was repeated until all variables had a minimum contribution of 10% or greater.
Model Evaluation and Mapping
After selecting a parsimonious set of covariates for each model, we performed cross validation using 25 replicates withholding 20% of the sample points for validation in each iteration. Creating replicate maps allowed us to calculate the standard deviation of the predictive maps which we used as a measure of model uncertainty. We projected habitat models to the seven westernmost contiguous states of the United States using raster covariates at 270 m resolution and the logistic transformation in Maxent software to scale the suitability values from 0 to 1. While data for the states of Colorado, Montana, New Mexico, and Wyoming were used for model-building, limited fieldwork and outreach in those states resulted in few occurrences, thus we chose to limit the final predictive maps to California, Oregon, Washington, Idaho, Nevada, Utah, and Arizona. Finally, we used the equal sensitivity and specificity method to divide the continuous relative habitat suitability into binary maps of suitable and unsuitable areas for each species and monarch life history stage (Supplementary Table 7). These areas are depicted as gray lines on the full page supplemental maps (Supplementary Figure 2).
Results
Model Performance
Thirteen milkweed species and four life history stages of monarch butterflies produced models with validation AUC > 0.7 (Table 3). Monarch models ranged in validation AUC from 0.81 to 0.87. Milkweed models had validation AUC values ranging from 0.75 to 0.91 with A. eriocarpa, A. tuberosa, and A. viridiflora showing the best performance and A. erosa and A. subverticillata showing the worst performance. A. speciosa and A. fascicularis showed mid-range performance with validation AUC values of 0.86 and 0.83.
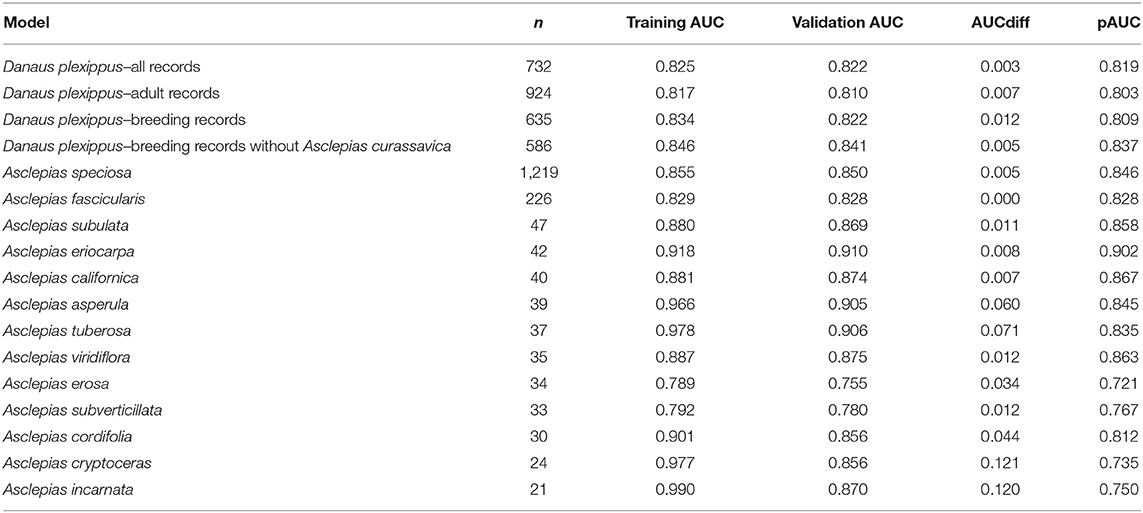
Table 3. Number of samples used in model building, training AUC, validation AUC, AUCdiff, and pAUC for the final habitat models.
Associations Between the Monarch Butterfly, Milkweeds, and Abiotic Gradients
In general, the milkweed species were associated with a diversity of abiotic variables (Figure 2), with land cover being the most common (seven out of 13 species), followed by precipitation of the warmest season (five out 13 species), climatic water deficit (four out of 13 species), slope (three out of 13 species), actual evapotranspiration (three out of 13 species), and minimum temperature of the coldest month (three out of 13 species). Mean temperature of the warmest quarter was only chosen for three species, but it constituted 81% of the permuted importance for A. subulata. While land cover was the most common variable selected across the models, due to the categorical nature of land cover, the association between milkweed and land cover varied by species. Urban land cover types were positively associated with A. speciosa, A. subulata, A. asperula, and A. tuberosa. Riparian vegetation was positively associated with A. subulata and A. asperula. Oak woodland was positively associated with A. speciosa and A. tuberosa.
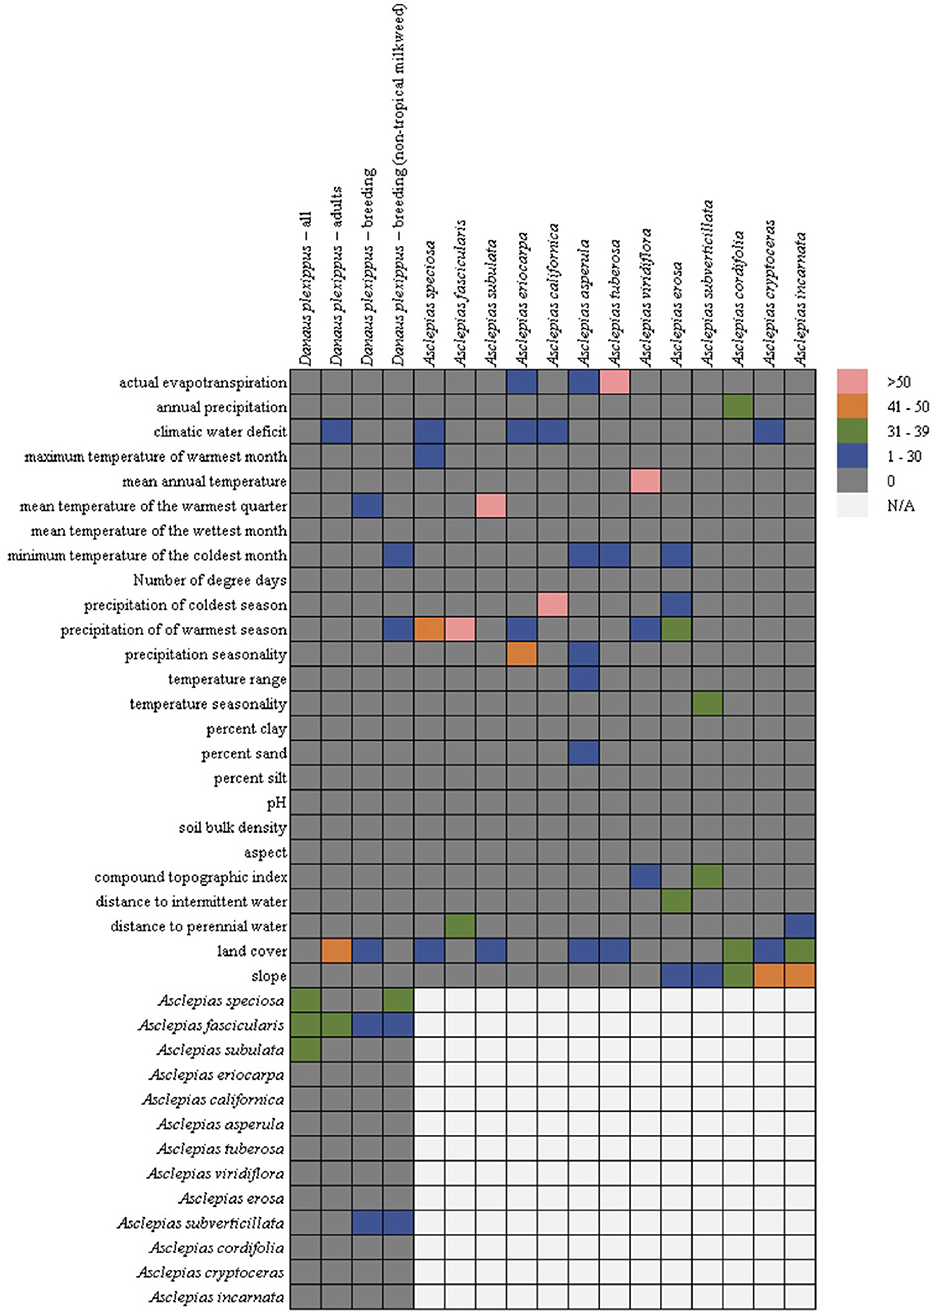
Figure 2. Variable importance for the monarch and milkweed models from the Maxent permutation importance. Hotters colors, such as pink and orange, indicate- that a variable was more important for the particular model whereas cooler colors such as green or blue indicates that it was less important. Gray indicates that the variable was not important at all. Due to multicollinearity (particularly among climatic variables) we cannot rule out a functional relationship between covariates that were not selected by the models. Cells in the lower right are empty (but filled in the lower left) because milkweeds were only used as predictors in the monarch models.
In contrast, all four of the monarch models showed similarity among the covariates chosen with the milkweed covariates consistently the most important predictors (four out of four models) followed by land cover (adult and breeding models), climatic water deficit (adult model), mean temperature of the warmest quarter (breeding model), minimum temperature of the coldest month (breeding without tropical milkweed), and precipitation of the warmest season (breeding without tropical milkweed) (Figure 2). The adult monarch model and the breeding monarch model both showed associations with urban land cover types with the breeding model showing additional associations with riparian land cover types. Of the milkweed covariates, A. fascicularis was selected in all four monarch models and constituted between 23 and 40% of permuted importance. A. speciosa was selected in the “all model” and the “breeding without tropical milkweed model” and ranged from 34 to 38% permuted importance. A. subverticillata was the next most important species selected in both versions of the breeding model and ranged from 12 to 22% of permuted importance. Finally, A. subulata was selected in the “all model” and was 32% of permuted importance.
Relationships between milkweed occurrence and abiotic gradients included a diversity of functional forms, including linear responses with thresholds, as well as smooth Gaussian-like curves, consistent with ecological niche theory. In contrast, the relationships between monarchs and their milkweed covariates showed largely linear relationships with monarch habitat suitability increasing with milkweed suitability (see Figure 3 for monarch response curves, and Figure 4 for milkweed response curves). The selection of particular milkweed covariates (in the monarch models) may reflect the fact that two of these species (A. speciosa and A. fascicularis) are the most geographically widespread species that we studied and the two remaining species (A. subverticillata and A. subulata) occur in areas where monarchs are known to exist but A. speciosa and A. fascicularis are limited. Our findings do not suggest that milkweed species not selected by models are unsuitable for breeding but rather that their geographic range coincides less with the current documented range of D. plexippus plexippus in the West.
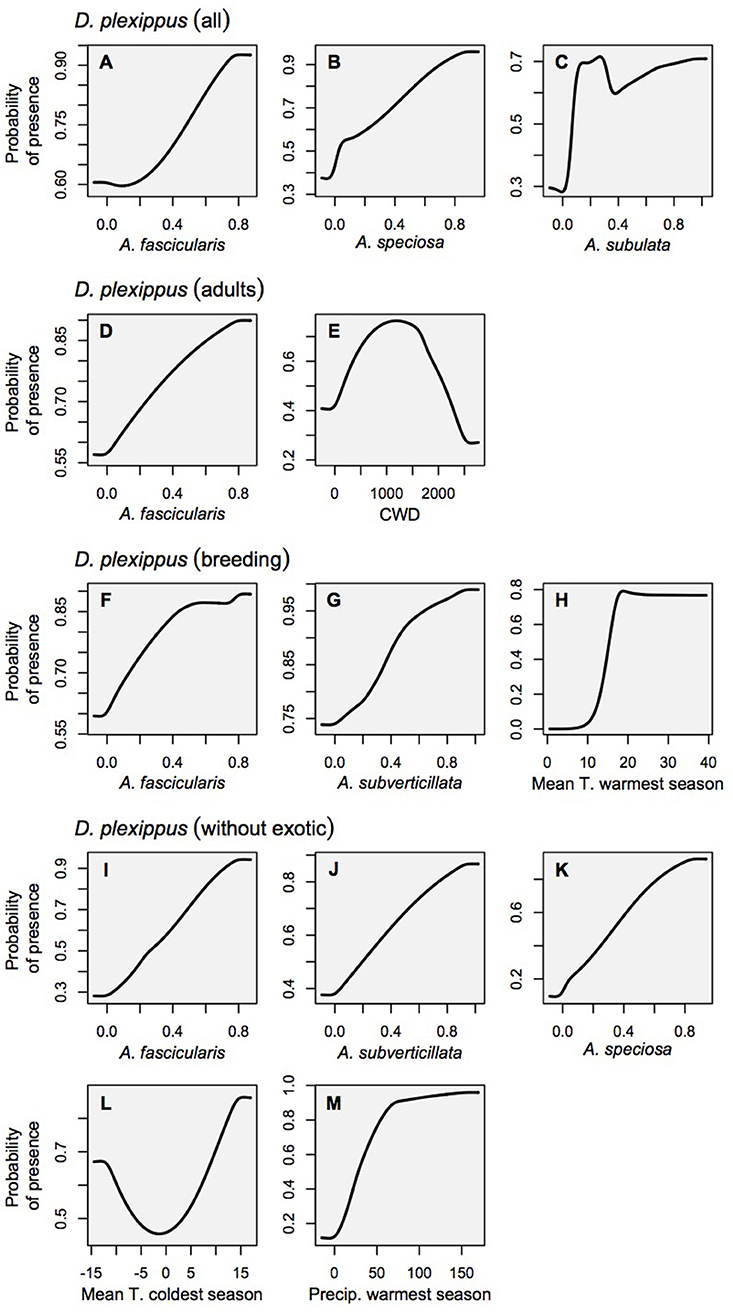
Figure 3. Marginal response curves for the monarch habitat models which consider each variable as it is influenced by all other variables in the model (as opposed to solitary response curves that consider only the relationship between the variable and habitat suitability). Land cover is not shown for clarity's sake because it is a categorical variable. (A–C) Danaus plexippus–all records, (D,E) D. plexippus–adult records, (F–H) D. plexippus–breeding records, (I–M) D. plexippus–breeding records w/o Ascelpias curassavica.
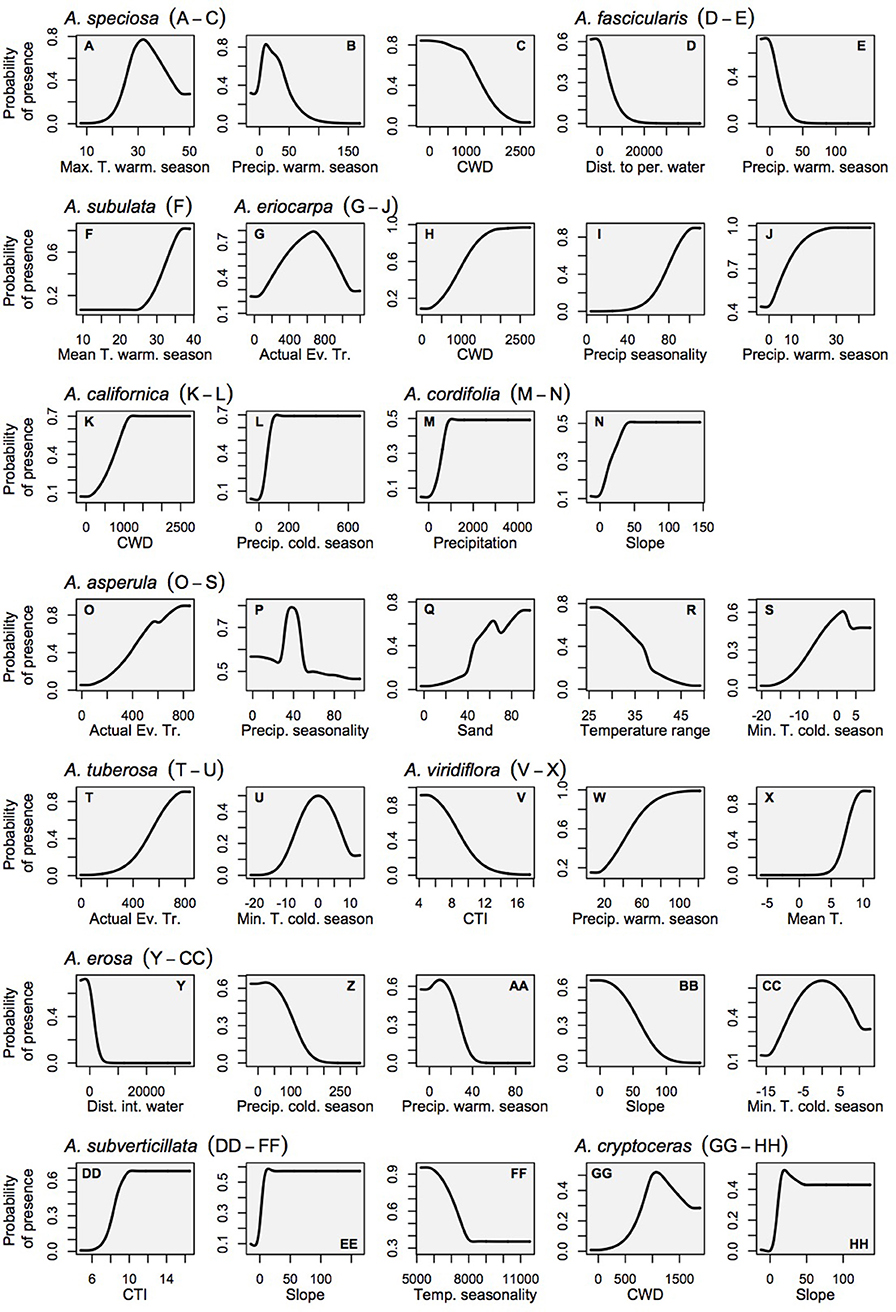
Figure 4. Marginal response curves for the milkweed habitat models which consider each variable as it is influenced by all other variables in the model (as opposed to the solitary response curves that consider only the relationship between the variable and habitat suitability). Land cover is not shown for the sake of clarity because it is a categorical variable. (A–C) A. speciosa, (D,E) A. fascicularis, (F) A. subulata, (G–J) A. eriocarpa, (K,L) A. californica, (M,N) A. asperula, (T,U) A. tuberosa, (V–X) A. virdiflora, (Y-CC) A.erosa, (DD-FF) A. subverticillata, (GG-HH) A. cryptoceras. For simplicity, A. incarnata is not shown.
Geographic Patterns of Habitat Suitability
The habitat suitability models highlighted broad areas of suitability across the seven states, with notable concentrations in California, the Snake River Plain in southern Idaho, the Columbia Basin in eastern Washington, as well as areas of eastern Oregon, northern Nevada and Utah, and southern Arizona (Figure 5). The influence of the tropical milkweed A. curassavica in the Los Angeles Basin of Southern California can be seen in the comparison between Figures 5C,D. In general, suitability for milkweed species tended to be very species-specific with the ranges of the different milkweed species typically showing unique geographic patterns. The area with the highest diversity of habitat suitable for multiple milkweed species is in the California floristic province which had seven of the 13 milkweed species. In contrast, the Pacific Northwest has far fewer species of milkweed, and predicted suitability was generally consistent with the known ranges of each milkweed species. Only A. speciosa, A. fascicularis, and A. cordifolia were predicted to be suitable in parts of western Oregon. Arizona was predicted to have high suitability for a number of species (A. subulata, A. asperula, A. tuberosa, A. subverticillata, and A. erosa) but low suitability for the two most widely distributed species, A. speciosa and A. fascicularis. For monarchs, model uncertainty varied depending upon the model being used. For example, the models that used all records, adults, and breeding records omitting A. curassavica all showed high uncertainty in parts of Sonoran and Mojave Deserts whereas the model using breeding records (including A. curassavia) indicated higher uncertainty in the Central Valley of California (Figure 6). Similar to habitat suitability, maps of habitat uncertainty were characterized by species-specific differences. Correlations amongst predictive maps show high similarity for the monarch models with one another (R = 0.72), low correlations among the milkweed species (R = 0.16), and moderate correlations between the monarch and milkweed maps (R = 0.24) being mostly driven by the overlap between monarch models and A. fascicularis (R = 0.67) and A. speciosa (R = 0.52) (Figure 7).
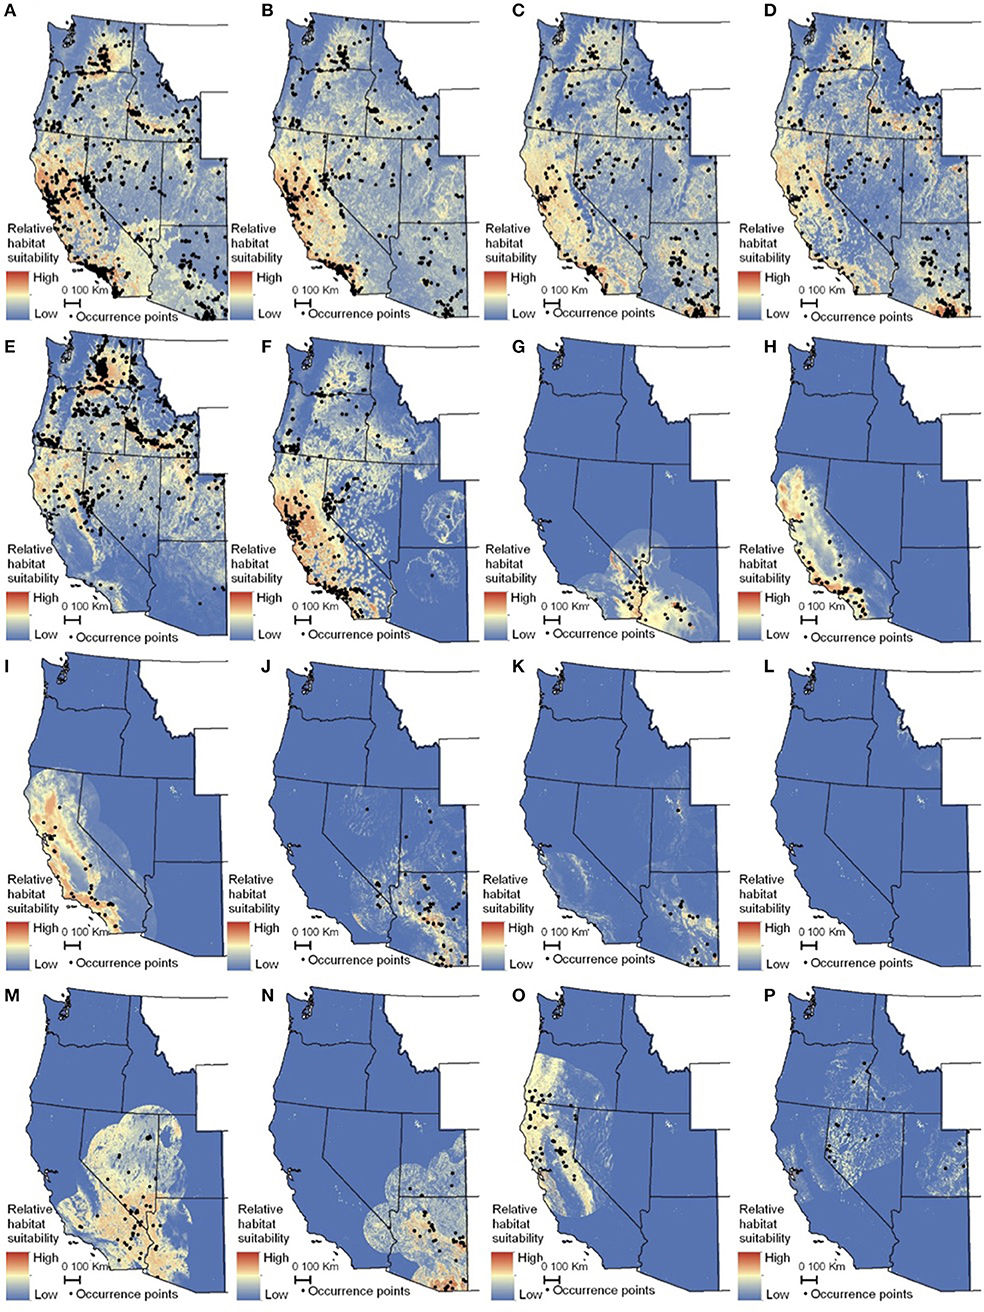
Figure 5. Maps of monarch and milkweed habitat suitability with red indicating higher habitat suitability and blue indicating lower habitat suitability. (A) Danaus D. plexippus–all records, (B) D. plexippus–adults, (C) Danaus plexippus–breeding, (D) D. plexippus–breeding without A. curassavica, (E) A. speciosa, (F) A. fascicularis, (G) A. subulata, (H) A. eriocarpa, (I) A. californica, (J) A. asperula, (K) A. tuberosa, (L) A. virdiflora, (M) A.erosa, (N) A. subverticillata, (O) A. cordifolia, (P) A. cryptoceras. For simplicity, A. incarnata is not shown. Full page maps for each species and monarch life history stage are included in Supplementary Figure 2.
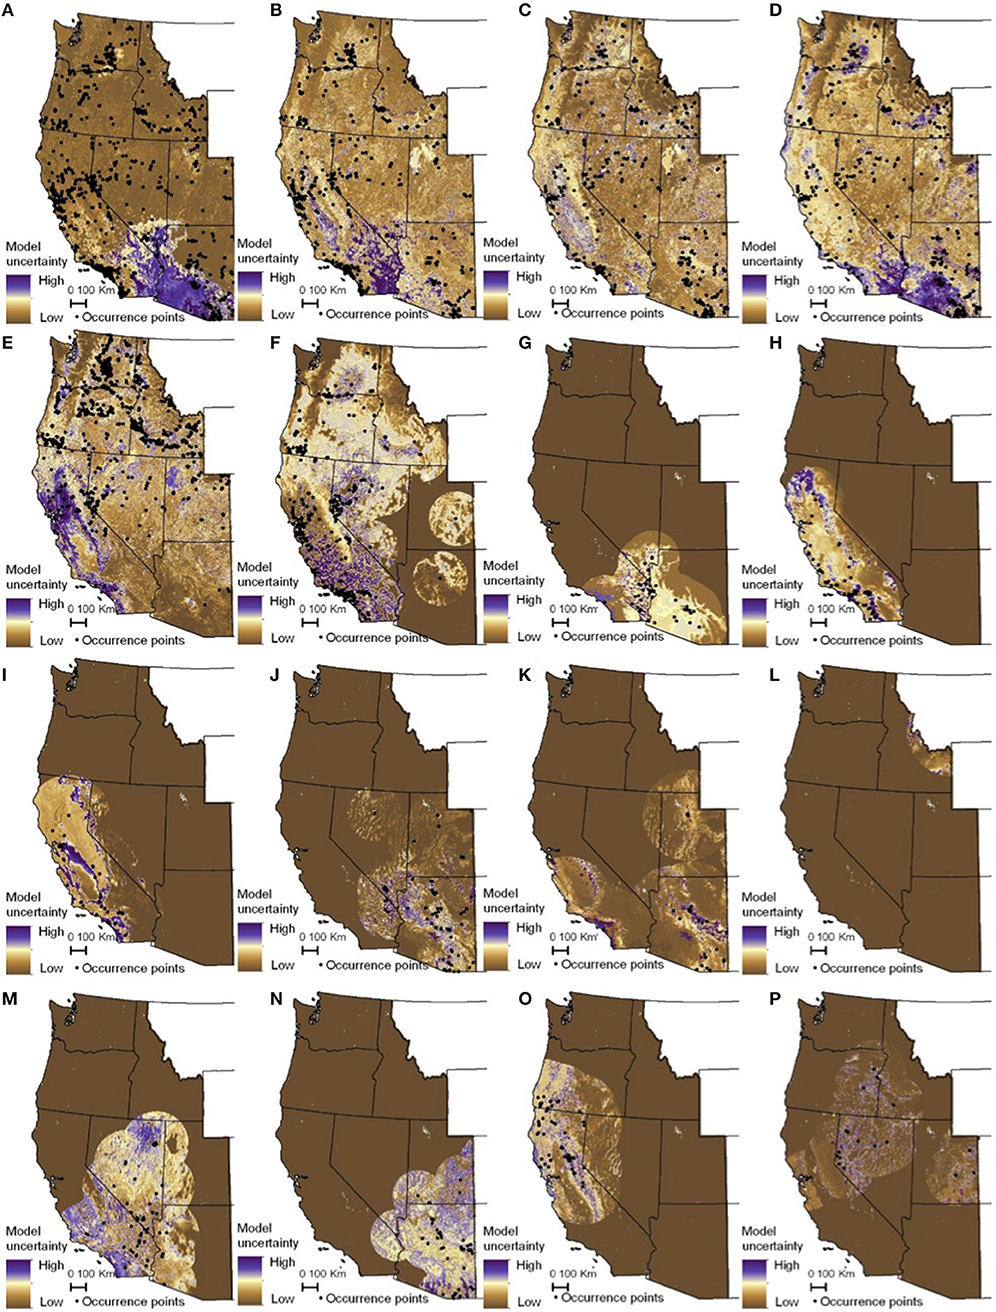
Figure 6. Maps of monarch and milkweed habitat uncertainty (standard deviation of 25 Maxent models) with purple indicating higher uncertainty and brown lower uncertainty. (A) D. plexippus–all records, (B) D. plexippus–adults, (C) D. plexippus–breeding, (D) D. plexippus–breeding without A. curassavica, (E) A. speciosa, (F) A. fascicularis, (G) A. subulata, (H) A. eriocarpa, (I) A. californica, (J) A. asperula, (K) A. tuberosa, (L) A. virdiflora, (M) A.erosa, (N) A. subverticillata, (O) A. cordifolia, (P) A. cryptoceras. A. incarnata is not shown for clarity's sake. Full page maps for each species and monarch life history stage are included in Supplementary Figure 3.
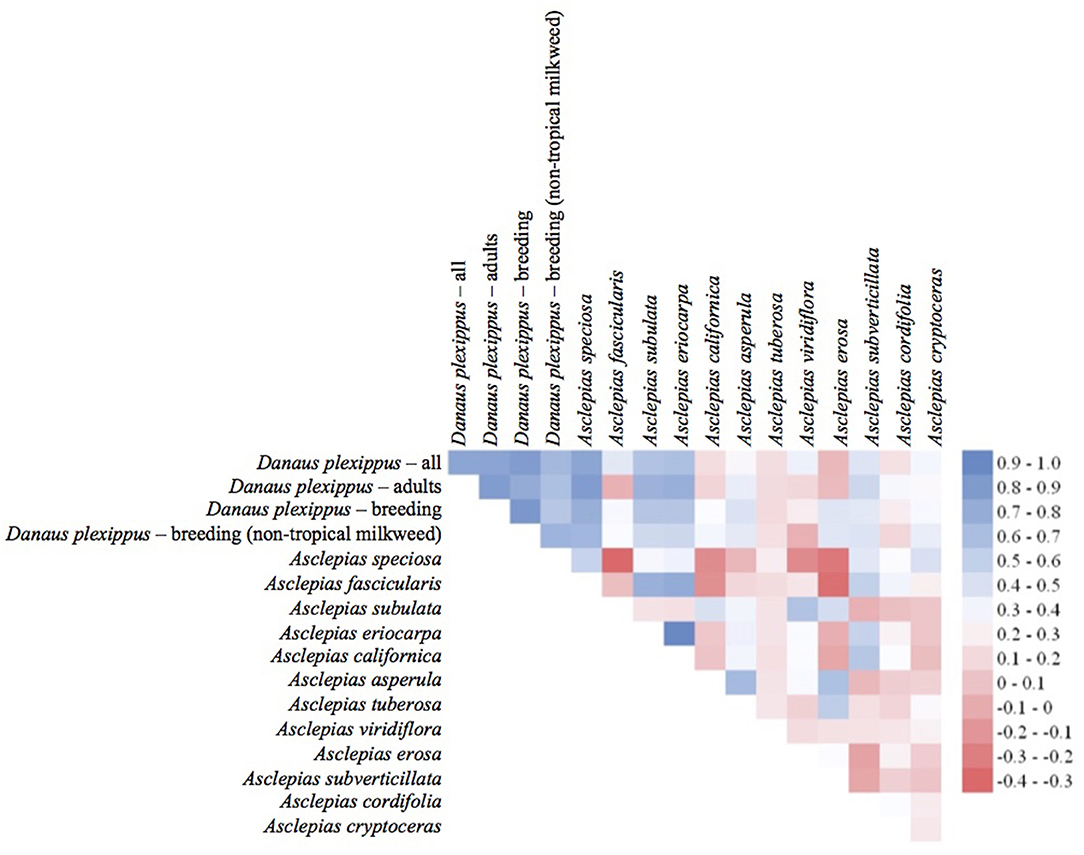
Figure 7. Pearson's correlation coefficients for entire predictive maps using all grid cells. Blue colors indicate a high degree of similarity among predictive maps of habitat and red colors indicate more dissimilarity between maps.
Discussion
Our study is the first peer-reviewed paper to apply maximum entropy habitat modeling to the western monarch and a majority of the important milkweed hosts in the western U.S. (but see Lemoine, 2015 for a continental study of eight different milkweed species). The extensive spatial coverage and broad suite of species makes this a useful tool for land management planning, including identification and prioritization of key monarch breeding habitat where active management and protection efforts may be most efficiently directed, as well as identification of regions and sites where restoration may be an appropriate monarch conservation strategy or where additional monitoring is needed. Within key geographic areas where habitat restoration may be an appropriate conservation strategy, these models can inform which species of milkweed to plant. The geographic distribution of western monarch butterflies is characterized by high heterogeneity of suitable habitat (Figure 5), as has been seen with other wide-ranging species, particularly in western North America (e.g., Lozier et al., 2013). The greatest continuous expanse of suitable habitat encompasses much of California, both the agricultural Central Valley, parts of the Coast Ranges, the western foothills of the Sierra Nevada Mountains and the southern deserts, all of which highlight the general importance of the region for the western monarch butterfly. This concentration of suitable habitat is consistent with a recent isotopic analysis of natal origins for monarchs collected at overwintering sites (Yang et al., 2016), as well as a previous spatial analysis that found precipitation within the core of the California floristic province to be most closely associated with annual fluctuations in monarch densities at the overwintering sites (Stevens and Frey, 2010). Vast stretches of the Intermountain West also contain pockets of high-quality monarch and milkweed habitat, which could provide ecologists and conservation biologists numerous opportunities for further exploration of habitat-host-monarch interactions. The Columbia River Basin in Washington State and the Snake River Plain in Idaho are also notable concentrations of suitable habitat that have historically been near the northern edge of the monarch breeding range (Dingle et al., 2005; Pyle, 2015) but could potentially be more heavily utilized if migration patterns shift under warming climatic conditions.
Four of the milkweed species that we modeled for the western U.S. were also modeled by Lemoine (2015). These included A. speciosa (showy milkweed), A. fascicularis (narrowleaf milkweed), A. tuberosa (butterfly weed), and A. incarnata (swamp milkweed). In general, our maps bear great resemblance to those of Lemoine (2015), despite the fact that they were developed at different spatial scales using different covariates and different numbers of occurrence records. A. speciosa was the most widely distributed milkweed in the western U.S. with suitable areas distributed in all seven of the states that we modeled. Compared to Lemoine (2015), our habitat models show more gradation in habitat suitability, particularly in the cold desert regions of eastern Oregon, northern Nevada, and southern Idaho. This is likely due to the inclusion of land cover as a variable in our model, which may reflect the fact that A. speciosa is commonly found in or around agricultural areas and other disturbed sites. The next most widely distributed milkweed species in the western U.S. was A. fascicularis. Like A. speciosa, our habitat maps for A. fascicularis resembled Lemoine (2015) but also show more complexity, likely because distance to perennial water was found to be an important variable in our models. A. tuberosa also generally agrees with Lemoine (2015), showing suitable habitat in the mountainous regions of Arizona. A. incarnata, which was relatively uncommon in the western U. S., showed some scattered occurrences in the Salt Lake Valley of Utah and the Snake River Plain of Idaho, areas that are shown as being moderately suitable by Lemoine (2015).
The U.S. Southwest (Arizona, Utah, Nevada, and the California deserts) had large areas that were suitable for monarchs despite the lack of the two most widespread milkweed species, A. speciosa and A. fascicularis. In states such as Arizona, less geographically-extensive milkweed species, such as A. subverticillata (whorled milkweed), A. subulata (rush milkweed), A. asperula (spider milkweed), A. tuberosa (butterfly weed), and A. erosa (desert milkweed), are the primary host plants, yet these species appear to occur in different habitat types. For example, A. subverticillata, A. tuberosa, and A. asperula tend to occupy higher elevation areas, compared to A. erosa and A. subulata which appear to favor lower elevation, more arid areas. These areas may benefit from further studies that explore more fine-scale associations between environmental associations and milkweed occurrence, in order to guide the selection of potential restoration species.
The area that had the highest diversity of milkweed species was clearly the California floristic province, which contained both A. speciosa and A. fascicularis as well as a number of milkweed species that were less common throughout the range such as A. eriocarpa, A. californica (California milkweed), and A. cordifolia (heartleaf milkweed). Areas north of San Francisco Bay and in the mountain ranges of southern California were predicted to be suitable for as many as four or five milkweed species. Areas inland from the central coast and parts of the Sacramento Valley were also projected to have high species richness with suitability for three to four species of milkweed. Restoration of milkweed in the California floristic province should take into account the high species diversity, and California, like Arizona, may benefit from finer-scale studies of environmental associations and milkweed occurrence, in order to identify which milkweed species may be suitable for restoration in particular locations.
These results can serve as a baseline against which future habitat models for the western monarch and milkweeds can be compared, and could be used to guide future sampling efforts, in order to maximize knowledge gained relative to effort expended. Compared to a similarly large-extent habitat modeling effort that used occurrence records prior to 2016 (Steele et al., 2016), we were able to model additional milkweed species (13 rather than five) and had better validation statistics for both monarchs (validation AUC increased from 0.7 to 0.834 for the breeding model) and milkweeds (validation AUC increased 0.157 on average for the five species in common between the studies). Because the methods in the two studies (Steele et al., 2016 and the present study) were similar, we attribute the improved validation statistics to the larger-scale and geographically more widespread efforts to capture data on monarch occurrences. These efforts coordinated and focused field collection techniques and data sharing between the Xerces Society, the U. S. Fish and Wildlife Service, the Washington Department of Fish and Wildlife and the Idaho Department of Fish and Game, which enhanced data collection throughout Nevada, Washington, and Idaho, and specifically on wildlife refuges in Oregon, Washington, and Idaho.
One of our chief biological findings is that the monarch larval host plants of the genus Asclepias varied greatly in their abiotic habitat associations, while monarch habitat models were more consistent (among adult, breeding, and all-record models) and largely shaped by host plant associations (Figure 2). Thus, the monarch butterfly in the western U. S. is indeed a habitat generalist, a condition which can be considered an epiphenomenon of host specialization in a region where the host plants are diverse and include species with specific and divergent habitat requirements. The relatively minimal direct influence of climatic factors in monarch models (Figure 2) is generally in agreement with a recent analysis of inter-annual variation in observations across the Northern California breeding range by Espeset et al. (2016), who found a positive influence of warmer temperatures and (to a lesser extent) spring precipitation on the probability of observing monarchs during the breeding season, but with most of the inter-annual variation left unexplained by climatic factors. It is also in agreement with the findings of Lemoine (2015), who found that milkweed distributions appear to be a much stronger predictor of monarch distributions than climate alone.
With respect to determinants of milkweed habitat, different species had idiosyncratic climatic associations while generally sharing a common response to land cover that was an important variable in seven out of 13 milkweed models. Somewhat surprisingly, topographic variables were only important for four species and soil variables were only important for one milkweed species. The role of climate in shaping plant species distribution has been well-documented in ecology since the time of Merriam (1895). Indeed, climatic variables are typically among the most predictive variables when it comes to species distribution models conducted at broad spatial scales. However, the lack of importance for soil and topographic variables was especially surprising for the milkweed species, especially given that there have been increasingly strong calls for the inclusion of soil variables into species distribution models for plants (Bertrand et al., 2012; Diekmann et al., 2015; Velazco et al., 2017), and the recent improvements in spatial prediction of soil variables (Chaney et al., 2016; Ramcharan et al., 2018). It is possible that, although important, the soils and topographic variables may be more predictive at both finer spatial scales and more limited spatial extents.
Further research is needed to assess how different species of milkweeds may promote or hinder different life history stages of the monarch butterfly. In any event, the lack of geographic overlap among many of the milkweed species may offer restoration practitioners an opportunity to plant or restore milkweed species that are climatically suited to their area in regions where planting milkweed is an appropriate conservation strategy. It should be noted that none of our results either support or refute the idea that milkweed availability is a limiting factor for the western monarch or that a lack of milkweed has led to the recent decline in monarch numbers in the West (for comparison, see Inamine et al., 2016; Thogmartin et al., 2017 for discussions of milkweed limitation and other factors affecting the eastern monarch migration). The results of the breeding model identify geographic areas, which are suitable and important for monarch breeding, and which could be prioritized for protection and targeted habitat management efforts that consider the needs of monarchs. In areas which are highly suitable for milkweed and monarch breeding, but which may have lost habitat, habitat restoration including planting milkweed and nectar plants, may be appropriate. For example, restoration might be particularly impactful in the Central Valley of California, which this study identified as highly suitable for monarch breeding and Asclepias fascicularis (as well as multiple other milkweed species within the Sacramento Valley) but which has undergone major changes in land use due to conversion of grassland and shrubland to agriculture and urban or ex-urban development (Lark et al., 2015; Sleeter, 2016) and intensification of farming with increased pesticide use. It is also important to note that areas which show low suitability for specific milkweed species or monarchs, but which also have high uncertainty values, may indeed be more suitable if additional data was collected and added to future iterations of modeling. These areas should not be considered low priority for protection or restoration necessarily; they are simply data deficient.
Other conservation uses for these models include planning and monitoring. Landowners and managers can identify which milkweed species that they might expect on their lands and develop appropriate actions to identify and conserve those milkweeds. Conservation actions may include abstaining from mowing or treating milkweeds with herbicides. Our models can also be used to identify data gaps. For example, areas that are projected to have high suitability may be ideal locations to identify new populations of milkweeds and areas of high model uncertainty are areas that may benefit from additional data collection. The maps resulting from this work may also be useful for identifying potential sites for long-term monitoring. These maps may be important tools for incorporation into other conservation plans, such as multi-species connectivity plans, where the benefits of monarch habitat conservation may be augmented by benefits accrued from conserving other species. Finally, the data and habitat modeling techniques used in this study can be adopted to finer spatial or temporal scales using higher-resolution covariates (such land cover models derived from high resolution imagery ~1 m cell size) and occurrence data that is local to that area of interest. These scaled-down habitat models may be useful for restoration planning and provide insights regarding local patterns of habitat selection within a portion of the range or within a temporal subset.
Along with the tremendous advantages of using citizen-science and museum databases (Ries and Oberhauser, 2015), our study highlights a number of challenges associated with these types of data. To minimize spatial bias in occurrences, we applied geographic thinning of the occurrence data, a widely practiced, and effective method for dealing with sampling bias (Kramer-Schadt et al., 2013). However, this resulted in a large number of occurrence points that could not be used because they were spatially redundant, usually between 2 and 40 times the number of occurrences used in modeling. The Western Monarch and Milkweed Mapper website and database (Xerces Society, 2018)—which contains all the data used in this study and more recently contributed records—could be used to coordinate efforts to conduct a more geographically representative sampling of milkweed and monarch populations across the western U. S., potentially reducing the costs and maximizing the benefits obtained from sampling. Additional survey efforts in areas west of the Continental Divide in New Mexico, Colorado, Wyoming, and Montana will be particularly important in understanding the relative importance of these habitats to the western monarch population.
Another challenge in working with museum databases in particular, and in many cases with citizen-science databases, is the lack of true absence data. Although methods exist to help deal with these issues, such as target-group sampling (Ponder et al., 2001), they rely on the assumption that the lack of a presence of one species can be treated as an absence of another species. This assumes that occurrence points are being contributed by trained observers who are equally likely to report other species if present. With our citizen-science and museum databases and varied taxa (different butterfly life history stages and multiple host plants) this assumption could not be met. Modification of the Western Monarch Milkweed Mapper and other citizen-science databases to incorporate information regarding search effort across species could allow the database to be used to perform presence-absence habitat modeling rather than just presence-background modeling. Where available, such as within portions of the National Wildlife Refuge System, presence-absence data can also be used to perform local calibration of the models to probability of occurrence. This would be valuable given the strong assumptions that the default logistic transformation in Maxent software makes (Merow et al., 2013).
Finally, we should note that our modeling approach is correlative and not intended for the inference of direct causation, although basic ecological knowledge suggests that causality undoubtedly underlies many of the patterns including the connection between milkweed habitat and monarch presence. The habitat associations reported here could be considered a starting point for common garden experiments designed to assess germination and growth of milkweed species under different abiotic conditions, and to assess monarch preference for and development on different hosts and under different conditions (Robertson et al., 2015; Hoang et al., 2017). The latter issue (monarch performance on different host species) is particularly important given the diversity of hosts used by the western monarch, and the extent to which different hosts appear to have distinct associations with climate. Such field studies could be combined with gridded environmental covariates to make predictive maps that could be compared with the maps produced from this study. Future efforts could also incorporate more complete habitat associations for the most widespread milkweeds (extending beyond our focal western states), as well as the mapping of habitat suitability for the California overwintering sites, which was beyond the scope of our present efforts (but see Fisher et al., 2018). In summary, it is our hope that the results presented here both advance our basic understanding of the biology of a widespread and relatively well-studied insect, as well as provide an important tool for conservation biologists and land managers.
Author Contributions
TD, MS, JE, EP, SJ, SB, and MF conceived and designed the study. TD, MS, EP, SM, AT, CF, EC, and DC designed and built the database. TD, MS, and MF performed the analysis. TD, MS, EP, SJ, and MF wrote sections of the manuscript. All authors provided edits and comments for the manuscript.
Funding
Financial support for this work came from the U.S. Fish and Wildlife Service and the Xerces Society for Invertebrate Conservation. MF was additionally supported by a Trevor James McMinn professorship.
Conflict of Interest Statement
The authors declare that the research was conducted in the absence of any commercial or financial relationships that could be construed as a potential conflict of interest.
Acknowledgments
We thank all of the scientists, both citizen scientists and professionals, who have contributed monarch observations over the years, and we thank those that contributed ideas to the earlydevelopment of the analyses and models presented here, especially Aaron Jones, Erin Stockenberg, and Samantha Marcum.
Supplementary Material
The Supplementary Material for this article can be found online at: https://www.frontiersin.org/articles/10.3389/fevo.2019.00188/full#supplementary-material
References
Anderson, R. P., and Gonzalez, I. Jr. (2011). Species-specific tuning increases robustness to sampling bias in models of species distributions: an implementation with Maxent. Ecol. Model. 222, 2796–2811. doi: 10.1016/j.ecolmodel.2011.04.011
Bachelet, D. (2013). AdaptWest-A Climate Adaptation Conservation Planning Database for Western North America. Available online at: https://adaptwest.databasin.org/ (accessed December 2, 2015).
Bertrand, R., Perez, V., and Gégout, J. C. (2012). Disregarding the edaphic dimension in species distribution models leads to the omission of crucial spatial information under climate change: the case of Quercus pubescens in France. Glob. Change Biol. 18, 2648–2660. doi: 10.1111/j.1365-2486.2012.02679.x
Brook, B. W., Sodhi, N. S., and Bradshaw, C. J. A. (2008). Synergies among extinction drivers under global change. Trends Ecol. Evol. 23, 453–460. doi: 10.1016/j.tree.2008.03.011
Brower, L. P., Taylor, O. R., Williams, E. H., Slayback, D. A., Zubieta, R. R., Ramírez, M. I., et al. (2012). Decline of monarch butterflies overwintering in Mexico: is the migratory phenomenon at risk? Insect Conserv. Diver. 5, 95–100. doi: 10.1111/j.1752-4598.2011.00142.x
Chaney, N. W., Wood, E. F., McBratney, A. B., Hempel, J. W., Nauman, T. W., Brungard, C. W., et al. (2016). POLARIS: A 30-meter probabilistic soil series map of the contiguous United States. Geoderma 274, 54–67. doi: 10.1016/j.geoderma.2016.03.025
Daly, C., Halbleib, M., Smith, J. I., Gibson, W. P., Doggett, M. K., Taylor, G. H., et al. (2008). Physiographically sensitive mapping of climatological temperatureand precipitation across the conterminous United States. Int. J. Climatol. 28, 2031. doi: 10.1002/joc.1688
Diekmann, M., Michaelis, J., and Pannek, A. (2015). Know your limits–The need for better data on species responses to soil variables. Basic Appl. Ecol. 16, 563–572. doi: 10.1016/j.baae.2015.08.010
Dingle, H., Zalucki, M. P., Rochester, W. A., and Armijo-Prewitt, T. (2005). Distribution of the monarch butterfly, Danaus plexippus (L.) (Lepidoptera: Nymphalidae), in western North America. Biol. J. Linn. Soc. 85, 491–500. doi: 10.1111/j.1095-8312.2005.00512.x
Dobrowski, S. Z., Abatzoglou, J., Swanson, A. K., Greenberg, J. A., Mynsberge, A. R., Holden, Z. A., et al. (2013). The climate velocity of the contiguous United States during the 20th century. Global Change Biol. 19, 241–251. doi: 10.1111/gcb.12026
Drechsler, M., Frank, K., Hanski, I., O'Hara, R. B., and Wissel, C. (2003). Ranking metapopulation extinction risk: from patterns in data to conservation management decisions. Ecol. Appl. 13, 990–998. doi: 10.1890/1051-0761(2003)13[990:RMERFP]2.0.CO;2
Espeset, A. E., Harrison, J. G., Shapiro, A. M., Nice, C. C., Thorne, J. H., Waetjen, D. P., et al. (2016). Understanding a migratory species in a changing world: climatic effects and demographic declines in the western monarch revealed by four decades of intensive monitoring. Oecologia 181, 819–830. doi: 10.1007/s00442-016-3600-y
Evans, J. S., Oakleaf, J., Cushman, S. A., and Theobald, D. (2014). An ArcGIS Toolbox for Surface Gradient and Geomorphometric Modeling, Version 2.0-0. Available online at: http://evansmurphy.wix.com/evansspatial (accessed December 2, 2015).
Fielding, A. H., and Bell, J. F. (1997). A review of methods for the assessment of prediction errors in conservation presence/absence models. Environ. Conserv. 24, 38–49. doi: 10.1017/S0376892997000088
Fisher, A., Saniee, K., van der Heide, C., Griffiths, J., Meade, D., and Villablanca, F. (2018). Climatic niche model for overwintering monarch butterflies in a topographically Complex region of California. Insects 9:167. doi: 10.3390/insects9040167
Fourcade, Y., Engler, J. O., Rödder, D., and Secondi, J. (2014). Mapping species distributions with MAXENT using a geographically biased sample of presence data: a performance assessment of methods for correcting sampling bias. PLoS ONE 9:e97122. doi: 10.1371/journal.pone.0097122
Guisan, A., and Thuiller, W. (2005). Predicting species distribution: offering more than simple habitat models. Ecol. Lett. 8, 993–1009. doi: 10.1111/j.1461-0248.2005.00792.x
Gustafsson, K. M., Agrawal, A. A., Lewenstein, B. V., and Wolf, S. A. (2015). The monarch butterfly through time and space: the social construction of an icon. BioSci 65, 612–622. doi: 10.1093/biosci/biv045
Hijmans, R. J., Cameron, S. E., Parra, J. L., Jones, P. G., and Jarvis, A. (2005). Very high resolution interpolated climate surfaces for global land areas. Int. J. Climatol. 25, 1965–1978. doi: 10.1002/joc.1276
Hoang, K., Tao, L., Hunter, M. D., and de Roode, J. C. (2017). Host diet affects the morphology of monarch butterfly parasites. J. Parasitol. 103, 228–236. doi: 10.1645/16-142
Inamine, H., Ellner, S. P., Springer, J. P., and Agrawal, A. A. (2016). Linking the continental migratory cycle of the monarch butterfly to understand its population decline. Oikos 125, 1081–1091. doi: 10.1111/oik.03196
Iturbide, M., Bedia, J., Herrera, S., del Hierro, O., Pinto, M., and Gutiérrez, J. M. (2015). A framework for species distribution modelling with improved pseudo-absence generation. Ecol. Modell. 312, 166–174. doi: 10.1016/j.ecolmodel.2015.05.018
Kramer-Schadt, S., Niedballa, J., Pilgrim, J. D., Schröder, B., Lindenborn, J., Reinfelder, V., et al. (2013). The importance of correcting for sampling bias in MaxEnt species distribution models. Divers. Distrib. 19, 1366–1379. doi: 10.1111/ddi.12096
Lark, T. J., Salmon, J. M., and Gibbs, H. K. (2015). Cropland expansion outpaces agricultural and biofuel policies in the United States. Environ. Res. Lett. 10:044003. doi: 10.1088/1748-9326/10/4/044003
Lemoine, N. P. (2015). Climate change may alter breeding ground distributions of eastern migratory monarchs (Danaus plexippus) via range expansion of Asclepias host plants. PLoS ONE 10:e0118614. doi: 10.1371/journal.pone.0118614
Lozier, J. D., Strange, J. P., and Koch, J. B. (2013). Landscape heterogeneity predicts gene flow in a widespread polymorphic bumble bee, Bombus bifarius (Hymenoptera: Apidae). Conserv. Genet. 14, 1099–1110. doi: 10.1007/s10592-013-0498-3
Malcolm, S. B. (2018). Anthropogenic impacts on mortality and population viability of the monarch butterfly. Ann. Rev. Entomol. 63, 277–302. doi: 10.1146/annurev-ento-020117-043241
Martin, T. G., Chadès, I., Arcese, P., Marra, P., Possingham, H. P., and Norris, D. R. (2007). Optimal conservation of migratory species. PLoS ONE 2:e751. doi: 10.1371/journal.pone.0000751
Merow, C., Smith, M. J., and Silander Jr, J. A. (2013). A practical guide to MaxEnt for modeling species' distributions: what it does, and why inputs and settings matter. Ecography 36, 1058–1069. doi: 10.1111/j.1600-0587.2013.07872.x
Merriam, C. H. (1895). “Geographic distribution of animals and plants in North America.” in USDA Yearbook, 203–214.
Morris, G. M., Kline, C., and Morris, S. M. (2015). Status of Danaus plexippus population in Arizona. J. Lep. Soc. 69, 91–107. doi: 10.18473/lepi.69i2.a10
Oberhauser, K., Wiederholt, R., Diffendorfer, J. E., Semmens, D., Ries, L., Thogmartin, W. E., et al. (2017). A trans-national monarch butterfly population model and implications for regional conservation priorities. Ecol. Entomol. 42, 51–60. doi: 10.1111/een.12351
Phillips, S. J., Anderson, R. P., and Schapire, R. E. (2006). Maximum entropy modeling of species geographic distributions. Ecol. Modell. 190, 231–259. doi: 10.1016/j.ecolmodel.2005.03.026
Ponder, W. F., Carter, G. A., Flemons, P., and Chapman, R. R. (2001). Evaluation of museum collection data for use in biodiversity assessment. Conserv. Biol. 15, 648–657. doi: 10.1046/j.1523-1739.2001.015003648.x
Pyle, R. M. (2015). “Monarchs in the mist: new perspectives on monarch distributions in the Pacific Northwest,” in Monarchs in a Changing World: Biology and Conservation Of An Iconic Butterfly (Ithaca: Cornell University Press), 236–246.
Radosavljevic, A., and Anderson, R. P. (2014). Making better Maxent models of species distributions: complexity, overfitting and evaluation. J. Biogeogr. 41, 629–643. doi: 10.1111/jbi.12227
Ramcharan, A., Hengl, T., Nauman, T., Brungard, C., Waltman, S., Wills, S., et al. (2018). Soil property and class maps of the conterminous United States at 100-meter spatial resolution. Soil Sci. Soc. Am. J. 82, 186–201. doi: 10.2136/sssaj2017.04.0122
Ries, L., and Oberhauser, K. (2015). A citizen army for science: quantifying the contributions of citizen scientists to our understanding of monarch butterfly biology. BioScience 65, 419–430. doi: 10.1093/biosci/biv011
Robertson, G. F., Zalucki, M. P., and Paine, T. D. (2015). Larval host choice of the monarch butterfly (Danaus plexippus L.) on four native California desert milkweed species. J. Insect Behav. 28, 582–592. doi: 10.1007/s10905-015-9524-2
Rollins, M. G. (2009). LANDFIRE: a nationally consistent vegetation, wildland fire,and fuel assessment. Int. J. Wildland Fire 18, 235–249. doi: 10.1071/WF08088
Satterfield, D. A., Maerz, J. C., Hunter, M. D., Flockhart, D. T., Hobson, K. A., Norris, D. R., et al. (2018). Migratory monarchs that encounter resident monarchs show life-history differences and higher rates of parasite infection. Ecol. Lett. 21, 1670–1680. doi: 10.1111/ele.13144
Satterfield, D. A., Villablanca, F. X., Maerz, J. C., and Altizer, S. (2016). Migratory monarchs wintering in California experience low infection risk compared to monarchs breeding year-round on non-native milkweed. Integr. Comp. Biol. 56, 343–352. doi: 10.1093/icb/icw030
Schultz, C. B., Brown, L. M., Pelton, E., and Crone, E. E. (2017). Citizen science monitoring demonstrates dramatic declines of monarch butterflies in western North America. Biol. Conserv. 214, 343–346. doi: 10.1016/j.biocon.2017.08.019
Semmens, B. X., Semmens, D. J., Thogmartin, W. E., Wiederholt, R., López-Hoffman, L., Diffendorfer, J. E., et al. (2016). Quasi-extinction risk and population targets for the Eastern, migratory population of monarch butterflies (Danaus plexippus). Sci. Rep. 6:23265. doi: 10.1038/srep23265
Shaffer, M. L., and Stein, M. A. (2000). “Safeguarding our precious heritage,” in Precious Heritage: The Status of Biodiversity in the United States,” eds B. A. Stein, L. S. Kutner, and J. S. Adams (New York, NY: Oxford University Press), 301–321.
Sleeter, B. M. (2016). Land Cover Trends Project: Central Valley Report. Menlo Park, CA: U.S. Geological Survey; Western Geographic Science Center. Available online at: https://landcovertrends.usgs.gov/west/eco7Report.html
Steele, M., Engler, J. D., Cruz, L., Jepsen, S., Black, S., Taylor, A., et al. (2016). Phase I: Western Monarch and Milkweed Habitat Suitability Modeling Project- MaxEnt Model Outputs. Available online at: https://ecos.fws.gov/ServCat/Reference/Profile/56630 (accessed January 19, 2017).
Stevens, S. R., and Frey, D. F. (2010). Host plant pattern and variation in climate predict the location of natal grounds for migratory monarch butterflies in western North America. J. Insect Conserv. 14, 731–744. doi: 10.1007/s10841-010-9303-5
Thogmartin, W. E., Wiederholt, R., Oberhauser, K., Drum, R. G., Diffendorfer, J. E., Altizer, S., et al. (2017). Monarch butterfly population decline in North America: identifying the threatening processes. R. Soc. Open Sci. 4, 170–760. doi: 10.1098/rsos.170760
Van Der Wal, Shoo, L. P., Graham, C., and Williams, S. E. (2009). Selecting pseudo-absence data for presence-only distribution modeling: how far should you stray from what you know? Ecol. Modell. 220, 589–594. doi: 10.1016/j.ecolmodel.2008.11.010
Velazco, S. J. E., Galvão, F., Villalobos, F., and Júnior, P. D. M. (2017). Using worldwide edaphic data to model plant species niches: an assessment at a continental extent. PLoS ONE 12:e0186025 doi: 10.1371/journal.pone.0186025
Wang, T., Hamann, A., Spittlehouse, D. L., and Murdock, T. Q. (2012). ClimateWNA—high-resolution spatial climate data for western North America. J. Appl. Meteorol. Climatol. 51, 16–29. doi: 10.1175/JAMC-D-11-043.1
Warren, D. L., and Seifert, S. N. (2011). Ecological niche modeling in Maxent: the importance of model complexity and the performance of model selection criteria. Ecol. Appl. 21, 335–342. doi: 10.1890/10-1171.1
Warren, D. L., Wright, A. N., Seifert, S. N., and Shaffer, H. B. (2014). Incorporating model complexity and spatial sampling bias into ecological niche models of climate change risks faced by 90 California vertebrate species of concern. Divers. Distrib. 20, 334–343. doi: 10.1111/ddi.12160
Western Monarch Milkweed Occurrence Database (2018). Data Accessed From the Western Monarch Milkweed Mapper, a Project by the Xerces Society. U.S. Fish and Wildlife Service; Idaho Department of Fish and Game, and Washington Department of Fish and Wildlife. Available online at: https://www.monarchmilkweedmapper.org (accessed January 15, 2017).
Yang, L. H., Ostrovsky, D., Rogers, M. C., and Welker, J. M. (2016). Intra-population variation in the natal origins and wing morphology of overwintering western monarch butterflies Danaus plexippus. Ecography 39, 998–1007. doi: 10.1111/ecog.01994
Keywords: monarch butterfly, Danaus plexippus, milkweed, Asclepias, habitat, species distribution model, MAXENT, citizen-science
Citation: Dilts TE, Steele MO, Engler JD, Pelton EM, Jepsen SJ, McKnight SJ, Taylor AR, Fallon CE, Black SH, Cruz EE, Craver DR and Forister ML (2019) Host Plants and Climate Structure Habitat Associations of the Western Monarch Butterfly. Front. Ecol. Evol. 7:188. doi: 10.3389/fevo.2019.00188
Received: 05 December 2018; Accepted: 08 May 2019;
Published: 29 May 2019.
Edited by:
Jay E. Diffendorfer, United States Geological Survey, United StatesReviewed by:
Vijay Barve, Florida Museum of Natural History, United StatesAttila D. Sándor, University of Agricultural Sciences and Veterinary Medicine of Cluj-Napoca, Romania
Xiao Feng, University of Arizona, United States
Copyright © 2019 Dilts, Steele, Engler, Pelton, Jepsen, McKnight, Taylor, Fallon, Black, Cruz, Craver and Forister. This is an open-access article distributed under the terms of the Creative Commons Attribution License (CC BY). The use, distribution or reproduction in other forums is permitted, provided the original author(s) and the copyright owner(s) are credited and that the original publication in this journal is cited, in accordance with accepted academic practice. No use, distribution or reproduction is permitted which does not comply with these terms.
*Correspondence: Matthew L. Forister, bWZvcmlzdGVyQHVuci5lZHU=