 Karen E. Kinkead
 Tyler M. Harms
 Stephen J. Dinsmore
 Paul W. Frese
 Kevin T. Murphy
- 1Iowa Department of Natural Resources, Boone, IA, United States
- 2Department of Natural Resource Ecology and Management, Iowa State University, Ames, IA, United States
- 3Center for Survey Statistics and Methodology, Iowa State University, Ames, IA, United States
The Iowa Multiple Species Inventory and Monitoring (MSIM) Program includes a protocol for monitoring butterfly density on conservation lands using transects. Most data are collected from sites chosen randomly; additional sites are chosen non-randomly for other reasons. We analyzed a 12-year dataset for monarchs to address how density (per 50 m2 transect section) responded to site selection (random vs. non-random), latitude, and measures of the amount of milkweed and canopy cover on survey transects. Between 2006 and 2017, we conducted 2,328 surveys on 420 sites and detected a total of 2,757 adult monarchs. Monarch densities peaked in 2010 for random sites and 2012 for non-random sites, but densities were lowest in 2013 for both site types. The density of monarchs at non-random transects (0.047, 95% CI = 0.031, 0.062) was higher than that at random transects (0.029, 95% CI = 0.019, 0.044) and the temporal trends of density for random and non-random sites were significantly different. Monarch density was positively correlated with UTM northing, suggesting that monarch density increases from south to north in Iowa. The percent of plots containing milkweed was positively correlated with monarch density whereas percent tree canopy cover was negatively correlated with monarch density. Our results show that non-random transects had more monarchs, which may be a concern when interpreting findings from some citizen science efforts that used non-probabilistic sampling designs. Collectively, the MSIM program data provide a comprehensive assessment of monarch densities statewide as well as the first empirically-derived density estimates for monarchs on the breeding grounds and may prove helpful when refining future monitoring efforts.
Introduction
The monarch butterfly (Danaus plexippus [L.]) has become a species of interest recently due to declines seen in the overwintering territories in Mexico (Brower et al., 2012; Vidal and Rendón-Salinas, 2014; Monarch Watch Blog, 2018) and the risk of quasi-extinction of 11-57% in the next 20 years (Semmens et al., 2016). This decline led to a petition of the U.S. Fish and Wildlife Service in 2014 to list the monarch as a threatened species (Center for Biological Diversity, 2014) as well as a presidential memorandum calling for the restoration of pollinator habitat in the U.S. to benefit monarchs (Office of the Press Secretary, 2014). The attention stimulated research across the U.S. to evaluate the status of migratory monarch populations and to investigate potential factors leading to monarch population declines (Vidal and Rendón-Salinas, 2014; Badgett and Davis, 2015; Flockhart et al., 2015; Ries et al., 2015; Schultz et al., 2017; Thogmartin et al., 2017).
The Upper Midwest region of the U.S. has long been considered the primary breeding ground for the monarch (Wassenaar and Hobson, 1998; Flockhart et al., 2017). Various projects have tracked monarch numbers through transect based surveys during fall migration in Michigan (Badgett and Davis, 2015), plot based surveys of 15-mile diameter during the 4th of July Butterfly counts (Swengel, 1990, 1995), and a meta-analysis of the 4th of July data and transect based surveys in Illinois (Ries et al., 2015), although few of those studies utilized randomly chosen locations. Randomization, however, is critical if the study objective involves providing the best estimate of a population trend over a large, variable space (Thompson, 1992; Pollack et al., 2002).
Many authors have suggested that breeding habitat in the Upper Midwest is limiting (Flockhart et al., 2015; Thogmartin et al., 2017). Recent habitat loss in this area has been directly linked to declines in the eastern migratory population of the monarch (Pleasants and Oberhauser, 2013; Flockhart et al., 2015). This habitat loss is characterized mostly by a decrease in milkweed plant stems (in the Asclepiadoideae subfamily), the only larval host plant for monarchs. In Iowa, the number of agricultural fields occupied by Common Milkweed (Asclepias syriaca) declined by 90% from 1999 to 2009 (Hartzler, 2010) and more recent estimates from throughout the Upper Midwestern area of the U.S. suggest milkweed declines of nearly 40% (Pleasants, 2017). Despite studies establishing the loss of milkweed as a significant contributor to monarch population declines in the U.S., there are still some (e.g., Davis and Dyer, 2015 [although see (Pleasants et al., 2016) for rebuttal], Inamine et al., 2016 [but see (Pleasants et al., 2017) for rebuttal]) that feel current monitoring programs do not illuminate the need for additional habitat in the breeding areas. These differences have led many organizations (e.g., State Fish and Game Agencies) to express the need for large scale monitoring within the breeding zones to complement efforts to increase breeding habitat.
While various efforts have tracked monarch numbers at large spatial scales (Swengel, 1995; Badgett and Davis, 2015; Ries et al., 2015), these projects relied on data collected by citizen scientists on targeted survey sites selected using a non-probabilistic sampling design. Several studies have documented the value of opportunistic citizen science data for a variety of purposes, which include tracking migration patterns (Oberhauser et al., 2015; Supp et al., 2015) and monitoring distribution trends using occupancy models (Van Strien et al., 2013). At issue is whether data collected on sites using a non-probabilistic sampling design are appropriate for making inferences on a broad issue such as declining monarch population trends in the U.S. Non-probabilistic, or targeted, sampling introduces subjectivity into the study design, which can lead to biased results and incorrect inference (Williams et al., 2001). For example, when allowed to choose sites for surveying butterflies, participants often gravitate toward parks, preserves, and other non-randomly selected natural areas likely to have higher densities of the species of interest because of expectations about finding the target species more often. This situation becomes problematic for a generalist species like the monarch, which has long used a variety of “marginal” habitats such as the edges of agricultural fields and rights-of-ways that are less likely to be surveyed in a targeted effort (Pleasants et al., 2017). Monarchs may be more abundant and more likely to persist in natural areas because these areas are less likely to lose milkweed and other native nectar sources important to monarchs compared to more marginal habitats listed above. Therefore, patterns observed on surveys of targeted sites may not be representative of those occurring more broadly, and this introduces risk of making the wrong decisions about conservation actions for a declining species.
In addition to examining the possible differences between targeted and probabilistic sampling locations, our dataset can provide information on the annual variation in adult monarchs on breeding grounds in Iowa. These densities are also compared to the overwintering numbers. Using covariates, we can look at possible influences of tree canopy cover, milkweed presence, and latitude on adult monarch densities. Our study was not designed for adult monarchs in particular, but monarchs are one of the many species we have tracked.
Materials and Methods
Study Area and Multiple Species Inventory and Monitoring Program
Iowa's Multiple Species Inventory and Monitoring program (MSIM) was designed to record data on taxonomic groups which have species designated as those of greatest conservation need (SGCN) within the Iowa Wildlife Action Plan (Zohrer, 2006; Iowa Department of Natural Resources, 2015). Although target organisms are those SGCN, we record data on all species of the designated taxon observed as we are not able to predict which common species may become rare in the future and vice versa. When Iowa's MSIM program began, monarchs were not SGCN. When the IWAP was revised in 2015, however, monarchs were added as SGCN (Iowa Department of Natural Resources, 2015). Our data collection began in 2006 and continues through today.
While the MSIM program surveys properties chosen using a stratified random sampling approach, our protocols are available to everyone wishing to complete surveys on properties of interest (Iowa Department of Natural Resources, 2016). As long as the field methodology is followed and data are collected in Iowa, we will accept data from projects where the properties were not chosen randomly. For example, some of our property managers have implemented habitat management practices specifically for non-game birds and butterflies on public grassland areas. Others may be interested in developing management plans and have provided additional staff or funding to document species prior to changes in habitat management. These additional “non-random” properties have allowed our program to examine potential differences seen when properties are chosen randomly for monitoring broad trends as opposed to chosen non-randomly to answer a specific local question (e.g., “I've done specific habitat management, what species are here now?”). While our dataset encompasses both public and privately-owned properties, all but two are associated with conservation in some manner and therefore are not representative of the larger landscape in Iowa. Our privately-owned properties have been enrolled in some form of conservation program (e.g., Landowner Incentive Program, Conservation Reserve Program, Wetland Reserve Program, etc.). While some of the tracts on public property include corn or soybean food plots planted either for wildlife or to prep the field for a grassland planting, these practices are not representative of high production farm practices in Iowa. Our two non-conservation oriented sites were fields on an Iowa State University Research Farm (one corn and one soybean) surveyed in 2016. These two fields were also part of the non-randomly chosen sites as their purpose was to assist us in assessing potential damage to crops should the MSIM Program incorporate true agricultural lands in the future.
Site Selection
Since the MSIM program surveys for 9 taxonomic groups across all habitat types, the majority of properties (n = 333) surveyed for these analyses were chosen by following the methodology described in Harms et al. (2014). Additional properties have been chosen since that time using a straight random selection process without regard to habitat classification as the revised IWAP (Iowa Department of Natural Resources, 2015) utilized different habitat classifications.
An additional 87 sites were included in the analyses as the MSIM field protocols were followed. These sites represent a mix of federal, state, county, and privately owned lands where the property managers were interested in learning more about the species that occur on those lands due to either the property being a recent acquisition or in the process of having new management plans developed. None of these areas were chosen randomly, but rather, were targeted by the property manager as areas they expected to have a high amount of wildlife diversity of all taxa of interest. A subset of the randomly selected properties are surveyed every year but the majority of both property types have been surveyed 1-2 years only.
Butterfly Surveys
Our butterfly protocol consists of a modified Pollard walk (Pollard and Yates, 1993) that allows the estimation of density (number of monarchs per 50-meter2). We also conduct timed Visual Encounter Surveys where the technician walks through, in their opinion, the best quality butterfly habitat on the property in order to document rarer butterflies. Visual Encounter Survey data will not be reported in this manuscript. The modified Pollard walk entails recording data within different segments of the transect of known length, thereby allowing for the calculation of densities and the associated variation.
Every effort was made to place the center of the sampling area within the habitat for which the property was originally chosen, not necessarily the best butterfly habitat. A 200 m transect was then extended straight north and an additional 200 m transect was extended straight south from this point at most properties for a total transect length of 400 m. In some cases, properties features (e.g., lakes, rivers, etc.) prevented this placement and the transect was moved accordingly, always maintaining a total length of 400 m (perhaps broken into 2 segments) on the property. Transects are flagged in 10 m sections to assist the observers with knowing where they are in the transect. This flagging system creates a 5 meter-wide transect for the observer to follow.
Transects are walked up to four times per year at a pace of approximately 10 m per min. All butterfly species encountered within the transect are recorded, along with which transect segment the butterfly is in at the time of detection. Most transects are walked between June 1 and August 31, with at least 1 visit per month but transects may be walked earlier in May or later into September. Additional information about this protocol can be found in Chapter 12 of the MSIM Technical Manual (Iowa Department of Natural Resources, 2016). In a separate study that contributed to this dataset (Patterson, 2016), detection probability of monarchs on modified Pollard walks was very close to 1.00. Therefore, we did not estimate detection probability directly in this study.
Habitat Covariates
Local microhabitat covariates were collected on the property once during late summer and include estimates of tree canopy cover and the percentage of plots containing milkweed of any species. These data were collected in the field following the protocols outlined in Chapter 19 (Terrestrial Habitat Classification) of the MSIM Technical Manual (Iowa Department of Natural Resources, 2016). Canopy cover of trees is measured by taking four canopy cover estimates (“1” if present, “0” if absent) around the perimeter of each of the 0.017 ha vegetation plots in each of the four cardinal directions in the larger MSIM survey area. These values are then averaged together to give an overall percentage estimate for the property. Milkweed presence was recorded in the 1-m2 quadrats or the 5-min plant search. As such, these data were collapsed into “1” (milkweed species present) or “0” (no milkweed present) within each of the larger habitat plots on the property. The percent of the habitat survey plots which had at least 1 stem of milkweed of any genus on the property became our estimate of milkweed for that survey location.
Data Analyses
Prior to analyses, we truncated transects to those surveyed between May 16 and August 20 to decrease the likelihood of including migrating monarchs. These dates were chosen based on Journey North (2018) First Monarch reports in the spring and the table documenting peak migration by latitude produced by Monarch Watch (2018). While arrival and departure dates can change annually due to weather conditions, we chose these dates based on the majority of reports from Iowa to the listed organizations across the years. The median survey date for both random and non-random site types was within 2 weeks of 15 July each year and, due to our standardized sampling methodology, we do not expect survey timing to vary spatially.
After truncating our data set to the primary breeding season, we then split the breeding season into 3 monthly periods (16 May−15 June, 16 June−15 July, and 16 July−20 August) to allow for evaluation of seasonal densities throughout the breeding season. We treated transect section (n = 40) within each property (n = 420) as our primary sampling unit, and if surveyed in a given year, most transects were surveyed at least once during each time period. For transects that were surveyed more than once during a given time period, we aggregated monarch observations for each transect section within each transect by taking the maximum number of monarchs observed across all survey visits within the time period. We used the maximum count (as opposed to mean or minimum counts) for several reasons. First, the mean is not appropriate because our Poisson distribution (described later) requires the use of integers, so the mean would need to be rounded and this could introduce bias. Second, using the minimum count would result in many more zero counts, thereby missing non-zero counts on many sites. This resulted in a maximum of three survey visits to each transect within the primary breeding season for a given year. Because monarchs are multi-generational and are continuously migrating throughout the primary breeding season (Brower, 1996), we could not assume population closure at transects between time periods and therefore treated the survey visit within each time period in any given year as independent. Our final data set, consequently, included 69,560 transect section by time period combinations accounting for some properties having multiple transects and some transects being surveyed multiple years. Each sampling unit was a fixed area of 10 × 5 m. Henceforth we consider our response variable to be a maximum density of monarchs per 50 m2 survey area (monarch density).
Next, we developed a candidate set of models that evaluated the influence of various survey design factors and habitat variables on monarch density to inform both long-term monitoring and habitat management objectives. While several models could have been considered, we decided to focus our model development to estimate monarch density as a function of the covariates that directly addressed our hypotheses:
1. Random vs. non-random site type—we were interested in whether there was a difference in sites which were of particular interest to a property manager (i.e., non-random) vs. those chosen randomly. We hypothesized that the non-random, targeted sites would have a higher density of monarchs because those sites typically contained higher quality habitat and are managed to maintain this habitat.
2. Year—given the annual variation on the overwintering grounds in Mexico (Vidal and Rendón-Salinas, 2014), we expected to see similar annual variation in yearly densities in our study as well.
3. Spatial stratification—results from the Monarch Larval Monitoring Program (MLMP, Prysby and Oberhauser, 2004, K. Oberhauser pers. comm.) led us to hypothesize that the southern 3 tiers of counties in Iowa may be too hot to support larval development in July and August resulting in adult monarchs traveling further north for breeding. Therefore, we included the Universal Transect Mercator (i.e., UTM) northing as a covariate to capture potential variation in monarch density from south to north in Iowa.
4. Season—for similar reasons cited above for spatial stratification, we also modeled a seasonal effect on monarch density to capture potential influence of climatic effects throughout the breeding season.
5. Percentage of plots with milkweed present in the sampling site—given the various studies citing the importance of milkweed (e.g., Pleasants, 2017; Thogmartin et al., 2017), we predicted that sites where more plots had milkweed would have a higher density of adult monarchs.
6. Percent of tree canopy cover in the sampling unit—although considered an open habitat species (Schlicht et al., 2007) which will utilize agricultural areas (Pleasants, 2015), visual inspection of our data indicated that we did still detect monarchs in areas with tree canopy cover. Therefore, we wanted to explore this relationship formally in the analysis but hypothesized that tree canopy cover would not significantly influence monarch density.
We first developed a model to estimate the overall average monarch density throughout Iowa across all years (i.e., null model). We then modeled monarch density as a function of random vs. non-random site type. Next, we built two models to evaluate annual differences in monarch density, the first to estimate the overall average monarch density each year and the second to estimate monarch density on both random and non-random transects by year (e.g., Site Type*Year interaction). We treated year as a factor variable in both the aforementioned models in order to allow for non-linear variation in density across years, and treated site type as a factor variable in order to obtain individual estimates for each site type. Realizing that monarch density varied considerably by site type and year after evaluating the Site Type*Year model, we modeled all subsequent covariates as additive effects in the Site Type*Year model to capture any additional variability induced by those covariates. We first modeled the additive effect of UTM northing to determine if a south-to-north gradient in monarch density existed in Iowa (K. Oberhauser, pers. comm. and Prysby and Oberhauser, 2004). Next, we modeled an effect of season as a categorical covariate to assess differences, if any, in monarch density throughout the primary breeding season. We then modeled both percentage of plots with milkweed and percent tree canopy cover as separate additive effects in the Site Type*Year model to evaluate the influence of habitat covariates on monarch density. Lastly, to test for a difference in the temporal trend in density between random and non-random site types, we converted the year variable from factor to numeric and created a dummy binary variable to represent whether or not a site was randomly selected (i.e., 1 = randomly selected, 0 = not randomly selected). We then modeled monarch density against the interaction of the numeric year variable and the random dummy variable and evaluated the confidence interval of the interaction to determine if the temporal trend across years changed when sites were randomly selected. If the confidence interval did not include zero, we concluded that the temporal trend across years between random and non-random site types was different. We examined the correlation between point estimates of annual density from random and non-random sites using Pearson's product moment correlation and considered estimates significantly correlated if P ≤ 0.05.
We wanted to account for variability both among and within survey transects in addition to evaluating variability in monarch density in response to the above fixed effects. Therefore, we included a random intercept for site and a random intercept for sampling plot nested within site in each of the above models to capture the among- and within-transect variability, respectively. All models were fit using the “glmer” function within the package lme4 (Bates et al., 2015) in Program R (ver. 3.5.1; R Core Team, 2018). We modeled monarch density as a Poisson random variable accounting for over-dispersion and assumed a log-normal distribution for both random effects. We evaluated how well our top model addressed over-dispersion in the data by comparing the sum of the squared Pearson residuals to the residual degrees of freedom using a Chi-square test (see https://bbolker.github.io/mixedmodels-misc/glmmFAQ.html#testing-for-overdispersioncomputing-overdispersion-factor). We evaluated each model relative to one another using Akaike's Information Criterion (AIC) and considered the model with the lowest AIC value to have the strongest support (Burnham and Anderson, 2002). Importantly, we made inferences from multiple models because we chose the simplest model with a particular effect to address each of our original hypotheses. A table of overall model selection results is provided to indicate the relative importance of effects considered in our hypotheses. We scaled all covariates to aid in model convergence and interpretation of the regression coefficients. We considered fixed effects to have a significant influence on monarch density if their respective 95% confidence intervals did not include zero. We then predicted monarch density and associated 95% confidence interval as a function of fixed effects by conducting 1,000 simulations using the “bootMer” function within the package lme4 in Program R (R Core Team, 2018). We used the median of all simulated predictions as the density estimate, the 2.5th-percentile of all predictions as the lower confidence limit, and the 97.5th-percentile as the upper confidence limit.
Results
We surveyed a total of 420 sites throughout Iowa from 2006 to 2017 (Figure 1), 333 of which were randomly chosen and 87 were non-randomly selected (Table 1). A total of 1,904 and 424 surveys were conducted on random and non-random transects, respectively, resulting in a total of 2,757 adult monarch observations across all years. Percentage of sampled plots at a site that had milkweed averaged 11.4% (SE = 0.016) on non-random sites and 12.6% (SE = 0.008) on random sites. Percent tree canopy cover averaged 36.4% (SE = 0.029) on non-random sites and 41.5% (SE = 0.015) on random sites.
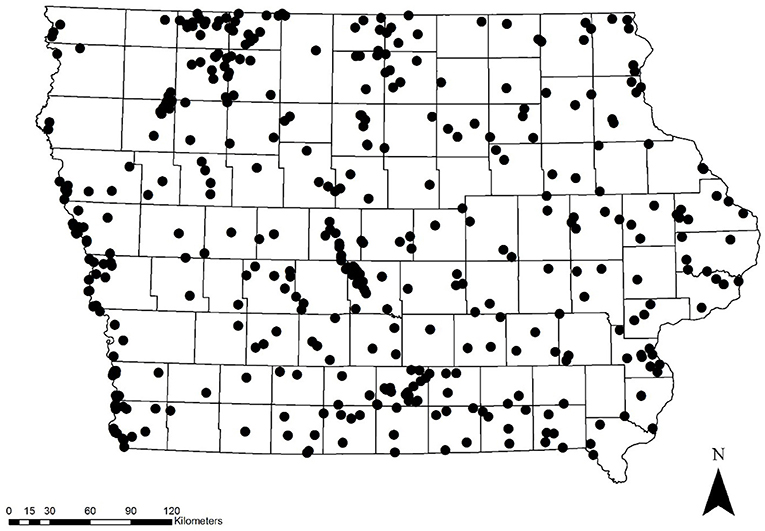
Figure 1. Map of site locations for monarch surveys in Iowa, 2006-2017.
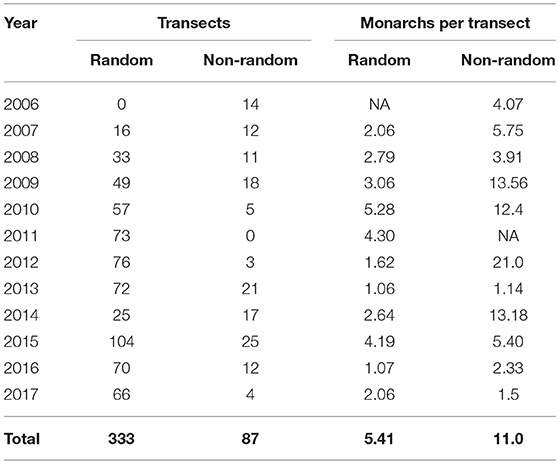
Table 1. Total number of random and non-random transects surveyed and the average number of monarchs seen per transect in Iowa, 2006–2017.
The ratio of the sum of squared Pearson residuals to the residual degrees of freedom from our top model was significantly < 1 (ratio = 0.723, P = 1.0), indicating our model adequately addressed over-dispersion in the data. The overall mean estimate of monarch density across all transects from 2006 to 2017 was 0.033 per 50-m2 (95% CI = 0.023, 0.049). Adult monarch density on random sites was lower than on non-random sites overall (0.029 per 50-m2 vs. 0.047 per 50-m2; β = −0.455, 95% CI = −0.794,−0.122; Figure 2) as well as site type by year (Figure 3). Monarch density significantly increased from south to north in Iowa (β = 0.363, 95% CI = 0.237, 0.489) and throughout the breeding season (β = 0.949, 95% CI = 0.878, 1.02). Finally, monarch density was negatively correlated with percent tree canopy cover (β = −0.999, 95% CI = −1.289, −0.709; Figure 4A) and positively correlated with percent cover of milkweed (β = 0.582, 95% CI = 0.128, 1.04; Figure 4B). The top model (AIC = 19351.7) included the interaction Site Type * Year interaction and the additive effect of season (Table 2).
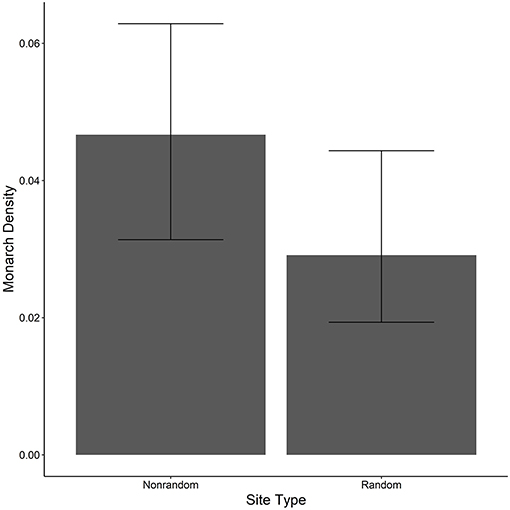
Figure 2. Estimated density per 50-m2 (95% CI) of monarchs on both random and non-random transects surveyed in Iowa, 2006-2017.
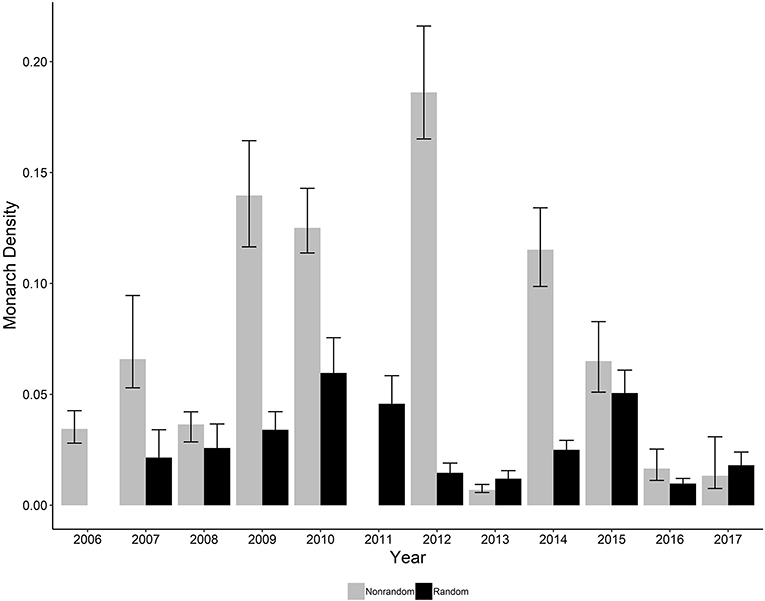
Figure 3. Estimated density per 50-m2 (95% CI) of monarchs on both random and non-random transects surveyed in Iowa by year, 2006-2017. No random sites were surveyed in 2006 and no non-random sites were surveyed in 2011.
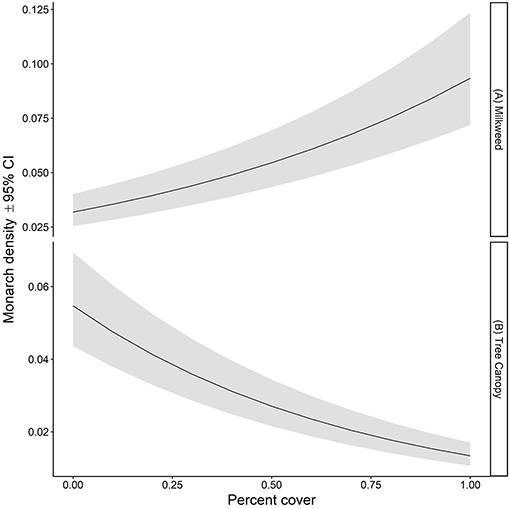
Figure 4. Estimated density per 50-m2 (95% CI) of monarchs as a function of (A) percent of plots containing milkweed and (B) percent tree canopy cover on all survey transects in Iowa, 2006-2017.
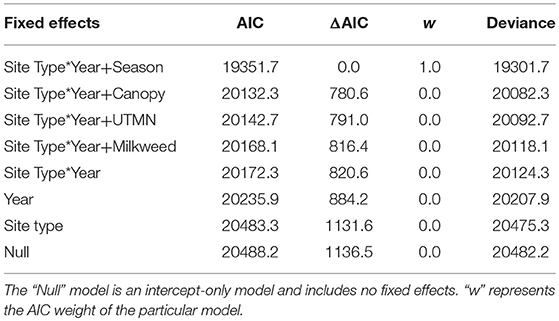
Table 2. Model selection results comparing the influence of different fixed effects on monarch density in Iowa, 2006-2017.
Our model of monarch density as a function of the interaction between the numeric year variable and the dummy variable representing randomly selected sites indicated a significant difference in temporal trend across years between random and non-random site types (β = 0.25, 95% CI = 0.120, 0.384; Figure 5). Additionally, the correlation between annual density estimates from random and non-random sites was relatively low and not significant (r = 0.235, P = 0.514).
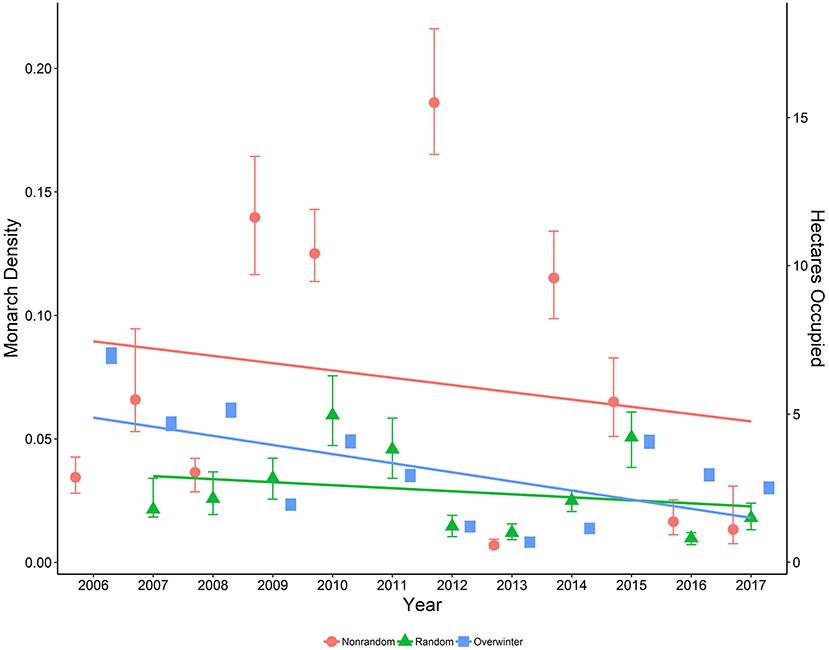
Figure 5. Estimated density per 50-m2 (95% CI) of monarchs on both random and non-random sites surveyed in Iowa by year, 2006-2017, along with data on area occupied (ha; secondary axis) by overwintering monarchs in Mexico, 2006-2017 (Monarch Watch Blog, 2018).
Including a random intercept for both transect and sampling unit within transect illustrated significant variability both among and within survey transects. Variability among the different survey transects throughout Iowa (SD = 1.272) was greater than the variability within each individual survey transect (SD = 0.523).
Discussion
Our study is the first to estimate annual monarch density on the breeding grounds using a long-term monitoring program with a randomized study design. Similar estimates have proven critical for evaluating monarch population viability and response to various habitat management and restoration actions in other studies (Flockhart et al., 2015; Oberhauser et al., 2017). We found considerable annual variation in monarch density on the Iowa breeding grounds from 2006 to 2017, which is not surprising given our current knowledge of the dynamic nature of monarch populations on the overwintering areas in Mexico (Vidal and Rendón-Salinas, 2014).
Random vs. Non-random Site Type
For random site types, monarch density was highest in 2010 and lowest in 2013; and a linear trend fit across all years showed a decline in monarch density (β = −0.110, 95% CI = −0.175, −0.048). While a decline in monarch populations on the breeding grounds has been suggested by other studies investigating factors leading to overall monarch population declines (Flockhart et al., 2015; Pleasants et al., 2017), our study is the first to demonstrate such a decline using empirically-derived estimates of density. Our result, coupled with the continual decline in monarch populations on overwintering grounds (Vidal and Rendón-Salinas, 2014), emphasizes the importance for continued monitoring on the breeding grounds. Using standardized monitoring programs such as the MSIM program in Iowa and the Integrated Monarch Monitoring Program (Cariveau et al., 2019), overseen by the Monarch Joint Venture, combined with efforts to increase appropriate breeding habitat in the Upper Midwest, should provide a better understanding of the importance of habitat work in the breeding grounds. The MSIM Program collects data only on adult butterflies, whereas additional programs such as the IMMP, similar to the MLMP, collect needed data on egg and larval density to further inform models such as those in Oberhauser et al. (2017).
Other studies have failed to document a declining trend on the breeding grounds and argue that their findings suggest that factors leading to successful fall migration and survival on the overwintering grounds are more critical to conserving monarch populations rather than habitat restoration on the breeding grounds (Ries et al., 2015; Inamine et al., 2016). Both studies, however, used data from citizen science monitoring programs collected on targeted survey sites that were not located randomly on the landscape. Pleasants et al. (2016, 2017) challenged these studies, indicating that population trend estimates based on survey sites that are not representative of all possible survey sites can differ from estimates based on randomly-located and representative survey sites. Similarly, Saunders et al. (2019) highlights the inability to determine whether the lack of trends on the breeding grounds occurred due to a true absence of trend or a result of bias in data collection. Our study corroborates Pleasants et al. (2017) claim with empirically-derived density estimates, showing that monarch density on the breeding grounds was lower on average and by year on random site types compared to non-random site types.
Year
In addition, we found a significant difference in temporal trend of monarch density between random and non-random site types. Both results have important implications for future monitoring of monarch populations throughout their breeding range. First, some policy for threatened and endangered species is based on estimates of population size, and it is critical these estimates both accurately and precisely represent population dynamics through time. This is also true for indices used to track population trends, which often require strict standardization and assumptions about the ability of the index to approximate true population size which if not satisfied can result in misleading population trends. We know that broad inference based on non-random or targeted sampling strategies is problematic for several reasons, often leading to biased parameter estimates and challenges associated with standardization of data collection. The need for rigorous, random site selection has been well-established in the ecological literature (Williams et al., 2001; Johnson, 2002; Mazzocchi, 2007; Nusser et al., 2008). Our results showed poor correlation between annual density estimates for random and non-random site types, indicating that density estimates from one site type cannot reliably predict those for the other site type.
Therefore, based on this previous work and our results, we emphasize caution when interpreting results from studies based on targeted sampling strategies and argue for randomization in future studies of long-term monarch population trends to ensure unbiased inference at appropriate spatial scales. It may be worth adding that we included non-random sites in a robust design occupancy analysis (Dinsmore et al., 2019) and argued that the inclusion of these sites was of less concern for presence/absence data than for density or count data (as in this study). This is due to the high occupancy rate of monarchs (often > 0.90), independent of actual counts.
Spatial Stratification
We documented significant variation both among and within survey transects and found that monarch density increases from south to north in Iowa. Both of these findings have implications for the design of future surveys to track monarch population trends. Monarch density varied more among different survey transects across the state than among sampling units within a single transect. Variation among different survey transects is driven primarily by spatial heterogeneity in the distribution of animals caused by factors such as changes in habitat quantity and quality or climatic variables. Factors influencing the counting of animals during a survey are the primary drivers of within-transect variability which include temporal variability in the number of animals present on a sampling unit, differences in habitat characteristics among sampling units, or differences in conditions that affect an observer's ability to detect animals (i.e., measurement error; Skalski, 1994). Accounting for both sources of variability in long-term surveys improves the ability to detect population trends as illustrated in other long-term monitoring programs such as the North American Breeding Bird Survey (BBS; Link et al., 1994).
Season
In addition to demonstrating that monarch density increases from south to north in Iowa, our results also suggested monarch density increases throughout the breeding season. Given results from the MLMP (K. Oberhauser pers. comm., Prysby and Oberhauser, 2004), it appears that monarchs will breed in southern Iowa in June and early July, but late July and August may be too hot and monarchs may move further north. While further analyses could show a more pronounced difference in density from south to north throughout the breeding season, the significant individual effects illustrate the need to consider repeated surveys throughout the breeding season along with spatial stratification. Furthermore, annual variation in climate could lead to changes in the magnitude of the spatial effect on density. For example, we might expect the south-to-north increase in monarch density to be less pronounced or perhaps disappear in breeding seasons with below-average temperatures. Nonetheless, for future large-scale monitoring of monarch population trends, we suggest researchers consider stratification if prior knowledge suggests potential spatial variation in counts in order to increase precision of estimates (Skalski, 1994; Williams et al., 2001; Johnson, 2002).
Milkweed
We found that percent cover of milkweed was positively correlated with monarch density, which confirms the results of other studies and adds to the growing evidence that restoring milkweed on the breeding grounds should be a priority for conserving monarch populations in North America. Milkweed should be embedded, however, within a matrix of additional nectar sources to provide food for the adults in addition to the milkweed host plant for the larvae (Bull et al., 1985; Suzuki and Zalucki, 1986; Brower, 1995; Zalucki and Lammers, 2010; Pleasants and Oberhauser, 2013; Thogmartin et al., 2017).
Tree Canopy
Our study found that forest canopy cover is negatively correlated with monarch density, although we did document monarchs at properties with tree canopy cover. Kaul et al. (1991) documented the tallest specimen of Common Milkweed (Asclepias syriaca) along forest borders and other habitat edges in Nebraska. Although it has long been assumed that open habitats, such as grasslands, are more important for monarchs (Thogmartin et al., 2017; Midwest Association of Fish Wildlife Agencies, 2018), we were not able to find empirical studies confirming that monarchs are less likely to be found in areas with a closed tree canopy suggesting this may be a topic for further investigation. The species description in Seitz (1924) states that monarchs will move into previously forested areas quickly after clearings are created, which may include small tree clearings thereby creating disturbance needed for Common Milkweed to thrive (Kaul et al., 1991). The ability of the monarch to use small openings in forested habitats is confirmed by our study; even small disturbances within a closed tree canopy habitat that allows for the establishment of milkweed could benefit monarchs.
Study Implications
Evaluating diagnostics of our models indicated some bias in model fit, suggesting our models were over-simplified and did not capture all existing variability in our data. We utilized a hypothesis-driven modeling approach, which allowed us to build simple models that allowed for direct comparison of different covariate effects that satisfied our objectives. It's uncertain whether a more complex modeling approach, for example one that employed multiple models with additive covariate effects, would reduce model bias, but it would almost certainly complicate the interpretation of the results relative to our original objectives. Although our models may be too simplistic, they adequately address over-dispersion in our data and produce reasonable parameter estimates that can be used to inform future monitoring efforts for monarchs on the breeding grounds.
We are in no way criticizing the use of trained citizen scientists to collect data on monarchs and their habitats. We have many observers in our program, making it challenging to account for an observer effect in our models. While we provide training on sampling methods and identification to ensure consistency in data collection, as well as a certain level of rigor common to all observers, we still have variability among the skill levels. Oberhauser et al. (2015) provides an excellent summary of the major advances citizen scientists have contributed to the knowledge of monarch conservation. Our critique is that those citizens should receive guidance about where to survey and should not be allowed to choose where to collect the data. While not every volunteer will be willing to be directed to locations, other existing programs (e.g., the North American BBS or North American Amphibian Monitoring Program) demonstrate that some volunteers will be willing to monitor suggested locations. This highlights the tradeoff between fewer data collected in a standardized manner vs. more data that are unstandardized.
Data from our program show clear differences in conservation lands chosen randomly vs. those chosen non-randomly by property managers. We expect these differences would be even more pronounced if the sampling frame were expanded to include properties from other land-use types (e.g., rights-of-way, agricultural, urban, and privately owned/working grasslands) beyond conservation lands. Despite good intentions, people often want to collect data where they will see the animals of interest. Therefore, when allowed to choose, they will often pick the best quality habitat within a reasonable distance from their home. Our study demonstrates the importance of spatial and temporal patterns in monarch densities in Iowa and reinforces the need to randomly select sites for long-term monitoring efforts.
Ethics Statement
While butterflies are animals, they are not covered under Iowa State University's IACUC and therefore we do not need an IACUC permit for these surveys.
Author Contributions
KK is responsible for the original design and funding acquisition with input on analysis questions and additional funding from SD. TH performed the analyses. KK and TH wrote the manuscript with input from SD and review from KM and PF. PF oversaw field data collection.
Funding
Funding for the study was primarily provided through the U.S. Fish and Wildlife Service's State Wildlife Grants Program (T-6-R-1, T-6-R-2, T-6-R-3, T-6-R-4, T-6-R-5, F15AF00269, and F15AF00257), the Iowa DNR, and Iowa State University. Additional funding supported data collection on specific properties and was provided through the U.S. Army Corps of Engineers and the U.S. Fish and Wildlife Service Landowner Incentive Program. This paper is partially a product of the Iowa Agriculture and Home Economics Experiment Station, Ames, Iowa. Project No. IOW05438 is sponsored by Hatch Act and State of Iowa funds. USFWS WSFR SWG Funds are formula funds provided to State Agencies with approved Wildlife Action Plans. The USACE and Iowa DNR Funds were provided in order to collect information on what species were found on specific areas in Iowa. Hatch Funds are formula funds to ISU from USDA which support research at land grant institutions.
Conflict of Interest Statement
The authors declare that the research was conducted in the absence of any commercial or financial relationships that could be construed as a potential conflict of interest.
Acknowledgments
We are thankful for the many, many seasonal technicians that have assisted with data collection each year. P. Dixon and W. Thogmartin provided advice and guidance on analyses. S. Shepherd assisted with training of seasonal technicians. We also thank two reviewers for suggestions that improved this manuscript.
References
Badgett, G., and Davis, A. K. (2015). Population trends of monarchs at a northern monitoring site: Analyses of 19 years of fall migration counts at Peninsula Point, MI. Ann. Entomol. Soc. Am. 108, 700–706. doi: 10.1093/aesa/sav060
Bates, D., Maechler, M., Bolker, B., and Walker, S. (2015). Fitting linear mixed-effects models in R. J. Stat. Soft. 67, 1–48. doi: 10.18637/jss.v067.i01
Brower, L. P. (1995). Understanding and misunderstanding the migration of the monarch butterfly (Nymphalidae) in North America: 1857-1995. J. Lepid. Soc. 49, 304–385.
Brower, L. P. (1996). Monarch butterfly orientation: Missing pieces of a magnificent puzzle. J. Exp. Biol. 199, 93–103.
Brower, L. P., Taylor, O. R., Williams, E. H., Slayback, D. A., Zubieta, R. R., and Ramirez, M. I. (2012). Decline of monarch butterflies overwintering in Mexico: is the migratory phenomenon at risk? Insect. Conserv. Diver. 5, 95–100. doi: 10.1111/j.1752-4598.2011.00142.x
Bull, C. M., Zalucki, M. P., Suzuki, Y., Mackay, D., and Kitching, R. L. (1985). An experimental investigation of resource use by female monarch butterflies, Danaus plexippus (L.). Aust. J. Ecol. 10, 391–398. doi: 10.1111/j.1442-9993.1985.tb00901.x
Burnham, K. P., and Anderson, D. R. (2002). Model Selection and Inference: A Practical Information-Theoretic Approach. 2nd Ed. (New York, NY: Springer-Verlag).
Cariveau, A. B., Holt, H. L., Ward, J. P., Lukens, L., Kasten, K., Thieme, J., et al. (2019). The integrated monarch monitoring program: from design to implementation. Front. Ecol. Evol. doi: 10.3389/fevo.2019.00167. [Epub ahead of print].
Center for Biological Diversity Center for Food Safety, Xerces Society, Brower, L. (2014). Petition to Protect the Monarch Butterfly (Danaus plexippus plexippus) under the Endangered Species Act. Avaialble online at: https://www.biologicaldiversity.org/species/invertebrates/pdfs/Monarch_ESA_Petition.pdf (accessed August 26, 2014)
Davis, A. K., and Dyer, L. A. (2015). Long-term trends in Eastern North American monarch butterflies: a collection of studies focusing on spring, summer, and fall dynamics. Ann. Entomol. Soc. Am. 108, 661–663. doi: 10.1093/aesa/sav070
Dinsmore, S. J., Vanausdall, R. A., Murphy, K. T., Kinkead, K. E., and Frese, P. W. (2019). Patterns of monarch site occupancy and dynamics in Iowa. Front. Ecol. Evol. 7:169. doi: 10.3389/fevo.2019.00169
Flockhart, D. T. T., Brower, L. P., Ramirez, M. I., Hobson, K. A., Wassenaar, L. I., Altizer, S., et al. (2017). Regional climate on the breeding grounds predicts variation in the natal origin of monarch butterflies overwintering in Mexico over 38 years. Global. Change Biol. 23, 2565–2576. doi: 10.1111/gcb.13589
Flockhart, D. T. T., Pichancourt, J. B., Norris, D. R., and Martin, T. G. (2015). Unravelling the annual cycle in a migratory animal: breeding season habitat loss drives population declines of monarch butterflies. J. Anim. Ecol. 84, 155–165. doi: 10.1111/1365-2656.12253
Harms, T. M., Kinkead, K. E., and Dinsmore, S. J. (2014). Evaluating the effects of landscape configuration on site occupancy dynamics and movement dynamics of odonates in Iowa. J. Insect Conserv. 18:307–315. doi: 10.1007/s10841-014-9638-4
Hartzler, R. G. (2010). Reduction in common milkweed (Asclepias syriaca) occurrence in Iowa cropland from 1999 to 2009. Crop. Prot. 29, 1542–1544. doi: 10.1016/j.cropro.2010.07.018
Inamine, H., Ellner, S. P., Springer, J. P., and Agrawal, A. A. (2016). Linking the continental migratory cycle of the monarch butterfly to understand its population decline. Oikos 125, 1081–1091. doi: 10.1111/oik.03196
Iowa Department of Natural Resources (2015). Iowa's Wildlife Action Plan: Securing a Future for Fish and Wildlife, eds K. Reeder, J. Clymer. Des Moines, IA: Iowa Department of Natural Resources. Available online at: https://www.iowadnr.gov/Conservation/Iowas-Wildlife/Iowa-Wildlife-Action-Plan (accessed March 19, 2019)
Iowa Department of Natural Resources (2016). Iowa Multiple Species Inventory and Monitoring Program Technical Manual, Version 5, eds Kinkead, K. Des Moines, IA: Iowa Department of Natural Resources. Available online at: https://www.iowadnr.gov/Conservation/Iowas-Wildlife/Wildlife-Diversity-Program/Diversity-Projects (accessed March 19, 2019)
Johnson, D. H. (2002). The importance of replication in wildlife research. J Wildl. Manage. 66, 919–932. doi: 10.2307/3802926
Journey North (2018). Monarch Butterflies, Migration. Available online at: https://journeynorth.org/monarchs (accessed March 19, 2019).
Kaul, R. B., Rolfsmeier, S. B., and Esch, J. J. (1991). The Distribution and Reproductive Phenology of the Milkweeds (Asclepiadaceae: Asclepias and Cynachum) in Nebraska. Transactions of the Nebraska Academy of Sciences and Affiliated Societies. Paper 152. Available online at: http://digitalcommons.unl.edu/tnas/152
Link, W. A., Barker, R. J., Sauer, J. R., and Droege, S. (1994). Within-site variability in surveys of wildlife populations. Ecology 74,1097–1108. doi: 10.2307/1939433
Mazzocchi, M. (2007). Statistics for Marketing and Consumer Research. London: Sage Publications Ltd.
Midwest Association of Fish Wildlife Agencies (2018). Mid-America Monarch Conservation Strategy, 2018-2038. Version 1.0. Available online at. http://www.mafwa.org/wp-content/uploads/2018/07/MAMCS_June2018_Final.pdf (accessed March 19, 2019)
Monarch Watch (2018). Peak migration Dates: When Will the Migration Peak in My Area? Available online at: https://monarchwatch.org/tagmig/peak.html (accessed March 19, 2019).
Monarch Watch Blog (2018). Monarch Population Status. Available online at: https://monarchwatch.org/blog/2018/03/07/monarch-population-status-32/ (accessed December 4, 2018).
Nusser, S. M., Clark, W. R., Otis, D. L., and Huang, L. (2008). Sampling considerations for disease surveillance in wildlife populations. J. Wildlife Manage. 72, 52–60. doi: 10.2193/2007-317
Oberhauser, K., Wiederholt, R., Diffendorfer, J. E., Semmens, D., Ries, L., Thogmartin, W. E., et al. (2017). A trans-national monarch butterfly population model and implications for regional conservation priorities. Ecol. Entomol. 42, 51–60. doi: 10.1111/een.12351
Oberhauser, K. S., Reis, L., Altizer, S., Batalden, R. V., Kudell-Ekstrum, J., Garland, M., et al. (2015). “Contributions to monarch biology and conservation through citizen science: seventy years and counting,” Monarchs in a Changing World: Biology and Conservation of an Iconic Butterfly, eds K. S. Oberhauser, K. R. Nail, S. Altizer. (Ithaca, NY: Cornell University Press), 13–30
Office of the Press Secretary The White House. (2014). Presidential Memorandum – Creating a Federal Strategy to Promote the Health of Honey Bees and Other Pollinators. Available online at: https://obamawhitehouse.archives.gov/the-press-office/2014/06/20/presidential-memorandum-creating-federal-strategy-promote-health-honey-b (accessed March 19, 2019).
Patterson, S. S. (2016). Local and Landscape Effects on Population Dynamics of Birds and Butterflies in IOWA. (Thesis) Iowa State University, Ames, USA.
Pleasants, J. M. (2015). “Monarch butterflies and agriculture,” Monarchs in a Changing World: Biology and Conservation of an Iconic Butterfly, eds K. S. Oberhauser, K. R. Nail and S. Altizer. (Ithaca, NY: Cornell University Press), 169–178.
Pleasants, J. M. (2017). Milkweed restoration in the Midwest offer monarch butterfly recovery: estimates of milkweeds lost, milkweeds remaining and milkweeds that must be added to increase the monarch population. Insect Conserv. Diver. 10, 42–53. doi: 10.1111/icad.12198
Pleasants, J. M., and Oberhauser, K. S. (2013). Milkweed loss in agricultural fields because of herbicide use: effect on the monarch butterfly population. Insect Conserv. Diver. 6, 135–144. doi: 10.1111/j.1752-4598.2012.00196.x
Pleasants, J. M., Williams, E. H., Brower, L. P., Oberhauser, K. S., and Taylor, O. R. (2016). Conclusion of no decline in summer monarch population not supported. Ann. Entomol. Soc. Am. 109, 169–171. doi: 10.1093/aesa/sav115
Pleasants, J. M., Zalucki, M. P., Oberhauser, K. S., Brower, L. P., Taylor, O. R. W. E, and Thogmartin (2017). Interpreting surveys to estimate the size of the monarch butterfly population: Pitfalls and prospects. PLoS ONE 12:e0181245. doi: 10.1371/journal.pone.0181245
Pollack, K. H., Nichols, J. D., Simons, T. R., Farnsworth, G. L., Bailey, L. L., and Sauer, J. R. (2002). Large scale wildlife monitoring studies: statistical methods for design and analysis. Environmetrics 13, 105–119. doi: 10.1002/env.514
Pollard, E., and Yates, T. J. (1993). Monitoring Butterflies for Ecology and Conservation: The British Butterfly Monitoring Scheme. St. Edmunds: St. Edmundsbury Press Limited.
Prysby, M., and Oberhauser, K. S. (2004). “Temporal and geographical variation in monarch densities: citizen scientists document monarch population patterns. The Monarch Butterfly: Biology and Conservation.” in eds K. S. Oberhauser and M. J. Solensky (Ithaca, NY: Cornell University Press), 9–12.
R Core Team (2018). R: A Language and Environment for Statistical Computing. Vienna: R Foundation for Statistical Computing
Ries, L., Taron, D. J., and and, Rendon-Salinas, E. (2015). The disconnect between summer and winter monarch trends for the Eastern migratory population: possible links to differing drivers. Ann. Entomol. Soc. Am. 108, 691–699. doi: 10.1093/aesa/sav055
Saunders, S. P., Ries, L., Neupane, N., Ramirez, M. I., Garcia-Serrano, E., Rendon-Salinas, E., et al. (2019). Multiscale seasonal factors drive the size of winter monarch colonies. Proc. Natl. Acad. Sci. U.S.A. 116, 8609–8614. doi: 10.1073/pnas.1805114116
Schlicht, D. W., Downey, J. C., and Nekola, J. C. (2007). The Butterflies of Iowa. Iowa City, IA: University of Iowa Press
Schultz, C. B., Brown, L. M., Pelton, E., and Crone, E. E. (2017). Citizen science monitoring demonstrates dramatic declines of monarch butterflies in western North America. Biol. Conserv. 214, 343–346. doi: 10.1016/j.biocon.2017.08.019
Seitz, A. (1924). The Macrolepidoptera of the World: the American Rhopalocera. Stuttgart: Alfred Kernen. Avaialble online at: https://archive.org/details/macrolepidoptera51seit/page/n175
Semmens, B. X., Semmens, D. J., Thogmartin, W. E., Wiederholt, R. L., López-Hoffman Diffendorfer, J. E., et al. (2016). Quasi-extinction risk and population targets for the Eastern, migratory population of monarch butterflies (Danaus plexippus). Sci. Rep. 6:23265. doi: 10.1038/srep23265
Skalski, J. R. (1994). Estimating wildlife populations based on incomplete area surveys. Wildl. Soc. B. 22, 192–203.
Supp, S. R., La Sorte, F. A., Cormier, T. A. M, Lim, C. W., Powers, D. R., Wethington, S. M., et al. (2015). Citizen-science data provides new insight into annual and seasonal variation in migration patterns. Ecosphere 6:15. doi: 10.1890/ES14-00290.1
Suzuki, Y., and Zalucki, M. P. (1986). Mate acquisition as a factor influencing female dispersal in Danaus plexippus (L.). J. Aust. Ent. Soc. 25, 31–35. doi: 10.1111/j.1440-6055.1986.tb01064.x
Swengel, A. B. (1990). Monitoring butterfly populations using the fourth of july butterfly count. Am. Midl. Nat. 124, 395–406. doi: 10.2307/2426190
Swengel, A. B. (1995). Population fluctuations of the monarch (Danaus plexippus) in the 4th of july butterfly count 1977-1994. Am. Midl. Nat. 134, 205–214. doi: 10.2307/2426291
Thogmartin, W. E., Lopez-Hoffman, L., Rohweder, J., Diffendorfer, J., Drum, R., Semmens, D., et al. (2017). Restoring monarch butterfly habitat in the Midwestern US: ‘all hands on deck’. Environ. Res. Lett. 12:074005. doi: 10.1088/1748-9326/aa7637
Van Strien, A. J., van Swaay, C. A. M., and Termaat, T. (2013). Opportunistic citizen science data of animal species produce reliable estimates of distribution trends if analysed with occupancy models. J. Appl. Ecol. 50, 1450–1458. doi: 10.1111/1365-2664.12158
Vidal, O. E., and Rendón-Salinas (2014). Dynamics and trends of overwintering colonies of the monarch butterfly in Mexico. Biol. Conserv. 180, 165–175. doi: 10.1016/j.biocon.2014.09.041
Wassenaar, L. I., and Hobson, K. A. (1998). Natal origins of migratory Monarch butterflies at wintering colonies in Mexico: New isotopic evidence. Proc. Natl. Acad. Sci. U.S.A. 95, 15436–15439. doi: 10.1073/pnas.95.26.15436
Williams, B. K., Nichols, J. D., and Conroy, M. J. (2001). Analysis and Management of Animal Populations. San Diego, CA: Academic Press.
Zalucki, M. P., and Lammers, J. H. (2010). Dispersal and eff shortfall in Monarch butterflies: What happens when the matric is cleaned up? Ecol. Entomol. 35, 84–91. doi: 10.1111/j.1365-2311.2009.01160.x
Keywords: density, Iowa, monarch, transect, survey, butterfly
Citation: Kinkead KE, Harms TM, Dinsmore SJ, Frese PW and Murphy KT (2019) Design Implications for Surveys to Monitor Monarch Butterfly Population Trends. Front. Ecol. Evol. 7:195. doi: 10.3389/fevo.2019.00195
Received: 01 January 2019; Accepted: 13 May 2019;
Published: 31 May 2019.
Edited by:
Ryan G. Drum, United States Fish and Wildlife Service (USFWS), United StatesReviewed by:
David Zaya, Illinois Natural History Survey (INHS), United StatesEmily L. Weiser, United States Geological Survey, United States
Copyright © 2019 Kinkead, Harms, Dinsmore, Frese and Murphy. This is an open-access article distributed under the terms of the Creative Commons Attribution License (CC BY). The use, distribution or reproduction in other forums is permitted, provided the original author(s) and the copyright owner(s) are credited and that the original publication in this journal is cited, in accordance with accepted academic practice. No use, distribution or reproduction is permitted which does not comply with these terms.
*Correspondence: Karen E. Kinkead, S2FyZW4ua2lua2VhZEBkbnIuaW93YS5nb3Y=