Abstract
Any sensory strategies that prey take to avoid eavesdropping predators will depend on the behavioral decisions of eavesdroppers. As these decisions are guided by the sensory processing of communication signals, accurate measurements of sensorimotor output will provide insights into signal preferences, parameters evaluated for signal recognition, and the perceptual and cognitive capacity of receivers. A number of techniques have been proposed for measuring walking phonotaxis (and taxis behavior more generally). Consistent limitations of such measures are (1) that some animals cannot discriminate alternative signals when they occur simultaneously (i.e., overlapping in the spectral and temporal domain), or (2) some animals respond with low selectivity to stimuli presented in isolation, and (3) identifying appropriate dimensions of response variability is not straightforward. Here we document an approach to develop a sensitive phonotaxis performance index to quantify pulse rate selectivity in two distinct populations of the acoustic parasitoid fly Ormia ochracea. Using a spherical treadmill to measure tethered walking phonotaxis, we examined the ability of flies to track a switch in the broadcast location of test songs with varying pulse-rates. By applying an information-theoretic approach, we identified a set of response parameters that best predict a previously described pulse-rate preference. These parameters were incorporated into an index to describe temporal pattern selectivity during walking phonotaxis. Our study also revealed that in Floridian Ormia ochracea, the pulse rate preference function is not affected by the locomotor mode (walking vs. flying) used in phonotaxis. Furthermore, we describe for the first time, pulse rate selectivity in Californian Ormia ochracea. Both populations have pulse rate preference functions with peak selectivity between 50 and 60 Pulses/s (pps). Previous studies demonstrating natural differences in host song preferences (Floridian O. ochracea preferring Gryllus rubens and Californian O. ochracea preferring Gryllus lineaticeps calling songs) may be based on other temporal parameters aside from pulse rate. Finally, we discuss the advantages and limitations of our approach in quantifying signal selectivity. This approach can be applied broadly to study signal preferences in other acoustic parasitoid flies and potentially other eavesdroppers that exhibit taxis behaviors in response to the communication signals of prey.
Introduction
Acoustic communication is widespread in anurans and orthopteran insects (Gerhardt and Huber, 2002). In the context of reproduction, signalers (usually males) produce acoustic signals to advertise to potential mates (Andersson, 1994). As mate choice decisions of intended receivers are often based on assessing conspicuous advertisement signals, these signals are often subject to strong sexual selection to match the psychological landscape of receivers (Guilford and Dawkins, 1991; Wagner, 1998; Miller and Bee, 2012). At the same time, unintended receivers may eavesdrop on the same advertisement signals to locate potential prey or hosts (Cade, 1975; Tuttle and Ryan, 1981; Zuk and Kolluru, 1998). Such eavesdroppers can impose selective pressure for signals to be cryptic or for signalers to adopt alternative behavioral strategies (Zuk and Kolluru, 1998).
Signalers may adopt a number of strategies to avoid eavesdropping by untended receivers. Some of these strategies include changing the spectral and temporal characteristics of communication signals (Lloyd and Wing, 1983; Zuk et al., 1993; Morris et al., 1994; Rotenberry et al., 1996), signaling less often (Morris, 1980; Tuttle and Ryan, 1982; Tuttle et al., 1982; Belwood and Morris, 1987), producing less complex signals (Tuttle and Ryan, 1982), adopting a different communication channel (Belwood and Morris, 1987; Morris et al., 1994), advertising within a chorus (Walker, 1969), and “whispering” to intended receivers (Nakano et al., 2008). Since the behavioral decisions of eavesdroppers are guided by the sensory processing of communication signals, understanding the causes, and consequences of these evasive strategies will depend on sensitive methods for measuring behavior in eavesdroppers.
In acoustically orienting eavesdroppers, investigators can use phonotaxis studies (oriented locomotor responses to sound) that exploit the natural behavioral repertoire of animals to elucidate signal function, information conveyed in signals, and whether a signal is recognized or preferred. There are two general approaches to measuring behavioral preference functions for advertisement signals. The first is to measure the relative attractiveness of two or more signal variants when these are presented simultaneously in a choice paradigm; the second is to quantify the attractiveness of each signal variant when presented alone in a no-choice paradigm, often using a composite measure of phonotaxis (i.e., a performance index). Choice paradigms have been a common strategy to test for discrimination of signals that differ in the relative attractiveness or the role of signals used to facilitate species recognition (Popov and Shuvalov, 1977; Ryan, 1980; Doherty, 1985; Gerhardt and Doherty, 1988; Scheuber et al., 2004). However, in some experimental situations, animals are unable to evaluate small signal differences when confronted with multiple simultaneous signals (Gerhardt, 1982). In these situations, one can adopt a no-choice paradigm and transform a dichotomous outcome into a graded response measure that can describe the strength of preferences and preference functions for different stimuli (Wagner, 1998).
A number of indices have been proposed that incorporate some or all of the following response parameters: response probability, response latency, duration to reach a sound source, distance traveled, meander in walking path, and accuracy (angular orientation and error) (Von Helversen, 1984; Schul et al., 1998; Bush et al., 2002; Schul and Bush, 2002; Bee, 2007). However, the inclusion of specific parameters incorporated in phonotaxis performance indices is rarely justified and the approach to the development of indices is often omitted in the literature. Furthermore, a number of considerations make these approaches difficult to interpret and compare. Response probabilities or latencies can vary with source detectability or motivation to respond (or both) (Bush et al., 2002; Schul and Bush, 2002). Different species may have more direct vs. meandering paths during phonotaxis, making measures based on response duration, distance, or accuracy difficult to compare (Rheinlaender et al., 1979; Rheinlaender and Blatgen, 1982; Schul et al., 1998; Bee, 2007). Differences or ratios comparing responses to reference and test signals can be combined to derive a standardized phonotaxis performance index (Schul, 1998). These measures of phonotaxis are most accurate at capturing large differences in the path length of walking responses that may be specific to the zig-zag approach in localizing a stationary sound source. In animals that localize sound sources with more direct walking paths, finer variation in signal preferences may not be captured.
The acoustic parasitoid fly Ormia ochracea is known for its ability to localize sound sources with extreme accuracy. This hyperacute directional hearing allows for walking phonotactic responses to be more direct and with less meander (Mason et al., 2005; Lee et al., 2009). Ormia ochracea have evolved directionally sensitive ears for the sole purpose of eavesdropping on the calling songs of field crickets to locate suitable host crickets for the development of their larvae (Cade, 1975). Upon detecting cricket calling songs, gravid female O. ochracea perform flying (Cade, 1975; Walker, 1993; Müller and Robert, 2001) and walking phonotaxis (Mason et al., 2001, 2005; Lee et al., 2009) to cricket calling songs. After arriving in close proximity to crickets, O. ochracea deposit first-instar planidia (larvae) that burrow into crickets to feed on fat body and muscle tissue for development (Cade, 1975; Wineriter and Walker, 1990; Adamo et al., 1995).
Ormia ochracea occur in several geographic regions in the United States including Florida, Texas, California, Hawaii, and elsewhere (Gray et al., 2007). Most studies have used sound traps in the field to examine the relative attractiveness of songs that differ in duration or duty cycle, rather than specific temporal features underlying song recognition (Wagner, 1996; Zuk and Kolluru, 1998; Gray and Cade, 1999; Wagner and Basolo, 2007). These studies generally show that O. ochracea prefer louder songs, with longer chirps at higher chirp rates (Wagner, 1996; Zuk et al., 1998; Gray and Cade, 1999; Wagner and Basolo, 2007). Calling songs are species-specific and differ mostly in the temporal patterning of sound pulses (Gerhardt and Huber, 2002). The fine-scale temporal patterning of sound pulses can differ based on the duration of sound pulses and intervals between sound pulses. Pulse durations and intervals can vary by different amounts to result in songs that vary in duty cycle. Which of these specific temporal parameters are evaluated for species recognition and whether or not different populations of O. ochracea evaluate the same temporal parameters are poorly understood. Such signal preferences in eavesdroppers will depend on how their sensory system processes and perceives communication signals. Thus, a complete understanding of how eavesdroppers contribute to shaping the evolution of communication signals will require some knowledge of the perceptual capacity and sensory mechanisms underlying behavioral decisions that determine host selectivity.
In this Methods paper, we describe an approach to develop a phonotaxis performance index sensitive to response variation with less meander relative to the source location. We adapt a no-choice paradigm previously used to study song recognition in field crickets (Weber et al., 1981; Thorson et al., 1982). In this approach, a song model is initially broadcast from one location and subsequently switched to a second location midway through broadcast. The switch in song broadcast location has the potential to capture response variation underlying signal preferences with high sensitivity because animals are forced to actively alter their course of phonotaxis to follow an attractive source to a new location. This allows us to determine whether the rate and accuracy of a switch in orientation depends on specific signal parameters. We also provide the first description of pulse rate selectivity in a population of Californian O. ochracea. By using the “source-location tracking” paradigm, we quantify a number of response parameters that vary with stimulus pulse-rate. We incorporate these response features into a newly derived phonotaxis performance index. Preference functions based on this index are a good match with simultaneous choice trials in the field (Walker, 1993), and this method revealed that O. ochracea are more selective after they initiate a phonotactic response. Flies discriminated pulse-rate more strongly when they re-oriented to a novel stimulus location than in their initial responses, suggesting an attentional effect contributes to source localization in O. ochracea.
Materials and Methods
Animals
Experiments were conducted on lab-reared gravid female O. ochracea derived from a population originally collected in Gainesville FL and in Thousand Oaks, CA. Flies were maintained in environmentally controlled chambers (Power Scientific, Inc., Model DROS52503, Pipersville, PA) at 25° C and 75% humidity on a 12 h:12 h light: dark regime and fed nectar solution (The Birding Company, Yarmouth, MA) ad libitum.
Acoustic Conditions
All experiments were conducted in an acoustically-dampened sound chamber (Wenger Soundlok, USA) at St. Olaf College, Northfield, Minnesota. The standard song, modeled after the natural calling song [mean of 58.6 pulses/s (pps), variance not reported in Walker (1998)] of Gryllus rubens found in the autumn in Florida (Walker, 1998), was a trill constructed from 5 kHz tone sound pulses that were 10 ms in duration with 1 ms on/off cosine squared ramps. Each sound pulse was separated by a 10 ms interpulse interval and repeated at 50 pps for a total duration of 1 s. Pulse rate preferences were examined with test songs that ranged from 10 to 100 pps in 10 pps increments (Figure 1A). Songs that differed in pulse rates were constructed by adjusting pulse durations and interpulse intervals in equal portions to maintain a constant 50% duty cycle. All test songs were 1 s in duration.
Figure 1
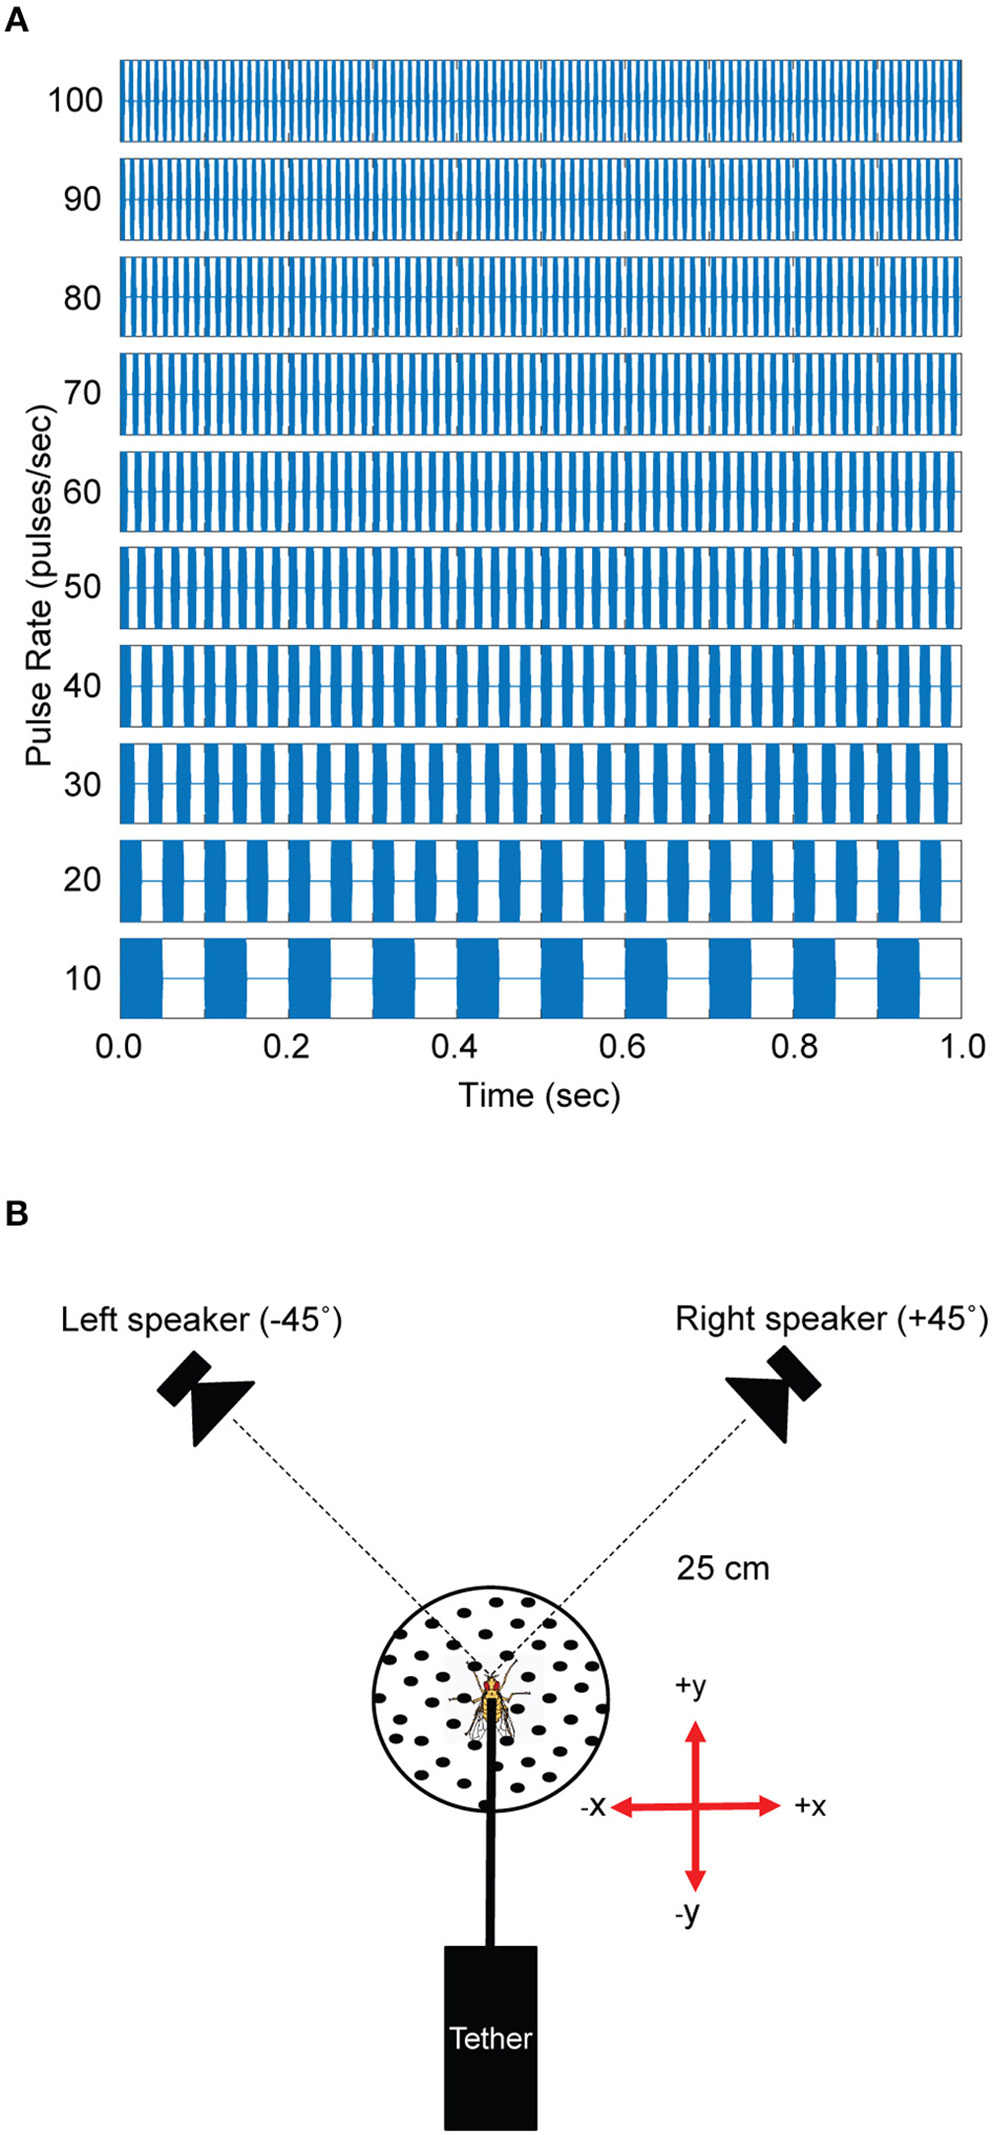
Acoustic stimuli and experimental arrangement. (A) Acoustic stimuli used in phonotaxis experiments were 1 s in duration. Test songs varied in pulse rates by changing the pulse duration and interval between pulses in equal amounts to achieve a 50% duty cycle. The 50 pulses/s and 70 pulses/s songs were used as the standard (reference) song in testing responses from Floridian and Californian Ormia ochracea, respectively. (B) Flies were tethered and held on top of the spherical treadmill system at a fixed position 25 cm away from the left and right speakers. Left and right speakers were positioned at −45° and +45° relative to the midline axis of the fly. Rotations of the treadmill in the forward direction is registered as positive y values while rotations to the right is registered as positive x values and these values can be used to reconstruct virtual walking trajectories.
Acoustic stimuli were synthesized in Matlab (R2018a, The MathWorks Inc., USA) with custom software and converted to analog signals using National Instruments hardware (NI USB-6251, 44100 Hz), amplified (Crown XLS1002 Drive Core 2, USA) and broadcast through silk-dome tweeters (1–1/8 Dayton Audio Classic Series DC28FS-8, USA) situated at −45° (left) and +45° (right) relative to the midline of the flies (Figure 1B). Sound levels were controlled with programmable attenuators (Tucker Davis Technologies System 3 PA5, USA) and calibrated at the location of the fly using a probe microphone (B&K Type 4182, Denmark) connected to a sound level meter (B&K Type 2250, Denmark).
The level of each speaker was calibrated at the position of the fly to 75 dB SPL (re 20 μPa). Test songs varied in pulse rates (see above). A single standard song that switched in broadcast location was used as the “50 pps” test song. During test song presentations, only one speaker was active at a time.
Experimental Protocol
For each experimental subject, we recorded responses as follows. Presentation commenced with a standard song from the left speaker, followed by a presentation of the standard song from the right speaker (or in reverse order) to ensure that flies were motivated to respond. A test song was then broadcast from one speaker for 500 ms and switched to the other speaker for the remaining 500 ms of presentation. This was followed by 30 s of silence before another test song was presented. The next stimulus presentation was a randomly selected test song. Both the sequence of test songs and the order of first speaker presentation were randomized across flies. Five responses for each test song were collected from Floridian O. ochracea while one response for each test song was collected from Californian O. ochracea. The entire experimental series (i.e., as above for all test songs), was followed by another two presentations of the standard song (one from each speaker), to allow us to measure any changes in overall responsiveness during the course of the experiment.
Spherical Treadmill
Behavioral measurements were made from tethered flies performing walking phonotaxis on a high-resolution treadmill system situated equidistant (25 cm) from the two test speakers (Figure 1). Data collection by the treadmill system was controlled by custom Matlab software (StimProg V6) that interfaced with the National Instruments data acquisition system to ensure synchronous sound presentation and data capture. The treadmill system consists of a light-weight table tennis ball held afloat above a modified optical mouse sensor (ADNS 2620, Avago Technologies, USA) by a constant airstream. Walking responses were transduced as rotations of the treadmill that actuated the optical mouse sensor to record changes in x and y pixel units at a sampling rate of 2160 Hz (Lott et al., 2007). Pixel units were calibrated to actual walking distances by measuring displacement of points on the ball in high-speed video footage (Chronos 1.3 Highspeed Camera, 1,000 frames per second, Krontech, Canada) that was synchronized to pixel data from the treadmill system. We also calibrated the responses of the treadmill for rotational movements by attaching the spindle of a small DC motor at the position of the fly. Pure rotation around the vertical axis of the treadmill generates a straight trajectory at 90° to the left or right (depending on the direction of rotation). Previous work (Mason et al., 2005) has verified that for tethered flies responding to a sound source at 90° azimuth, treadmill responses are similar to trajectories of freely walking flies.
Flies were presented with attractive stimuli that switched in the broadcast location. The virtual walking trajectory depicted in Figure 2A show changes in x and y values throughout the duration of data capture. Before stimulus onset, flies started at a value of 0 cm in the x and y directions. After stimulus onset, flies responded with a 64 ± 3.4 ms (mean ± sem) and cumulative walking distance increased rapidly during stimulus presentation. The rate of change in cumulative distance decreased shortly after stimulus offset, but continued to increase beyond the duration of data capture (Figure 2B). When presented with the preferred 50 pps cricket song from the left speaker for the first 500 ms and then subsequently from the right speaker for the remaining 500 ms of broadcast, virtual walking trajectories indicate that flies initially walked left and transitioned to the right (Figures 2A,C).
Figure 2
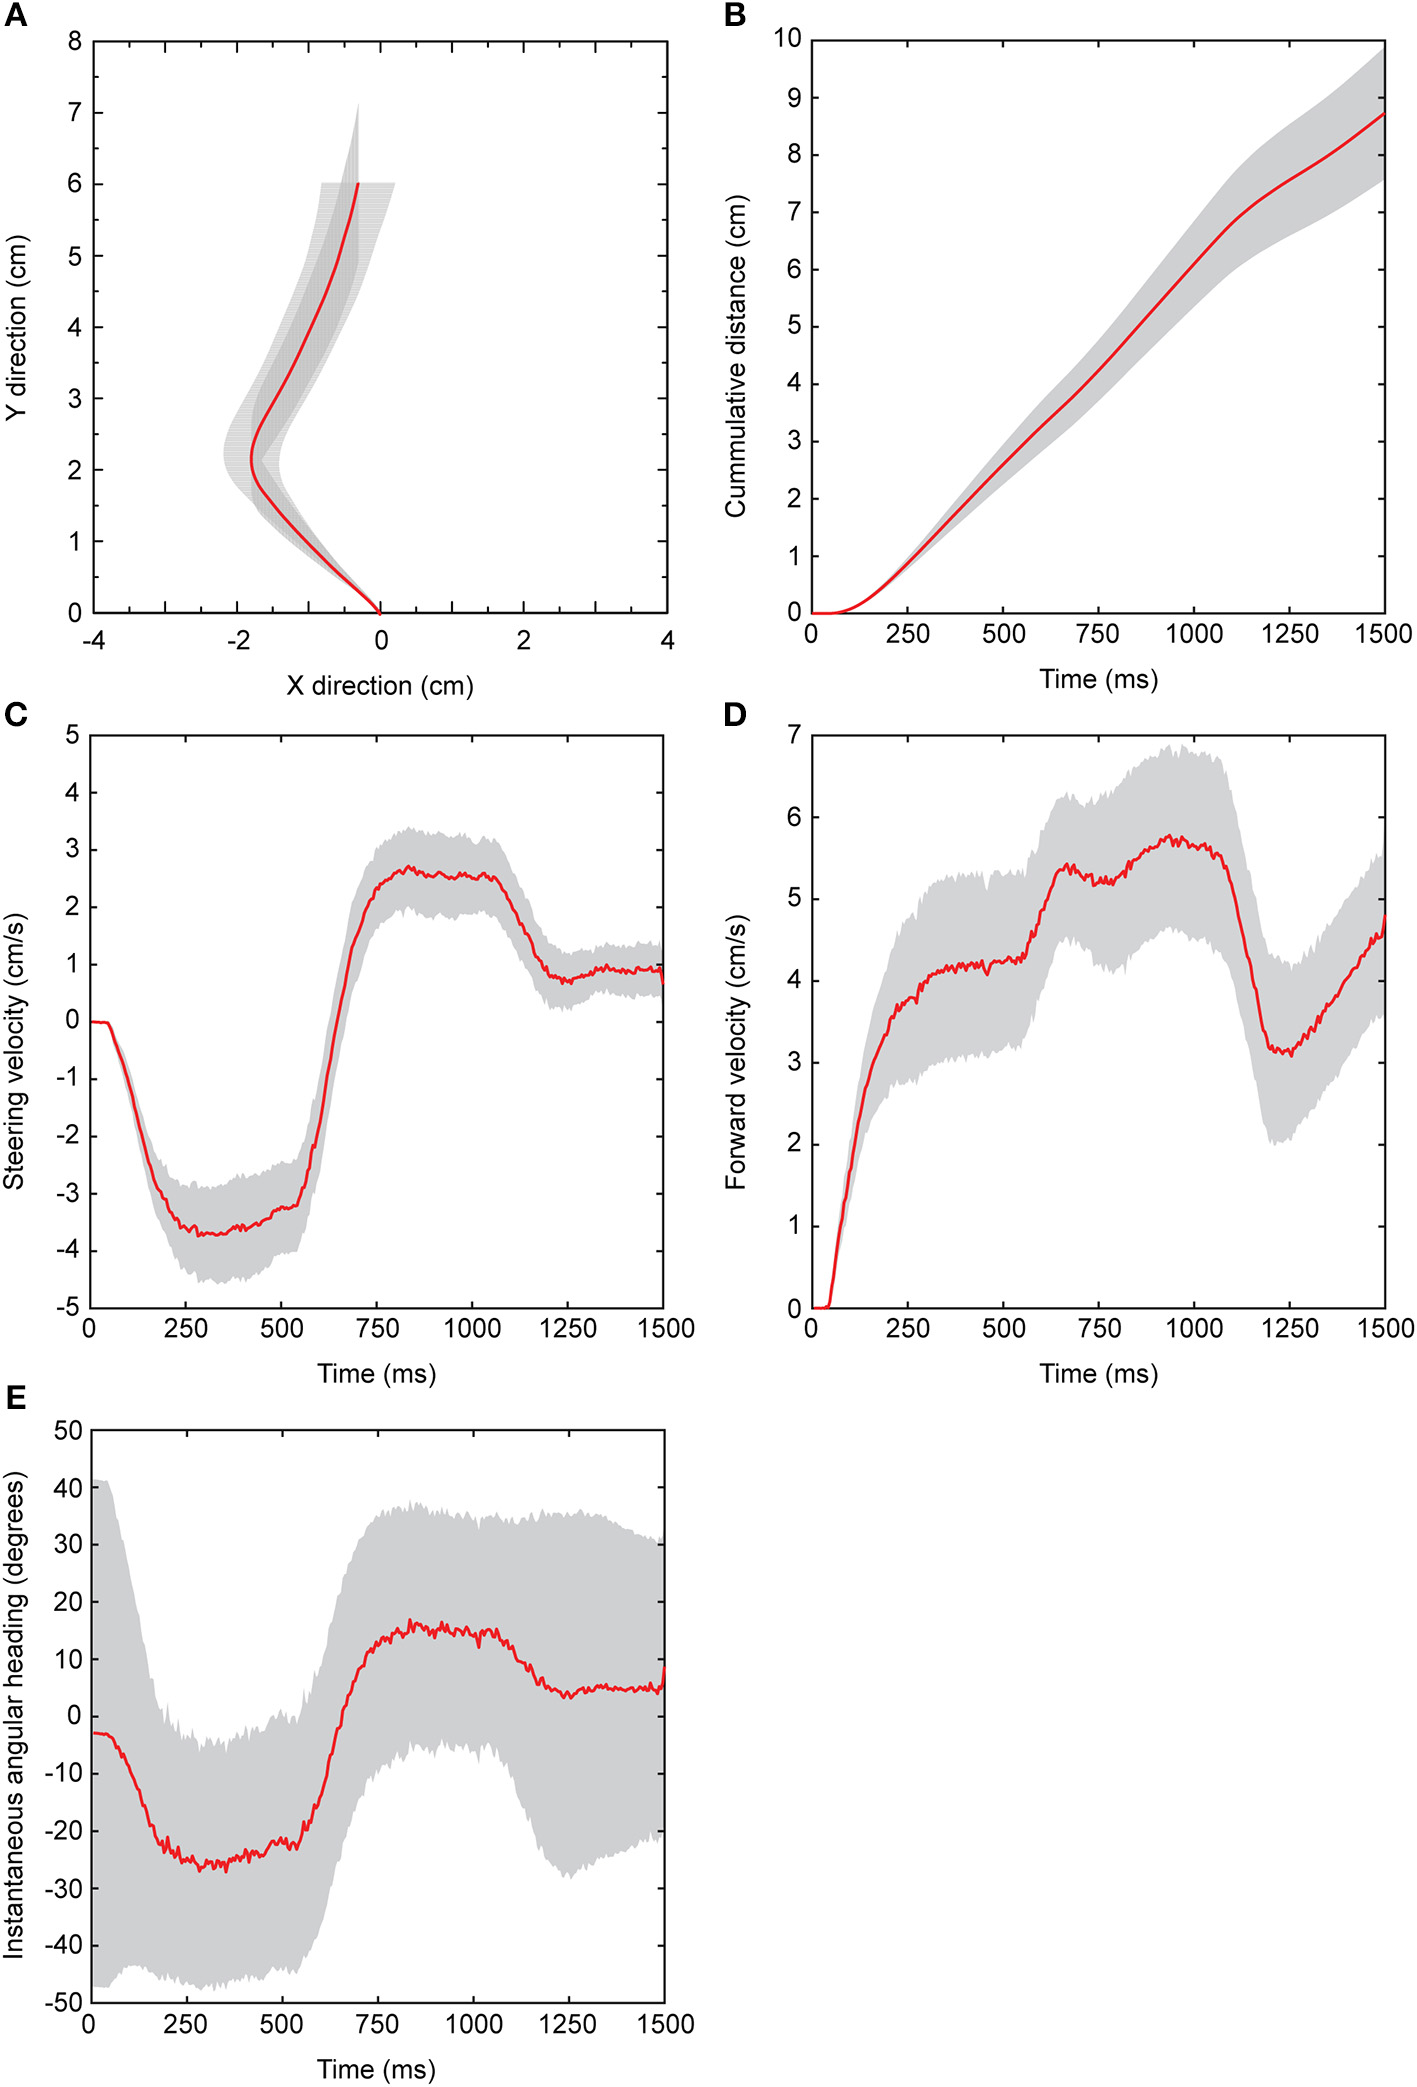
Response features measured from the spherical treadmill system. All data shown are derived from Floridian Ormia ochracea in response to a standard attractive cricket song (50 pulses/s) that was broadcast from the left speaker for 500 ms, and then switched to the right speaker for the remaining 500 ms of stimulus presentation. (A) Plots of x and y values show a reconstructed virtual walking path. (B) Depicts total distance traveled as a function of time. Changes in x and y as a function of time represent steering (C) and forward (D) velocities, respectively. Instantaneous angular headings (E) are derived from converting x and y values from the cartesian plane to polar coordinates. Negative angular headings indicate turning to the left while positive angular headings indicate turning to the right. Red lines represent the grand mean across 16 flies and shaded gray areas represent 95% confidence interval around the mean.
Designing a New Phonotaxis Index
To develop an index that captures signal selectivity, we quantified a range of phonotactic walking parameters and examined how they varied with song pulse-rate. Measured features included: total walking distance during the 1.5 s of data capture; response latencies (time between stimulus onset and first detected change in distance); peak and mean forward and steering velocities to each broadcast location (change in x or y over time, respectively); mean angular heading and error in angular orientation to each broadcast location. The instantaneous angular heading (theta) was determined by converting Cartesian x and y values to polar coordinates by computing the inverse tangent of y divided by x [instantaneous angular heading = arctan(y/x)]. The error in angular orientation was calculated as the difference between the instantaneous angular headings in response to test songs and the mean angular heading to the standard song (reference condition).
To identify response parameters that are most informative of pulse-rate preference, we applied Peng and colleague's Python implementation of max-relevance min-redundancy analysis (mRMR) (Peng et al., 2005). This analysis maximizes feature relevance while minimizing feature redundancy. The mRMR analysis selects features based on their mutual information with a previously established pulse rate preference (Walker, 1993). Response features sharing greater mutual information are better predictors of the pulse-rate preference and are rated as more important provided that they add new information that is not already captured by other features.
Following mRMR (Table 1), we applied a follow-up mutual information analysis to rank candidate phonotaxis indices for suitability in describing pulse rate preferences (Table 2). This analysis resulted in the selection of one index consisting of three features: angular orientation, total distance traveled, and steering velocity.
Table 1
| Response features | Score |
|---|---|
| 1. Steering velocity | 0.453 |
| 2. Total distance | 0.383 |
| 3. Angular heading | 0.321 |
| 4. Peak forward velocity | 0.288 |
| 5. Angular error | 0.262 |
| 6. Forward velocity | 0.203 |
| 7. Response latency | 0.122 |
Response features ranked by mRMR feature selection analysis.
Rankings determined from responses obtained from Floridian O. ochracea (n = 16).
Table 2
| Candidate phonotaxis indices | Quantity of information normalized to equation 8 (bits) |
|---|---|
| 1. | 0.32 |
| 2. | 0.66 |
| 3. | 0.91 |
| 4. | 0.44 |
| 5. | 0.75 |
| 6. | 0.78 |
| 7. Top two features selected by mRMR: | 0.87 |
| 8. Top three features selected by mRMR: | 1.0 |
| 9. Top four features selected by mRMR: | 0.82 |
Evaluating candidate phonotaxis indices with mutual information analysis.
Repeated responses for the same stimulus conditions were averaged within individuals. Index values range from 0 to >1. A phonotaxis performance index of 0 indicates poor performance, 1 indicates performance equivalent to responses to the standard song, >1 indicates performance “better” than responses to the standard song (e.g., higher steering velocity, longer distance). In other words, although the index is defined relative to responses to the reference stimulus, it can nevertheless detect a stronger preference for an alternative signal.
Data Analysis
The numbers of walking responses to the left speaker leading or the right speaker leading were balanced to eliminate any directional biases in broadcast locations. Responses to the right speaker leading were reflected and combined with data in response to the left speaker leading for the final data analysis. Registered changes in x and/or y greater than a calibrated distance of 1 cm were considered valid phonotactic responses. All data are reported as mean ± sem unless otherwise specified.
The effects of song pulse rate on response latencies were statistically analyzed with Friedman's ANOVA as response latencies violated the assumptions of normality and homogeneity of variance. At present, there is no consensus on an inferential statistical approach to analyze repeated measures circular data. Despite violating the assumptions of independence and linearity, some studies have applied linear repeated measures ANOVA to analyze circular data (Mechsner et al., 2007). Here we used a linear repeated measures ANOVA to analyze error in angular orientation and Watson's U2 Test to analyze angular headings. All other response measures were analyzed with repeated measures ANOVAs and Greenhouse-Geisser corrected if assumptions of sphericity were violated. Bonferroni adjustments were applied to post-hoc pairwise comparisons. Statistical analyses were conducted in SPSS Statistics (ver. 19, IBM Corporation, USA).
Results
We first recorded walking responses from 16 Floridian O. Ochracea. Experiments started and ended with testing responses to the standard stimulus, and there was no evidence that flies became less responsive over the course of the experiment. Response latencies differed between speakers [F(1, 15) = 7.24, P = 0.017], and decreased significantly by the end of experiments [F(1, 15) = 4.58, P = 0.05]. Flies initially responded with a mean latency of 91.44 ± 13.20 ms and 72.03 ± 9.16 ms to the left and right broadcast locations, respectively. By the end of experiments, these response latencies decreased to 61.22 ± 5.25 and 53.52 ± 3.02 ms for the left and right broadcast locations. At the start of experiments, flies walked a mean distance of 7.26 ± 0.52 and 8.65 ± 0.68 cm to localize the left and right broadcast locations. Total walking distances at the end of experiments were 8.58 ± 0.68 and 8.14 ± 0.54 cm for the left and right broadcast locations. These total walking distances did not differ significantly between broadcast locations [F(1, 15) = 1.46, P = 0.25] and did not change between the start and end of experiments [F(1, 15) = 0.66, P = 0.43]. Taken together, these data suggest that motivation to respond did not decrease over the duration of experiments.
Response Features to a Preferred Cricket Song
Steering velocity indicates changes in x values as a function of time and is depicted in Figure 2C. Shortly after stimulus onset flies track the left speaker location with negative velocities that peaked at −4.54 ± 0.31 cm/s. With a switch in the broadcast location, steering velocities transitioned to positive values that peaked at 3.48 ± 0.36 cm/s. Following stimulus offset, steering velocities decreased rapidly toward baseline values. Forward velocity indicates the speed of movement in the forward direction and is plotted as changes in y values over time (Figure 2D). Shortly following stimulus onset, forward velocity increased to about 4 cm/s in response to the first broadcast location. Immediately after the switch in broadcast location, forward velocities were often elevated to beyond 5 cm/s. At the end of stimulus presentation, forward velocities decreased briefly before returning to higher velocities. The apparent decrease in response after stimulus offset followed by a slight increase in activity across several response features (cumulative distance, steering velocity, forward velocity) confirmed that some flies only paused briefly and then continued to walk for some time to search for the source location.
Changes in x and y values can be transformed from the Cartesian plane to polar coordinates and expressed as instantaneous angular headings which indicate the angular direction relative to the starting direction (0°) (Figure 2E). As flies turned left, instantaneous angular headings become more negative and reached a peak mean angular heading of −45.02 ± 2.80°. Following the switch in broadcast location, flies transitioned to positive angular headings (Figure 2E).
Quantifying Response Features as a Function of Changes in Pulse Rates
We examined how different phonotaxis response features varied as a function of song pulse rates. Response latencies did not significantly differ for songs with different pulse rates (Friedman Test: χ2 = 5.691, P = 0.770, n = 16, Figure 3A) but total walking distance varied significantly with song pulse rates [F(3.20, 47.93) = 37.21, P < 0.001, Figure 3B]. Averaged across pulse rate conditions, flies responded with a mean latency of 64 ± 2 ms and a mean total distance of 6.01± 0.46 cm. Walking distances in response to the 60 pps song did not significantly differ from responses to the 50 pps standard song.
Figure 3
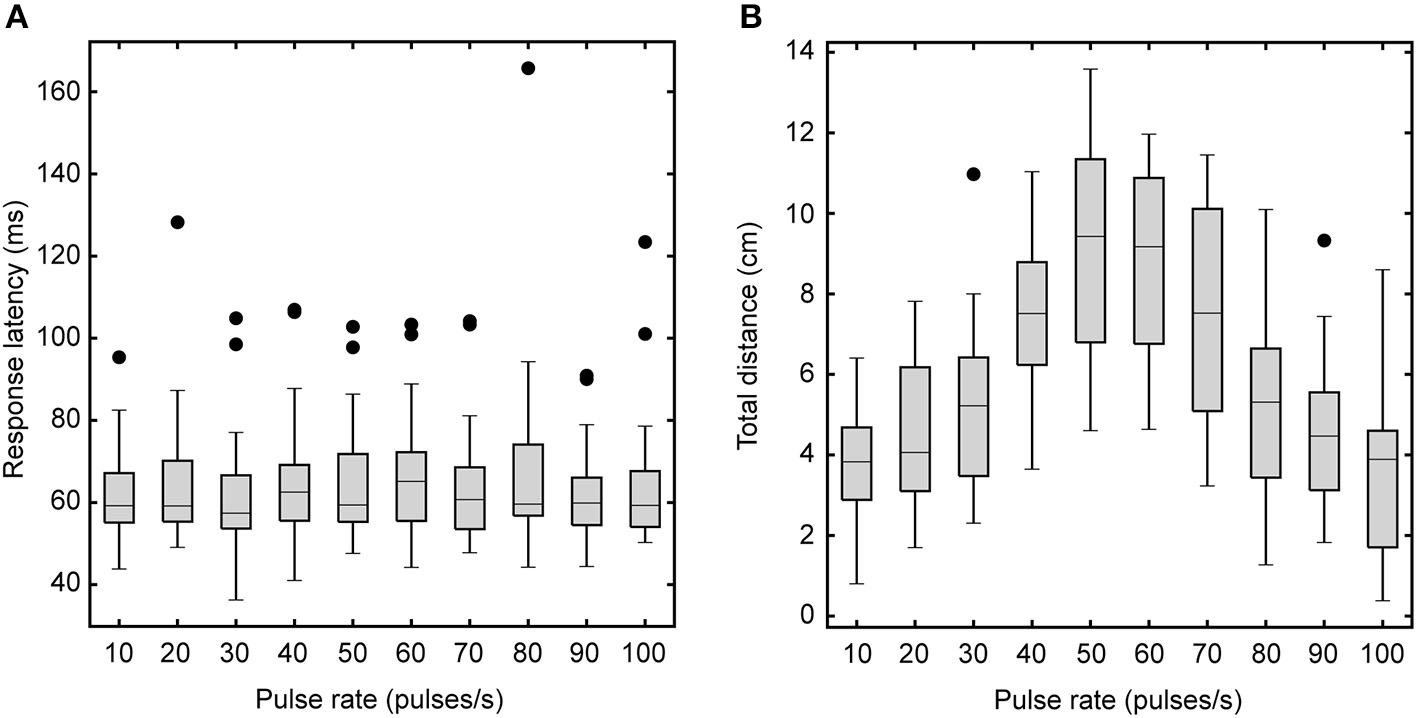
Effects of song pulse rate on response latency and total walking distance. Box plots depict the first and third quartiles and median response latency (A) and walking distance (B). Response latencies (A) do not vary with song pulse rate. However, total walking distance (B) varies with song pulse rate. Flies travel greater distances for the most preferred pulse rates. Whiskers show the most data extreme points that are not considered outliers, and closed circles indicate outliers.
Both steering and forward velocities varied systematically and significantly with song pulse rates (steering velocity: F2.92, 43.85 = 39.53, P < 0.001; forward velocity: F3.97, 59.57 = 21.60, P < 0.001, n = 16, Figures 4A,B). As pulse rates increased from 10 to 40 pps, mean steering velocities increased from 1.12 ± 0.07 to 2.04 ± 0.15 cm/s while forward velocities increased from 2.18 ± 0.18 to 3.42 ± 0.26 cm/s. Mean steering velocity reached a peak of 2.4 ± 0.18 cm/s at 50 pps while mean forward velocity reached a peak of 3.90 ± 0.33 cm/s at 60 pps. Mean steering and forward velocities were reduced in response to songs at higher pulse rates (Figures 4A,B). To examine response differences to the initial and subsequent broadcast locations, we calculated mean steering and forward velocities across the first 500 ms (Figures 4C,E) of stimulus and across the remaining 500 ms of stimulus presentation separately (Figures 4D,F). There was a significant main effect of the initial or subsequent broadcast location on steering and forward velocities (steering velocity: F1, 15 = 89.54, P < 0.001; forward velocity: F1, 16 = 13.03, P = 0.03, n = 16). Steering and forward velocities were generally higher in response to the initial source location (steering velocity: 3.37 ± 0.30 cm/s; forward velocity: 1.99 ± 0.13 cm/s) than compared to the subsequent location (steering velocity: 2.67 ± 10.25 cm/s; forward velocity: 1.18 ± 0.08 cm/s) (steering velocity: F1, 15 = 89.54, P < 0.001; forward velocity: F1, 15 = 13.03, P = 0.03, n = 16).
Figure 4
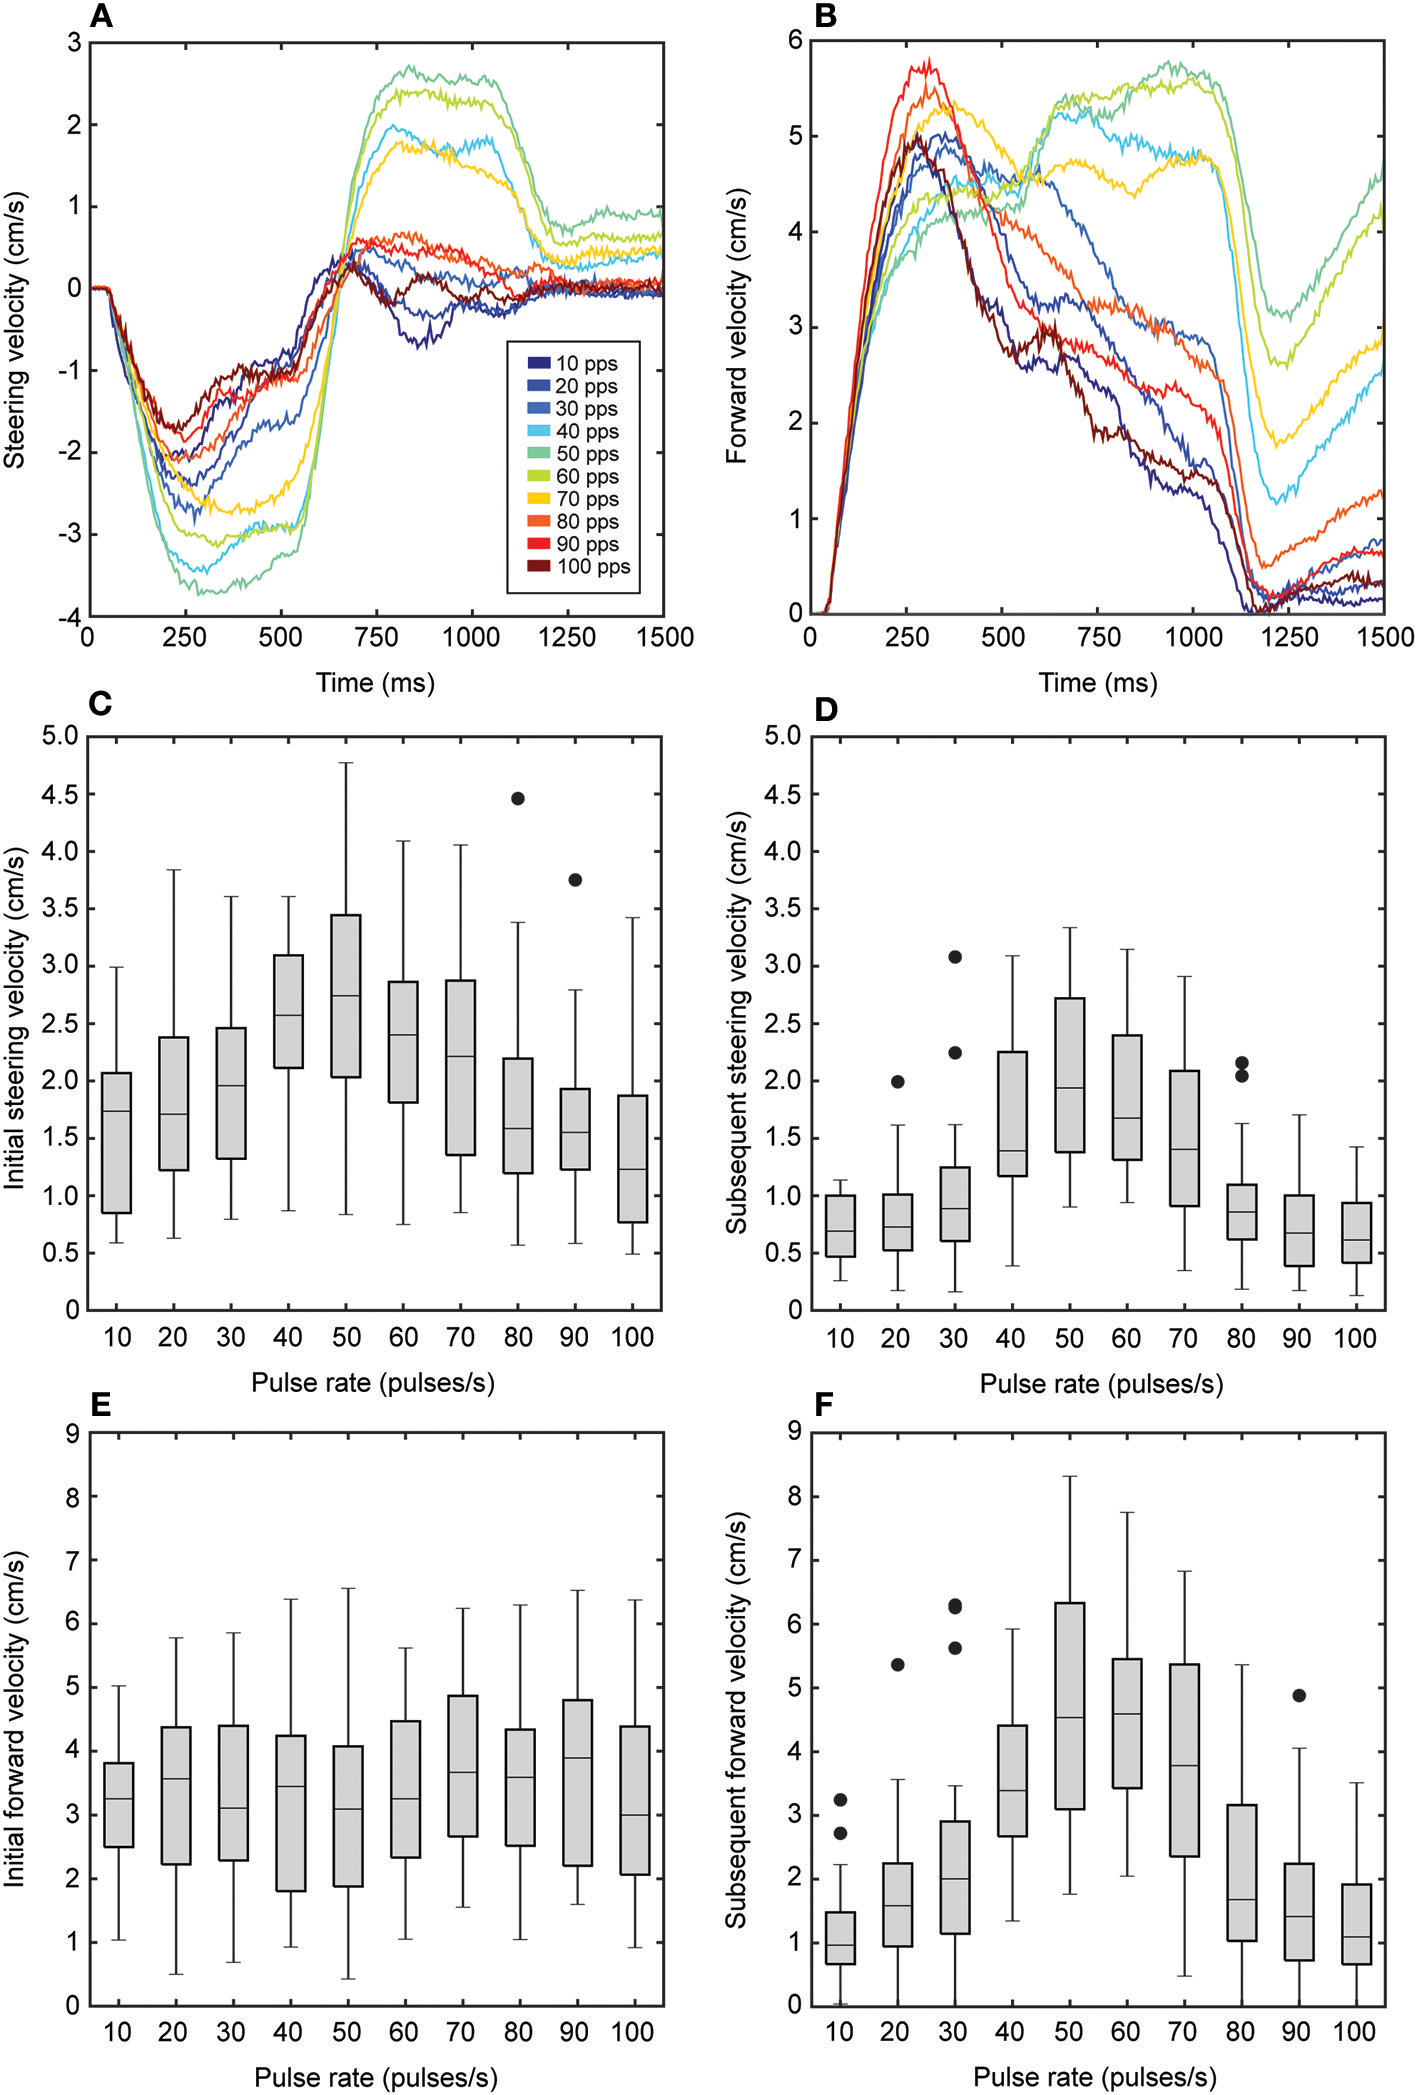
Effects of song pulse rate on steering and forward velocities. (A) Flies steered to the left to track the initial 500 ms of song broadcast. This was followed by a steering response to the right to track the switch in broadcast location for the remaining 500 ms of song. The magnitude of steering responses varied with song pulse rate (colors). Steering to the initial broadcast location was less selective while steering to the subsequent location showed greater selectivity to songs with pulse rates that range from 40 to 70 pps. In response to the initial broadcast location, flies exhibited an increase in forward velocity (B) that varied as a function of song pulse rate. When the song was switched to the subsequent broadcast location, forward velocity continued to be elevated for the most preferred pulse rates (40–70 pps) but decreased for less preferred pulse rates. (C–F) Box plots depict the first and third quartiles and median steering (C,D) and forward velocity (E,F) values at 250 and 750 ms time points in response the initial (C,E) and subsequent (D,F) broadcast locations as a function of song pulse rate. In response to the initial broadcast location, mean steering velocity varied with pulse rate (C) while mean forward velocity did not vary with pulse rate (E). Flies exhibited greater selectivity in response to the subsequent broadcast location. Steering (D) and forward (F) velocities reached peaked at the most preferred pulse rates. Whiskers in box plots show the most data extreme points that are not considered outliers, and closed circles indicate outliers.
To determine the angular heading directed at each broadcast location, angular headings were taken from instantaneous angular headings (i.e., Figure 2E) at 250 and 750 ms time points. These time points correspond to the middle of stimulus presentation for each broadcast location. Mean angular heading depended on song pulse rate (Figures 5A,B). In response to song presentation from the initial broadcast location, flies generally localized a direction that approached the speaker location (left speaker at −45°). For a 50 pps song, flies turned with a mean angular heading of −22.95 ± 2.06°, which is significantly more negative than responses to lower (10 pps: −10.66 ± 2.18° U2 = 0.256, P < 0.02, 20 pps: −13.94 ± 2.25° U2 = 0.185, P < 0.05) and higher pulse rates (70 pps: −13.80 ± 2.05° U2 = 0.231, P < 0.02, 80 pps: −13.43 ± 1.72° U2 = 0.344, P < 0.002, 90 pps: −8.26 ± 2.98° U2 = 0.307, P < 0.005, 100 pps: U2 = 0.292, P < 0.005). Mean angular headings in response to 40 (−21.26 ± 1.88°) and 60 pps (−20.68 ± 1.55°) did not significantly differ from responses to the 50 pps song (50 vs. 40 pps: U2 = 0.099, P >0.2, 50 vs. 60 pps: U2 = 0.084, P >0.2). For songs with less preferred pulse rates, flies exhibited weaker steering responses that resulted in mean angular headings that were closer to the midline (Figure 5A). With a switch in the broadcast location, flies exhibited slightly weaker steering responses with smaller mean angular headings that were mostly directed in the forward direction (Figure 5B). For a 50 pps song, flies turned with a mean angular heading of 13.78 ± 2.29°, which is significantly more positive than responses to the most extreme pulse rates (50 vs. 10 pps: U2 = 0.226, P < 0.05, 50 vs. 100 pps: U2 = 0.187, P < 0.05). However, there was a slightly higher tendency for flies to exhibit more positive angular headings toward the subsequent speaker location for songs near the preferred pulse rate.
Figure 5
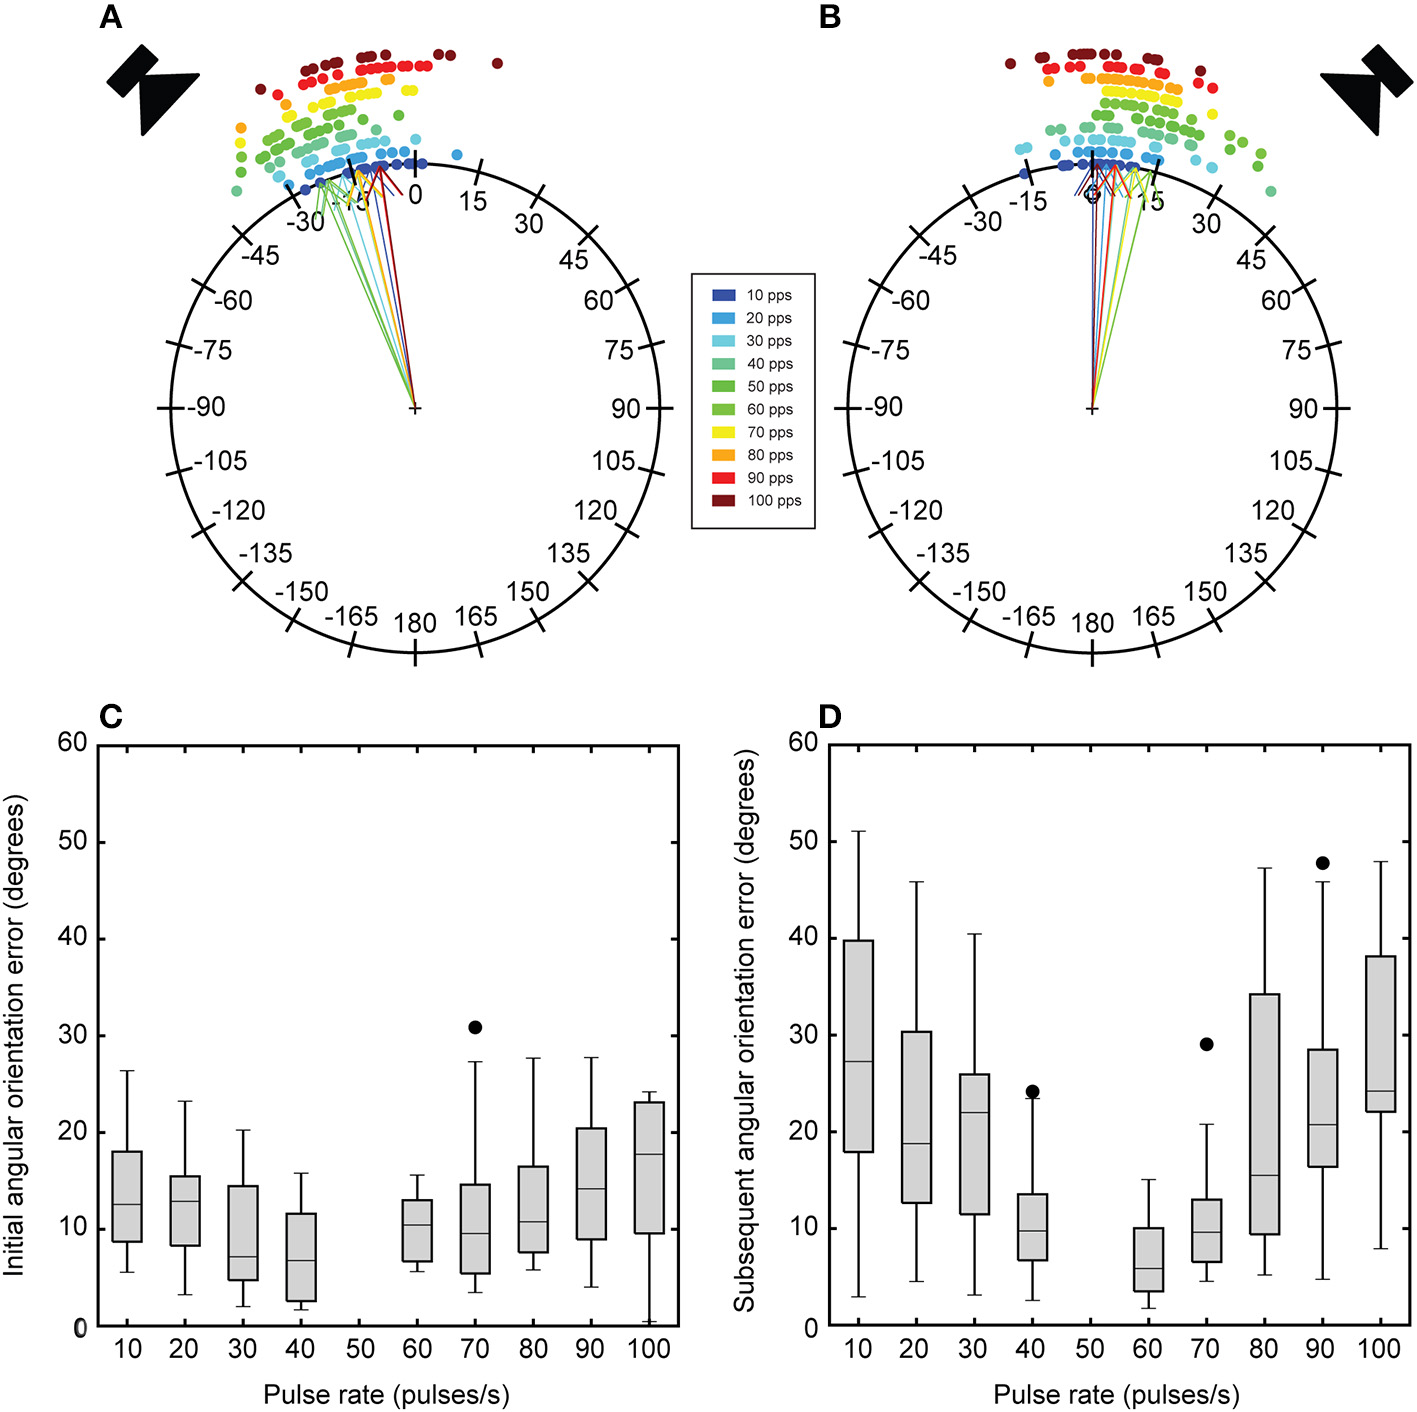
Effects of song pulse rate on mean angular heading and angular orientation error. Circular plots depict the angular headings in response to the initial broadcast location 250 ms into stimulus presentation (A) and to the subsequent broadcast location 750 ms into stimulus presentation (B). Dots around the circular plots are mean angular responses in degrees from a single fly to a particular pulse rate (colors). Arrows indicate the grand mean across 16 flies for a particular pulse rate. Initial angular headings vary as a function of song pulse rate. These initial angular headings are generally larger (more negative) and approach the initial broadcast location. Angular headings in response to the subsequent broadcast location are generally more forward directed except for responses to the most preferred pulse rates. These responses exhibit positive angular headings toward the subsequent broadcast location. Box plots depict the first and third quartiles and median angular orientation error in response to the initial (C) and subsequent (D) broadcast locations. Flies exhibit greater orientation error for songs with less preferred pulse rates and these errors are elevated in response to the subsequent broadcast location. Whiskers show the most data extreme points that are not considered outliers, and closed circles indicate outliers.
Angular orientation error represents the angular difference between the mean angular heading in response to the standard song and test songs. The error in angular orientation to each speaker location were taken at 250 (Figure 5C) and 750 ms (Figure 5D) time points during stimulus presentation. With a switch in broadcast location, error in angular orientation was significantly greater for re-orientation responses than for initial localization responses [F(1, 13) = 13.25, P = 0.003]. Error in angular orientation was significantly affected by song pulse-rate [F(4.13, 53.70) = 24.55, P < 0.001]. Pairwise comparisons reveal that flies exhibited significantly greater orientation errors at less preferred pulse rates (10–40 and 60–100 pps, all Ps < 0.001. There was also a significant interaction effect between pulse-rate and presentation order [F(4.77, 61.96) = 6.04, P < 0.001]. Re-orientation responses to non-preferred pulse-rates (10–40 pps and 60–100) exhibited significantly greater angular orientation error (Figure 5D).
Feature Selection and Deriving the Phonotaxis Performance Index
We applied an information-theoretic feature selection analysis (Peng et al., 2005) to objectively select response features to incorporate in our novel phonotaxis performance index. Starting with a list of seven response features, we used mRMR to rank response features that maximize feature relevance while minimizing feature redundancy. The output of the mRMR analysis is presented in Table 1. This analysis ranked steering velocity, total distance, and angular heading as top features that significantly predicted pulse rate preference (Walker, 1993) while minimizing correlation between features. These features were incorporated in candidate phonotaxis performance indices that compared responses to test songs relative to responses to the reference 50 pps standard song (Table 2). We applied a mutual information analysis to describe the amount of information gained (in bits) about the known pulse rate preference based on evaluating candidate phonotaxis indices presented in Table 2. The outcome of this information analysis is the following equation (Table 2, Equation 8) to quantify phonotaxis performance:
Other candidate phonotaxis indices that include a greater or lesser number of response features reduced the overall information gained (Table 2).
Using the Phonotaxis Performance Index to Capture Signal Preferences
In addition to the 16 Floridian O. ochracea, we also examined pulse rate preferences in 16 Californian O. ochracea. We found a significant main effect of pulse rate on the phonotaxis performance index [F(9, 270) = 28.28, P < 0.001, n = 16; Figures 6A,B]. However, neither the main effect of population nor the interaction between pulse rate and population were significant (population: F1, 30 = 1.42, P = 0.24, population × pulse rate: F9, 270 = 1.41, P = 0.18). The phonotaxis performance index increased gradually for pulse rates between 10 and 40 pps, reached a peak for pulse rates between 50 and 60 pps, and decreased with further increases in song pulse rates. Pairwise comparisons reveal that the 50 pps song resulted in significantly higher index values than compared to all other pulse rates (all Ps < 0.05). Median index values were fitted with a smoothing cubic spline to generate preference functions (Figure 6C). These preference functions suggest that Californian O. ochracea exhibit a slightly broader pulse rate preference function than compared to Floridian O. ochracea.
Figure 6
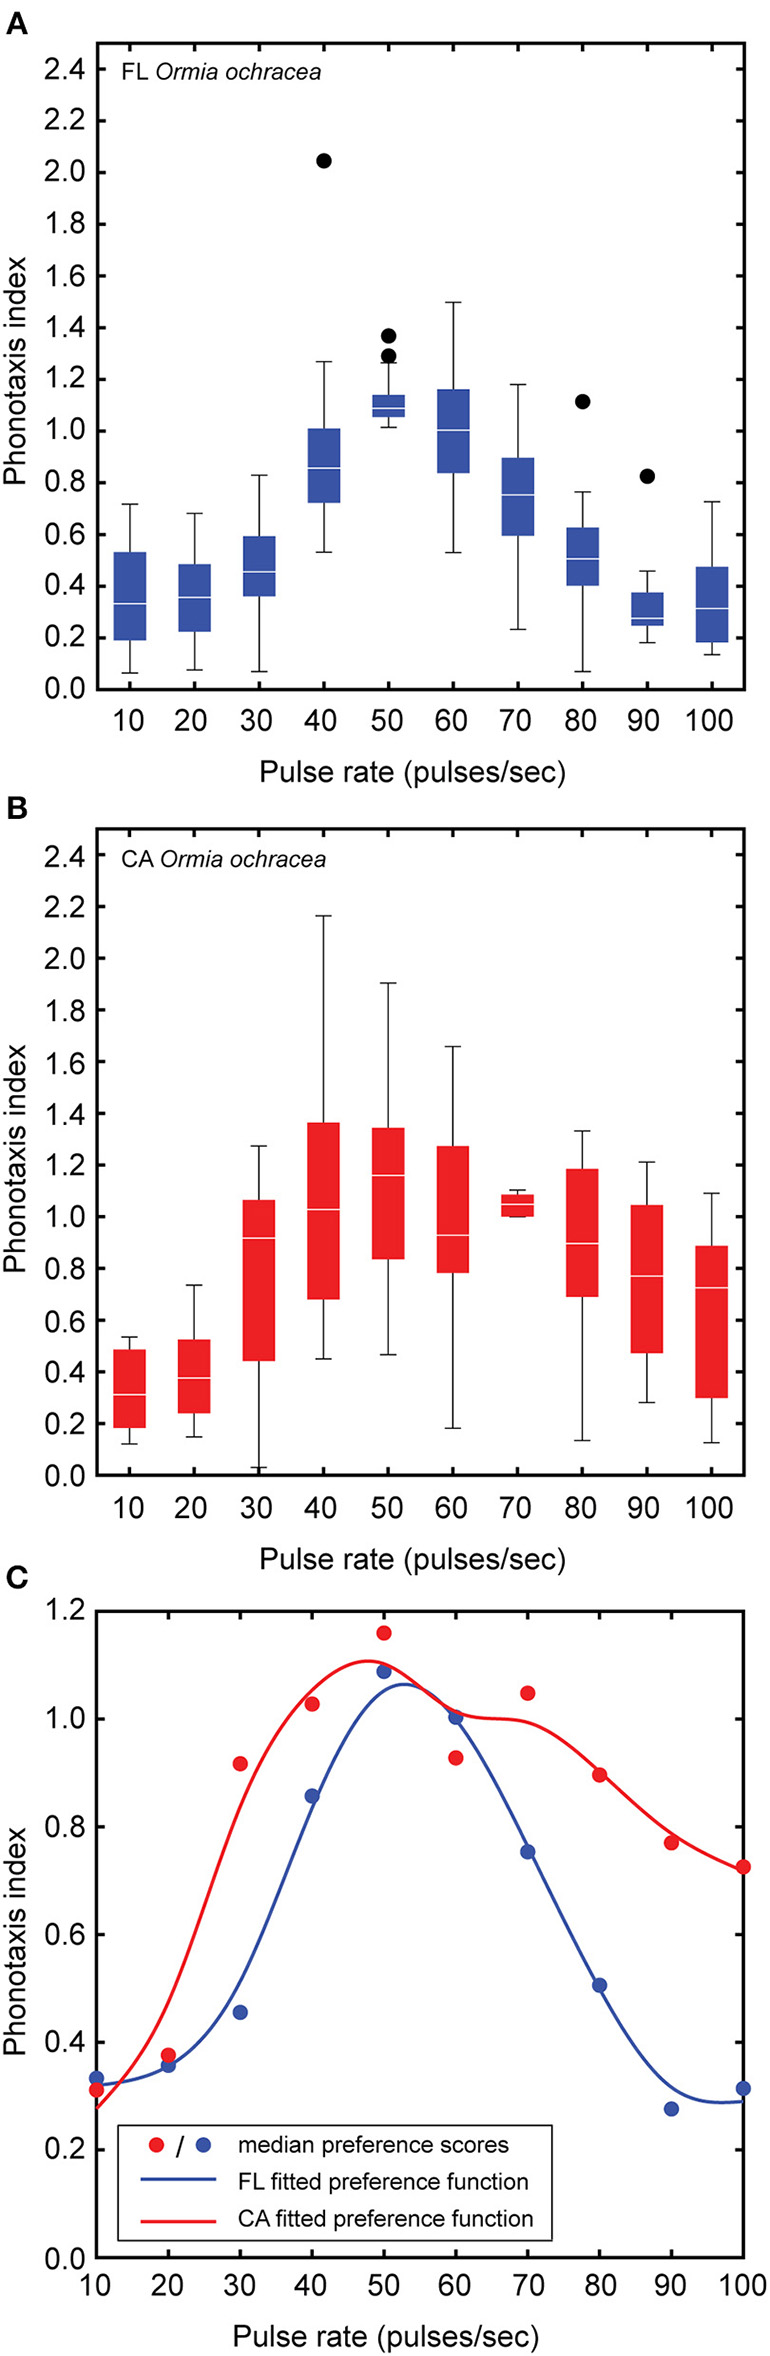
Effects of song pulse rate on the phonotaxis performance index. Box plots depict the first and third quartiles and median phonotaxis index values obtained from Floridian (A) and Californian (B)Ormia ochracea. (C) A smoothing cubic spline was fitted to median phonotaxis index values to generate pulse rate preference functions. Whiskers show the most data extreme points that are not considered outliers, and closed circles indicate outliers.
Discussion
Developing a Phonotaxis Performance Index to Capture Signal Preferences
In this study, we document an approach (Figure 7) for developing a novel method for quantifying taxis behavior, and we use this method to describe pulse-rate preferences in two populations of Ormia ochracea. First, this approach relies on some understanding of signal preferences in nature (i.e., pulse rate preference in Floridian O. ochracea established from field experiments) or a predicted salient signal value (i.e., a pulse rate of 70 pps based on the calling song of host crickets parasitized by Californian O. ochracea) of a specific signal parameter. Next, response variation to different test signal values are measured relative to reference responses to a salient signal. In our experiments, we examined pulse-rate preferences during walking phonotaxis with an assay that measured the ability of animals to track a switch in the broadcast location for songs that varied in pulse rates. Using the spherical treadmill system, we measured how a range of response parameters (i.e., latency, walking distance, peak and mean steering velocities, and etc.) varied with pulse rate. This was followed by a feature selection analysis to select response features that best predict a known signal preference. We applied mRMR to maximize mutual information while minimizing redundancy of selected features to predict the known pulse rate preference.
Figure 7
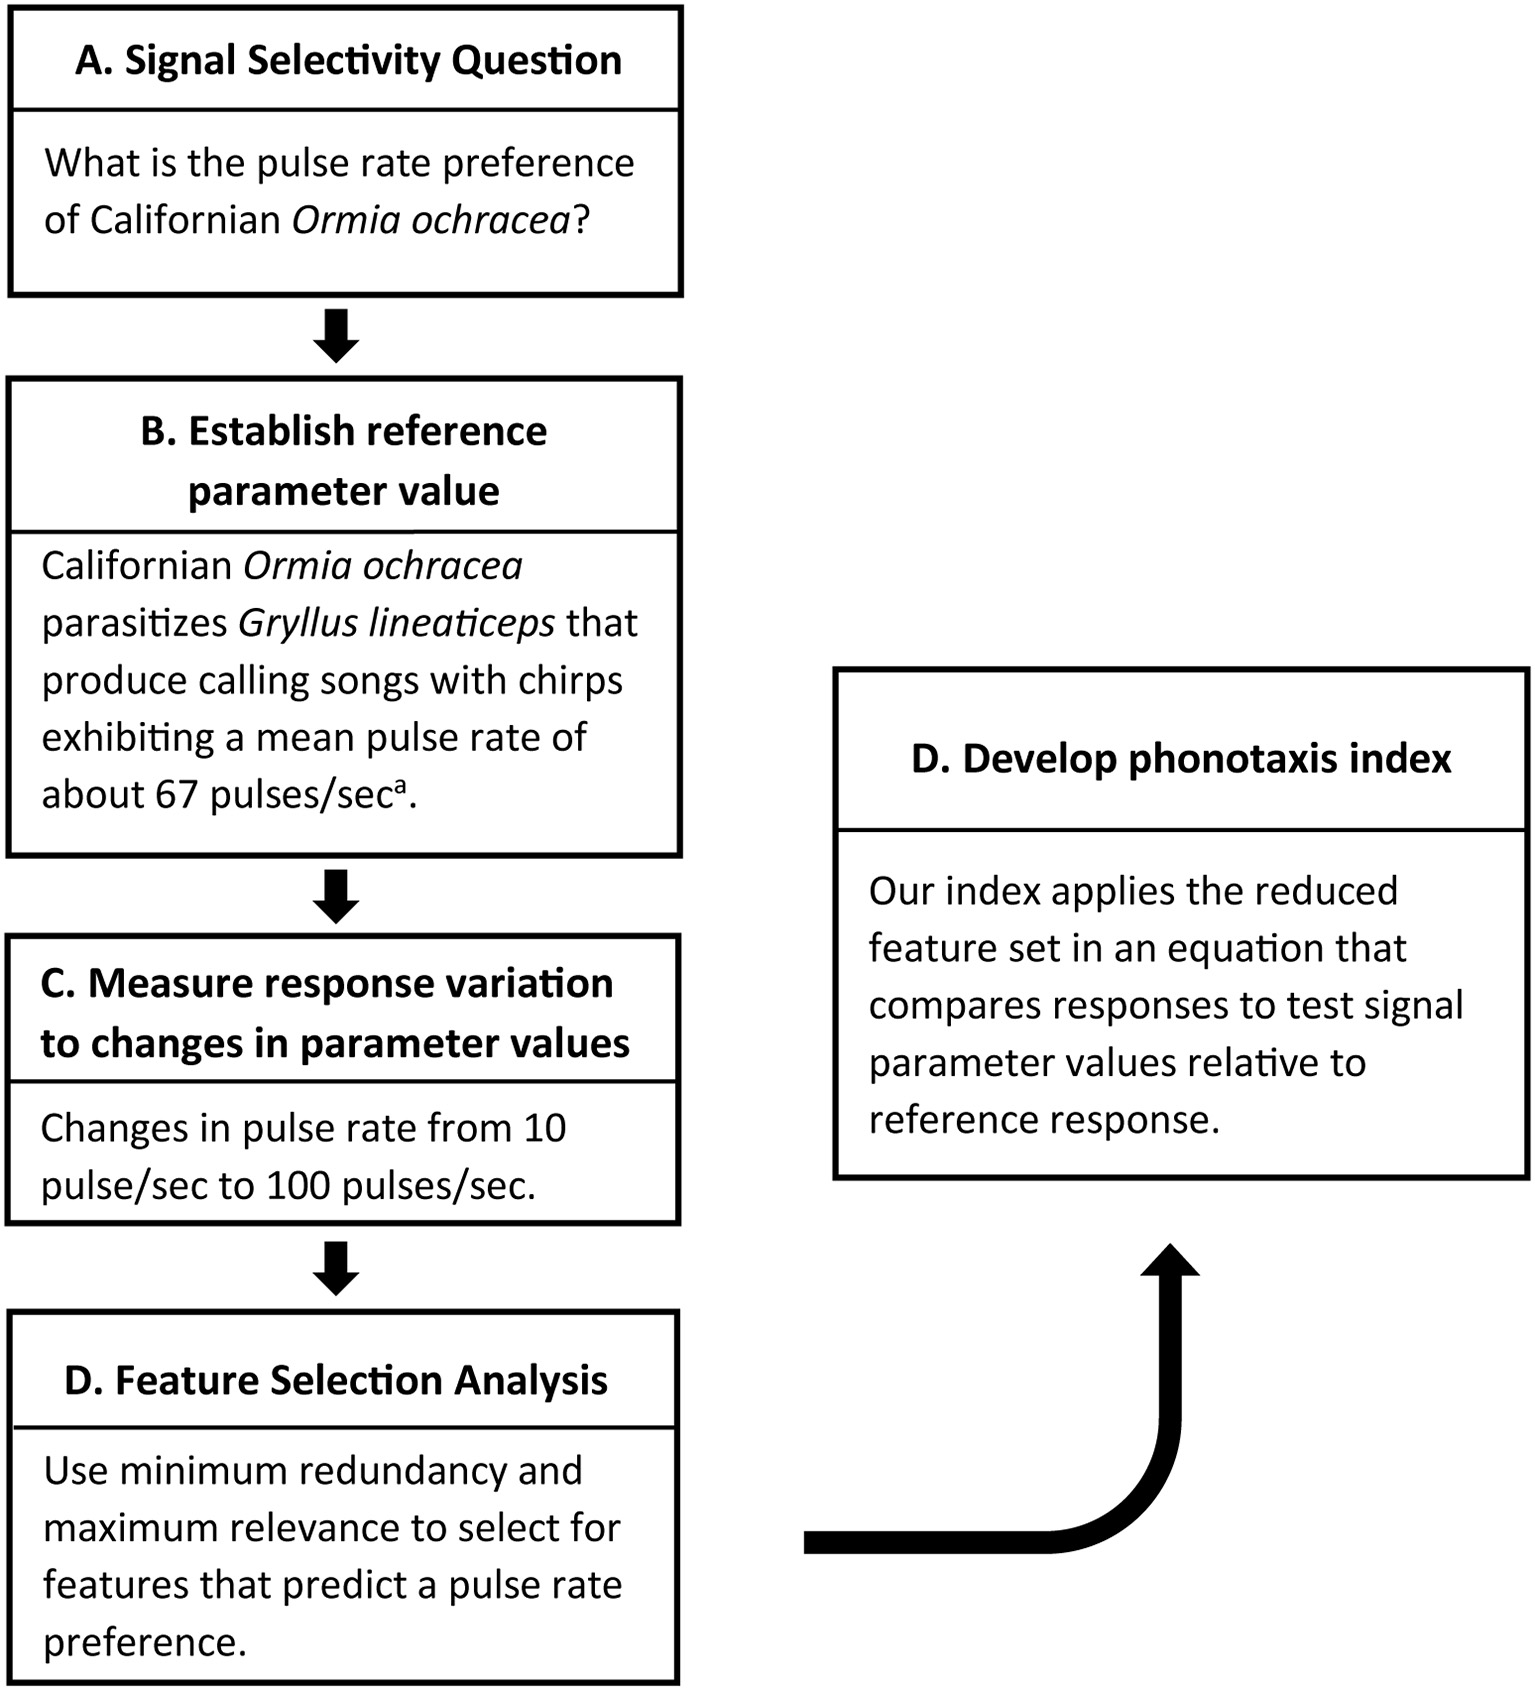
Approach for developing a phonotaxis performance index. Developing a phonotaxis performance index to address a specific question (A) with some knowledge of salient signal values of a particular signal feature (B) to serve as a reference for comparison. (C) Behavioral responses are measured in response to varying signal values. This is followed by a feature selection approach to narrow down the list of response features that predict natural signal preferences. (D) These response features are incorporated into a performance index that compares responses to test signals relative to a reference response. aMean pulse rate reported in Wagner and Reiser (2000). Measures of variance not reported.
In Floridian O. ochracea, all these response features varied significantly to changes in song pulse rates. Walking distance increased for pulse rates between 10 and 30 pps, reached a level of saturation from 40 to 70 pps, and decreased with further increases in pulse rate. Similar trends were observed for steering and forward velocities, especially during re-orientation responses to the subsequent broadcast location. Mean angular heading to the initial broadcast location was less selective as flies oriented to a direction that approached the broadcast location for a broad range of pulse rates. Re-orientation responses, however, were more selective and flies most accurately localized the song broadcast following a switch in source location for pulse rates between 40 and 70 pps. Flies steered to track the switch in broadcast location with the smallest orientation error, for this same range of pulse rates when test responses were compared to those of the standard 50 pps song of G. rubens. Above and below the 40–70 pps range, mean steering velocity decreased while orientation error increased. Taken together, the reduced list of features included distance, mean steering velocity and error in angular orientation. These features were suited for inclusion in our novel phonotaxis performance index that compares responses to test signals relative to a reference signal. Based on this index, O. ochracea expressed a clear preference function, centered on a pulse rate matching the song of the preferred host for the Florida population, and consistent with results from flying phonotaxis studies (Walker, 1993).
We applied our phonotaxis performance index to examine pulse rate preference in Californian Ormia ochracea. Our analysis revealed that Floridian and Californian O. ochracea exhibit similar pulse rate preferences. While the pulse rate preference function of Floridian O. ochracea is sharply “tuned” to 50 pps, the preference function of Californian O. ochracea appear to be more broadly centered around pulse rates that range from 40 to 70 pps (Figure 6C). We suggest that this subtle difference in selectivity may relate to differences in the number of potential host cricket species that each population utilizes for reproduction. Floridian, O. ochracea is known to mainly parasitize the southeastern field cricket Gryllus rubens (Walker, 1986; Walker and Wineriter, 1991; Gray et al., 2007), a species that produces a trilling calling song with a pulse rate of ~50 pps. In California, O. ochracea rely on the variable field cricket Gryllus lineaticeps as their preferred host, which produces chirps consisting of ~8 sound pulses produced at ~67 pps. However, Californian O. ochracea may also utilize the western stutter-trilling cricket Gryllus integer and the long-chirp field cricket Gryllus multipulsator as potential host species (Weissman et al., 2009; Paur and Gray, 2011b). Gryllus integer produces trills with brief gaps separating groups of ~3 sound pulses at a pulse rate of ~70–90 pps while G. multipulsator produces long chirps with a pulse rate of ~78 pps (Weissman et al., 2009). Broader pulse rate selectivity may allow Californian O. ochracea to potentially exploit a greater number of host species for the development of their larval young.
Field experiments clearly demonstrate differences in host cricket preferences between Floridian and Californian O. ochracea (Gray et al., 2007). While the carrier frequency of field cricket calling songs are generally similar, the temporal patterning of sound pulses is species-specific (Gerhardt and Huber, 2002). In addition to differences in pulse rates, cricket songs also differ in the fine scale temporal structure of sound pulses (i.e., pulse durations and the interval between pulses) and larger scale temporal organization of sound pulses into chirps and gaps between and within trills (Hedwig, 2014). In the current experiments, we examined pulse rate preferences in test songs by manipulating pulse durations and intervals by equal amounts to maintain a 50% duty cycle. These experiments were not designed to examine signal selectivity based on differences in the duration of sound pulses, the interval between sound pulses, and the larger temporal organization of sound pulses into songs. Future experiments should directly test for specific temporal features that underlie song preferences in the field.
Advantages and Limitations of the Phonotaxis Performance Index
We have demonstrated that our approach for developing a sensitive phonotaxis performance index can be applied to examine signal preferences exhibited during walking phonotaxis. No-choice paradigms were thought to provide little information regarding song preferences because animals tend to respond with less discrimination when presented without choice (Doherty, 1985; Wagner, 1998). Consistent with Bush and colleagues (Bush et al., 2002), we argue that no-choice paradigms can provide additive information in studying song recognition and signal preferences. In no-choice experiments, Bush et al. calculated a phonotaxis index based on measuring the ratio of response time to reach the source location for a control advertisement call compared to alternative advertisement calls (Bush et al., 2002). This index revealed variation in response timing to changes in pulse rates that facilitate call recognition in two closely related species of treefrogs (Hyla chrysoscelis and Hyla versicolor). By using a carefully selected phonotaxis task (tracking a switch in source location), our study demonstrates the opportunity to measure variation in tracking performance that is indicative of signal preferences. This preference is quantified using a composite performance index that consists of the most predictive response parameters that results in a heightened sensitivity for detecting a pulse rate preference.
By definition, an index of behavioral performance must be designed to measure task-relevant variability in the behavioral responses. The task, therefore, is to determine which variables best represent the behavior in question. Previously developed phonotaxis performance indices characterized response variation underlying song recognition in orthopteran insects (Schul, 1998) and anurans (Bush et al., 2002). Sound localization behavior in orthopterans and anurans is characterized by turning responses to lateral sound sources resulting in a walking path meandering around a direct route to the source location. Lateralization, because it requires corrective turns to reorient to the source location, causes large variation in the directedness of walking paths, greater total walking distances required to arrive at a source, and increased time required to locate a sound source (Murphey, 1972; Rheinlaender et al., 1979; Gerhardt and Rheinlaender, 1980; Rheinlaender and Blatgen, 1982). In contrast, O. ochracea precisely follow a direct walking path in phonotaxis and this renders previous phonotaxis indices unsuitable for quantifying walking phonotaxis in O. ochracea. Turns in our study were elicited by requiring flies to track a shift in source location, and steering velocity was a salient response parameter. This may also be the case in other systems, where some measures of phonotaxis have focused on path sinuosity, rather than turning dynamics.
In principle, our approach could also be applied to quantify signal preferences during flight. Flying phonotaxis has been studied in O. ochracea using a tethered flight paradigm (Rosen et al., 2009). Similarly to crickets, flies adopt steering maneuvers toward stimuli with the temporal pattern and frequency content of cricket calling songs (~4.5 kHz), but steer away from stimuli with ultrasonic frequencies (>20 kHz) that are characteristic of bat sonar (Wyttenbach et al., 1996; Rosen et al., 2009). Developing an index to quantify performance in flying phonotaxis would likely involve measuring response latencies and the magnitude of steering maneuvers to (or away from) the source location. In flies and crickets, there appears to be a sharp boundary between two categories along a frequency continuum that distinguishes an attractive cricket host from the echolocation calls of insectivorous bats (Wyttenbach et al., 1996). This frequency based categorical perception of cricket calling songs and bat vocalizations is similar to the human auditory perception of phoneme boundaries that separate /pa/ and /ba/ involved in speech comprehension (Liberman et al., 1957). We expect that our approach can also be applied to other psychoacoustic studies that probe similar perceptual phenomena involved in auditory grouping and sound source segregation.
Walker (1993) documented a pulse rate preference in Floridian O. ochracea expressed during flying phonotaxis in response to synthetic cricket songs that varied in pulse rates. By measuring capture rates with an array of sound traps that presented different pulse rate songs, Walker found that highest capture rates occurred at the sound trap presenting the standard 45 pps song. Plotting the proportion of flies captured as a function of pulse rate resulted in a preference function with a “bell-shaped curve” centered between 45 and 50 pps (Figure 4B in Walker, 1993). We validated our approach by using identical stimuli in the current study so that pulse rate preferences during walking phonotaxis in the laboratory would be directly comparable to field results. Our results yield a similar preference function for walking phonotaxis, and provide a tractable approach for measuring other dimensions of song preferences and signal features that may be evaluated for song recognition (e.g., pulse duration, duty cycle, etc.).
Given that different populations of O. ochracea are locally adapted to parasitize different host cricket species (Gray et al., 2007), our index will also provide a unique opportunity to investigate whether these populations evaluate the same or different signal features for song recognition. Short-term learning of species-specific song patterns based on acoustic experience has been documented in Californian O. ochracea and this suggests that the song recognition “template” is malleable to some degree (Paur and Gray, 2011a). Our index can be applied to further examine how learning and memory can shape host choice among different populations and to characterize the extent of learning specific signal features that may limit host switching.
We expect that the current phonotaxis performance index will be directly applicable for quantifying behavior in other acoustically orienting parasitoid flies that eavesdrop on the communication signals of orthopterans or hymenopterans (Lehmann, 2003; Lakes-Harlan and Lehmann, 2015). Some flies in the tribes Orminii and Emblemasomatini (Lakes-Harlan and Lehmann, 2015), making up ~68 species of acoustically orienting parasitoids, have evolved to eavesdrop on the communication signals of a range of host species with signals that differ in spectral and temporal features (Lehmann, 2003). Some of these flies include tachinids such as: Ormia depletea that parasitize mole crickets (Scapteriscus spp.) (Fowler, 1987; Parkman et al., 1996), Ormia linefrons, Homotrixa alleni, and Therobia leonidei that parasitize various katydid species (Burk, 1982; Allen, 1995; Shapiro, 1995; Lehmann, 2003) and sarcophagids (i.e., Emblemasoma auditrix) that parasitize cicadas (Schniederkotter and Lakes-Harlan, 2004). The evolution of convergent signal preferences between some eavesdroppers and intended receivers (Wagner, 1996; Bernal, 2006; Aihara et al., 2016) suggests that they are solving similar sensory problems: detecting, recognizing, and localizing common communication signals. However, signalers and eavesdroppers likely accomplish these sensory processing tasks with different peripheral and central nervous systems. Applying our phonotaxis performance index along with a phylogenetic approach to investigate signal preferences among eavesdroppers can provide important insights into the diversity of sensory strategies that shape the evolution of host choice.
Although not explicitly tested in this current study, we believe that our approach for developing a phonotaxis performance index is general and should be applicable for measuring stimulus-evoked locomotor behavior in other animals. However, the current index was specifically developed to capture response variation in the relatively more direct phonotactic responses of O. ochracea. Consequently, our index may only be applicable for measuring behavior in O. ochracea and in other acoustically orienting parasitoid flies.
Avoiding Parasitism From Eavesdropping Acoustic Parasitoid Flies
Crickets parasitized by O. ochracea experience almost certain death (Adamo et al., 1995). This strong selective pressure imposed by O. ochracea has the potential to drive the evolution of sensory strategies that prey can take to avoid parasitism (Zuk and Kolluru, 1998). In one striking example, males of the Polynesian field cricket Teleogryllus oceanicus has lost the ability to produce calling songs to attract potential mates. This strong selective pressure imposed by O. ochracea has led to the proliferation of a single-gene wing mutation in T. oceanicus to occur on several of the Hawaiian Islands (Zuk et al., 2006; Tinghitella, 2007; Pascoal et al., 2014). Males exhibiting this mutation are mute and lack the necessary wing morphology to produce calling songs despite trying to do so (Zuk et al., 2006; Tinghitella, 2007; Schneider Will et al., 2018). However, this adaptive response to evade natural selection imposed by O. ochracea is balanced by sexual selection that favors the production of calling songs (Tanner et al., 2019) as female crickets discriminate strongly against males that cannot produce calling songs (Bailey and Zuk, 2008; Tinghitella and Zuk, 2009). Crickets with this deficit pay a fitness cost and must rely on alternative mating tactics (i.e., satellite behavior) for reproductive success (Kolluru et al., 2002; Tanner et al., 2019). Whether normal-winged crickets can directly avoid parasitism from O. ochracea by altering spectral or temporal characteristics (i.e., pulse durations, interpulse intervals, and pulse rate) of their calling songs remains unknown.
Crickets can avoid parasitism by signaling during periods of low parasitoid activity (Cade et al., 1996; Vélez and Brockmann, 2006), or by producing calling songs that are shorter and less conspicuous (Lehmann and Heller, 1998). However, the effectiveness of interrupted calling may be limited as some parasitoids can estimate host location while in flight and land within centimeters of an attractive sound source (Müller and Robert, 2001, 2002). Alternatively, signalers may adopt the strategy of communicating in a chorus as this can lower the risk of any one individual from being parasitized, or it may confuse eavesdroppers of signaler location (Goodale et al., 2019). Synchronized signaling or the presence of masking noise can lead to the perception of a “phantom” sound source location that does not correspond to the actual signaler location (Lee et al., 2009; Lee and Mason, 2017), but O. ochracea can also exploit small time differences between signalers via the precedence effect to locate host crickets (Lee et al., 2009).
Finally, we stress that the effectiveness of behavioral strategies or signal design to avoid parasitism can be evaluated by performing psychoacoustic experiments that measure sensory perception in eavesdroppers. We describe a rigorous approach to developing a measure to quantify signal selectivity. This approach can be generalized to study locomotor responses in acoustically orienting eavesdroppers and the specific index that we present here can be applied across parasitoid flies to investigate sensory strategies that orthopteran and hymenopteran victims can take to avoid parasitism.
Statements
Author contributions
NL and AM: conceptualization, writing—original draft, resources, supervision, and funding acquisition. NL, IP, and AM: methodology. NL, AK, KJ, and DK: investigation. NL: data curation and visualization. NL, AK, IP, KJ, and AM: writing—review and editing.
Funding
This project was funded by NSERC Discovery Grant 241419 to AM. This project also received funding support from the St. Olaf College Collaborative Undergraduate Research and Inquiry (CURI) program and a St. Olaf Professional Development grant awarded to NL.
Acknowledgments
We would like to thank T. J. Walker and A. J. Masson for assistance in fly collection. We would also like to thank Mei Yi Chen, Luis J. Almanza, Luis F. Almanza, Alayna Bowlin, Keenan Ernste, and Trung Vu for maintaining the fly colony, and Matthew T. Erickson for help with data collection. We appreciate help from Dr. J. M. Park in troubleshooting circuit design issues in the spherical treadmill system. We thank Drs. Ximena Bernal, R. A. Peters, and C. Soulsbury on constructive feedback that helped significantly improve this manuscript.
Conflict of interest
The authors declare that the research was conducted in the absence of any commercial or financial relationships that could be construed as a potential conflict of interest.
References
1
AdamoS. A.RobertD.HoyR. R. (1995). Effects of a tachinid parasitoid, Ormia ochracea, on the behavior and reproduction of its male and female field cricket hosts (Gryllus spp.). J. Insect Physiol.41, 269–277. 10.1016/0022-1910(94)00095-X
2
AiharaI.De SilvaP.BernalX. E. (2016). Acoustic preference of frog-biting midges (Corethrella spp.) attacking túngara frogs in their natural habitat. Ethology122, 105–113. 10.1111/eth.12452
3
AllenG. R. (1995). The biology of the phonotactic parasitoid, Homotrixa sp. (Diptera, Tachinidae), and its impact on the survival of male Sciarasaga quadrata (Orthoptera, Tettigoniidae) in the field. Ecol. Entomol.20, 103–110. 10.1111/j.1365-2311.1995.tb00435.x
4
AnderssonM. (1994). Sexual Selection. Princeton, NJ: Princeton University Press.
5
BaileyN. W.ZukM. (2008). Acoustic experience shapes female mate choice in field crickets. Proc. R. Soc. B.275, 2645–2650. 10.1098/rspb.2008.0859
6
BeeM. A. (2007). Sound source segregation in grey treefrogs: spatial release from masking by the sound of a chorus. Anim. Behav.74, 549–558. 10.1016/j.anbehav.2006.12.012
7
BelwoodJ. J.MorrisG. K. (1987). Bat predation and its influence on calling behavior in neotropical katydids. Science238, 64–67. 10.1126/science.238.4823.64
8
BernalX. E. (2006). Acoustic preferences and localization performance of blood-sucking flies (Corethrella Coquillett) to tungara frog calls. Behav. Ecol.17, 709–715. 10.1093/beheco/arl003
9
BurkT. (1982). Evolutionary significance of predation on sexually signalling males. Fla. Entomol.65, 90–104. 10.2307/3494148
10
BushS. L.GerhardtH. C.SchulJ. (2002). Pattern ecognition and call preferences in treefrogs (Anura: Hylidae): a quantitative analysis using a no-choice paradigm. Anim. Behav.63, 7–14. 10.1006/anbe.2001.1880
11
CadeW. (1975). Acoustically orienting parasitoids - fly phonotaxis to cricket song. Science190, 1312–1313. 10.1126/science.190.4221.1312
12
CadeW. H.CiceranM.MurrayA. M. (1996). Temporal patterns of parasitoid fly (Ormia ochracea) attraction to field cricket song (Gryllus integer). Can. J. Zool.74, 393–395. 10.1139/z96-046
13
DohertyJ. A. (1985). Phonotaxis in the cricket, Gryllus bimaculatus DeGeer: comparisons of choice and no-choice paradigms. J. Comp. Physiol. A Neuroethol. Sens. Neural. Behav. Physiol.157, 279–289. 10.1007/BF00618118
14
FowlerH. G. (1987). Field behavior of Euphasiopteryx depleta (Diptera: Tachinidae): phonotactically orienting parasitoids of mole crickets (Orthoptera: Gryllotalpidae: Scapteriscus). J. N. Y. Entomol. Soc. 95, 474–480.
15
GerhardtH. C. (1982). Sound pattern recognition in some north american treefrogs (Anura, Hylidae): implications for mate choice. Amer. Zool.22, 581–595. 10.1093/icb/22.3.581
16
GerhardtH. C.DohertyJ. A. (1988). Acoustic communication in the gray treefrog, Hyla versicolor: evolutionary and neurobiological implication. J. Comp. Physiol. A Neuroethol. Sens. Neural Behav. Physiol.162, 261–278. 10.1007/BF00606090
17
GerhardtH. C.HuberF. (2002). Acoustic Communication in Insects and Anurans: Common Problems and Diverse Solutions.Chicago: The University of Chicago Press.
18
GerhardtH. C.RheinlaenderJ. (1980). Accuracy of sound localization in a miniature dendrobatid Frog. Naturwissenschaften67, 362–363. 10.1007/BF01106598
19
GoodaleE.RuxtonG. D.BeauchampG. (2019). Predator eavesdropping in a mixed-species environment: how prey species may use grouping, confusion, and the cocktail party effect to reduce predator detection. Front. Ecol. Evol.7:141. 10.3389/fevo.2019.00141
20
GrayD. A.BanuelosC.WalkerS. E.CadeW. H.ZukM. (2007). Behavioural specialization among populations of the acoustically orienting parasitoid fly Ormia ochracea utilizing different cricket species as hosts. Anim. Behav.73, 99–104. 10.1016/j.anbehav.2006.07.005
21
GrayD. A.CadeW. H. (1999). Sex, death and genetic variation: natural and sexual selection on cricket song. Proc. R. Soc. B.266, 707–709. 10.1098/rspb.1999.0693
22
GuilfordT.DawkinsM. S. (1991). Receiver psychology and the evolution of animal signals. Anim. Behav.42, 1–14. 10.1016/S0003-3472(05)80600-1
23
HedwigB. (2014). Towards an understanding of the neural basis of acoustic communication in crickets, in Insect Hearing and Acoustic Communication, ed HedwigB.. (Berlin: Springer), 123–142. 10.1007/978-3-642-40462-7_8
24
KolluruG. R.ZukM.ChappellM. A. (2002). Reduced reproductive effort in male field crickets infested with parasitoid fly larvae. Behav. Ecol.13, 607–614. 10.1093/beheco/13.5.607
25
Lakes-HarlanR.LehmannG. C. (2015). Parasitoid flies exploiting acoustic communication of insects — comparative aspects of independent functional adaptations. J. Comp. Physiol. A Neuroethol. Sens. Neural Behav. Physiol.201, 123–132. 10.1007/s00359-014-0958-3
26
LeeN.EliasD. O.MasonA. C. (2009). A precedence effect resolves phantom sound source illusions in the parasitoid fly Ormia ochracea. PNAS106, 6357–6362. 10.1073/pnas.0809886106
27
LeeN.MasonA. C. (2017). How spatial release from masking may fail to function in a highly directional auditory System. eLife6:e20731. 10.7554/eLife.20731
28
LehmannG. U. C. (2003). Review of biogeography, host range and evolution of acoustic hunting in Ormiini (Insecta, Diptera, Tachinidae), parasitoids of night-calling bushcrickets and crickets (Insecta, Orthoptera, Ensifera). Zool. Anz.242, 107–120. 10.1078/0044-5231-00091
29
LehmannG. U. C.HellerK. G. (1998). Bushcricket song structure and predation by the acoustically orienting parasitoid fly Therobia leonidei (Diptera : Tachinidae : Ormiini). Behav. Ecol. Sociobiol.43, 239–245. 10.1007/s002650050488
30
LibermanA. M.HarrisK. S.HoffmanH. S.GriffithB. C. (1957). The discrimination of speech sounds within and across phoneme boundaries. J. Exp. Psychol.54, 358–368. 10.1037/h0044417
31
LloydJ. E.WingS. R. (1983). Nocturnal aerial predation of fireflies by light-seeking fireflies. Science222, 634–635. 10.1126/science.222.4624.634
32
LottG. K.RosenM. J.HoyR. R. (2007). An inexpensive sub-millisecond system for walking measurements of small animals based on optical computer mouse technology. J. Neurosci. Methods161, 55–61. 10.1016/j.jneumeth.2006.10.007
33
MasonA. C.LeeN.OshinskyM. L. (2005). The start of phonotactic walking in the fly Ormia ochracea: a kinematic study. J. Exp. Biol.208, 4699–4708. 10.1242/jeb.01926
34
MasonA. C.OshinskyM. L.HoyR. R. (2001). Hyperacute directional nearing in a microscale auditory system. Nature410, 686–690. 10.1038/35070564
35
MechsnerF.StennekenP.ColeJ.AscherslebenG.PrinzW. (2007). Bimanual circling in deafferented patients: evidence for a role of visual forward models. J. Neuropsychol.1, 259–282. 10.1348/174866407X230688
36
MillerC. T.BeeM. A. (2012). Receiver psychology turns 20: is it time for a broader approach?Anim. Behav.83, 331–343. 10.1016/j.anbehav.2011.11.025
37
MorrisG. K. (1980). Calling display and mating behaviour of Copiphora rhinoceros Pictet (Orthoptera: Tettigoniidae). Anim. Behav.28, 42–51. 10.1016/S0003-3472(80)80006-6
38
MorrisG. K.MasonA. C.WallP.BelwoodJ. J. (1994). High ultrasonic and tremulation signals in neotropical katydids (Orthoptera: Tettigoniidae). J. Zool.233, 129–163. 10.1111/j.1469-7998.1994.tb05266.x
39
MüllerP.RobertD. (2001). A shot in the dark: the silent quest of a free-flying phonotactic fly. J. Exp. Biol.204, 1039–1052. Available online at: https://jeb.biologists.org/content/204/6/1039
40
MüllerP.RobertD. (2002). Death comes suddenly to the unprepared: singing crickets, call fragmentation, and parasitoid flies. Behav. Ecol.13, 598–606. 10.1093/beheco/13.5.598
41
MurpheyR. K. (1972). Orientation to calling song by female crickets, Scapsipedus marginatus (Gryllidae). J. Exp. Biol.56, 335–352.
42
NakanoR.SkalsN.TakanashiT.SurlykkeA.KoikeT.YoshidaK.et al. (2008). Moths produce extremely quiet ultrasonic courtship songs by rubbing specialized scales. PNAS105, 11812–11817. 10.1073/pnas.0804056105
43
ParkmanJ. P.FrankJ. H.WalkerT. J.SchusterD. J. (1996). Classical biological control of Scapteriscus spp. (Orthoptera: Gryllotalpidae) in Florida. Environ. Entomol.25, 1415–1420. 10.1093/ee/25.6.1415
44
PascoalS.CezardT.Eik-NesA.GharbiK.MajewskaJ.PayneE.et al. (2014). Rapid convergent evolution in wild crickets. Curr. Biol.24, 1369–1374. 10.1016/j.cub.2014.04.053
45
PaurJ.GrayD. A. (2011a). Individual consistency, learning, and memory in a parasitoid fly, Ormia ochracea. Anim. Behav.82, 825–830. 10.1016/j.anbehav.2011.07.017
46
PaurJ.GrayD. A. (2011b). Seasonal dynamics and overwintering strategy of the tachinid fly (Diptera: Tachinidae), Ormia ochracea (Bigot) in southern California. Terr. Arthropod Rev.4, 145–156. 10.1163/187498311X565615
47
PengH. C.LongF. H.DingC. (2005). Feature selection based on mutual information: criteria of max-dependency, max-relevance, and min-redundancy. IEEE Trans. Pattern Anal. Mach. Intell.27, 1226–1238. 10.1109/TPAMI.2005.159
48
PopovA. V.ShuvalovV. F. (1977). Phonotactic behavior of crickets. J. Comp. Physiol.119, 111–126. 10.1007/BF00655876
49
RheinlaenderJ.BlatgenG. (1982). The precision of auditory lateralization in the cricket, Gryllus bimaculatus. Physiol. Entomol.7, 209–218. 10.1111/j.1365-3032.1982.tb00291.x
50
RheinlaenderJ.GerhardtH. C.YagerD. D.CapranicaR. R. (1979). Accuracy of phonotaxis by the green treefrog (Hyla cinerea). J. Comp. Physiol.133, 247–255. 10.1007/BF00661127
51
RosenM. J.LevinE. C.HoyR. R. (2009). The cost of assuming the life history of a host: acoustic startle in the parasitoid fly Ormia ochracea. J. Exp. Biol.212, 4056–4064. 10.1242/jeb.033183
52
RotenberryJ. T.ZukM.SimmonsL. W.HayesC. (1996). Phonotactic parasitoids and cricket song structure: an evaluation of alternative hypotheses. Evol. Ecol.10, 233–243. 10.1007/BF01237681
53
RyanM. J. (1980). Female mate choice in a neotropical frog. Science209, 523–525. 10.1126/science.209.4455.523
54
ScheuberH.JacotA.BrinkhofM. W. G. (2004). Female preference for multiple condition–dependent components of a sexually selected signal. Proc. R. Soc. B.271, 2453–2457. 10.1098/rspb.2004.2907
55
Schneider WillT.RutzC.HedwigB.Bailey NathanW. (2018). Vestigial singing behaviour persists after the evolutionary loss of song in crickets. Biol. Lett.14:20170654. 10.1098/rsbl.2017.0654
56
SchniederkotterK.Lakes-HarlanR. (2004). Infection behavior of a parasitoid fly, Emblemasoma auditrix, and its host cicada Okanagana rimosa. J. Insect Sci.4, 1–7. 10.1673/031.004.3601
57
SchulJ. (1998). Song recognition by temporal cues in a group of closely related bushcricket species (genus Tettigonia). J. Comp. Physiol. A Neuroethol. Sens. Neural Behav. Physiol.183, 401–410. 10.1007/s003590050266
58
SchulJ.BushS. L. (2002). Non-parallel coevolution of sender and receiver in the acoustic communication system of treefrogs. Proc. R. Soc. B.269, 1847–1852. 10.1098/rspb.2002.2092
59
SchulJ.Von HelversenD.WeberT. (1998). Selective phonotaxis in Tettigonia cantans and T. viridissima in song recognition and discrimination. J. Comp. Physiol. A Neuroethol. Sens. Neural Behav. Physiol.182, 687–694. 10.1007/s003590050213
60
ShapiroL. (1995). Parasitism of Orchelimum katydids (Orthoptera: Tettigoniidae) by Ormia lineifrons (Diptera: Tachinidae). Fla. Entomol.78, 615–616. 10.2307/3496049
61
TannerJ. C.SwangerE.ZukM. (2019). Sexual signal loss in field crickets maintained despite strong sexual selection favoring singing males. Evolution73, 1482–1489. 10.1111/evo.13761
62
ThorsonJ.WeberT.HuberF. (1982). Auditory behaviour of the cricket. II. Simplicity of calling-song recognition in Gryllus, and anomalous phonotaxis at abnormal carrier frequencies. J. Comp. Physiol.146, 361–378. 10.1007/BF00612706
63
TinghitellaR. M. (2007). Rapid evolutionary change in a sexual signal: genetic control of the mutation flatwing that renders male field crickets (Teleogryllus oceanicus) mute. Heredity100, 261–267. 10.1038/sj.hdy.6801069
64
TinghitellaR. M.ZukM. (2009). Asymmetric mating preferences accomodated the rapid evolutionary loss of a sexual signal. Evolution63, 2087–2098. 10.1111/j.1558-5646.2009.00698.x
65
TuttleM. D.RyanM. J. (1981). Bat predation and the evolution of frog vocalizations in the neotropics. Science214, 677–678. 10.1126/science.214.4521.677
66
TuttleM. D.RyanM. J. (1982). The role of synchronized calling, ambient light, and ambient noise, in anti-bat-predator behavior of a treefrog. Behav. Ecol. Sociobiol.11, 125–131. 10.1007/BF00300101
67
TuttleM. D.TaftL. K.RyanM. J. (1982). Evasive behaviour of a frog in response to bat predation. Anim. Behav.30, 393–397. 10.1016/S0003-3472(82)80050-X
68
VélezM. J.BrockmannH. J. (2006). Seasonal variation in selection on male calling song in the field cricket, Gryllus rubens. Anim. Behav.72, 439–448. 10.1016/j.anbehav.2006.02.002
69
Von HelversenD. (1984). Parallel processing in auditory pattern recognition and directional analysis by the grasshopper Chorthippus Biguttulus L (Acrididae). J. Comp. Physiol.154, 837–846. 10.1007/BF00610684
70
WagnerW. E. (1996). Convergent song preferences between female field crickets and acoustically orienting parasitoid flies. Behav. Ecol.7, 279–285. 10.1093/beheco/7.3.279
71
WagnerW. E. (1998). Measuring female mating preferences. Anim. Behav.55, 1029–1042. 10.1006/anbe.1997.0635
72
WagnerW. E.BasoloA. L. (2007). Host preferences in a phonotactic parasitoid of field crickets: the relative importance of host song characters. Ecol. Entomol.32, 478–484. 10.1111/j.1365-2311.2007.00898.x
73
WagnerW. E.ReiserM. G. (2000). The importance of calling song and courtship song in female mate choice. Anim. Behav.59, 1219–1226. 10.1006/anbe.1999.1428
74
WalkerT. J. (1969). Acoustic synchrony: two mechanisms in the snowy tree cricket. Science166, 891–894. 10.1126/science.166.3907.891
75
WalkerT. J. (1986). Monitoring the flights of field crickets (Gryllus spp.) and a tachinid fly (Euphasiopteryx ochracea) in north Florida. Fla. Entomol.69, 678–685. 10.2307/3495213
76
WalkerT. J. (1993). Phonotaxis in Female Ormia ochracea (Diptera, Tachinidae), a parasitoid of field crickets. J. Insect Behav.6, 389–410. 10.1007/BF01048119
77
WalkerT. J. (1998). Trilling field crickets in a zone of overlap (Orthopter: Gryllidae: Gryllus). Ann. Entomol. Soc. Am.91, 175–184. 10.1093/aesa/91.2.175
78
WalkerT. J.WineriterS. A. (1991). Hosts of a phonotactic parasitoid and levels of parasitism (Diptera: Tachinidae: Ormia ochracea). Fla. Entomol.74, 554–559. 10.2307/3495408
79
WeberT.ThorsonJ.HuberF. (1981). Auditory behaviour of the cricket: 1. Dynamics of compensated walking and discrimination paradigm on the Kramer treadmill. J. Comp. Physiol.141, 215–232. 10.1007/BF01342668
80
WeissmanD. B.WalkerT. J.GrayD. A. (2009). The field cricket Gryllus assimilis and two new sister species (Orthoptera: Gryllidae). Ann. Entomol. Soc. Am.102, 367–380. 10.1603/008.102.0304
81
WineriterS. A.WalkerT. J. (1990). Rearing phonotactic parasitoid flies (Diptera, Tachinidae, Orminii, Ormia spp.). Entomophaga35, 621–632. 10.1007/BF02375096
82
WyttenbachR. A.MayM. L.HoyR. R. (1996). Categorical perception of sound frequency by crickets. Science273, 1542–1544. 10.1126/science.273.5281.1542
83
ZukM.KolluruG. R. (1998). Exploitation of sexual signals by predators and parasitoids. Q. Rev. Biol.73, 415–438. 10.1086/420412
84
ZukM.RotenberryJ. T.SimmonsL. W. (1998). Calling songs of field crickets (Teleogryllus oceanicus) with and without phonotactic parasitoid infection. Evolution52, 166–171. 10.1111/j.1558-5646.1998.tb05149.x
85
ZukM.RotenberryJ. T.TinghitellaR. M. (2006). Silent night: adaptive disappearance of a sexual signal in a parasitized population of field crickets. Biol. Lett.2, 521–524. 10.1098/rsbl.2006.0539
86
ZukM.SimmonsL. W.CuppL. (1993). Calling characteristics of parasitized and unparasitized populations of the field cricket Teleogryllus oceanicus. Behav. Ecol. Sociobiol.33, 339–343. 10.1007/BF00172933
Summary
Keywords
sound localization, song recognition, no-choice paradigm, phonotaxis index, signal preference, tethered walking phonotaxis
Citation
Lee N, Kirtley AT, Pressman IS, Jirik KJ, Koucoulas D and Mason AC (2019) Developing a Phonotaxis Performance Index to Uncover Signal Selectivity in Walking Phonotaxis. Front. Ecol. Evol. 7:334. doi: 10.3389/fevo.2019.00334
Received
17 December 2018
Accepted
23 August 2019
Published
18 September 2019
Volume
7 - 2019
Edited by
Ximena E. Bernal, Purdue University, United States
Reviewed by
Richard Anthony Peters, La Trobe University, Australia; Carl Soulsbury, University of Lincoln, United Kingdom
Updates
Copyright
© 2019 Lee, Kirtley, Pressman, Jirik, Koucoulas and Mason.
This is an open-access article distributed under the terms of the Creative Commons Attribution License (CC BY). The use, distribution or reproduction in other forums is permitted, provided the original author(s) and the copyright owner(s) are credited and that the original publication in this journal is cited, in accordance with accepted academic practice. No use, distribution or reproduction is permitted which does not comply with these terms.
*Correspondence: Norman Lee lee33@stolaf.edu
This article was submitted to Behavioral and Evolutionary Ecology, a section of the journal Frontiers in Ecology and Evolution
Disclaimer
All claims expressed in this article are solely those of the authors and do not necessarily represent those of their affiliated organizations, or those of the publisher, the editors and the reviewers. Any product that may be evaluated in this article or claim that may be made by its manufacturer is not guaranteed or endorsed by the publisher.