 Joanna C. Carey1,2*†
 KathiJo Jankowski3†
 Paul Julian II4†
 Lienne R. Sethna5†
 Patrick K. Thomas6†
 Jason Rohweder3
- 1Division of Math and Science, Babson College, Wellesley, MA, United States
- 2Department of Earth and Environment, Boston University, Boston, MA, United States
- 3U.S. Geological Survey Upper Midwest Environmental Sciences Center, La Crosse, WI, United States
- 4Whitney Marine Laboratory for Marine Bioscience, University of Florida, St. Augustine, FL, United States
- 5O'Neill School of Public and Environmental Affairs, Indiana University, Bloomington, IN, United States
- 6Plankton Ecology Lab, Institute for Chemistry and Biology of the Marine Environment, University of Oldenburg, Wilhelmshaven, Germany
Freshwater ecosystems are critical zones of nutrient and carbon (C) processing along the land-sea continuum. Relative to our understanding of C, nitrogen (N), and phosphorus (P) cycling within the freshwater systems, the controls on silicon (Si) cycling and export are less understood. Understanding Si biogeochemistry and its coupled biogeochemical processing with N and P has direct implications for both freshwater and coastal ecosystems, as the amount of Si in relation to N and P exported by rivers to coastal receiving waters can determine phytoplankton species assemblages, which in turn affects C cycling and food web structure. Here we examine the relationships between dissolved Si (DSi), total nitrogen (TN), and total phosphorus (TP) concentrations, and how these relationships relate to basin land cover, lithology, and river hydrogeomorphology (i.e., aquatic areas) in the Upper Mississippi River System (UMRS) using two datasets (one from the tributaries and one from the mainstem) that span a nine-year period (2010–2018) representing >10,000 unique samples. We found significant declines in DSi concentrations, as well as Si:TP and Si:TN ratios along the north-south gradient of the mainstem UMRS across the six aquatic area types we study here. This signal was driven partially by a corresponding decline in tributary DSi inputs along this latitudinal gradient. Contrary to findings from other regions of North America, basin land cover was not an important predictor of tributary DSi concentrations, especially compared to lithology. However, Si:TN and Si:TP ratios appear to be strongly controlled by basin land cover, likely due to excess N and P loading from row-crop agriculture. DSi, and its ratio with TN and TP (i.e., Si stoichiometry), was similar across most aquatic area types, including run-of-river impoundments and the main channel, suggesting similar processes affecting DSi, TN, and TP concentrations in these reaches. However, backwater lakes had lower DSi and TN concentrations compared to the other aquatic area types, highlighting the importance of water residence time and nutrient uptake in controlling Si stoichiometry in inland waters. Together, our results show that rivers are not simple pipes for Si, but rather the complexity in watershed characteristics, hydrology, and biological uptake results in dynamic Si stoichiometry along the river continuum.
“Letting the days go by, let the water hold me…
Letting the days go by, water flowing…
Water dissolving and water removing
Into the blue again into silent water
Once in a lifetime…”
–The Talking Heads
Introduction
The concentrations, ratios, and fluxes of nutrients in freshwater systems fundamentally connect terrestrial and marine systems and are tightly linked with biodiversity and ecosystem functioning (Smith et al., 1999; Rabalais et al., 2002; Elser et al., 2007; Maranger et al., 2018). Increasing silicon (Si) supply from continental mineral weathering gave rise to the diatoms in the Cenozoic era (Cermeño et al., 2015), which now produce nearly half the oxygen we inhale, substantially altering the global carbon (C) cycle (Berner et al., 1983; Brady and Carroll, 1994). Diatoms are highly productive autotrophs in the oceans, accounting for ~50% of oceanic net primary productivity (Rousseaux and Gregg, 2014). Unlike other phytoplankton, marine diatoms generally require as much Si as nitrogen (N) on a molar basis, meaning the ratio of Si:N in receiving waters has direct implications for phytoplankton species assemblages and C sequestration rates (Officer and Ryther, 1980; Beusen et al., 2009; Frings et al., 2016). Compared to marine species, freshwater diatoms have more variable stoichiometric nutrient demands, often requiring greater Si relative to N and P (Conley et al., 1988). Thus, the functioning of aquatic ecosystems and the stability of our climate are linked to the processing and export of Si, and its ratio with critical nutrients.
A central tenet of stoichiometric theory (Redfield, 1934, 1958) is based on the consistency of organismal elemental composition, which led to the understanding of the conditions limiting phytoplankton growth relative to C, N, and phosphorus (P). While Redfield initially focused on C:N:P, a “Redfield-like” ratio was developed to include Si in order to better understand the conditions limiting diatom growth (Brzezinski, 1985). Despite the importance of Si and its ratio with other nutrients (i.e., Si stoichiometry) in controlling aquatic productivity, we know less about the complex processes controlling Si exports along the land-sea continuum relative to C, N, and P. For example, Maranger et al. (2018) recently examined the global controls on riverine C:N:P processes along the river continuum, expanding upon our appreciation for rivers as “processors” rather than “pipes” (Cole et al., 2007), as C is processed during its transit to the oceans (Tranvik et al., 2009; Hotchkiss et al., 2015). However, we still lack a holistic understanding regarding the physical and biological factors that shape Si:N:P stoichiometry along the river continuum.
Chemical weathering is the primary source of Si to the biosphere, as Si is the second most abundant element in the lithosphere (Exley, 1998). In turn, variation in geochemical factors, such as lithology and climate, largely control baseline availability of Si in a given system (Bluth and Kump, 1994). Rivers transport DSi, the bioavailable form of Si, from terrestrial to aquatic systems in large quantities, exporting >80% of annual DSi inputs to the global oceans (Tréguer and De La Rocha, 2013). Relative to Si, human activities (e.g., fertilizer runoff, urban wastewater treatment, fossil fuel combustion) have increased the export of N and P to downstream receiving waters. In the presence of excess N and P, diatoms can bloom until available Si is depleted. Such Si-limited waters can then favor the growth of non-siliceous, potentially toxic algae (Officer and Ryther, 1980; Smayda, 1990; Conley et al., 1993; Justić et al., 1995; Anderson et al., 2002; Parsons and Dortch, 2002; Garnier et al., 2010) and can also affect the toxicity of diatom communities (Pan et al., 1996; Bargu et al., 2016). In turn, altered ratios of nutrients (N, P, Si) relative to the Redfield ratio (16N:1P:16Si) have raised serious concerns about anthropogenic effects on diatom-based food chains in freshwater and marine ecosystems (Officer and Ryther, 1980; Conley et al., 1993; Turner et al., 1998; Anderson et al., 2002). Globally, this type of stoichiometric imbalance in N, P, and Si has been implicated in influencing toxic and harmful algal blooms in both fresh and marine systems, including the Baltic Sea, North Sea, Great Lakes, and the California Current Ecosystem (Schelske and Stoermer, 1971; Anderson et al., 2009; Garnier et al., 2010; Davidson et al., 2012; Bargu et al., 2016). For example, agricultural activities in the Mississippi River basin, which accounts for ~40% of the land area in the continental United States, have altered nutrient ratios of the Mississippi River and its exports to the Gulf of Mexico over the last several decades (Turner et al., 1998; Rabalais et al., 2002; Royer, 2019). These changes in stoichiometry are likely to compound already severe environmental stressors, such as massive hypoxic dead zones in the Gulf of Mexico (NOAA; Rabalais et al., 2002) caused by increases in N and P loads.
In addition to the impact of excess N and P on the relative availability of Si in aquatic systems, human activities can directly alter global Si cycling through several means. First, land use change can directly alter DSi export rates from terrestrial to aquatic systems (Conley et al., 2008; Struyf and Conley, 2012; Carey and Fulweiler, 2013). Terrestrial plants have the capacity to release and retain Si on terrestrial landscapes. Plant growth can stimulate Si mineral dissolution, releasing DSi into soil solution (Drever, 1994). Terrestrial plants also sequester large quantities of Si within their tissue (Conley, 2002; Hodson et al., 2005) (84 ± 29 Tmol yr−1; Carey and Fulweiler, 2012a). Therefore, shifts in watershed land use can alter Si retention and export from terrestrial landscapes (Cooke and Leishman, 2011; Cornelis et al., 2011; Carey and Fulweiler, 2016). In temperate and tropical landscapes, urbanization, deforestation, and agricultural land uses have been shown to alter fluvial Si exports (Conley et al., 2008; Struyf et al., 2010; Carey and Fulweiler, 2012b, 2013; Vandevenne et al., 2012; Chen et al., 2014), groundwater DSi concentrations (Maguire and Fulweiler, 2016, 2019) and soil Si cycling (Clymans et al., 2011; Vander Linden and Delvaux, 2019). In addition, river damming alters Si cycling in aquatic systems by increasing water residence time and stimulating diatom blooms and Si burial behind impoundments (Humborg et al., 1997, 2000, 2006). Because Si is recycled slower than N and P, waters directly downstream of dams are often Si depleted (van Bennekom and Salomons, 1980). More subtle hydrogeomorphic variation in dynamic river-floodplain systems also has the capacity to alter Si processing by creating heterogeneous patterns in sedimentation and uptake (Junk et al., 1989; Houser and Richardson, 2010).
The Upper Mississippi River System (UMRS) provides a useful template to evaluate the effects of land use and river landscape complexity on large river Si processing and stoichiometry. The northern reaches of the UMRS contain a diversity of side channels and backwater lakes that vary in their degree of connectivity to main channel flow, whereas the river becomes increasingly disconnected from its floodplain and faster-flowing in its lower reaches (Wilcox, 1993; De Jager et al., 2018). These shifts along the longitudinal continuum result in shifts in processing rates (Richardson et al., 2004) and phytoplankton communities (Manier, 2014) that likely shape the way Si moves through the system.
Here, we evaluated the extent and the origins of variation and coupling in large river DSi, total N (TN) and total P (TP) stoichiometry using nearly a decade (2010–2018) of empirical data from a spatially extensive dataset that spans six reaches of the mainstem UMRS and the mouths of 23 tributaries. We investigated the role of land use, lithology, and in-situ ecological controls in altering external inputs of Si:TN:TP from the 23 tributaries. We then examined how mainstem river hydrogeomorphology altered internal patterns and coupling of Si:TN:TP along the ~1,900 km of the mainstem UMRS. We hypothesized that:
H1: Basin land use and lithology are important controls on stoichiometric inputs of Si:TN:TP from the tributaries to the mainstem;
H2: Si:TN:TP varies longitudinally along the mainstem UMRS due to variable nutrient inputs and internal processing, and;
H3: Si:TN:TP varies across aquatic area types due to differences in water residence time and other physical characteristics.
Materials and Methods
Study System
The UMRS is defined as the commercially navigable reaches of the Upper Mississippi and Illinois Rivers (Figure 1). Flowing ~1,900 km, the river and its tributaries encompass a substantial gradient in land use, from forested headwaters in the north to increasingly intensive agriculture as the river winds its way south. We used limnology data collected by personnel of the Long-term Resource Monitoring element (LTRM) of the US Army Corps of Engineers' Upper Mississippi River Restoration Program (UMRR). These data were collected from 2010 to 2018 in six reaches of the Upper Mississippi River System (UMRS), representing 490,000 km2 (Table 1 and Figure 1). Five of the six reaches are “navigation pools,” defined as the reach of river between two consecutive locks and dams (Supplemental Information).
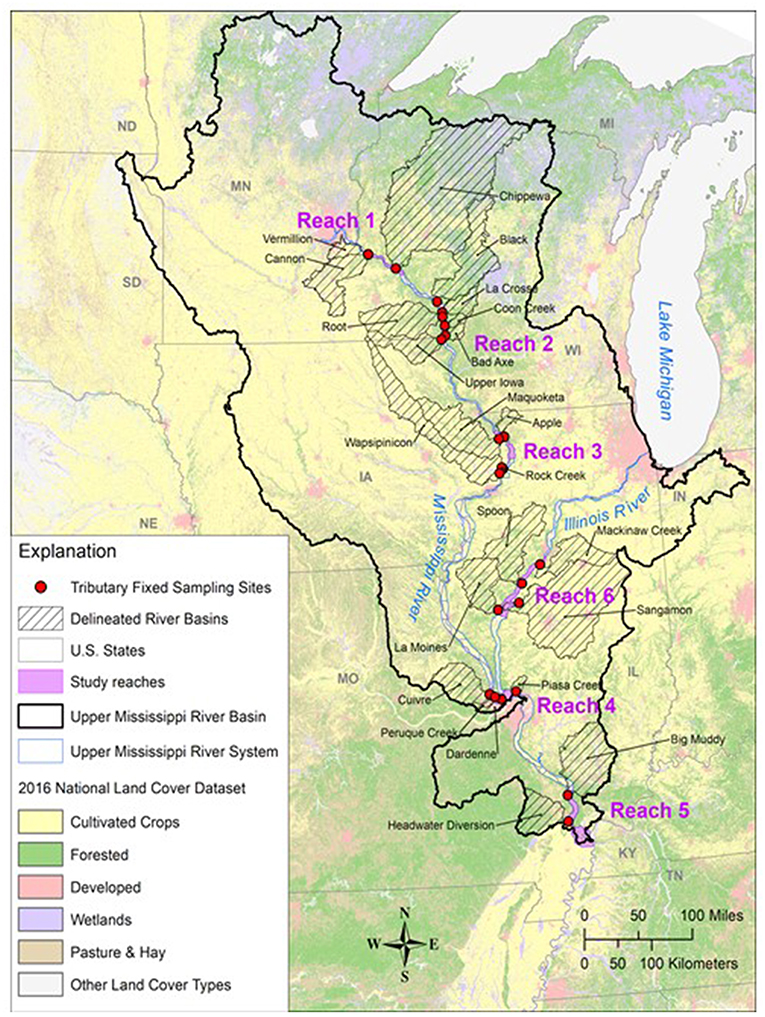
Figure 1. Map of the Upper Mississippi River System study region with major tributary basins and land cover identified.
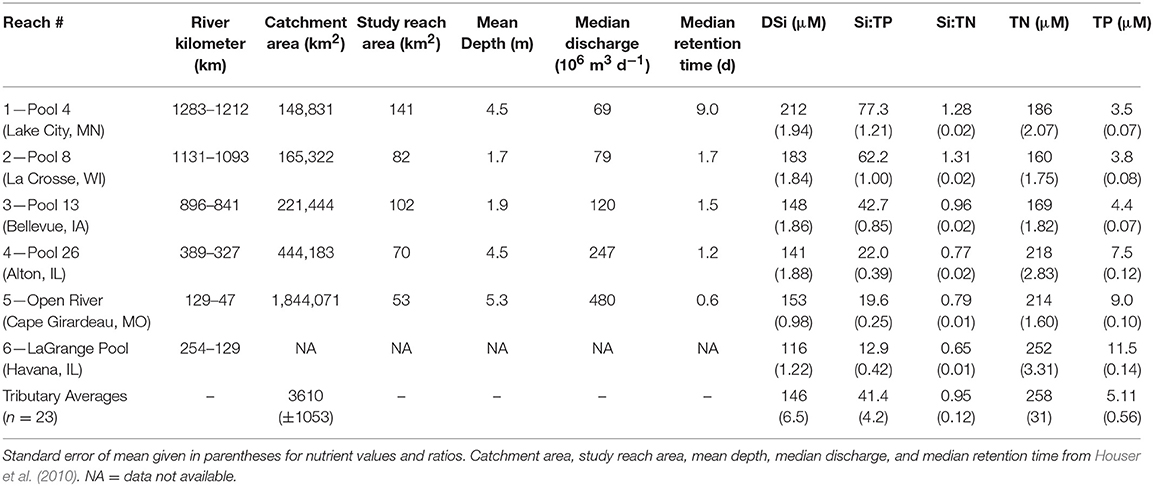
Table 1. Characteristics of Upper Mississippi River System study reaches (and associated navigation pools) and tributary sites.
The UMRS and its floodplain contain a diversity of aquatic areas that vary in depth, aquatic vegetation, water residence time, and hydraulic connectivity to the main river flow (De Jager et al., 2018). We examine six aquatic areas types within the mainstem of the UMRS, including the main channel, side channels, impounded areas, contiguous backwater lakes, riverine lakes (e.g., Lake Pepin), and isolated backwater lakes. Isolated backwater lakes are connected to the main channel only at extremely high flows. These aquatic areas are primarily differentiated based on their depth and velocity characteristics (Table 2), which we used as an indicator of relative water residence time. The navigation impoundments in the system are created by low-head, run-of river dams built to maintain sufficient depth in the river for navigation during low flow and were designed to have little impact on discharge or water level during high flow conditions (Sparks et al., 1998). Despite the large-scale shifts in land use and hydrologic character of the system, parts of the UMRS remain a complex floodplain riverscape that contains a diversity of aquatic areas that vary widely in water residence time, biogeochemical processing rates, and freshwater communities (Wilcox, 1993; Richardson et al., 2004; Manier, 2014; De Jager et al., 2018).
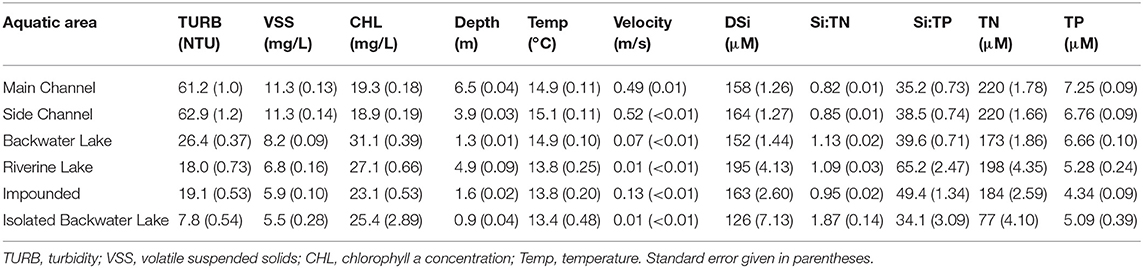
Table 2. Average characteristics of aquatic area types across all reaches.
Data Collection
We used two datasets to conduct our analysis (retrieved from https://umesc.usgs.gov/ltrm-home.html). The first dataset (hereafter referred to as “mainstem” data) consists of 216 unique sampling events representing >9,800 individual samples from seasonal stratified random sampling of six aquatic area types along the mainstem of the UMRS (Soballe and Fischer, 2004) (see Supplemental Information). The second dataset consists of >2,500 distinct sampling events collected ~monthly (14 times per year) from fixed sampling locations at the mouth of 23 tributaries, just upstream of their confluence with the mainstem UMRS.
All measurements and water samples were taken 0.2 m below the surface of the water, or 0.2 m below the submerged base of the ice when present (i.e., during winter sampling). Both water speed and direction were measured at the time of sampling using a Hach model FH950.0 Portable Velocity Meter (Hach, Inc. Loveland, CO) and a standard magnetic compass. At sites where flow velocity was below detection of the meter (<2 cm s−1), velocity was reported as half the detection limit of the instrument, or 1 cm s−1. Water samples were returned to the lab immediately after sampling for the determination of turbidity, total nutrients (e.g., TN, TP), dissolved silica (DSi), and chlorophyll a (CHL) concentrations. DSi samples were filtered in the field (0.45 μm membrane) and frozen until analysis. TN and TP were preserved in the field with concentrated H2SO4, transported on ice, and refrigerated until analysis. DSi, TN, and TP were determined colorimetrically following standard methods (American Public Health Association, 2005). CHL was determined fluorometrically (CHLF) for all sites, and spectrophotometrically (CHLS) for a randomly chosen subset of sites (random selection of 10% of the sites sampled) (see Supplemental Information). Water column CHL values represent the majority of algal biomass in the system; phytoplankton are abundant in many areas of the river due to the open nature of the channels that provide ample light availability in the upper water column (Gardner et al., 2019). Light typically does not reach the benthos due to high turbidity and depth, thereby limiting benthic production in channels. Thus, while we recognize benthic algal production could be important in off channel areas with higher water clarity (i.e., backwaters), this dataset did not include benthic algal biomass data. We used Streamstats (https://water.usgs.gov/osw/streamstats/ss_documentation.html) and Geographic Information Systems (GIS) to delineate watersheds and calculate basin characteristics for the tributaries, respectively.
Land use data for each tributary basin were generated from the 2011 National Land Cover Dataset (Homer et al., 2015). Primary bedrock lithology coverage data for each tributary basin were generated from the combined geologic map data for the conterminous US (Schweitzer, 2011).
Data Analysis
We used TN and TP as a proxy for all available N and P in the system. TN and TP include the dissolved inorganic portion and the organic portion of the elements. Because the organic portion of N and P can rapidly remineralize, the use of TN and TP captures the dynamic N and P pool available in the system (Downing, 1997; Guildford and Hecky, 2000; Wetzel, 2001; Dodds, 2003; Bergström, 2010). The stoichiometric ratios we present here reflect the particulate and dissolved fractions of N and P, but only the dissolved fraction of Si. Because we did not measure amorphous Si in our samples, our ratios are likely underestimates of Si availability relative to N and P in the UMRS, as amorphous Si, which represents 16% of total river non-mineral Si fluxes globally (Conley, 1997), is potentially a biologically important component of river Si availability (Cornelis et al., 2011).
We analyzed TP, TN, and DSi concentrations and molar ratios of Si:TP, Si:TN, and TN:TP for each site within tributaries and mainstem sites from 2010 to 2018. We used multiple linear regression to determine the role of land use and primary lithology in explaining DSi concentrations and stoichiometric ratios in tributaries entering the mainstem UMRS. To create appropriate regression models and meet the assumptions of normality, we first log transformed the response variable (DSi, Si:TN, Si:TP) and used stepwise variance inflation factors (VIFs) to remove co-varying predictors (e.g., to address correlations between land use and lithology). In stepwise VIF (“car” package; Fox et al., 2012), we set a threshold of VIF (in this case 10), and sequentially removed predictors with the highest VIFs over the threshold until all model predictors had VIFs below the threshold. Cultivated crops, wetlands, and dolostone had elevated VIFs (>10) and were removed as predictors from the regression. Upon removing co-varying predictors, we then used Stepwise Akaike Information Criteria (AIC; Burnham and Anderson, 2002) (“MASS” package; Ripley et al., 2013) to determine the most appropriate predictors for the regression models of stoichiometric ratios and nutrient concentrations. We developed these models for dependent variables of interest (i.e., TN, TP, DSi, Si:TN, Si:TP) with land use and lithology predictors together, and then again separately in order to determine the relative roles of both land use and lithology in explaining the nutrient stoichiometry in the tributaries. We also used Spearman's rank sum correlation between latitude and tributary basin characteristics (i.e., percent land cover or primary lithology) to determine if trends in basin coverage existed across the study area.
We evaluated differences in DSi concentrations, Si:TP and Si:TN across river reaches and among aquatic areas along the mainstem UMRS in three ways. First, to evaluate changes in stoichiometry along the north-south gradient of the river, we used a linear model that regressed average nutrient concentrations and ratios with river mile in both the mainstem and tributaries (tributary river mile is where the tributaries enter the mainstem). Second, we compared DSi and its ratio with TN and TP across reaches and aquatic areas using mixed effects models with effects of river reach, aquatic area, and their interaction to a model with only an intercept. These models included a random effect of year to account for potential year-specific variability. We compared these models using AICc and report marginal (R2m, fixed effects) and conditional (R2c, full model) R2 values for each model (Barton and Barton, 2013; Nakagawa and Schielzeth, 2013; Nakagawa et al., 2017; MuMIn package). Subsequent pairwise comparisons among aquatic areas and river reaches were done for the “best” model (i.e., lowest AICc) for each dependent variable (DSi, Si:TP, and Si:TN) using the “emmeans” package (Lenth, 2018). Third, we examined stoichiometric relationships by comparing DSi to TP (TP x Si) and DSi to TN (TN x Si) within each aquatic area by evaluating power law slopes and intercepts using standardized major axis (SMA) regression (“smart” package; Warton et al., 2006). Unlike standard regression techniques, SMA regression allows us to evaluate how DSi relates to TP or TN by assessing best fit line between two variables, rather than using one variable to predict another (Cleveland and Liptzin, 2007; Sterner et al., 2008; Julian et al., 2019). In the SMA framework, a slope different from the absolute value of one indicates the variables are independent and do not change proportionally with each other. If the slope is not statistically different from the absolute value of one, then the variables exhibit proportional changes and have more constrained stoichiometry between nutrients. In addition, the sign of the slope provides information on how nutrients change relative to each other; positive slopes (not significantly different from one) indicate close positive coupling and near constant ratios across samples, whereas negative slopes indicate negative coupling and highly variable ratios among samples as one nutrient increases and the other decreases. In addition to the slope test, we did pairwise comparisons of the slopes within aquatic areas of each reach (Warton and Weber, 2002; Warton et al., 2006). The coefficient of determination (SMA R2) from each model was also used to assess the degree to which the variables were coupled, where high R2 values indicate higher relative coupling.
We then evaluated how multiple limnological variables [i.e., depth, velocity, temperature, CHL, TN, TP, turbidity, and volatile suspended solids (VSS)] related to DSi concentrations, Si:TP, and Si:TN in two ways. First, we used a principal components analysis (PCA) to look at covariation of these drivers across reaches and aquatic areas using the “vegan” package (Oksanen et al., 2018). We used the mean decadal value for each reach-aquatic area combination (n = 23). We considered variables to be significant in the PCA if they had a correlation coefficient >0.7 with either axis. Second, in order to assess how much variation was explained by these variables in different aquatic area types, we used all data in a mixed model framework with turbidity, VSS, temperature and CHL as fixed effects and random effects of “year” and “reach” on the intercept to account for variation resulting from year-to-year changes or longitudinal differences among reaches not captured by the fixed effects. Sample size therefore varied by aquatic area type (Table S5). We did not include TN, TP in these analyses because of their inherent correlation with each ratio. Since we ran this analysis specifically by aquatic area, we did not include velocity or depth as predictors in the model. We used the lme4 package for the mixed model analysis (Bates et al., 2007). We report marginal and conditional R2 values for these models as above and compare models using AICc (Burnham and Anderson, 2002). All statistical operations were performed using base R unless otherwise noted (Ver 3.5.2, R Foundation for Statistical Computing, Vienna Austria) and the critical level of significance was set at α = 0.05.
Results
Spatial and Seasonal Variation in Si:TN:TP Stoichiometry
During the 2010–2018 period of record within the mainstem UMRS, DSi concentrations, Si:TN, and Si:TP ranged widely (Table 1). The percentage of dissolved inorganic nutrients varied between 32 and 77% of the N pool (dissolved inorganic N to TN), and 16–31% of the P pool (soluble Reactive P to TP) (Table S1). In general, we found that variation across space in Si:TN and Si:TP ratios was more closely linked to TN and TP concentrations than to variation in DSi concentrations (Figure 2). These patterns are likely due to differences in the magnitude of variation in each nutrient's concentration; we observed higher variation [as the coefficient of variation (CV)] across tributaries in TN (59.3) and TP (52.9) compared to DSi (20.5) (Table S2). Moreover, TN and TP were also more variable than DSi in the mainstem, but the CV for TN was dramatically lower in the mainstem (24.2) than the tributaries (59.3) (Table S2). Consequently, there was greater variation in the Si:TN ratio across tributaries (CV = 61.9) than across mainstem sites (CV = 32.7), highlighting the relatively high heterogeneity of the UMRS tributary riverscape compared to then main channel, which integrates these diverse sources.
Figure 2. Plots visualize relationships between ratios and their individual constituent nutrients across all tributary and mainstem sampling sites and show that ratios correspond more closely with variation in TN and TP than DSi; points represent average values from 2010 to 2018. (A) Total N vs. the Si:N ratio, (B) dissolved Si vs. the Si:N ratio, (C) total P vs. the Si:P ratio, and (D) dissolved Si vs. the Si:P ratio. These data suggest that variation in all individual constituents are important for creating variability in the respective ratios, though N and P are more tightly coupled to stoichiometry. Note the log-transformed axes.
We did not observe any trends over time in DSi, TN, TP concentrations or their ratios across our study period (2010–2018). However, we observed similar seasonal patterns in DSi and Si:TN between the mainstem and tributaries, with the highest concentrations and ratios in winter and late summer and declines in the spring and fall. Si:TP followed a distinct seasonal pattern from DSi and Si:TN; it was highest in the tributaries in the late fall through early winter and lowest in the spring and summer. Mainstem Si:TP ratios follow a similar pattern to the tributaries, with ratios also declining in the late fall (Figure S1). Across the 23 UMRS tributaries, basin land cover and lithology were highly variable (Table S3). Developed land cover ranged from 4.1 to 47.1%, forest cover ranged from 1.3 to 57.2%, wetlands ranged from 0.2 to 24.4, pasture/hay ranged from 2.9 to 27.8%, and cultivated cropland ranged from 10.4 to 81.6%. Open water accounted for <5% of basin coverage across all tributaries. Primary lithology showed even larger ranges, with basins having 0 to >75% coverage of each individual primary lithology (dolostone, limestone, shale, or sandstone), and other lithology (including schist, gneiss, granite, mafic, basalt, and clay) making up 0–47% of basins (Table S3).
H1: Land Use and Lithological Controls on Si Stoichiometry
The most appropriate regression models varied among various nutrients and ratios, and the role of land use and lithology differed in controlling tributary stoichiometry. Regression models that included both land use and lithology predictors together indicated tributary Si:TP ratios were explained by developed land cover and shale lithology (adj. R2 = 0.42, df = 20, p < 0.01) (Table 3). Tributary Si:TN ratios were better explained by basin characteristics, specifically forest, developed, shale, and sandstone coverage (df = 18, p < 0.01), which explained 74% of Si:TN observations (adj. R2 = 0.74). With regards to concentrations (rather than ratios), stepwise AIC identified only lithological, rather than land use, parameters as important model parameters for DSi concentrations (limestone and shale; df = 20, p < 0.05), whereas land use parameters were important predictors of TP and TN. Specifically, TP concentrations were best explained by developed, forest, and shale coverage (adj. R2 = 0.38, df = 19, p < 0.01), and TN concentrations were best explained by developed, forest, shale, and sandstone basin coverage (adj. R2 = 0.78, df = 17, p < 0.01).
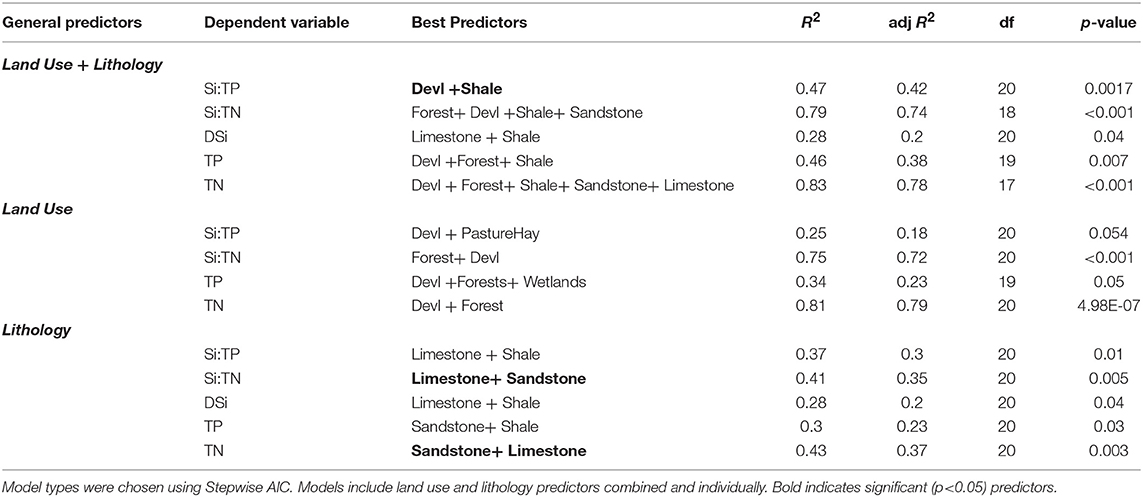
Table 3. Multiple linear regression model results describing ability of land use and lithology to describe DSi, TN, and TP concentrations, as well as Si:TN and Si:TP ratios.
In order to determine the relative roles of watershed land use vs. lithology on tributary Si:TN:TP stoichiometry, we also ran regression models with land use and lithology predictors separately. Together, we found Si:TP ratios were better explained by lithology alone than land cover (adj R2 = 0.18 vs. 0.30 for land use vs. lithology, respectively), whereas Si:TN ratios were better explained by land cover (adj R2 = 0.72 vs. 0.35 for land use vs. lithology, respectively). Regressions using both land use and lithology together indicate developed and shale coverage is important for both Si:TP and Si:TN, and forest and sandstone are additional predictors for Si:TN.
The four primary lithology cover classes represented in tributary basins were all significantly correlated with latitude. Limestone and shale follow a north-to-south gradient with an inverse correlation between percent cover and latitude (R2 = 0.19, p < 0.05, n = 23 for both lithology types). Dolostone and sandstone follow the north-to-south latitudinal gradient but are positively correlated with latitude [R2 = 0.17, p = 0.05 and R2 = 0.21 p < 0.05 (n = 23), respectively]. Land use was not significantly correlated with latitude along the UMRS.
We observed varying amounts of stoichiometric coupling within the tributaries (Figure 3). The majority (52%) of tributaries showed relatively uncoupled Si:TP ratios, with the slopes of TP x DSi concentrations significantly differing from one. DSi to TP relationships vary from weakly to strongly coupled with R2 values ranging from <0.001 to 0.82 (Table 4). Conversely to Si:TP, the majority of Si:TN ratios (61%) displayed coupled relationships, as indicated by slopes of TN vs. DSi not different than one. DSi to TN relationships vary from weakly to strongly coupled relationships with R2 values ranging from 0.008 to 0.528 (Table 4). In instances where slopes were significantly different from one, both TN and TP changed at faster rates relative to DSi.
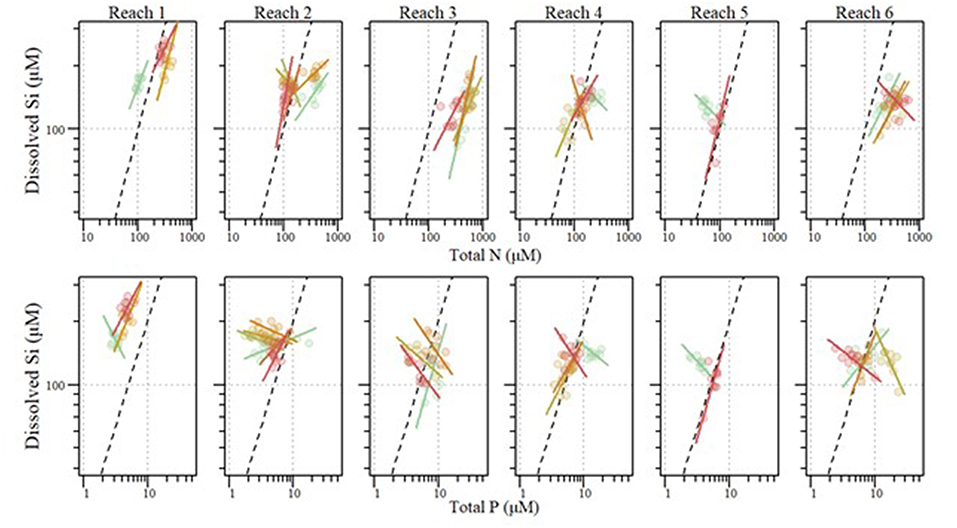
Figure 3. Stoichiometric relationships between annual mean dissolved silicon (DSi) and total phosphorus (TP) (Top) as well as Si and total nitrogen (TN) (Bottom) for tributaries entering each river reach within the Upper Mississippi River System between 2010 and 2018. Standardized major axis regressions for each reach correspond with point color. Dashed lines indicate Si limitation thresholds for Si:TP (1620:1) and Si:TN (1:1).
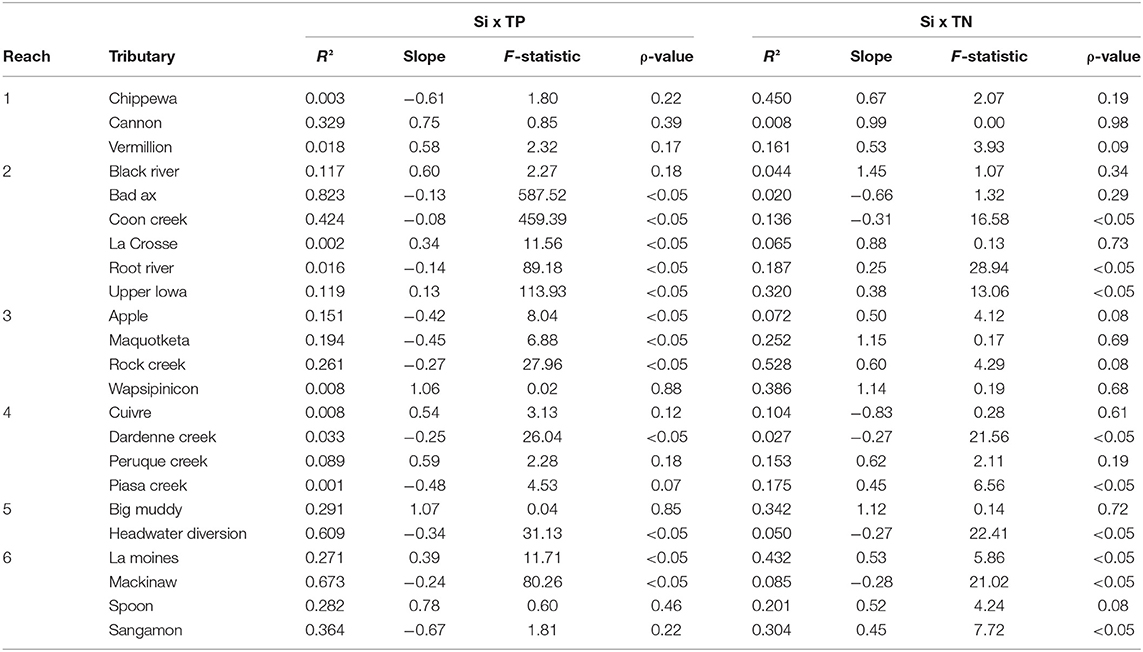
Table 4. Standardized major axis regressions results for the comparison of silicon (Si) to total phosphorus (TP) and Si to total nitrogen (TN) for each major tributary entering the Upper Mississippi River System.
H2: Si:TN:TP Varies Longitudinally Down the River
We observed significant changes in Si stoichiometry down the longitudinal continuum of the river, across both tributaries and the mainstem. With regards to the tributaries, average DSi concentrations and Si:TP ratios significantly (p < 0.01) decreased moving south across the watershed from northern Wisconsin and Minnesota to southern Illinois, whereas Si:TN did not change with latitude (Figure 4). The declines in tributary Si:TP ratios were a result of significant declines in DSi concentrations (R2 = 0.45, p < 0.01) and increases in TP concentrations (R2 = 0.38, p < 0.01) as we move south across the study region. The longitudinal patterns observed in the tributaries were likely driven by the significant shifts in lithology across the study basin, especially given lithology was such a strong predictor of DSi concentrations and stoichiometry. Differences in river size were not a likely driver of these longitudinal shifts, as we found no significant relationships between tributary stoichiometry and basin size (R2 < 0.05 for all constituents).
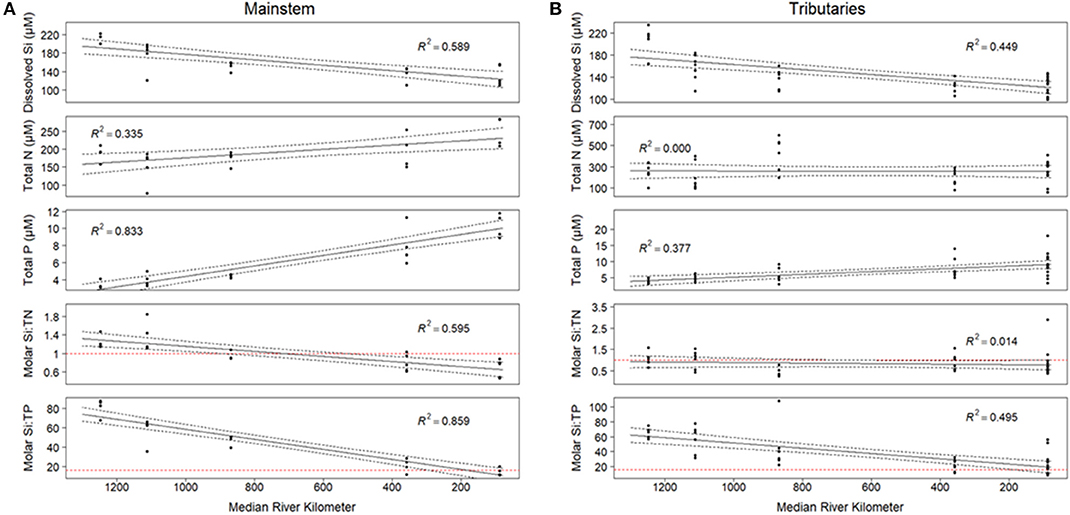
Figure 4. (A) Si concentrations and stoichiometry for the mainstem of the Mississippi River. Si concentrations are modeled by the equation y = 6.13 – 0.52x, Si:TN = 1.50 – 0.16x, and Si:TP = 95.6 – 17.07x. All relationships are significant at the 0.001 level. (B) Si concentrations and stoichiometry for tributaries in the UMRS basin. The relationship between Si concentration and reach number is significant at the 0.001 level, and is modeled by the equation y = 5.29-0.35x. Si:TP vs. field number is significant at the 0.05 level, y = 68.82-7.39x. Si:TN is not significantly related with reach number. For both panels: Red horizontal dashed lines on Si:TN and Si:TP indicate the Redfield ratio. Each point represents the average value at each site from 2010 to 2018.
In the mainstem, we also observed significant longitudinal shifts in Si stoichiometry; DSi concentrations, Si:TN, and Si:TP ratios all declined significantly (p < 0.01) from north to south (Table 1 and Figures 4, 5). The decline was steepest for DSi and Si:TP, although it was also statistically significant for Si:TN (Figure 4). Downstream declines in mainstem Si:TN and Si:TP were functions of decreasing DSi and increasing TN and TP concentrations (p < 0.01 for both TN and TP). The consistent decline in mainstem Si:TN resulted in ratios below Redfield downstream of Reach 3, whereas Si:TP shifted below Redfield prominently only in Reach 6 (Figure 5). DSi and TN were generally more closely coupled than DSi and TP (higher R2 values; Tables 5 and 6), and in both cases the coupling was stronger in the more northern reaches.
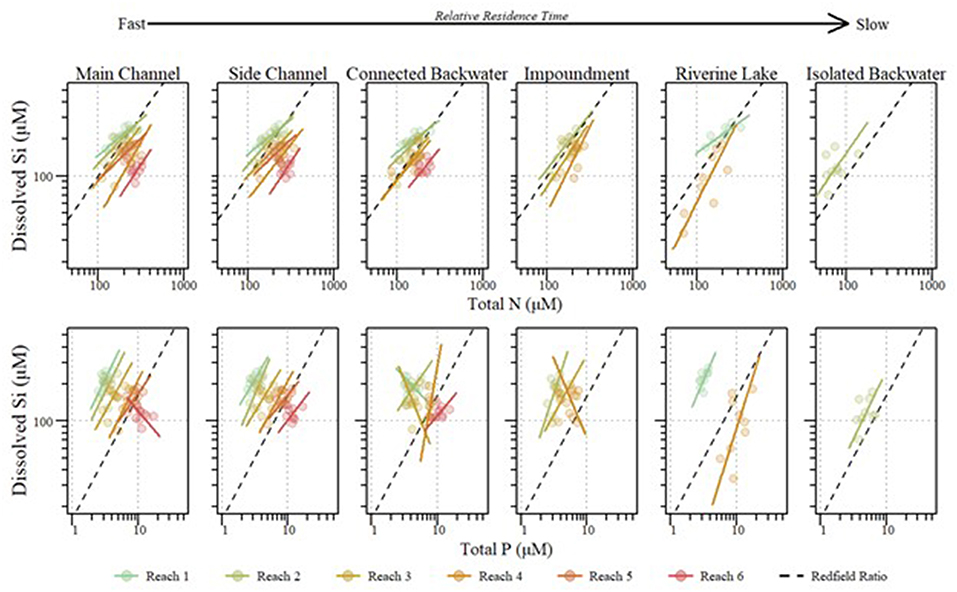
Figure 5. Stoichiometric relationships between annual mean dissolved silicon (DSi) and total phosphorus (TP) (Top) and total nitrogen (TN) (Bottom) within the mainstem of the Upper Mississippi River System across reaches and aquatic areas between 2010 and 2018. Standardized major axis regressions for each reach correspond with point color. Dashed lines indicate Si limitation thresholds for Si:TP (16:1) and Si:TN (1:1).
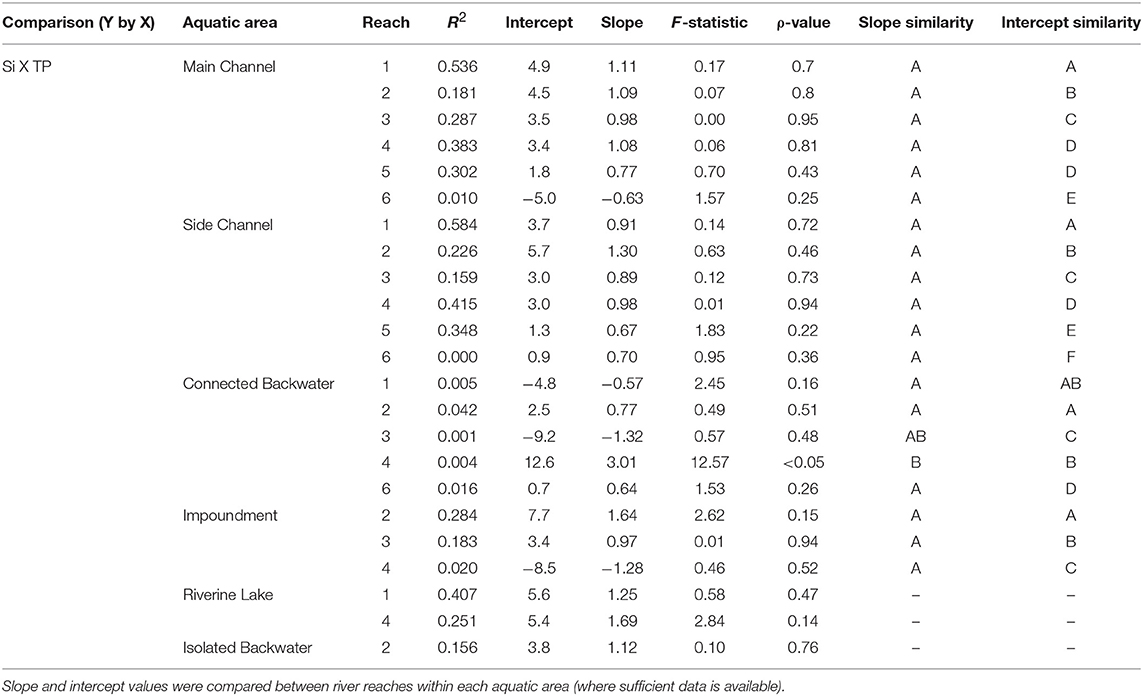
Table 5. Standardized major axis regressions results for the comparison of dissolved silicon (DSi) to total phosphorus (TP) for each aquatic area and reach along the mainstem Upper Mississippi River System.
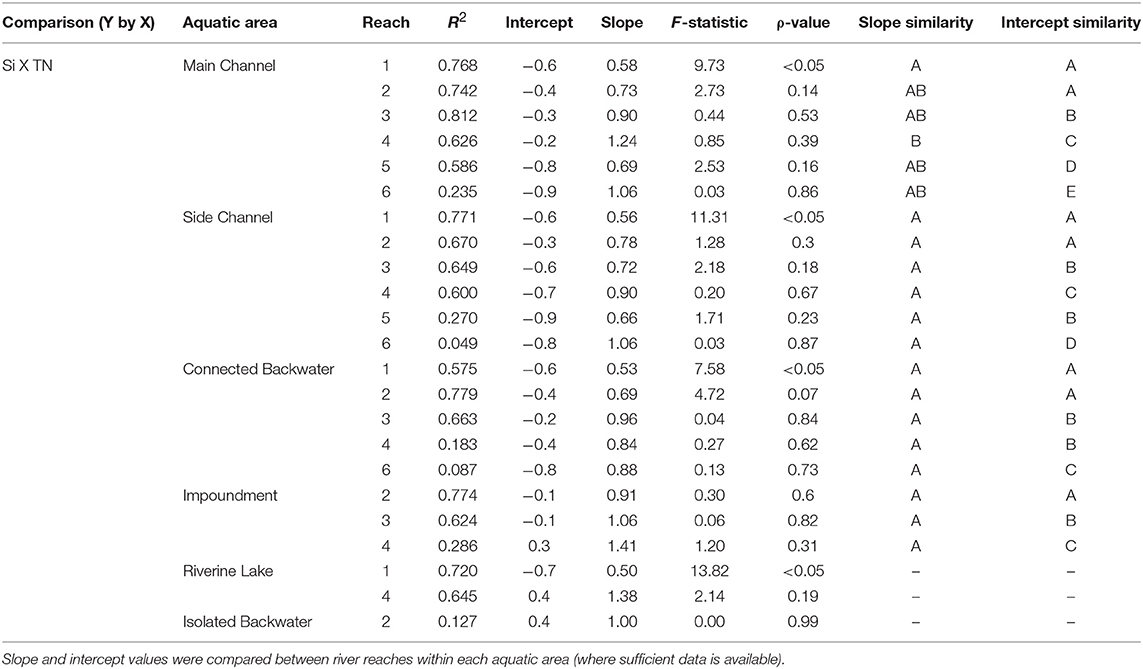
Table 6. Standardized major axis regressions results for the comparison of silicon (Si) to total nitrogen (TN) for each aquatic area and reach along the mainstem Upper Mississippi River System.
Longitudinal differences in mainstem river conditions were captured along first PC axis (PC1), and explained the majority of variation in DSi concentrations and ratios (58%; Figure 6). These longitudinal differences in DSi concentrations, Si:TN, and Si:TP were inversely correlated with turbidity, temperature, and VSS (Figure 6 and Table S4). Regression models showed CHL, VSS, and temperature were the most important predictors of main channel DSi concentration, Si:TP and Si:TN patterns (Tables S5A,B). However, these factors did not explain a great deal of variation in any case (Si—R2m = 0.20; Si:TN—R2m = 0.13; Si:TP—R2m = 0.17). The R2c of the full models, which reflect the random effect of the reach, explained more variation than these limnological factors alone. This suggests these limnological changes along the river continuum are not the dominant influence on longitudinal changes we observed in the mainstem (R2c: DSi = 0.53; Si:TN = 0.56, and Si:TP = 0.63).
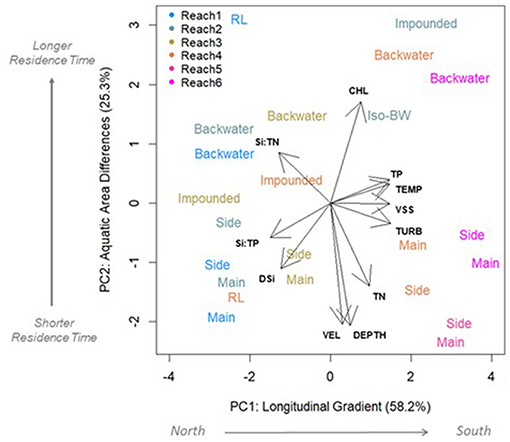
Figure 6. Principal component analysis (PCA) showing variables that differentiate reaches (PC1) and aquatic areas (PC2). Length and direction of arrows indicates how strongly each variable loads along each axis. Variables shown have correlation coefficients of >0.60 with at least one axis. Points are colored by their reach and text label indicates aquatic area. Main, main channel; Side, side channel; Backwater, contiguous backwater; RL, riverine lake; Impound, impounded; and Iso-BW, isolated backwater lake. Variables: TN, total N; TP, total P; CHL, chlorophyll a concentration; TEMP, water temperature; VSS, volatile suspended solids; TURB, turbidity (NTU); Depth, depth; VEL, current speed.
H3: Hydrogeomorphology Explains Variation in Si:TN:TP Across Aquatic Areas
Aquatic areas were differentiated most strongly by depth and velocity (Table 2 and Figure 6). Average depth was highest in the main channel (6.5 ± 0.04 m) and shallowest in the isolated backwater (0.91 ± 0.04 m). Average velocity was highest in the main and side channels (0.48 and 0.52 ± 0.01 m s−1, respectively) and lowest in the riverine lake and isolated backwater areas (<0.01 m s−1). Turbidity, VSS, and temperature were generally highest in the main and side channels, whereas CHL was highest in backwaters and riverine lake areas (31.1 ± 0.39 and 27.1 ± 0.66 μg L−1, respectively; Figure 6). TN was significantly higher in main and side channels than contiguous and isolated backwaters and TP was highest in channels and lowest in the impounded area (Table 2 and Figure 6).
Although differences among reaches were greater than among aquatic areas, DSi, Si:TN, and Si:TP varied among aquatic areas within the mainstem UMRS, indicating the importance of river hydrogeomorphology in influencing stoichiometric patterns (Figures 5, 6, Table 2, and Table S4). Pairwise comparisons showed DSi concentrations were similar among aquatic areas, except isolated backwaters, which had lower DSi than all other aquatic area types (Table 2, Figure 7, and Table S6). Si:TN was higher in the main channel, side channels and impounded areas than in contiguous and isolated backwaters (Table 2 and Figure 7). Si:TP was highest in the riverine lake, followed by the impounded areas, main and side channels, and isolated backwaters (Table 2 and Figure 7). Overall, DSi was generally more similar among aquatic areas than Si:TN or Si:TP.
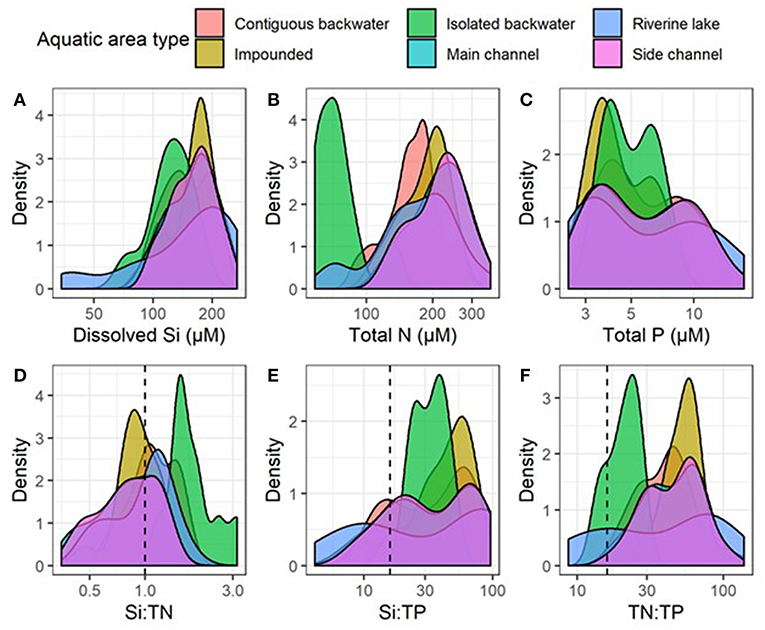
Figure 7. Distributions of annual averages of (A) dissolved silicon (Si), (B) total nitrogen (TN), (C) total phosphorus (TP) concentrations, (D) Si:TN, (E) Si:TP, and (F) TN:TP molar ratios among reaches and aquatic areas between 2010 and 2018. Plots are smoothed histograms using the “geom_density” function in ggplot2 library. Vertical dashed lines indicate Redfield ratios for Si:TN (1:1), Si:TP (16:1), and TN:TP (16:1).
Although most of the variation in DSi, Si:TN, and Si:TP was explained by longitudinal differences (PC1; Figure 6), DSi and Si:TN also differed across the aquatic area gradient (PC2 in Figure 6 and Table S4). The “lateral” or residence time gradient of the river was captured by the second PC axis (PC2), which explained 25.3% of the variation in river conditions. PC2 shows the lateral gradient (i.e., aquatic areas) of the river was best described by differences in depth, velocity, and CHL concentration (Figure 6 and Table S4). DSi was negatively correlated with CHL, and Si:TN was positively correlated with depth and velocity along PC2 (Table S4). Further, when we evaluated controls on DSi, Si:TN, and Si:TP in specific aquatic area types using regression models, CHL, VSS, turbidity consistently explained the most variation. However, these factors were able to explain more variation in DSi concentrations in the mainstem (R2m = 0.20) and impounded areas for Si:TN and Si:TP (R2m = 0.34 and 0.39, respectively) compared to contiguous backwaters, where little explanatory power of these factors was observed (R2m = 0.04, 0.08, and 0.15, for DSi concentrations, Si:TN, and Si:TP, respectively).
Across aquatic areas, we observed a relatively high degree of coupling in Si stoichiometry. That is, changes in one nutrient (i.e., DSi) corresponded with proportional changes in the other (i.e., TN or TP). Specifically, 83 and 96% of aquatic areas displayed relatively strong coupling of Si to TN and Si to TP, respectively, defined as having slopes not different than one (Tables 5, 6 and Figure 5). In general, Si was more coupled with TN, compared to TP, as indicated by tighter coefficients of determination (i.e., R2) between TN × Si compared to TP × Si (Tables 5, 6). However, Si stoichiometry showed weaker coupling in several aquatic areas, especially those with lower residence time. For example, connected backwaters showed weaker coupling of Si × TP (Figure 5), with R2 <0.1 in all cases (n = 5) and absolute slope values significantly different than one. In these cases, we observe an abundance of DSi relative to TP (Table 5). We observed variability across aquatic areas in Si stoichiometry in relation to Redfield ratios, with some areas showing a stronger degree of Si limitation. For example, main and side channels were more Si-limited with regard to N compared to other aquatic area types (Figure 5).
Discussion
The stoichiometric relationships we observed among DSi, TP, and TN in the UMRS integrate both external inputs and internal processing of these nutrients (Maranger et al., 2018). We hypothesized basin land use and lithology would alter tributary inputs into the mainstem UMRS (H1), Si:TN:TP would vary longitudinally across the basin (H2), and variation in river hydrogeomorphology would result in heterogeneous Si stoichiometry among across aquatic area types (H3). We found significant downstream declines in average DSi concentrations, and Si:TN and Si:TP in the UMRS, and altered stoichiometric ratios associated with lower residence time. We explored potential causes for this observed variability, highlighting shifts in tributary inputs and the limnological complexity of the river (e.g., altered residence time, suspended sediment, and phytoplankton dynamics).
Effects of Basin Land Use and Lithology on Tributary Inputs
We hypothesized basin land use and lithology would be strong predictors of river Si stoichiometry. Contrary to work in other temperate regions, our results indicate basin land cover was not a critical driver of tributary DSi concentrations. In fact, we found lithology, rather than land use, was a much stronger predictor of DSi concentrations in UMRS tributaries (Table 4). We suspect the strong signal of lithology here is due largely to the wide range of lithology relative to the differences in land use. For example, the New England (USA) watersheds, where land use was shown to be a strong control of river DSi exports, were one to three orders of magnitude smaller, and exhibited less variety in lithology and larger shifts in land use, compared to the tributary watersheds we study here (Carey and Fulweiler, 2012b).
However, basin land cover appeared to be an important driver of tributary ratios (Si:TN and Si:TP) (Table 3). Specifically, we observed a significant decline in Si:TN with increasing watershed agricultural land use. These patterns were driven by the significantly positive relationship between cultivated crop lands and TN concentrations, rather than altered DSi concentrations with cultivated land area, which is consistent with recent findings from the same region (Downing et al., 2016). Despite the significant relationship between basin cultivated crops coverage and Si:TN ratios in the tributaries, our regressions indicated forest and developed coverage were more important drivers of tributary nutrient stoichiometry compared to cultivated crop land, likely due to co-variation of cultivated crops with other land uses (see Supplemental Information). Thus, shifts in primary lithology across the longitudinal gradient of the system appear to be an important factor driving declining DSi concentrations at the mouths of tributaries southward across the region.
The fact that N is more responsive to basin land use, specifically cultivated crop area, is not surprising; the direct application of fertilizers on cultivated crops are known to impact N and, to a lesser extent, P loads, to the UMRS (Raymond et al., 2012; Robertson et al., 2014; Van Meter et al., 2018). Interestingly, recent work on tributaries in this basin showed increasing trends in N loading, but declining trends in P loading from agricultural watersheds (Kreiling and Houser, 2016). It is possible that the same processes that reduced P movement off the landscape (e.g., reduced erosion) may have also influenced the transport of Si, resulting in a non-significant relationship of DSi with land use in recent years.
Variation in Si:TN:TP Along the Length of the UMRS
We hypothesized we would observe varying Si stoichiometry along the longitudinal length of the river due to variable nutrient loading and processing along the UMRS. We observed significant declines in DSi concentrations, and stoichiometric ratios (Si:TN and Si:TP) in the mainstem across all aquatic area types from north to south across the study region. These patterns appear to reflect both changes in inputs and in-river processing. We saw a similar decline in external Si inputs from the tributaries, which similarly changed from north to south. In addition, increased runoff from human activities supplement concentrations of TN and TP along the mainstem (Kreiling and Houser, 2016). Other sources of N, such as from N deposition, also have influenced these patterns, given its similar longitudinal distribution (NADP, 2016). We can also attribute some of the longitudinal changes in DSi to downstream increases in CHL, temperature, and organic suspended material (Table S5A and Figure 6), suggesting in-stream uptake of Si by aquatic plants and diatoms play a role in shaping Si stoichiometry (Johnson and Hagerty, 2008; Manier, 2014; Crawford et al., 2016). Our results confirm previous work that has shown higher loads of TN relative to DSi and TP to the Gulf of Mexico, creating a more Si and P-limited system for marine phytoplankton (Houser et al., 2010; Royer, 2019).
Effects of River Hydrogeomorphology on Variation in Si:TN:TP
We hypothesized Si stoichiometry would vary across aquatic area types due to differences in water residence time and other physical characteristics. Water residence time is a key driver of Si cycling in aquatic systems. Higher residence time can facilitate diatom blooms and subsequent Si burial and retention (van Bennekom and Salomons, 1980; Humborg et al., 1997, 2000, 2006; Downing et al., 2016). We found decreasing DSi concentrations with increasing residence time among aquatic areas. For example, contiguous and isolated backwaters, which had the highest relative residence times, displayed the lowest DSi concentrations compared to other aquatic areas (152 ± 1.4 and 126 ± 7.1 μM, respectively vs. 158–195 μM; Table 2). These areas also have high abundances of macrophytes, epiphytic algae, and higher water clarity that could facilitate benthic algal growth (Johnson and Hagerty, 2008; Kreiling and Houser, 2016). The uptake of DSi by primary producers other than phytoplankton in these environments likely reflects the combined role of multiple autotrophs, but their relative roles in Si cycling in rivers are not yet well-understood (Schoelynck et al., 2010, 2012).
The relationships of Si:TN and Si:TP varied more across aquatic area types compared to DSi concentrations alone (Figure 7), suggesting more dynamic processing of N and P compared to DSi. Both isolated backwaters and backwater lakes had statistically higher Si:TN than other aquatic area types. These differences are due to lower TN concentrations in isolated backwaters and backwater lakes, potentially due to increased denitrification rates in these areas and their lower connectivity to the main channel. Denitrification rates are likely higher in these systems as a result of higher sediment organic matter and lower sediment oxygen availability (Richardson et al., 2004; Downing et al., 2016). In contrast, Si:TP ratios were more variable along the residence time gradient (Table 2), although they were lowest in isolated backwater lakes, which was driven by the dramatically lower DSi concentrations in these aquatic areas. While anoxic conditions associated with the higher water residence times can foster P release from sediments (Wetzel, 2001; Houser and Richardson, 2010), we do not see that signal in our data. Rather, we observe the highest TP concentrations in main and side channel aquatic areas, which were the most turbid and have the shortest residence times. We suggest that the elevated TP concentrations may be due to P sorption to suspended particulates (Froelich, 1988). These same factors are likely responsible for the differences in coupling we observed across aquatic areas, where connected backwaters again behaved differently than other aquatic area types.
Consistent with prior studies from the region (Downing et al., 2016), we found no significant difference in DSi concentrations or Si:TN and Si:TP ratios between low head impoundments and main channel reaches of the UMRS (Table 2 and Figure 7). The lack of observed DSi depletion within these run-of-river impoundments is likely due to the relatively unaltered water residence time compared to most other aquatic areas (Table 2). An additional reason for the lack of DSi depletion behind the impoundments we study here may be due to the potential dominance of cyanobacteria, rather than diatoms, in the system (Manier, 2014). In the impoundments studied by Downing et al. (2016) in the same region, diatoms made up <10% of the phytoplankton community, with cyanobacteria dominating. In cases where non-siliceous algae dominate over diatoms, DSi uptake and burial is limited, resulting in a lack of change in Si stoichiometry in these systems.
Implications for Coastal Receiving Waters
The implications of nutrient concentrations and their ratios supplied by freshwater rivers to coastal receiving waters can range from minor shifts in the community composition of diatoms to large blooms of toxic algae and extensive hypoxia, all of which have direct implications for marine ecology and C cycling. Early work by Smayda (1990) suggested decreases in the Si:N ratio below the canonical Redfield 1:1 ratio (Redfield, 1963; Brzezinski, 1985) would shift phytoplankton communities entirely away from diatoms and would promote nuisance blooms dominated by haptophytes (e.g., Phaeocystis) and dinoflagellates (e.g., Alexandrium). As such, comparing the UMRS stoichiometry to the Redfield ratio can indicate the potential for nutrient limitation of algal communities in receiving waters. Stoichiometric ratios in the UMRS basin varied above and below the Redfield ratio (1:1) for Si:TN, dependent on season. During the winter and spring (January through June), average Si:TN ratios are consistently below Redfield, indicating possible Si-limitation relative to N in the system. Conversely, Si:TP ratios are consistently above Redfield throughout the year. Declines in DSi concentrations in the spring and fall could be attributed to increased discharge and dilution, as well as biological uptake and assimilation of DSi in terrestrial plants and diatoms (Humborg et al., 2006; Carey and Fulweiler, 2013). We also observed variation in ratios spatially in the UMRS, with increasing Si limitation relative to TN and TP as we move south across the study region. Downstream of Reach 3, Si becomes limiting relative to TN, and Si approaches limitation relative to TP at the southern end of our study region (Reach 5) (Figure 4). On average the main channel is DSi limited across all reaches relative to N, likely due to high N inputs.
Although the Redfield ratio is useful for comparison, it was developed for marine algae, and freshwater diatoms can require up to an order of magnitude greater Si than marine species (Conley et al., 1988). Moreover, recent work suggests extreme flexibility in the Si:N ratio of diatoms; some genera, such as Pseudo-nitzchia, can vary by 15-fold in their Si quota and thus, form blooms under highly divergent Si:N ratios (Pan et al., 1996; Davidson et al., 2012). While Si:N ratios may not strictly determine the proportion of diatoms in a community to the extent previously believed, low Si:N ratios can favor weakly silicified diatoms, which can have significant ecosystem-wide effects. For example, weaker diatom silicification can increase grazing efficiency (Liu et al., 2016; Zhang et al., 2017), potentially affecting trophic transfer efficiency, food web dynamics, and ecosystem services. In addition, lower Si content can result in slower sinking rates, with direct implications for the rate of vertical C export and bottom-water hypoxic zone formation (Turner et al., 1998). Finally, factors affecting diatom growth rates (e.g., light or temperature) also likely affect cellular Si concentration since the rate of Si uptake is dependent upon the rate of cellular growth (Taylor, 1985). In turn, any driver of global change that alters diatom growth rates may alter diatom Si content, independent from the stoichiometric ratios of supplied nutrients. Therefore, even small deviations from balanced stoichiometry as a result of riverine nutrient processing, in combination with other facets of global change, could exacerbate shifts toward potentially harmful algal communities and alter ecological functioning.
In order to evaluate whether the ratios in the UMRS are representative of nutrient exports to coastal receiving waters from the entire basin, we compared our ratios from our southernmost study site (Reach 5) to those at the mouth of the Mississippi River as it enters the Gulf of Mexico (Belle Chasse station: USGS 07374525) for the 2010–2018 period. We found very similar Si stoichiometry between the two stations, with both Si:TN and Si:TP showing only slight changes at the mouth (0.83 and 15.3, respectively) compared to Reach 5 (0.79 and 19.6, respectively). This indicates the majority of external drivers and internal modulators of nutrients relevant for coastal waters may occur in the UMRS portion of the basin. Although the complex hydrology of the UMRS may differentially influence the loads of DSi, TN, and TP (Smits et al., 2019), we only considered concentrations in our analyses because of the difficulty in calculating loads across diverse hydrogeomorphic areas. Our results agree with recent work by Royer (2019), which shows that although the UMRS represents 15% of the total Mississippi-Atchafalaya River Basin, it explains the majority (57%) of the variation in N loading at the Gulf of Mexico. This highlights the importance of studying Si:TN:TP in the UMRS, as this stoichiometric signal is reflected in the Si stoichiometry entering the Gulf of Mexico.
In general, the values we observed show the UMRS has lower relative Si:TN, but higher relative Si:TP compared to rivers worldwide. Compared to values from the GEMS-GLORI database, which represents data from 126 rivers on six continents, UMRS Si:TN ratios fall within the 18–32nd percentile, and Si:TP values fall within the 50–97th percentile of the values in the database (Garnier et al., 2010) (see Supplemental Information). This indicates that the UMRS has relatively high TN concentrations compared to other systems, and the combined processes that shape Si:TN stoichiometry act in concert to deliver a relatively Si- and P-limited nutrient supply to downstream systems.
Together, our results show rivers are not simple pipes for Si, but rather the complexity in watershed characteristics, hydrology, and biological uptake result in dynamic Si cycling along the river continuum. Shifting Si:TN:TP ratios are driven by basin land cover and lithology and local limnological conditions, such as water residence time, turbidity, and inorganic nutrient concentrations. Although there is a great deal of work on Si stoichiometry on rivers globally, our manuscript is unique in evaluating Si variability as a function of river hydrogeomorphology and across the river continuum. The conceptual framework of this paper translates well to understanding the drivers of variable Si stoichiometry in large rivers globally. This enhanced understanding of the causes of variation in Si:TN:TP stoichiometry can inform management decisions by shedding light on the relative extent to which these ratios are driven by natural vs. anthropogenic factors.
Data Availability
All data are publicly available for download at the following https://umesc.usgs.gov/ltrm-home.html.
Author Contributions
The preparation and creation of this manuscript was a strong collaborative effort and JC, KJ, PJ, LS and PT contributed equally to the effort, and are ordered alphabetically. Specifically, JC, KJ, PJ, LS and PT conceived the idea, performed the statistical analyses and wrote the paper. JR performed spatial analyses and created all maps.
Funding
This paper was a product of the workshop Woodstoich 2019. Financial support was provided by National Science Foundation (DEB-1840408). KJ was funded by the US Army Corps of Engineers' Upper Mississippi River Restoration Program as were many of the datasets used in our analyses.
Conflict of Interest Statement
The authors declare that the research was conducted in the absence of any commercial or financial relationships that could be construed as a potential conflict of interest.
Acknowledgments
We would like to thank Kate Henderson, Dr. Todd Royer, Dr. Zoe Cardon, and the peer reviewers for constructive comments on earlier versions of this manuscript. We thank Drs. Jim Elser and Michelle A. Evans-White for organizing Woodstoich4 (keeping it groovy). We acknowledge University of Montana's Flathead Lake Biological Station, where we spent an intensive week finalizing this manuscript. Any use of trade, product, or firm names is for descriptive purposes only and does not imply endorsement by the U.S. Government.
Supplementary Material
The Supplementary Material for this article can be found online at: https://www.frontiersin.org/articles/10.3389/fevo.2019.00346/full#supplementary-material
References
American Public Health Association (2005). Standard Methods for the Examination of Water and Wastewater, 21st Edn. Washington, DC: American Public Health Association.
Anderson, C. R., Siegel, D. A., Kudela, R. M., and Brzezinski, M. A. (2009). Empirical models of toxigenic Pseudo-nitzschia blooms: potential use as a remote detection tool in the Santa Barbara Channel. Harmful Algae 8, 478–492. doi: 10.1016/j.hal.2008.10.005
Anderson, D. M., Glibert, P. M., and Burkholder, J. M. (2002). Harmful algal blooms and eutrophication: nutrient sources, composition, and consequences. Estuaries 25, 704–726. doi: 10.1007/BF02804901
Bargu, S., Baustian, M. M., Rabalais, N. N., Del Rio, R., Von Korff, B., and Turner, R. E. (2016). Influence of the Mississippi River on Pseudo-nitzschia spp. Abundance and toxicity in Louisiana coastal waters. Estu. Coasts 39, 1345–1356. doi: 10.1007/s12237-016-0088-y
Bates, D., Sarkar, D., Bates, M. D., and Matrix, L. (2007). The lme4 Package. R Package Version 2, 74.
Bergström, A.-K. (2010). The use of TN:TP and DIN:TP ratios as indicators for phytoplankton nutrient limitation in oligotrophic lakes affected by N deposition. Aquatic Sci. 72, 277–281. doi: 10.1007/s00027-010-0132-0
Berner, R. A., Lasaga, A. C., and Garrels, R. M. (1983). The carbonate-silicate geochemical cycle and its effect on atmospheric carbon dioxide over the past 100 million years. 283, 641–683. doi: 10.2475/ajs.283.7.641
Beusen, A. H. W., Bouwman, A. F., Dürr, H. H., Dekkers, A. L. M., and Hartmann, J. (2009). Global patterns of dissolved silica export to the coastal zone: results from a spatially explicit global model. Glob. Biogeochem. Cycles 23:GB0A02. doi: 10.1029/2008GB003281
Bluth, G. J. S., and Kump, L. R. (1994). Lithologic and climatologic controls of river chemistry. Geochim. Cosmochim. Acta 58, 2341–2359. doi: 10.1016/0016-7037(94)90015-9
Brady, P. V., and Carroll, S. A. (1994). Direct effects of CO2 and temperature on silicate weathering: possible implications for climate control. Geochim. Cosmochim. Acta 58, 1853–1856. doi: 10.1016/0016-7037(94)90543-6
Brzezinski, M. A. (1985). The Si-C-N ratio of marine Diatoms - interspecific variability and the effect of some environmental variables. J. Phycol. 21, 347–357. doi: 10.1111/j.0022-3646.1985.00347.x
Burnham, K. P., and Anderson, D. R. (2002). Model Selection and Multimodel Inference: A Practical Information-Theoretic Approach. 2nd ed. New York, NY: Springer.
Carey, J. C., and Fulweiler, R. W. (2012a). The terrestrial silica pump. PLoS ONE 7:e52932. doi: 10.1371/journal.pone.0052932
Carey, J. C., and Fulweiler, R. W. (2012b). Human activities directly alter watershed dissolved silica fluxes. Biogeochemistry 111, 125–138. doi: 10.1007/s10533-011-9671-2
Carey, J. C., and Fulweiler, R. W. (2013). Watershed land use alters riverine silica cycling. Biogeochemistry 113, 525–544. doi: 10.1007/s10533-012-9784-2
Carey, J. C., and Fulweiler, R. W. (2016). Human appropriation of biogenic silicon-the increasing role of agriculture. Functional Ecol. 30, 1331–1339. doi: 10.1111/1365-2435.12544
Cermeño, P., Falkowski, P. G., Romero, O. E., Schaller, M. F., and Vallina, S. M. (2015). Continental erosion and the Cenozoic rise of marine diatoms. Proc. Natl. Acad. Sci. U.S.A. 112, 4239–4244. doi: 10.1073/pnas.1412883112
Chen, N., Wu, Y., Wu, J., Yan, X., and Hong, H. (2014). Natural and human influences on dissolved silica export from watershed to coast in Southeast China: influences on watershed silica export. J. Geophys. Res. Biogeosci. 119, 95–109. doi: 10.1002/2013JG002429
Cleveland, C. C., and Liptzin, D. (2007). C:N:P stoichiometry in soil: is there a “Redfield ratio” for the microbial biomass? Biogeochemistry 85, 235–252. doi: 10.1007/s10533-007-9132-0
Clymans, W., Struyf, E., Govers, G., Vandevenne, F., and Conley, D. J. (2011). Anthropogenic impact on amorphous silica pools in temperate soils. Biogeosciences 8, 2281–2293. doi: 10.5194/bg-8-2281-2011
Cole, J. J., Prairie, Y. T., Caraco, N. F., McDowell, W. H., Tranvik, L. J., Striegl, R. G., et al. (2007). Plumbing the global carbon cycle: integrating inland waters into the terrestrial carbon budget. Ecosystems 10, 172–185. doi: 10.1007/s10021-006-9013-8
Conley, D., Schelske, C., and Stoermer, E. (1993). Modification of the biogeochemical cycle of silica with eutrophication. Mar. Ecol. Progr. Seri. 101, 179–192. doi: 10.3354/meps101179
Conley, D. J. (1997). Riverine contribution of biogenic silica to the oceanic silica budget. Limnol. Oceanogr. 42, 774–777. doi: 10.4319/lo.1997.42.4.0774
Conley, D. J. (2002). Terrestrial ecosystems and the global biogeochemical silica cycle. Glob. Biogeochem. Cycles 16:1121. doi: 10.1029/2002GB001894
Conley, D. J., Likens, G. E., Buso, D. C., Saccone, L., Bailey, S. W., and Johnson, C. E. (2008). Deforestation causes increased dissolved silicate losses in the Hubbard Brook Experimental Forest. Glob. Change Biol. 14, 2548–2554. doi: 10.1111/j.1365-2486.2008.01667.x
Conley, D. J., Quigley, M. A., and Schelske, C. L. (1988). Silica and phosphorus flux from sediments: importance of internal recycling in lake michigan. Can. J. Fish. Aquat. Sci. 45, 1030–1035. doi: 10.1139/f88-126
Cooke, J., and Leishman, M. R. (2011). Is plant ecology more siliceous than we realise? Trends Plant Sci. 16, 61–68. doi: 10.1016/j.tplants.2010.10.003
Cornelis, J. T., Delvaux, B., Georg, R. B., Lucas, Y., Ranger, J., and Opfergelt, S. (2011). Tracing the origin of dissolved silicon transferred from various soil-plant systems towards rivers: a review. Biogeosciences 8, 89–112. doi: 10.5194/bg-8-89-2011
Crawford, J. T., Loken, L. C., Stanley, E. H., Stets, E. G., Dornblaser, M. M., and Striegl, R. G. (2016). Basin scale controls on CO2 and CH4 emissions from the Upper Mississippi River. Geophys. Res. Lett. 43, 1973–1979. doi: 10.1002/2015GL067599
Davidson, K., Gowen, R. J., Tett, P., Bresnan, E., Harrison, P. J., McKinney, A., et al. (2012). Harmful algal blooms: How strong is the evidence that nutrient ratios and forms influence their occurrence? Estu. Coast. Shelf Sci. 115, 399–413. doi: 10.1016/j.ecss.2012.09.019
De Jager, N. R., Rogala, J. T., Rohweder, J. J., Van Appledorn, M., Bouska, K. L., Houser, J. N., et al. (2018). Indicators of Ecosystem Structure and Function for the Upper Mississippi River System. U.S. Geological Survey. doi: 10.3133/ofr20181143
Dodds, W. K. (2003). Misuse of inorganic N and soluble reactive P concentrations to indicate nutrient status of surface waters. J. North Am. Benthol. Soc. 22, 171–181. doi: 10.2307/1467990
Downing, J. A. (1997). Marine nitrogen: phosphorus stoichiometry and the global N: P cycle. Biogeochemistry 37, 237–252. doi: 10.1023/A:1005712322036
Downing, J. A., Cherrier, C. T., and Fulweiler, R. W. (2016). Low ratios of silica to dissolved nitrogen supplied to rivers arise from agriculture not reservoirs. Ecol. Lett. 19, 1414–1418. doi: 10.1111/ele.12689
Drever, J. I. (1994). The effect of land plants on weathering rates of silicate minerals. Geochim. Cosmochim. Acta 58, 2325–2332. doi: 10.1016/0016-7037(94)90013-2
Elser, J. J., Bracken, M. E. S., Cleland, E. E., Gruner, D. S., Harpole, W. S., Hillebrand, H., et al. (2007). Global analysis of nitrogen and phosphorus limitation of primary producers in freshwater, marine and terrestrial ecosystems. Ecol. Lett. 10, 1135–1142. doi: 10.1111/j.1461-0248.2007.01113.x
Exley, C. (1998). Silicon in life: a bioinorganic solution to bioorganic essentiality. J. Inorganic Biochem. 69, 139–144. doi: 10.1016/S0162-0134(97)10010-1
Fox, J., Weisberg, S., Adler, D., Bates, D., Baud-Bovy, G., Ellison, S., et al. (2012). Package ‘Car.' Vienna: R Foundation for Statistical Computing.
Frings, P. J., Clymans, W., Fontorbe, G., De La Rocha, C. L., and Conley, D. J. (2016). The continental Si cycle and its impact on the ocean Si isotope budget. Chem. Geol. 425, 12–36. doi: 10.1016/j.chemgeo.2016.01.020
Froelich, P. N. (1988). Kinetic control of dissolved phosphate in natural rivers and estuaries: a primer on the phosphate buffer mechanism. Limnol. Oceanogr. 33, 649–668. doi: 10.4319/lo.1988.33.4_part_2.0649
Gardner, J. R., Ensign, S. H., Houser, J. N., and Doyle, M. W. (2019). Light exposure along particle flowpaths in large rivers. Limnol. Oceanogr. doi: 10.1002/lno.11256
Garnier, J., Beusen, A., Thieu, V., Billen, G., and Bouwman, L. (2010). N:P:Si nutrient export ratios and ecological consequences in coastal seas evaluated by the ICEP approach. Glob. Biogeochem. Cycles 24, 1–12. doi: 10.1029/2009GB003583
Guildford, S. J., and Hecky, R. E. (2000). Total nitrogen, total phosphorus, and nutrient limitation in lakes and oceans: is there a common relationship? Limnol. Oceanogr. 45, 1213–1223. doi: 10.4319/lo.2000.45.6.1213
Hodson, M. J., White, P. J., Mead, A., and Broadley, M. R. (2005). Phylogenetic variation in the silicon composition of plants. Ann. Botany 96, 1027–1046. doi: 10.1093/aob/mci255
Homer, C., Dewitz, J., Yang, L., Jin, S., Danielson, P., Xian, G., et al. (2015). Completion of the 2011 National Land Cover Database for the conterminous United States–representing a decade of land cover change information. Photogrammetr. Eng. Remote Sens. 81, 345–354.
Hotchkiss, E. R., Hall, R. O. Jr, Sponseller, R. A., Butman, D., Klaminder, J., Laudon, H., et al. (2015). Sources of and processes controlling CO2 emissions change with the size of streams and rivers. Nature Geosci. 8, 696–699. doi: 10.1038/ngeo2507
Houser, J. N, Bierman, D. W., Burdis, R. M., and Soeken-Gittinger, L. A. (2010). Longitudinal trends and discontinuities in nutrients, chlorophyll and suspended solids in the Upper Mississippi River: implications for transport, processing and export by large rivers. Hydrobiologia 651, 127–144. doi: 10.1007/s10750-010-0282-z
Houser, J. N., and Richardson, W. B. (2010). Nitrogen and phosphorus in the Upper Mississippi River: transport, processing, and effects on the river ecosystem. Hydrobiologia 640, 71–88. doi: 10.1007/s10750-009-0067-4
Humborg, C., Conley, D. J., Rahm, L., Wulff, F., Cociasu, A., and Ittekkot, V. (2000). Silicon retention in river basins: far-reaching effects on biogeochemistry and aquatic food webs in coastal marine environments. J. Hum. Environ. 29, 45–50. doi: 10.1579/0044-7447-29.1.45
Humborg, C., Ittekkot, V., Cociasu, A., and Bodungen, B. V. (1997). Effect of Danube River dam on Black Sea biogeochemistry and ecosystem structure. Nature 386, 385–388. doi: 10.1038/386385a0
Humborg, C., Pastuszak, M., Aigars, J., Siegmund, H., Mörth, C.-M., and Ittekkot, V. (2006). Decreased silica land–sea fluxes through damming in the Baltic Sea catchment – significance of particle trapping and hydrological alterations. Biogeochemistry 77, 265–281. doi: 10.1007/s10533-005-1533-3
Johnson, B. L., and Hagerty, K. H. (2008). Status and Trends of Selected Resources of the Upper Mississippi River System. United States Geological Survey.
Julian, P., Gerber, S., Bhomia, R. K., King, J., Osborne, T. Z., Wright, A. L., et al. (2019). Evaluation of nutrient stoichiometric relationships among ecosystem compartments of a subtropical treatment wetland. Do we have “Redfield wetlands”? Ecol. Process 8:20. doi: 10.1186/s13717-019-0172-x
Junk, W. J., Bayley, P. B., and Sparks, R. E. (1989). The flood pulse concept in river-floodplain systems. Can. Spec. Publ. Fish. Aquat. Sci. 106, 110–127.
Justić, D., Rabalais, N. N., Turner, R. E., and Dortch, Q. (1995). Changes in nutrient structure of river-dominated coastal waters: stoichiometric nutrient balance and its consequences. Estu. Coast. Shelf Sci. 40, 339–356. doi: 10.1016/S0272-7714(05)80014-9
Kreiling, R. M., and Houser, J. N. (2016). Long-term decreases in phosphorus and suspended solids, but not nitrogen, in six upper Mississippi River tributaries, 1991–2014. Environ. Monit. Assess. 188:454. doi: 10.1007/s10661-016-5464-3
Liu, J., Van Oosterhout, E., Faassen, E. J., Lürling, M., Helmsing, N. R., and Van de Waal, D. B. (2016). Elevated p CO 2 causes a shift towards more toxic microcystin variants in nitrogen-limited Microcystis aeruginosa. FEMS Microbiol. Ecol. 92:fiv159. doi: 10.1093/femsec/fiv159
Maguire, T. J., and Fulweiler, R. W. (2016). Urban dissolved silica: quantifying the role of groundwater and runoff in wastewater influent. Environ. Sci. Technol. 50, 54–61. doi: 10.1021/acs.est.5b03516
Maguire, T. J., and Fulweiler, R. W. (2019). Urban groundwater dissolved silica concentrations are elevated due to vertical composition of historic land-filling. Sci. Total Environ. 684, 89–95. doi: 10.1016/j.scitotenv.2019.05.272
Manier, J. T. (2014). Spatial and temporal dynamics of phytoplankton assemblages in selected reaches of the Upper Mississippi River: Navigation Pools 8, 13, 26 (Master's Thesis). University of Wisconsin, La Crosse, WI, United States.
Maranger, R., Jones, S. E., and Cotner, J. B. (2018). Stoichiometry of carbon, nitrogen, and phosphorus through the freshwater pipe: stoichiometry of carbon, nitrogen, and phosphorus. Limnol. Oceanogr. 3, 89–101. doi: 10.1002/lol2.10080
NADP (2016). Annual Map Summary. NADP Data Report 2016-02. Urbana-Champaign, IL: University of Illinois.
Nakagawa, S., Johnson, P. C., and Schielzeth, H. (2017). The coefficient of determination R 2 and intra-class correlation coefficient from generalized linear mixed-effects models revisited and expanded. J. R. Soc. Interface 14:20170213. doi: 10.1098/rsif.2017.0213
Nakagawa, S., and Schielzeth, H. (2013). A general and simple method for obtaining R 2 from generalized linear mixed-effects models. Methods Ecol. Evol. 4, 133–142. doi: 10.1111/j.2041-210x.2012.00261.x
Officer, C., and Ryther, J. (1980). The possible importance of silicon in marine eutrophication. Mar. Ecol. Prog. Ser. 3, 83–91. doi: 10.3354/meps003083
Oksanen, J., Blanchet, F. G., Friendly, M., Kindt, R., Legendre, P., McGlinn, D., et al. (2018). vegan: Community Ecology Package. R package version 2.5-2. 2018.
Pan, Y., Subba Rao, D., Mann, K., Brown, R., and Pocklington, R. (1996). Effects of silicate limitation on production of domoic acid, a neurotoxin, by the diatom Pseudo-nitzschia multiseries. I. Batch culture studies. Mar. Ecol. Prog. Ser. 131, 225–233. doi: 10.3354/meps131225
Parsons, M. L., and Dortch, Q. (2002). Sedimentological evidence of an increase in Pseudo-nitzschia (Bacillariophyceae) abundance in response to coastal eutrophication. Limnol. Oceanogr. 47, 551–558. doi: 10.4319/lo.2002.47.2.0551
Rabalais, N. N., Turner, R. E., and Wiseman, W. J. (2002). Gulf of Mexico Hypoxia, A.K.A. “The Dead Zone.” Annu. Rev. Ecol. Syst. 33, 235–263. doi: 10.1146/annurev.ecolsys.33.010802.150513
Raymond, P. A., David, M. B., and Saiers, J. E. (2012). The impact of fertilization and hydrology on nitrate fluxes from Mississippi watersheds. Curr. Opin. Environ. Sustain. 4, 212–218. doi: 10.1016/j.cosust.2012.04.001
Redfield, A. C. (1934). “On the proportions of organic derivations in seawater and their relation to the composition of plankton,” in James Johnston Memorial Volume, ed R. J. Daniel (Liverpool: University Press of Liverpool), 176–192.
Redfield, A. C. (1958). The biological control of chemical factors in the environment. Am. Sci. 46, 230A−221.
Redfield, A. C. (1963). The influence of organisms on the composition of sea water,” in The Sea, Vol. 2, ed M. N. Hill (New York, Ny: Interscience Publishers), 26-77.
Richardson, W. B., Strauss, E. A., Bartsch, L. A., Monroe, E. M., Cavanaugh, J. C., Vingum, L., et al. (2004). Denitrification in the Upper Mississippi River: rates, controls, and contribution to nitrate flux. Can. J. Fish. Aquat. Sci. 61, 1102–1112. doi: 10.1139/f04-062
Ripley, B., Venables, B., Bates, D. M., Hornik, K., Gebhardt, A., Firth, D., et al. (2013). Package ‘mass.' Cran R.
Robertson, D. M., Saad, D. A., and Schwarz, G. E. (2014). Spatial Variability in Nutrient Transport by HUC8, State, and Subbasin Based on Mississippi/Atchafalaya River Basin SPARROW Models. J. Am. Water Resour. Assoc. 50, 988–1009. doi: 10.1111/jawr.12153
Rousseaux, C., and Gregg, W. (2014). Interannual variation in phytoplankton primary production at a global scale. Remote Sens. 6, 1–19. doi: 10.3390/rs6010001
Royer, T. V. (2019). Stoichiometry of nitrogen, phosphorus, and silica loads in the Mississippi-Atchafalaya River basin reveals spatial and temporal patterns in risk for cyanobacterial blooms. Limnol. Oceanogr. doi: 10.1002/lno.11300
Schelske, C. L., and Stoermer, E. F. (1971). Eutrophication, silica depletion, and predicted changes in algal quality in lake Michigan. Sci. N. Ser. 173, 423–424. doi: 10.1126/science.173.3995.423
Schoelynck, J., Bal, K., Backx, H., Okruszko, T., Meire, P., and Struyf, E. (2010). Silica uptake in aquatic and wetland macrophytes: a strategic choice between silica, lignin and cellulose? N. Phytol. 186, 385–391. doi: 10.1111/j.1469-8137.2009.03176.x
Schoelynck, J., Bal, K., Puijalon, S., Meire, P., and Struyf, E. (2012). Hydrodynamically mediated macrophyte silica dynamics. Plant Biol. 14, 997–1005. doi: 10.1111/j.1438-8677.2012.00583.x
Schweitzer, P. N. (2011). Combined geologic map data for the conterminous US derived from the USGS state geologic map compilation. Available online at: https://mrdata.usgs.gov/geology/state
Smayda, T. J. (1990). Novel and nuisance phytoplankton blooms in the sea: evidence for a global epidemic. Toxic Mar. Plankton 40, 29–40.
Smith, V. H., Tilman, G. D., and Nekola, J. C. (1999). Eutrophication: impacts of excess nutrient inputs on freshwater, marine, and terrestrial ecosystems. Environ. Poll. 100, 179–196. doi: 10.1016/S0269-7491(99)00091-3
Smits, A. P., Ruffing, C. M., Royer, T. V., Appling, A. P., Griffiths, N. A., Bellmore, R., et al. (2019). Detecting signals of large-scale climate phenomena in discharge and nutrient loads in the mississippi-atchafalaya river basin. Geophys. Res. Lett. 46, 3791–3801. doi: 10.1029/2018GL081166
Soballe, D. M., and Fischer, J. R. (2004). Long Term Resource Monitoring Program Procedures: Water Quality Monitoring. U.S. Geological Survey.
Sparks, R. E., Nelson, J. C., and Yin, Y. (1998). Naturalization of the flood regime in regulated rivers: the case of the upper Mississippi River. BioScience 48, 706–720. doi: 10.2307/1313334
Sterner, R. W., Andersen, T., Elser, J. J., Hessen, D. O., Hood, J. M., McCauley, E., et al. (2008). Scale-dependent carbon: nitrogen: phosphorus seston stoichiometry in marine and freshwaters. Limnol. Oceanogr. 53:1169. doi: 10.4319/lo.2008.53.3.1169
Struyf, E., and Conley, D. J. (2012). Emerging understanding of the ecosystem silica filter. Biogeochemistry 107, 9–18. doi: 10.1007/s10533-011-9590-2
Struyf, E., Smis, A., Van Damme, S., Garnier, J., Govers, G., Van Wesemael, B., et al. (2010). Historical land use change has lowered terrestrial silica mobilization. Nat. Commun. 1:129. doi: 10.1038/ncomms1128
Taylor, N. J. (1985). Silica incorporation in the diatom Cosinodiscus granii as affected by light intensity. Bri. Phycol. J. 20, 365–374. doi: 10.1080/00071618500650371
Tranvik, L. J., Downing, J. A., Cotner, J. B., Loiselle, S. A., Striegl, R. G., Ballatore, T. J., et al. (2009). Lakes and reservoirs as regulators of carbon cycling and climate. Limnol. Oceanogr. 54, 2298–2314. doi: 10.4319/lo.2009.54.6_part_2.2298
Tréguer, P. J., and De La Rocha, C. L. (2013). The world ocean silica cycle. Ann. Rev. Mar. Sci. 5, 477–501. doi: 10.1146/annurev-marine-121211-172346
Turner, R. E., Qureshi, N., Rabalais, N. N., Dortch, Q., Justic, D., Shaw, R. F., et al. (1998). Fluctuating silicate:nitrate ratios and coastal plankton food webs. Proc. Natl. Acad. Sci. U.S.A. 95, 13048–13051. doi: 10.1073/pnas.95.22.13048
van Bennekom, A. J., and Salomons, W. (1980). “Pathways of nutrients and organic matter from land to ocean through rivers,” in River Inputs to Ocean Systems ed J. M. Martin, J. D. Burton, D. Eisma (UNSCO-UNEP), 33-51.
Van Meter, K. J., Van Cappellen, P., and Basu, N. B. (2018). Legacy nitrogen may prevent achievement of water quality goals in the Gulf of Mexico. Science 360, 427–430. doi: 10.1126/science.aar4462
Vander Linden, C., and Delvaux, B. (2019). The weathering stage of tropical soils affects the soil-plant cycle of silicon, but depending on land use. Geoderma 351, 209–220. doi: 10.1016/j.geoderma.2019.05.033
Vandevenne, F., Struyf, E., Clymans, W., and Meire, P. (2012). Agricultural silica harvest: have humans created a new loop in the global silica cycle? Front. Ecol. Environ. 10, 243–248. doi: 10.1890/110046
Warton, D. I., and Weber, N. C. (2002). Common slope tests for bivariate errors-in-variables models. Biometr. J. 44, 161–174. doi: 10.1002/1521-4036(200203)44:2<161::AID-BIMJ161>3.0.CO;2-N
Warton, D. I., Wright, I. J., Falster, D. S., and Westoby, M. (2006). Bivariate line-fitting methods for allometry. Biol. Rev. 81, 259–291. doi: 10.1017/S1464793106007007
Wilcox, D. B. (1993). An Aquatic Habitat Classification System for the Upper Mississippi River System. U.S. Fish and Wildlife Service.
Keywords: silica, river, residence time, nutrients, land cover, Mississippi river, ecological stoichiometry, biogeochemistry
Citation: Carey JC, Jankowski K, Julian P II, Sethna LR, Thomas PK and Rohweder J (2019) Exploring Silica Stoichiometry on a Large Floodplain Riverscape. Front. Ecol. Evol. 7:346. doi: 10.3389/fevo.2019.00346
Received: 22 July 2019; Accepted: 29 August 2019;
Published: 25 September 2019.
Edited by:
Michelle Evans-White, University of Arkansas, United StatesReviewed by:
Walter Dodds, Kansas State University, United StatesMichael J. Vanni, Miami University, United States
Dag O. Hessen, University of Oslo, Norway
Copyright © 2019 Carey, Jankowski, Julian, Sethna, Thomas and Rohweder. This is an open-access article distributed under the terms of the Creative Commons Attribution License (CC BY). The use, distribution or reproduction in other forums is permitted, provided the original author(s) and the copyright owner(s) are credited and that the original publication in this journal is cited, in accordance with accepted academic practice. No use, distribution or reproduction is permitted which does not comply with these terms.
*Correspondence: Joanna C. Carey, amNhcmV5QGJhYnNvbi5lZHU=
†The preparation and creation of this manuscript was a strong collaborative effort and these authors have contributed equally to this work, with authors ordered alphabetically