 Orley R. Taylor Jr.
 John M. Pleasants
 Ralph Grundel
 Samuel D. Pecoraro
 James P. Lovett
 Ann Ryan4
- 1Department of Ecology and Evolutionary Biology, University of Kansas, Lawrence, KS, United States
- 2Department of Ecology, Evolution and Organismal Biology, Iowa State University, Ames, IA, United States
- 3U.S. Geological Survey, Great Lakes Science Center, Chesterton, IN, United States
- 4Monarch Watch, Kansas Biological Survey, University of Kansas, Lawrence, KS, United States
The decline in the eastern North American population of the monarch butterfly population since the late 1990s has been attributed to the loss of milkweed during the summer breeding season and the consequent reduction in the size of the summer population that migrates to central Mexico to overwinter (milkweed limitation hypothesis). However, in some studies the size of the summer population was not found to decline and was not correlated with the size of the overwintering population. The authors of these studies concluded that milkweed limitation could not explain the overwintering population decline. They hypothesized that increased mortality during fall migration was responsible (migration mortality hypothesis). We used data from the long-term monarch tagging program, managed by Monarch Watch, to examine three predictions of the migration mortality hypothesis: (1) that the summer population size is not correlated with the overwintering population size, (2) that migration success is the main determinant of overwintering population size, and (3) that migration success has declined over the last two decades. As an index of the summer population size, we used the number of wild-caught migrating individuals tagged in the U.S. Midwest from 1998 to 2015. As an index of migration success we used the recovery rate of Midwest tagged individuals in Mexico. With regard to the three predictions: (1) the number of tagged individuals in the Midwest, explained 74% of the variation in the size of the overwintering population. Other measures of summer population size were also correlated with overwintering population size. Thus, there is no disconnection between late summer and winter population sizes. (2) Migration success was not significantly correlated with overwintering population size, and (3) migration success did not decrease during this period. Migration success was correlated with the level of greenness of the area in the southern U.S. used for nectar by migrating butterflies. Thus, the main determinant of yearly variation in overwintering population size is summer population size with migration success being a minor determinant. Consequently, increasing milkweed habitat, which has the potential of increasing the summer monarch population, is the conservation measure that will have the greatest impact.
Introduction
Since the late 1990s, the monarch butterfly, Danaus plexippus, population has declined significantly based on measurements made at the Mexican overwintering grounds (Brower et al., 2011; Semmens et al., 2016). Identifying the cause or causes of the decline is important in order to focus conservation measures appropriately. Two explanations for the decline in the size of the overwintering population dominate the literature. The first, known as the “milkweed limitation” hypothesis, posits that the decline in the number of milkweed host plants in the major summer breeding area in the Upper Midwest of the U.S. (Figure 1) has led to a reduction in the size of the migratory population (Pleasants et al., 2017). The second, known as the “migration mortality” hypothesis, posits that the resources and conditions during the fall migration have declined resulting in an increase in mortality during the migration and a decline in the overwintering population (Agrawal and Inamine, 2018).
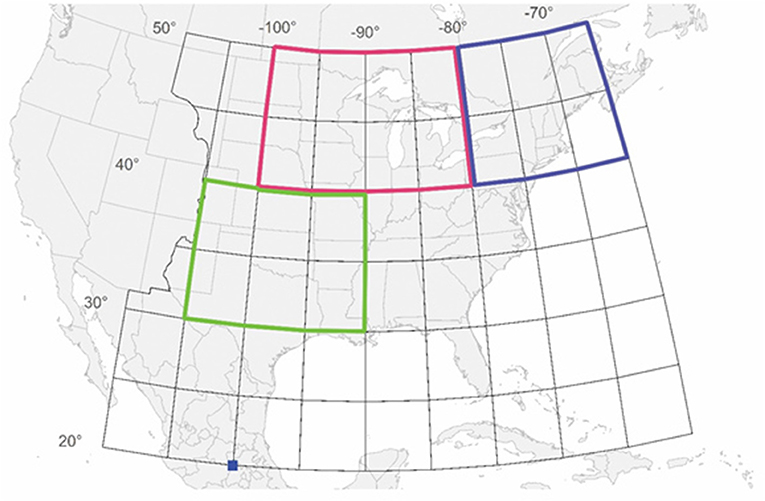
Figure 1. All wild-caught butterflies tagged from north of 40° latitude and east of 100° longitude were included in the study. This area includes the region we are calling the Midwest, encompassing the area from 40 to 50° latitude and 80 to 100° longitude (outlined in red) and the region we are calling the Northeast, encompassing the area from 40 to 50° latitude and 65 to 80° longitude (outlined in blue). What we are calling the Total Area is the Midwest and Northeast combined. The NDVI values (Saunders et al., 2019) come from the region that encompasses the area from 30 to 40° latitude and 90 to 105° longitude (outlined in green). The dark blue square indicates the location of the overwintering colonies. Butterflies were tagged in other sectors besides the Midwest and Northeast but those data are not included in this study.
The milkweed limitation hypothesis is supported by data showing that in the early 2000s the majority of monarch production came from common milkweed, Asclepias syriaca, in corn and soybean fields in the Midwest (Oberhauser et al., 2001) and that the abundance of those milkweeds declined precipitously due to glyphosate herbicide use in those fields (Pleasants and Oberhauser, 2013; Flockhart et al., 2015; Pleasants et al., 2017; Thogmartin et al., 2017a; Saunders et al., 2018). The loss of the milkweeds from corn and soybean fields began in the late 1990s with the adoption of glyphosate-tolerant crops. Milkweeds had been nearly eliminated from these fields by 2006 (Pleasants, 2017). During this period, an estimated 71% of the monarch production potential of milkweeds on the Midwest landscape was eliminated, amounting to 25 million hectares of agricultural habitat that no longer had milkweeds (Pleasants, 2017). The subsequent decrease in the availability of milkweed is thought to have limited the size of the summer breeding population. Support for this hypothesis comes from the pattern of decline in milkweed availability that parallels the decline in the size of the overwintering population (Pleasants et al., 2017). Further support comes from the strong correlation between yearly late summer Midwest monarch egg production and yearly overwintering population size (Pleasants and Oberhauser, 2013; Pleasants et al., 2017).
The migration mortality hypothesis was proposed to explain the results of studies that found a disconnection between monarch numbers measured during the summer and early fall and the size of the overwintering population, and no decline in the summer population in contrast to the decline in the overwintering population (Davis, 2012; Davis and Dyer, 2015; Ries et al., 2015a,b; Inamine et al., 2016; Agrawal and Inamine, 2018). Other studies found no correlation between the size of the migratory population passing through prominent peninsular points and the size of the overwintering population (Badgett and Davis, 2015; but see Crewe and McCracken, 2015). These observations led to the presumption that there had to be another explanation for the monarch overwintering population decline, and these authors proposed an alternative hypothesis. The migration mortality hypothesis states that mortality during the fall migration has a significant effect on monarch numbers, accounts for much of the year to year variation in overwintering numbers, and is an important contributor to the long-term decline of the monarch population. The possible causes of migration mortality include degradation of habitat for nectar resources needed during migration, increased parasite load, and road kills (Agrawal and Inamine, 2018). Support for this hypothesis requires data showing that these potential mortality factors have increased during the period of monarch decline. However, those mortality factors that have been examined to date show no increase. Saunders et al. (2019) found that parasite load had not increased over time. They did find that the greenness of Texas and the surrounding region in the fall, thought to be an important nectaring area for migration success, explained some of the variation in overwintering population size but had not declined over time. Despite the lack of supporting evidence, the migration mortality hypothesis has continued to be posited as a possible explanation for the monarch decline (Agrawal, 2019; Popkin, 2020). This assertion has created some uncertainty with regard to the value of the extensive monarch conservation efforts focused on establishing more milkweed habitat (Thogmartin et al., 2017b).
Besides testing the migration mortality hypothesis indirectly by examining the changes in factors that might affect migration success, as done by Saunders et al. (2019), the hypothesis could be tested directly by examining changes in migration success over time. Here we examine migration success using the probability that a butterfly tagged during migration will be recovered in Mexico (recovery rate). Migrating monarch butterflies have been tagged since 1992 by >10,000 citizen scientists through the Monarch Watch1 (MW) program. Tagging is conducted from August 1 to November 15 throughout the eastern monarch population range (Supplementary Figure 1). Tag recoveries are made by guides and residents in Mexico who search for tagged butterflies among those that have died beneath the colonies or along the trails in the oyamel fir forests. MW representatives visit the overwintering sites each season to acquire these recovered tags. From its inception to the present, this program has tagged over 1.8 million monarchs with more than 18,000 tags recovered in Mexico. In this paper, we test the migration mortality hypotheses using a subset of these data, the tagging and recovery data from 1998 to 2015 (about 1.4 million tagged individuals and about 14,000 tag recoveries in Mexico).
To determine whether there is support for the migration mortality hypothesis using the tagging data, we addressed the following questions:
(1) Is there is a disconnection between the size of the summer population and the size of the overwintering population as the migration mortality hypothesis presumes? To examine this question we used the number of tagged individuals as a measure of the summer population size. When comparing number tagged with overwintering population size, we have considered the total number tagged but have also subdivided the total tagged individuals into those tagged in the Midwest and those tagged in the Northeast (Figure 1). The Midwest has been identified as the major source of monarchs in the overwintering population (Wassenaar and Hobson, 1998; Flockhart et al., 2017). Butterflies from the Midwest use the Central Flyway during fall migration whereas those from the Northeast use the Atlantic or Eastern Flyway (Howard and Davis, 2009). We have analyzed migration success for the Midwest and Northeast separately because it is possible that migration mortality might have changed in different ways according to which flyway is used.
(2) Is migration success the main determinant of overwintering population size? We used the tag recovery rate as an index of migration success and examined its correlation with overwintering population size. We also examined the contribution of migration success to overwintering population size after accounting for the effect of the size of the summer population.
(3) Has migration success declined over the last two decades? We examined whether there was a trend in annual migration success for the Midwest and Northeast regions. We also examined whether annual migration success was related to the greenness of the Southwest region used by migrating monarchs for nectar resources (Figure 1).
Methods
Tagging
Monarch tagging kits are issued by Monarch Watch to volunteers broadly distributed east of the Rocky Mountains in the U.S. and Canada each August-September (Supplementary Figure 1). The number of tags distributed to each participant or group is recorded. Tags are applied to migratory monarchs during a 3-months period from early August into November. The circular tags (diameter 9 mm) are applied to the discal cell on the underside of a hindwing, a location close to the center of lift and gravity of the butterfly. The mass of the tags (10 mg) is about a 2% of the mass of an average monarch and tags are unlikely to affect flight performance. Tagging data are sent to MW as a digital or hard copy. The date, location and identity of the person tagging each butterfly is logged into a database. Additional information gathered includes the sex of each butterfly, and starting in 2004, whether the butterfly was wild-caught or reared in captivity and released. Each tag bears an individual code and the codes of recovered monarchs are matched to the person and the data on returned data sheets.
As an index of summer population size, we used the number of individuals that were tagged north of 40° latitude north and east of 100° longitude west (Figure 1). This region includes the primary production area for monarchs (Flockhart et al., 2017). Although some individuals south of 40° latitude were tagged, our goal was to estimate the size of the summer population before significant migration mortality had occurred so these data were not included.
To determine whether tagging effort might have changed over the last two decades, we examined the number of tags distributed every year. The number of tags distributed could be a measure of the level of interest and possible effort volunteers put into tagging.
The butterflies tagged each year include individuals that were caught and tagged while migrating and individuals reared to adulthood from eggs or larvae found on milkweeds and tagged and released. While both the number of wild-caught and reared individuals may reflect the size of the summer population, our analysis is limited to wild-caught monarchs since the data show that reared monarchs have a lower recovery rate than their wild counterparts (Steffy, 2015). Beginning in 2004 volunteers were asked to record whether the butterflies were wild-caught or reared. For butterflies tagged before 2004, we estimated the proportion of those tagged that were reared using the procedure described in Supplementary Appendix 1 and adjusted the number tagged to approximate only wild-caught individuals. Although the MW tagging program began in 1992, the current tagging system including protocols and a program for purchasing recovered tags did not become well-established until 1998. Hence, the focus on data from 1998 to 2015. Because it may take several years before all of the recovered tags from a particular year are returned to MW, data beyond the year 2015 have not been included.
We have examined migration success of butterflies tagged in the Midwest and the Northeast separately. The region we are calling the Midwest encompasses the area from 40 to 50° latitude north and 80 to 100° longitude west (Figure 1). This region corresponds to the Midwest plus Northwest and most of North Central as defined by Flockhart et al. (2017) and the Midwest as defined by Agrawal and Inamine (2018) and the North Central plus mid-Central regions of Stenoien et al. (2015). The region we are calling the Northeast encompasses the area from 65 to 80° longitude north and 40 to 50° latitude west (Figure 1). This region corresponds to that defined as the Northeast by Flockhart et al. (2017) and Agrawal and Inamine (2018) and the Mideast plus Northeast regions defined by Stenoien et al. (2015). The Total area is the combination of the Midwest and Northeast regions.
Other measures of the size of the summer population exist so we examined the correlation between those measures and the number tagged. The number of tagged butterflies was compared with the Midwest NABA (North American Butterfly Association—www.naba.org) summer butterfly counts and an index of Midwest monarch egg production. NABA counts were obtained from Saunders et al. (2019). These are midsummer counts of adults that will produce the generation that migrates to Mexico. As an index of egg production, we used the average maximum number of eggs per stem for each year obtained from the Monarch Larva Monitoring Project (MLMP2). These eggs will produce the adults that will migrate to Mexico. Because both NABA counts and eggs per stem data did not include sampling in agricultural fields, in comparing these data with number of butterflies tagged we only used data from 2006 to 2015 to avoid the sampling bias in NABA counts and eggs per stem for the period before 2006 (Pleasants, 2017; Pleasants et al., 2017; and see Discussion).
Tag Recovery
Monarchs usually begin arriving at the overwintering sites in the last days of October and conspicuous colonies form by mid-November (Monarch Watch, 2019). Tags are recovered from dead monarchs found beneath the colonies by guides and ejido (local community) members throughout the winter months. To reward their search efforts, MW representatives purchase the recovered tags from guides and residents in late winter each year. People with tags save them in the hope that they will be present when MW representatives arrive to buy tags. Some residents hold on to tags for many years. These delays in connecting sellers with buyers means that it may take 3–4 years before there is a nearly complete picture of recoveries for any given year. While MW representatives purchase tags from people living near most of the colonies open to the public, over 80% of the tags are obtained from the site of the largest colony, El Rosario, with the majority of the remainder obtained from Cerro Pelon and Sierra Chincua, all sites within the State of Michoacan, Mexico (Figure 1).
The recovery rate for any particular year is calculated as the number of tags recovered divided by the number of butterflies tagged. Note that this is not the same as mark-recapture; the number of untagged butterflies encountered while searching for tagged one is not counted. The recovery rate is the product of three factors, (1) the probability that a tagged butterfly will arrive in Mexico (migration success), (2) the probability that a tagged butterfly will die while in Mexico (overwinter mortality), and (3) the probability that someone will find that tagged dead butterfly (detection probability). Each of the probabilities that make up recovery rate may vary over the years for a variety of reasons. We are most interested in the variation in migration success over the years. To use recovery rate as a measure of migration success, we assumed that the annual variation in overwinter mortality and detection probability was random with respect to migration success and to year. Because the migration mortality hypothesis posits that migration success has declined substantially, such a trend should be apparent in the recovery rate despite random variation in overwinter mortality and detection probability.
The detection probability may vary due to seasonal changes as monarchs seek water or colonies shift in location which can result in off-site mortality where tags are not likely to be found. Other site issues that affect detection include the density of the understory, with denser cover limiting the ability to spot tags. There are also human factors involved in detection, such as the accessibility of the colonies to the searchers, the shifting population of searchers due to the turnover in guides, the overall number of searchers and the economic conditions that motivate the searchers. We have no quantitative or anecdotal information suggesting that any of these factors might have changed over time so we have assumed that variation in detection is random.
Overwinter mortality varies from year to year due to predation by birds and mice, and open canopies that contribute to greater exposure and mortality (Calvert et al., 1979; Glendinning et al., 1988; Brower, 1996; Brower et al., 2004). Mortality due to predation and exposure to average winter conditions are treated as normal mortality in our analysis. We do not have direct measures of normal overwinter mortality but shrinkage in the size of the colonies over time, which may be related to mortality, appears to be similar among years (Vidal and Rendón-Salinas, 2014). So, we have assumed the annual variation in normal overwinter mortality to be random.
However, there were 3 years in the data set when the assumption of normal overwinter mortality was not met. Major winter storms resulted in mass mortality in 2002, 2004, and 2016. These storms occurred after the colony sizes had been measured and affected recovery rates for the 2001, 2003, and 2015 populations. Approximately 70% mortality was estimated for the 2001 and 2003 populations and 40% mortality for the 2015 population as a result of the winter storms (Brower et al., 2004, 2017; Taylor, 2004). Mass mortality events create a larger pool of dead butterflies from which recoveries are made. Consequently, the recovery rates were substantially higher for these years and cannot be compared to the recovery rates for years with normal mortality. We have excluded the data for these years from the analysis of yearly changes in recovery rate.
We tested the migration mortality hypothesis three ways using tag recovery rates. (1) We examined the correlation between recovery rate and the size of the overwintering population. This hypothesis posits that migration success rather than the size of the summer population will be correlated with overwintering numbers. (2) We examined the extent to which recovery rate could explain overwintering population size after accounting for the effect of summer population size. We tested the model that (overwintering hectares) = (summer population size) × (recovery rate). Taking the log of these variables results in log (overwintering hectares) = log (summer population size) + log (recovery rate). This approach allows the variables to be used in a multiple regression. (3) In addition, we examined the trend in recovery rate over the period from 1998 to 2014 to determine if there had been a decline in migration success that would account for the decline in the size of the overwintering population.
Since migration success depends on acquiring sufficient lipid stores for the journey to Mexico and overwintering, the areas in Oklahoma and Texas that provide nectar resources to migrating butterflies are important (Brower et al., 2015). Autumn greenness based on satellite imagery can be a proxy for nectar plant availability. Saunders et al. (2019) examined the NDVI (Normalized Difference Vegetation Index) for the region indicated in Figure 1 for the period September 15–October 15 as a measure of nectar availability. They found a correlation between NDVI and overwintering population size after accounting for the role of the size of the summer population. We examined the correlation between NDVI for this region and recovery rate. NDVI values from 2000 to 2014 were obtained from Saunders et al. (2019).
All variables were log10 transformed before statistical analyses. Relationships among variables were analyzed using regression procedures in the Data Analysis package of Excel3 and JMP (SAS)4.
Results
Number Tagged
Comparison With Overwintering Population Size
The first test of the migration mortality hypothesis is to examine whether the size of the summer population is correlated with the size of the overwintering population; the hypothesis presumes that it does not. We used the number of monarchs tagged within the summer breeding region as an indicator of late summer population size. The number of monarchs tagged in the Midwest and Northeast portions of the geographic sectors north of 40° latitude north and east of 100° longitude west (Figure 1) are shown in Table 1 for each year from 1998 to 2015. To determine how well the number of tagged individuals explained the variation in overwintering numbers, we subdivided the analyses by Midwest, Northeast and Total area (Midwest plus Northeast). We compared regressions using the Total tagged and Midwest and Northeast tagged alone (Supplementary Table 1). Based on the lowest AIC value, log Total number tagged was the best predictor of overwintering hectares. However, log Midwest tagged was a close second. Because we wished to compare number tagged as a measure of population size to other population size measures that are Midwest-based, we focused on the number tagged in the Midwest. The number tagged in the Midwest alone explained 74% of the variation in overwintering hectares (Supplementary Table 1 and Figure 2). The number tagged in the Northeast was somewhat less strongly correlated with overwintering hectares (Table 2 and Figure 2). The number tagged in the Midwest was correlated with the number tagged in the Northeast (Table 2). The number of individuals tagged in the Midwest and Northeast both declined over the period from 1998 to 2015 as did the overwintering hectares (Table 2).
Table 1. The number of wild-caught tagged monarchs for all geographic sectors north from 40 to 50° latitude and east from 100 to 65° longitude and the numbers tagged for the Midwest and Northeast portions of that region (see Figure 1).
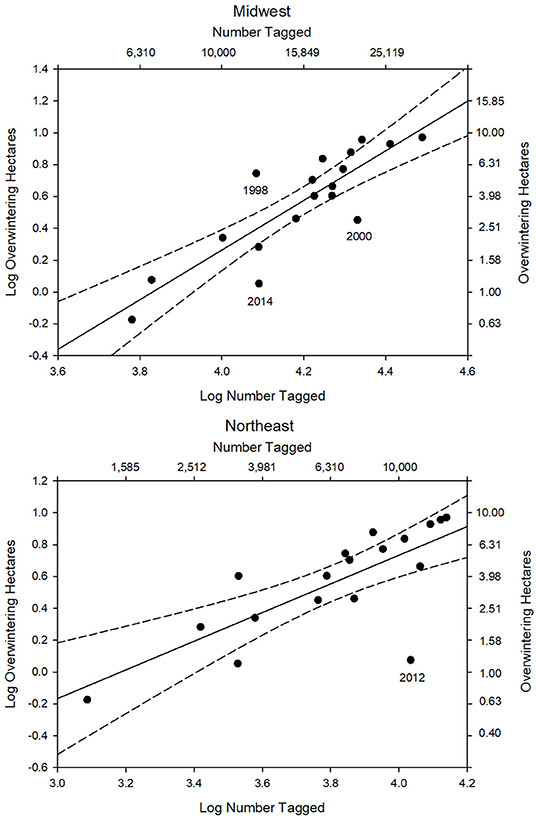
Figure 2. Number of tagged individuals in the Midwest and Northeast (log) from 1998 to 2015 vs. overwintering population size (log hectares). For the Midwest R2 = 0.74, p < 0.0001, n = 18 (log OW ha = −5.98 + 1.56 log MW tag). For the Northeast R2 = 0.58, p < 0.001, n = 18 (log OW ha = −2.87 + 0.90 log NE tag). 95% confidence intervals shown.
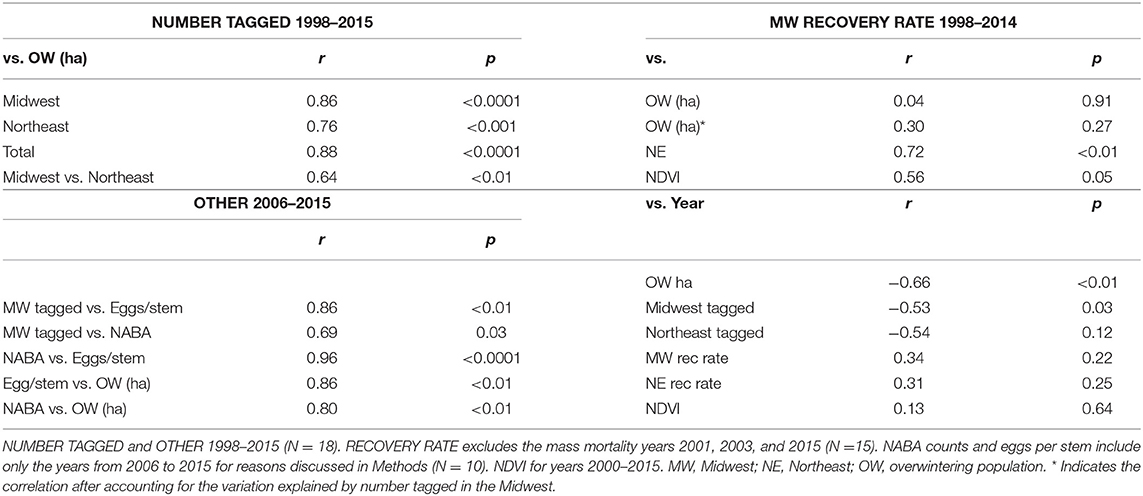
Table 2. Summary of correlations and probabilities.
Two other measures of summer population size, Midwest monarch egg production and Midwest NABA butterfly counts, are shown in Table 1. The number tagged in the Midwest was highly correlated with Midwest late summer egg production and also correlated with midsummer NABA counts for the years from 2006 to 2015 (Table 2). NABA counts and eggs per stem were highly correlated with each other (Table 2). Egg production and NABA counts were also correlated with the overwintering population size (Table 2). Thus, three independent measures of summer population size: number tagged, NABA counts, and eggs per stem, were correlated with each other and correlated with the size of the overwintering population. This result is contrary to the prediction of the migration mortality hypothesis.
Recovery Rate
Relation to Overwintering Population Size and Change Over Years
Another test of the migration mortality hypothesis is to examine whether migration success, as measured by tag recovery rate, is correlated with overwintering population size and whether it has declined over time. The numbers of tags recovered each year in the Midwest and Northeast and these two regions combined (Total) are shown in Table 3. The recovery rate for the Midwest was used in these analyses because this region has been shown to be the core area for monarch production (Flockhart et al., 2015) and because the number tagged in the Midwest was a good predictor of overwinter population size. For the analysis of recovery rates, the mass mortality years, 2001, 2003, and 2015 were not included for reasons explained in Methods. Midwest recovery rate was not correlated with overwintering population size (Table 2 and Supplementary Table 1).
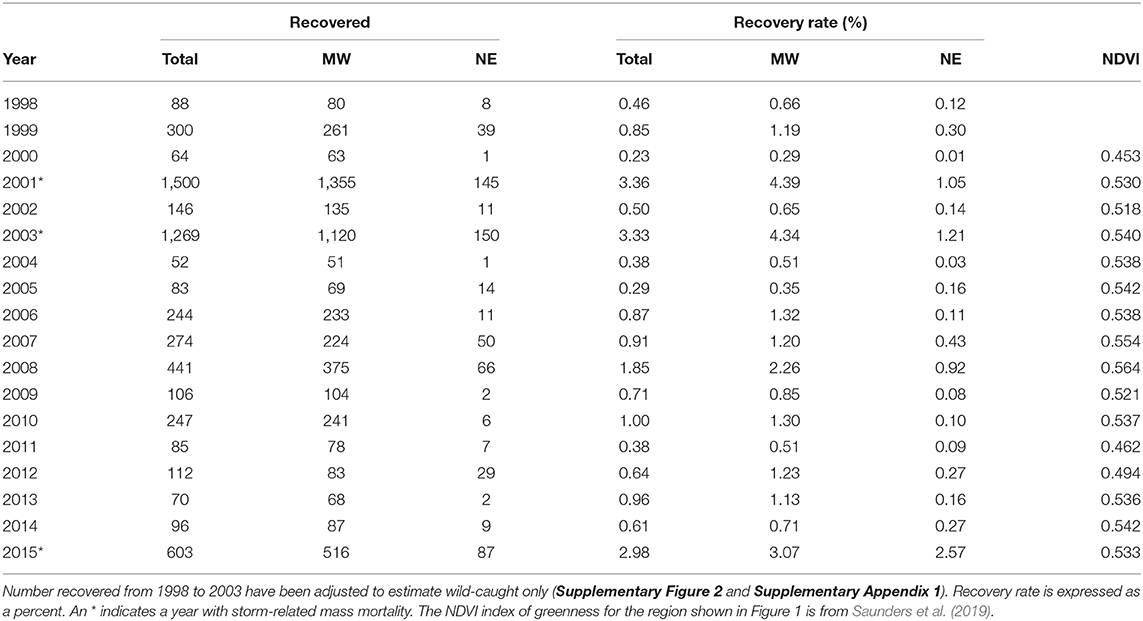
Table 3. The number of recoveries and recovery rates for wild-caught butterflies for the total monarch range north from 40 to 50° latitude and east from 100 to 65° longitude and for the Midwest and Northeast (see Figure 1).
Although the size of the late summer population explained a large amount of the annual variation in the size of the overwinter population, it is possible that some of the variation in overwinter population size is due to annual variation in migration success. To examine this possibility, we ran a multiple regression using Midwest tagging numbers and Midwest recovery rates (Supplementary Table 1). The equation for the regression of log MW Number Tagged and log MW Recovery Rate on log Overwintering Hectares (OW) was: log OW = −6.3127 + 1.6466 log MW Number Tagged + 0.2461 log MW Recovery Rate (F2, 12 = 15.5268, p = 0.0005, R2, adjusted = 0.6748). The standardized regression coefficients (src) were 0.8602 for log MW Number Tagged and 0.1772 for log MW Recovery Rate. The square of each standard regression coefficient, indicates the amount of variation explained by each variable. Src2 was 0.74 (p = 0.0001) for log MW Number Tagged and 0.03 (p = 0.2739) for log MW Recovery Rate, indicating that log Number Tagged accounted for about 74% of the variation in log OW while log Recovery Rate accounted for about 3%.
There was no decline in the tag recovery rate over the period 1998–2014 for either the Midwest or the Northeast (Table 2 and Figure 3). The recovery rates for the Midwest were correlated with the recovery rates for the Northeast (Table 2).
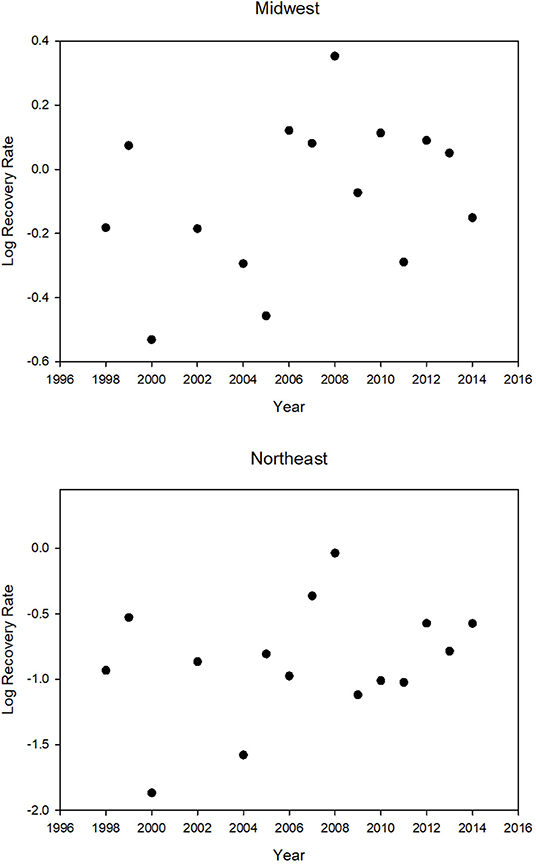
Figure 3. Tag recovery rate (percent) for the Midwest and the Northeast for different years (N = 15). The years 2001, 2003, and 2015 were excluded because a major winter mortality event in those years greatly increased the recovery rate. There is no significant trend in recovery rate. Log MW rec. rate = −31.84 + 0.016 year (R2 = 0.11, p = 0.22), Log NE rec. rate = −56.33 + 0.028 year (R2 = 0.10, p = 0.25). Note that the graphs have different scales for recovery rate; Northeast recovery rates are always lower.
Correlates of the Recovery Rate
The recovery rates for the Midwest were correlated with yearly values for NDVI, an index of greenness of the region that provides nectar for migrating butterflies (Table 2). The year 2000, which had the lowest recovery rate, had the lowest NDVI value, and the year 2008, which had the highest recovery rate, had the highest NDVI value (Table 3 and Figure 3).
We also examined whether NDVI itself, could explain any of the annual variation in overwintering hectares (Supplementary Table 1). The standardized regression coefficients (src) were 0.8917 for log MW Number Tagged and 0.1668 for log MW NDVI. Src2 was 0.80 (p < 0.0001) for log MW Number Tagged and 0.03 (p = 0.16) for log MW NDVI, indicating that log Number Tagged accounted for about 80% of the variation in log OW while log NDVI accounted for about 3%. While NDVI is correlated with migration success, just like migration success itself, there was no decline in NDVI from 2000 to 2015 (Table 2).
The yearly recovery rates for butterflies from the Northeast were correlated with those from the Midwest (Table 2) but consistently lower (Table 3 and Figure 3). The recovery rate for all the normal mortality years 1998–2014 combined was 0.94% for those tagged in the Midwest and 0.24% for those tagged in the Northeast (Supplementary Table 2). Thus, the average recovery rate for the Midwest was 3.93 times greater than for the Northeast (Supplementary Table 2). For the mass mortality years 2001 and 2003, the ratio of Midwest to Northeast recovery rates were similar to that of all normal mortality years (4.18 and 3.58) but, for the mass mortality year 2015, the recovery rate for the Midwest was not that much greater than for the Northeast (1.19) (Supplementary Table 2). For normal and mass mortality years combined, the recovery rate for the Midwest was 3.65 times that for the Northeast (Supplementary Table 2). Thus, a tagged butterfly from the Midwest was about 4 times more likely to be recovered than a tagged butterfly from the Northeast. Of the butterflies recovered in Mexico from the region above 40° latitude, 89% came from the Midwest with 11% coming from the Northeast. These percentages contrast to those for number tagged with 69% from the Midwest and 31% from the Northeast.
Discussion
Number Tagged
Comparison of Number Tagged and Overwintering Population Size
The migration mortality hypothesis presumes that the size of the summer population in the U.S. Midwest is not correlated with the size of the overwintering population in Mexico. We found that the number of monarchs tagged each season in the Midwest was highly correlated with the size of the overwintering population as was the number tagged in the Northeast, although not as highly (Table 2). It could be argued that the number of individuals tagged is more a reflection of the size of the migratory population rather than the summer population. As such, number tagged may already have incorporated some degree of migratory failure and thus would be more likely to be correlated with overwinter hectares. We chose to look at number tagged above 40° latitude and east of 100° longitude because this is the prime summer breeding region for monarchs (Flockhart et al., 2017). Individuals tagged in this region are closer to their natal origin than those tagged below 40° latitude. Butterflies tagged above 40° latitude have traveled southwest for at most two 5 × 5 latitude/longitude sectors (Figure 1) before capture and have 4–6 5 × 5 sectors remaining in their journey. Although it is certainly the case that some percentage of individuals leaving from a particular natal origin point will not make it to a tagging point above 40° latitude, the majority of migration mortality has yet to occur. So, the number of butterflies available to be tagged above 40° latitude is similar to the summer population size.
The underlying premise of the migration mortality hypothesis is that there is a lack of correlation between summer and winter population sizes. Studies showing a lack of correlation used summer population estimates based on data sets including the annual butterfly counts by NABA and butterfly counts made in Ohio and in Illinois (Ries et al., 2015a; Inamine et al., 2016; Saunders et al., 2016). However, there are methodological problems with these summer butterfly counts that make them inaccurate measures of population size (Pleasants et al., 2016, 2017). Sampling is limited in geographic scope and time and focuses on the early rather than the late summer population. More significantly, no counts were made in corn and soybean fields in the late 1990s and early 2000s when monarchs and milkweeds were still present in those fields. Surveys made during that period therefore underestimated the actual size of the monarch population. Survey data from after that period do show a correlation with overwintering population size (Crewe et al., 2019; Saunders et al., 2019) as does egg production for the last two decades that incorporates information on milkweed abundance (Pleasants and Oberhauser, 2013; Pleasants et al., 2017). Because migrating butterflies come from all habitats, including corn and soybean fields, the sampling bias seen in butterfly counts in the late 1990s and early 2000s is not an issue.
In comparing eggs per stem and NABA counts with overwintering population size, we were restricted to the years since 2006 to remove the sampling bias for not surveying in agricultural fields. But in comparing number tagged with overwintering population size we can use data for years before 2006 because butterflies during migration have come from all possible habitats, including agricultural fields. For the years 2006–2015, eggs per stem and NABA counts of summer population size were highly correlated with Midwest number tagged counts (Table 3). All three of these measures of summer population size were correlated with overwintering hectares (Table 2). These results are counter to the foundational assertion of the migration mortality hypothesis that the size of the summer breeding population does not predict the size of the overwintering population (Ries et al., 2015a; Inamine et al., 2016; Agrawal and Inamine, 2018). The relationship between summer population numbers and overwintering hectares suggests that factors affecting monarch breeding population development from March through October, rather than migration success, primarily determine overwintering population size. While physical factors, such as weather and spring and summer temperatures are important determinants of population growth each year (Saunders et al., 2016, 2018, 2019; Crewe et al., 2019), there is also strong evidence for the role of milkweed availability (Pleasants and Oberhauser, 2013; Flockhart et al., 2015; Pleasants, 2017; Pleasants et al., 2017).
Tagging data arguably can provide a better picture of the size of the migrating population than counts made at peninsula points where monarchs stop over during migration. Counts made at Cape May, New Jersey and Peninsula Point, Michigan were not correlated with the size of the overwintering population (Davis, 2012; Badgett and Davis, 2015), but Crewe and McCracken (2015) did find a positive correlation between counts and overwintering numbers for Long Point in Ontario. Possible reasons for the lack of correlation between stopover points and overwintering numbers include the issue of double counting when counts are made more than once a day or when monarchs remain at stopover points for multiple days due to weather. Other reasons are discussed in Pleasants et al. (2016).
While we used numbers of butterflies tagged as an indicator of population size, we recognize that it is not a perfect representation of the summer population size. The tagging effort is influenced by weather events that limit tagging and the times when people are available to tag. In addition, there are few people tagging west of 95° longitude an area known to produce a substantial number of monarchs most years (Supplementary Figure 1). High populations are likely to be underestimated by tagging as well since taggers often run out of tags. It is also the case that many taggers only tag during the beginning of the migration, leaving the tail of the migration underrepresented in the tagging records. There was a 27% decline in the number of tags distributed from 1998 to 2015 (Table 1) (R2 = 0.33, p = 0.013). This decline may represent a general loss of interest in tagging, or reduced expectations because of low population size that discouraged tagging. The proportion of tags that are affixed to butterflies reared in captivity has increased (Supplementary Figure 2) possibly reducing the effort to tag wild butterflies. In spite of these limitations, the fact that this index of population size is highly correlated with other measures of summer population size and overwinter population size lends it credibility.
There were 3 years where the number of monarchs tagged in the Midwest was outside the 95% confidence interval in the regression of number tagged vs. overwintering hectares (Figure 2). In the year 2000 Midwest tagging overestimated the size of the overwintering population (Figure 2). The recovery rate for 2000 was the lowest seen (Table 3 and Figure 3) and corresponded to a year when NDVI values were the lowest (Table 3). Thus, in this year, drier than normal conditions in the southern region may have significantly affected migration success and reduced the number of individuals arriving in Mexico relative to what was expected from tagging numbers. The number tagged in the year 2014 also overestimated the size of the overwintering population (Figure 2). Recovery rate and NDVI were not unusual for that year (Table 3). Migration was later than normal in 2014 (Journey North5). Late migrations are associated with low recovery rates (Taylor et al., 2019). It is also possible that there was an increased effort in tagging following the report in 2013 of the lowest overwintering population size ever recorded. In 1998, the number tagged underestimated the size of the overwintering population (Figure 2). The recovery rate was not particularly high that year so higher than normal migration success is probably not the explanation. The number of tags applied was the fifth lowest in the record (Table 1), suggesting that tagging simply underrepresented the size of the migratory population.
In the regression of number tagged in the Northeast vs. overwintering hectares, the year 2012 was an outlier (Figure 2). The number of butterflies tagged in the Northeast in 2012 greatly overestimated the actual overwintering population size. There was an early spring in 2012 (Ault et al., 2013) and monarchs colonized the Northeast earlier than normal (Journey North5). The resulting population in the Northeast, as represented by the monarchs per hour count at Cape May, New Jersey, was the third highest in the 27 years of that program (Cape May Monarch Monitoring Project6). On the other hand, extremely high temperatures in the Midwest, with drought conditions in much of the area (Taylor et al., unpublished data), reduced the 2012 migration in the Midwest and the number tagged in the Midwest to the second lowest total in the record (Table 1).
The number tagged in the Midwest from 1998 to 2015 was correlated with the number tagged in the Northeast with an r value of 0.64 (Table 2). The Midwest and Northeast populations are partially but not completely independent. There is some evidence that the Northeast is colonized by monarchs that were born in the first generation in the Midwest (Miller et al., 2011). But there is also evidence that some of the monarchs colonizing the Northeast have come directly from the Texas generation (Journey North, 2019).
Recovery Rate
Relation to Overwintering Population Size and Change Over Years
Migration success, as measured by recovery rate, was not correlated with overwintering population size (Table 2). Nor did recovery rates decline from 1998 to 2014 (Table 2, Figure 3) as would be expected if migration success was driving the decline in the overwintering population. That said, migration success may play a small role in determining the annual variation overwintering population size. After most of the variation in overwintering population size was accounted for by summer population size, migration success accounted for an additional 3% of the variation. In addition to migration success, recovery rate is a function of overwinter mortality and detection probability. We have no data on the annual variation in those two factors. High levels of variation in those two factors could swamp out changes in migration success. However, the migration mortality hypothesis predicts a substantial decline in migration success which should be detectable despite variation in the other two factors. The fact that there was a significant relationship between recovery rate and NDVI, a factor suspected of affecting migration success, also indicates that variation in these other two factors are insufficient to undermine the use of recovery rate as a measure of migration success.
Other Correlates of the Recovery Rate
Although recovery rates did not decline from 1998 to 2014, they did vary over those years (Figure 3). This variation may be due to a variety of causes, some associated with the conditions during the migration, such as parasite load (Bartel et al., 2011), road kills (Kantola et al., 2019) and nectar availability. However, Saunders et al. (2019) did not find a significant correlation between Ophryocystis elektroscirrha (OE) parasite load and overwintering population size from 2004 to 2015. They also did not find a decline over time in parasite load, suggesting that this factor was not directly involved in the monarch population decline. They did find that the level of greenness along the southern fall migration corridor was correlated with the size of the overwintering population size, after accounting for the role of summer population size. However, they did not find that greenness had decreased over time.
We found that the greenness index, NDVI, was positively correlated with migration success. The lowest NDVI value and the lowest recovery rate was for the year 2000 (Table 3 and Figure 3) and was associated with drought in Texas (drought.gov7). The highest recovery rate observed was in 2008 which had the highest NDVI value (Table 3 and Figure 3). The year 2011, when there was also a drought in Texas (Brower et al., 2015), had the second lowest NDVI and the third lowest recovery rate (Table 3 and Figure 3). The fact that recovery rate is correlated with NDVI, a proxy for nectar availability, which we know to be important for monarch migration success (Brower et al., 2015), lends credibility to the use of recovery rate as a measure of migration success.
In addition to normal overwinter mortality caused by predators, broken wings, exposure or weather conditions, death may also result from inadequate lipid stores obtained during migration (Brower et al., 2015) or neogregarine parasite load that butterflies bring with them (Bartel et al., 2011; Altizer et al., 2015). We considered death due to lipid shortage as add-on mortality. We have to consider the possibility that years with poor migration success may also have increased add-on mortality if butterflies arrive in Mexico with reduced lipid supplies. The recovery rate is based on the product of migration success and overwinter mortality, including add-on mortality. What happens if low migration success is always coupled with high add-on mortality? In a poor migration year, lower migration success will have the effect of decreasing the recovery rate, but add-on mortality will have the effect of increasing the recovery rate. Because of these opposing effects on recovery rate, the question is whether we can compare recovery rates for different years and interpret those differences as differences in migration success. Lipid analysis by Brower et al. (2015) can provide some insight into this question. In 2011, which was a drought year in Texas, they found lower lipid levels in butterflies in Texas than in non-drought years. Surprisingly however, they found that November lipid levels of butterflies at the overwintering sites in Mexico were not lower than in non-drought years. The difference in lipid levels in Texas and Mexico could be due to the acquisition of nectar and lipids as the Texas monarchs continued to the overwintering sites through Northeastern Mexico or selective mortality that eliminated monarchs with low lipid levels. While Brower et al. (2015) did find individuals with low lipid levels in Mexico, their data suggest that the frequency of such individuals, and the amount of add-on mortality that might accrue from it, was no different between drought year and normal years. Thus, add-on mortality and overall migration success may not be interrelated. If this is the case, recovery rates are primarily a measure of migration success.
Overall, the recovery rate for monarchs tagged in the Midwest from 1998 to 2014 was about four times greater than for monarchs tagged in the Northeast. Thus, monarchs tagged in the Midwest have a higher probability of making it to Mexico than monarchs tagged in the Northeast. The greater distances from Northeast locations to Mexico may account for lower recovery rates from that region due to longer flight times and greater mortality. In addition, monarchs from the Northeast using the Eastern flyway appear to take two paths, one along the east coast from Maine to at least South Carolina and an interior path along the Appalachians. Monarchs then move west along the Gulf coast from Florida to Brownsville, Texas (Journey North5). Brindza et al. (2008) found that butterflies tagged in more inland areas of the Northeast were more likely to be recovered than those tagged in coastal areas. Some east coast migrants may also end up in Florida (Vander Zanden et al., 2018). The Central Flyway, used by the butterflies from the Midwest, provides a clear southwest track to the Texas border with Mexico. Differences in recovery rate between the Central Flyway and the Eastern Flyway may also be the result of differences in wind patterns and temperature. Geographic differences in recovery rate on a finer scale are being investigated.
The significant correlation between the recovery rates for the Midwest and Northeast (Table 2) suggests that, although migration success for the Northeast is generally lower than the Midwest, there is an overarching factor that affects both regions similarly. Both Midwest and Northeast monarchs must traverse similar terrain in southern Texas and northeastern Mexico although they may take different routes to get to that point. The correlation between migration success and NDVI suggests that nectar availability in this region affects migration success of all butterflies, no matter their point of origin. In addition, there may be weather related timing delays in migration from 1 year to the next that can affect migration success for both regions.
The recoveries from the 3 years (2001, 2003, and 2015), with mass mortality due to winter storms, were not included in the analysis because the majority of these deaths were decidedly storm related rather than caused by attrition factors occurring in a normal year. Because recovery rate is based on dead butterflies, to use recovery rate as an index of migration success requires the assumption that normal overwinter mortality is a random variable over time. Mass mortality years violate that assumption and are not be included in the temporal analysis. Yet, recoveries in mass mortality years can tell us; (1) that large numbers of tagged monarchs were still alive at the time of these events and (2) that years with normal mortality and mass mortality both provide a random sample of the population, only differing in sample size, as evidenced by the similarity in the ratio of Midwest to Northeast recovery rates between normal and mass mortality years (Supplementary Table 2).
Conclusions
Two competing hypotheses have been offered as the major reason for the decline in the number of monarchs overwintering in Mexico. The milkweed limitation hypothesis is based on data showing a massive loss of milkweeds due to herbicide use in agricultural fields and additional losses due to changes in land use from the expansion of agriculture and development (Lark et al., 2015; Pleasants, 2017; World Wildlife Fund Plowprint Report, 2018). While weather related factors may play an important role in the annual variation in population size, the decreased abundance of milkweeds and the greater dispersion of milkweed patches effectively caps the maximum size the population can attain under favorable conditions (Pleasants, 2017).
In contrast, the migration mortality hypothesis assumes that the amount of habitat is sufficient to support large monarch populations and that milkweeds are not limiting (Ries et al., 2015a,b; Inamine et al., 2016; Agrawal and Inamine, 2018). Rather, based on a perceived disconnection between observed summer monarch populations and overwintering numbers, the advocates of this hypothesis posit that increasing monarch mortality during the migration over the last two decades accounts for the decline in monarch numbers. Using data of about 500,000 wild-caught monarchs tagged from 1998 to 2015 along with 6,000 tag recoveries in Mexico during this period we show that (1) there was no disconnection between late summer and overwintering numbers, (2) the recovery rate of tagged monarchs (migration success) was not correlated with overwintering numbers, and (3) the recovery rate (migration success) had not decreased over time. In sum, none of the expectations of the migration mortality hypothesis were supported by the tagging and recovery data. Although there was no pattern indicating an increase in mortality during the migration, it is clear that low NDVI values, which indicate drought years and low nectar availability, are associated with lower than expected numbers of monarchs reaching the overwintering sites and lower recovery rates. Thus, migration success may determine some of the variation in the overwintering population size, but the main determinant is the size of the summer population.
Given historic, recent and continuing milkweed losses (Pleasants, 2017), and the importance of the Midwest to the overwintering monarch population (Flockhart et al., 2015), the challenge ahead is how to sustain the monarch population. The “all hands-on deck” approach (Thogmartin et al., 2017b) indicated that returning monarch numbers to a mean of 6 hectares of overwinter habitat occupied, a level that could assure survival of the migration given known causes of mortality (Semmens et al., 2016), would require the restoration of 1.4 billion milkweed stems primarily on landscapes in the Midwest. But we should not ignore the benefit to the monarch population that could come from restoring quality nectar habitats for both the migratory and breeding phases of the monarch annual cycle.
Data Availability Statement
All datasets generated for this study are included in the article/Supplementary Material.
Author Contributions
The data for this study came from monarch tagging efforts coordinated and supported by Monarch Watch, under the direction of OT. The data were vetted by JL and AR, and complied and sorted by RG, SP, and JL. Statistical analysis was done by JP and RG. The study was conceived and designed by OT and JP. JP, OT, and RG wrote the manuscript. All authors contributed to the article and approved the submitted version.
Funding
Donations to Monarch Watch were used to pay for recovered tags in Mexico. Funding from the U.S. Geological Survey Ecosystems Mission Area helped support preparation of the Monarch Watch data.
Conflict of Interest
The authors declare that the research was conducted in the absence of any commercial or financial relationships that could be construed as a potential conflict of interest.
Acknowledgments
We were indebted to Diane Pruden, Debbie Jackson, Gail Morris, Tricia Neal, Carol Pasternak, Janis Lentz, Sarah Schmidt, Dana Wilfong, Cathy Walters, Veronica Prida, David Kust and family, and many others who helped purchase and recover tags at the overwintering sites in Mexico. We were most appreciative of the numerous donors who have contributed to the tag recovery fund over the years. Numerous staff members and students have assisted with data managements over the last two decades, and recently, we have been aided by many data entry volunteers. We were indebted as well to the guides and ejido residents who diligently recovered and saved each recovered tag. We wish to thank the tens of thousands of taggers who have so enthusiastically contributed to this project since 1992. Thanks to Eduardo Rendón-Salinas and his crew for their pains-taking efforts to determine the size of the monarch overwintering population every year. Thanks to Sarah Saunders for sharing NDVI data. Thanks to Fan Dai for help with statistical analysis. Thanks to Barbara Pleasants for editing several versions of the manuscript. Any use of trade, product, or firm names is for descriptive purposes only and does not imply endorsement by the U.S. Government.
Supplementary Material
The Supplementary Material for this article can be found online at: https://www.frontiersin.org/articles/10.3389/fevo.2020.00264/full#supplementary-material
Footnotes
References
Agrawal, A. A. (2019). Advances in understanding the long-term population decline of monarch butterflies. Proc. Natl. Acad. Sci. U.S.A. 116, 8093–8095. doi: 10.1073/pnas.1903409116
Agrawal, A. A., and Inamine, H. (2018). Mechanisms behind the monarch's decline: Migratory failure may contribute to the dwindling of this iconic butterfly's population. Science 360, 1294–1296. doi: 10.1126/science.aat5066
Altizer, S., Hobson, K. A., Davis, A. K., De Roode, J. C., and Wassenaar, L. I. (2015). Do healthy monarchs migrate farther? Tracking natal origins of parasitized vs. uninfected monarch butterflies overwintering in Mexico. PLoS ONE 10:e0141371. doi: 10.1371/journal.pone.0141371
Ault, R. T., Henebry, G. M., de Beurs, K. M., Schwartz, M. D., Betancourt, J. L., and Moore, D. (2013). The false spring of 2012, earliest in North American record. Eos Trans. Am. Geophys. Union 94, 181–182. doi: 10.1002/2013EO200001
Badgett, G., and Davis, A. K. (2015). Population trends of monarchs at a northern monitoring site: analyses of 19 years of fall migration. Ann. Entomol. Soc. Am. 108, 700–706. doi: 10.1093/aesa/sav060
Bartel, R. A., Oberhauser, K. S., de Roode, J. C., and Altizer, S. (2011). Monarch butterfly migration and parasite transmission in eastern North America. Ecology 92, 342–351. doi: 10.1890/10-0489.1
Brindza, L. J., Brower, L. P., Davis, A. K., and Van Hook, T. (2008). Comparative success of monarch butterfly migration to overwintering sites in Mexico from inland and coastal sites in Virginia. J. Lepid. Soc. 62, 189–200.
Brower, L. P. (1996). “Forest thinning increases monarch butterfly mortality by altering the microclimate of the overwintering sites in México: decline and conservation of butterflies in Japan III,” in Proceedings of the International Symposium on Butterfly Conservation, 1994, eds S. A. Ae, T. Hirowatari, M. Ishii, and L. P. Brower (Osaka: The Lepidopterological Society of Japan), 33–44.
Brower, L. P., Fink, L. S., Kiphart, R. J., Pocius, V., Zubieta, R. R., and Ramírez, M. I. (2015). “Effect of the 2010–2011 drought on the lipid content of monarchs migrating through Texas to overwintering sites in Mexico,” in Monarchs in a Changing World: Biology and Conservation of an Iconic Butterfly, eds. K. S. Oberhauser, K. R. Nail, and S. Altizer (Ithaca, NY: Cornell University Press), 117–129.
Brower, L. P., Kust, D. R., Rendon-Salinas, E., Garcia-Serrano, E., Kust, K. R., Miller, J., et al. (2004). “Catastrophic winter storm mortality of monarch butterflies in Mexico during January 2002,” in The Monarch Butterfly: Biology & Conservation, eds K. S. Oberhauser and M. J. Solensky (Ithaca, NY: Cornell University Press), 151–166.
Brower, L. P., Taylor, O. R., Williams, E. H., Slayback, D. A., Zubieta, R. R., and Ramíerz, M. I. (2011). Decline of monarch butterflies overwintering in Mexico: is the migratory phenomenon at risk? Insect Conserv. Divers. 5, 95–100. doi: 10.1111/j.1752-4598.2011.00142.x
Brower, L. P., Williams, E. H., Jaramillo-Lopez, P., Kust, D. R., Slayback, D. A., and Ramíerz, M. I. (2017). Butterfly mortality and salvage logging from the March 2016 storm in the Monarch Butterfly Biosphere Reserve in Mexico. Am. Entomol. 63, 151–164. doi: 10.1093/ae/tmx052
Calvert, W. H., Hedrick, L. E., and Brower, L. P. (1979). Mortality of the Monarch Butterfly (Danaus plexippus L.): avian predation at five overwintering sites in Mexico. Science 204:4395. doi: 10.1126/science.204.4395.847
Crewe, T., and McCracken, J. (2015). Long-term trends in the number of monarch butterflies (Lepidoptera: Nymphalidae) counted on fall migration at Long Point, Ontario, Canada (1995–2014). Ann. Entomol. Soc. Am. 108, 707–717. doi: 10.1093/aesa/sav041
Crewe, T. L., Mitchel, G. W., and Larrivée, M. (2019). Size of the Canadian breeding population of monarch butterflies is driven by factors acting during spring migration and recolonization. Front. Ecol. Evol. 7:308. doi: 10.3389/fevo.2019.00308
Davis, A. K. (2012). Are migratory monarchs really declining in eastern North America? Examining evidence from two fall census programs. Insect Conserv. Divers. 5, 101–105. doi: 10.1111/j.1752-4598.2011.00158.x
Davis, A. K., and Dyer, L. A. (2015). Long-term trends in Eastern North American monarch butterflies: a collection of studies focusing on spring, summer, and fall dynamics. Ann. Entomol. Soc. Am. 108, 661–663. doi: 10.1093/aesa/sav070
Flockhart, D. T., Brower, L. P., Ramirez, M. I., Hobson, K. A., Wassenaar, L. I., Altizer, S., et al. (2017). Regional climate on the breeding grounds predicts variation in the natal origin of monarch butterflies overwintering in Mexico over 38 years. Glob. Change Biol. 23, 2565–2576. doi: 10.1111/gcb.1359
Flockhart, D. T. T., Pichancourt, J. B., Norris, D. R., and Martin, T. G. (2015). Unravelling the annual cycle in a migratory animal: breeding-season habitat loss drives population declines of monarch butterflies. J. Anim. Ecol. 84, 155–165. doi: 10.1111/1365-2656.12253
Glendinning, J. L., Mejia, A. A., and Brower, L. P. (1988). Behavioral and ecological interactions of foraging mice (Peromyscus melanotis) with overwintering monarch butterflies (Danaus plexippus) in México. Oecologia 75, 222–227. doi: 10.1007/BF00378602
Howard, E., and Davis, A. K. (2009). The fall migration flyways of monarch butterflies in eastern North America revealed by citizen scientists. J. Insect Conserv. 13, 279–286. doi: 10.1007/s10841-008-9169-y
Inamine, H., Ellner, S. P., Springer, J. P., and Agrawal, A. A. (2016). Linking the continental migratory cycle of the monarch butterfly to understand its population decline. Oikos 125, 1081–1091. doi: 10.1111/oik.03196
Journey North (2019). Available online at: https://journeynorth.org/ (accessed January 15, 2019).
Kantola, T., Tracy, J. L., Baum, K. A., Quinn, M. A., and Coulson, R. N. (2019). Spatial risk assessment of eastern monarch butterfly road mortality during autumn migration within the southern corridor. Biol. Conserv. 231, 150–160. doi: 10.1016/j.biocon.2019.01.008
Lark, T. J., Salmon, J. M., and Gibbs, H. K. (2015). Cropland expansion outpaces agricultural and biofuel policies in the United States. Environ. Res. Lett. 10:044003. doi: 10.1088/1748-9326/10/4/044003
Miller, N. G., Wassenaar, L. I., Hobson, K. A., and Norris, D. R. (2011). Monarch butterflies cross the Appalachians from the west to recolonize the east coast of North America. Biol. Lett. 7, 43–46. doi: 10.1098/rsbl.2010.0525
Monarch Watch (2019). Available online at: https://monarchwatch.org/blog/category/monarch-population-status/ (accessed February 1, 2019).
Oberhauser, K. S., Prysby, M. D., Mattila, H. R., Stanley-Horn, D. E., Sears, M. K., Dively, G., et al. (2001). Temporal and spatial overlap between monarch larvae and corn pollen. Proc. Natl. Acad. Sci. U.S.A. 98, 11913–11918. doi: 10.1073/pnas.211234298
Pleasants, J. (2017). Milkweed restoration in the Midwest for monarch butterfly recovery: estimates of milkweeds lost, milkweeds remaining and milkweeds that must be added to increase the monarch population. Insect Conserv. Divers. 10, 42–53. doi: 10.1111/icad.12198
Pleasants, J. M., and Oberhauser, K. S. (2013). Milkweed loss in agricultural fields because of herbicide use: effect on the monarch butterfly population. Insect Conserv. Divers. 6, 135–144. doi: 10.1111/j.1752-4598.2012.00196.x
Pleasants, J. M., Williams, E. H., Brower, L. P., Oberhauser, K. S., and Taylor, O. R. (2016). Conclusion of no decline in summer monarch population not supported. Ann. Entomol. Soc. Am. 109, 169–171. doi: 10.1093/aesa/sav115
Pleasants, J. M., Zalucki, M. P., Oberhauser, K. S., Brower, L. P., Taylor, O. R., and Thogmartin, W. E. (2017). Interpreting surveys to estimate the size of the monarch butterfly population: pitfalls and prospects. PLoS ONE 12:e0181245. doi: 10.1371/journal.pone.0181245
Popkin, G. (2020). What Is Really Killing Monarch Butterflies? Scientific American. Available online at: https://www.scientificamerican.com/article/what-is-really-killing-monarch-butterflies/
Ries, L., Taron, D. J., and Rendón-Salinas, E. (2015b). The disconnect between summer and winter monarch trends for the eastern migratory population: possible links to differing drivers. Ann. Entomol. Soc. Am. 108, 691–699. doi: 10.1093/aesa/sav055
Ries, L., Taron, D. J., Rendón-Salinas, E., and Oberhauser, K. S. (2015a). “Connecting eastern monarch population dynamics across their migratory cycle,” in Monarchs in a Changing World: Biology and Conservation of an Iconic Butterfly, eds K. S. Oberhauser, K. R. Nail, and S. Altizer (Ithaca, NY: Cornell University Press), 268–281.
Saunders, S. P., Ries, L., Neupane, N., Ramirez, M. I., Garcia-Serrano, E., Rendon-Salinas, E., et al. (2019). Multi-scale seasonal factors drive the size of winter monarch colonies. Proc. Natl. Acad. Sci. U.S.A. 116, 8609–8614. doi: 10.1073/pnas.1805114116
Saunders, S. P., Ries, L., Oberhauser, K. S., Thogmartin, W. E., and Zipkin, E. F. (2018). Local and cross-seasonal associations of climate and land use with abundance of monarch butterflies Danaus plexippus. Ecography 41, 278–290. doi: 10.1111/ecog.02719
Saunders, S. P., Ries, L., Oberhauser, K. S., and Zipkin, E. F. (2016). Evaluating confidence in climate-based predictions of population change in a migratory species. Global Ecol. Biogeogr. 25, 1000–1012. doi: 10.1111/geb.12461
Semmens, B. X., Semmens, D. J., Thogmartin, W. E., Wiederholt, R., López-Hoffman, L., Diffendorfer, J. E., et al. (2016). Quasi-extinction risk and population targets for the Eastern, migratory population of monarch butterflies (Danaus plexippus). Sci. Rep. 6:23265. doi: 10.1038/srep23265
Steffy, G. (2015). Trends observed in fall migrant monarch butterflies (Lepidoptera: Nymphalidae) east of the Appalachian mountains at an inland stopover in southern Pennsylvania over an eighteen year period. Ann. Entomol. Soc. Am. 108, 718–728. doi: 10.1093/aesa/sav046
Stenoien, C., Nail, K. R., and Oberhauser, K. S. (2015). Habitat productivity and temporal patterns of monarch butterfly egg densities in the Eastern United States. Ann. Entomol. Soc. Am. 108, 670–679. doi: 10.1093/aesa/sav054
Taylor, O. R. (2004). Status of the population. Monarch Watch Update. Lawrence, KS: Monarch Watch. Available online at: http://www.monarchwatch.org/update/2004/0318.html#4 (accessed February 4, 2019).
Taylor, O. R., Lovett, J. P., Gibo, D. L., Weiser, E. L., Thogmartin, W. E., Semmens, D. J., et al. (2019). Is the timing, pace and success of the monarch migration associated with sun angle? Front. Ecol. Evol. 7:442. doi: 10.3389/fevo.2019.00442
Thogmartin, W. E., López-Hoffman, L., Rohweder, J., Diffendorfer, J., Drum, R., Semmens, D., et al. (2017b). Restoring monarch butterfly habitat in the Midwestern US: ‘all hands on deck.' Environ. Res. Lett. 12:074005. doi: 10.1088/1748-9326/aa7637
Thogmartin, W. E., Wiederholt, R., Oberhauser, K., Dunn, R. G., Diffendorfer, J. E., Altizer, S., et al. (2017a). Monarch butterfly population decline in North America: identifying the threatening processes. R. Soc. Open Sci. 4:170760. doi: 10.1098/rsos.170760
Vander Zanden, H. B., Chaffee, C. L, González-Rodríguez, A., Tyler, D. T., Flockhart, D. T., Norris, D. R., et al. (2018). Alternate migration strategies of eastern monarch butterflies revealed by stable isotopes. Anim. Migr. 5, 74–83. doi: 10.1515/ami-2018-0006
Vidal, O., and Rendón-Salinas, E. (2014). Dynamics and trends of overwintering colonies of the monarch butterfly in Mexico. Biol. Conserv. 180, 165–175. doi: 10.1016/j.biocon.2014.09.041
Wassenaar, L. I., and Hobson, K. A. (1998). Natal origins of migratory monarch butterflies at wintering colonies in Mexico: new isotopic evidence. Proc. Natl. Acad. Sci. U.S.A. 95, 15436–15439. doi: 10.1073/pnas.95.26.15436
World Wildlife Fund Plowprint Report (2018). Available online at: https://www.worldwildlife.org/projects/plowprint-report (accessed November 4, 2019).
Keywords: monarch, butterfly, migration, milkweed, tagging, recovery rate, monarch decline
Citation: Taylor OR Jr, Pleasants JM, Grundel R, Pecoraro SD, Lovett JP and Ryan A (2020) Evaluating the Migration Mortality Hypothesis Using Monarch Tagging Data. Front. Ecol. Evol. 8:264. doi: 10.3389/fevo.2020.00264
Received: 01 March 2019; Accepted: 27 July 2020;
Published: 07 August 2020.
Edited by:
Constanti Stefanescu, Granollers Museum of Natural Sciences, SpainReviewed by:
Naresh Neupane, Georgetown University, United StatesTyson M. Wepprich, Oregon State University, United States
Copyright © 2020 Taylor, Pleasants, Grundel, Pecoraro, Lovett and Ryan. This is an open-access article distributed under the terms of the Creative Commons Attribution License (CC BY). The use, distribution or reproduction in other forums is permitted, provided the original author(s) and the copyright owner(s) are credited and that the original publication in this journal is cited, in accordance with accepted academic practice. No use, distribution or reproduction is permitted which does not comply with these terms.
*Correspondence: Orley R. Taylor Jr., Y2hpcEBrdS5lZHU=