 Christopher P. Hansen
 Arielle W. Parsons
 Roland Kays2,3
- 1Wildlife Biology Program, W.A. Franke College of Forestry and Conservation, University of Montana, Missoula, MT, United States
- 2Department of Forestry and Environmental Resources, North Carolina State University, Raleigh, NC, United States
- 3North Carolina Museum of Natural Sciences, Raleigh, NC, United States
While urbanization is clearly contributing to biodiversity loss, certain wildlife assemblages can paradoxically be diverse and abundant in moderately developed areas. One hypothesis to explain this phenomenon is that abundant anthropogenic resources for wildlife (i.e., food and shelter) outweigh the costs associated with urbanization. To test this hypothesis, we used camera traps to measure mammal species richness, diversity, and relative abundance (i.e., detection rate) in 58 residential yards in Raleigh, North Carolina, focusing on six types of features that might be used as resources: animal feeding, vegetable gardens, compost piles, chicken coops, brushpiles, and water sources. We also placed cameras at random control sites within each yard and sampled forests in nearby suburban and rural areas for comparison. We fit mixed-effects Poisson models to determine whether yard features, yard-scale characteristics, or landscape-scale landcover predicted mammal relative abundance for eight species. We also tested if the relative abundance of native canid predators in yards was related to the number of prey (rodents and lagomorphs). Species richness, diversity, and relative abundance of most mammal species was higher in yards and suburban forests than in rural forests. Within a yard, purposeful feeding had the strongest effect on animal relative abundance, with eastern gray squirrels (Sciurus carolinensis) being the most common (32.3 squirrels/day at feeders; 0.55 at control sites; 0.29 in suburban forests; and 0.10 in rural forests). We observed species using (e.g., eating) most yard features, although canids were less likely than other taxa to use resources in yards. The presence of a yard feature did not strongly affect the abundance of species at the control site in the yard, suggesting the influence of these features was highly localized. The relative abundance of predators had a positive association with prey relative abundance, and predators were less common in yards with fences. These results demonstrate that there is high use of anthropogenic resources, especially supplemental feeding by urban wildlife, and this increase in prey species may then attract predators, which supports the hypothesis that use of supplemental food resources explains the abundance of urban wildlife.
Introduction
Urbanization is increasing globally, with 55% of the world’s population currently living in urban areas, 68% projected to live in urban areas in the year 2050 (United Nations et al., 2017), and urban land use expanding 9,687 km2 per year between 1985 and 2015 (Liu et al., 2020). Urban areas are often viewed as being biodiversity deserts, largely due to the negative impacts of urbanization on the environment (McKinney, 2006; Mcdonald et al., 2008), including land-use and land-cover change (Foley et al., 2005), altered biogeochemical cycles, increased CO2 emissions driving climate change, and changes in wildlife abundance, distribution, and community composition (Grimm et al., 2008).
While urbanization is clearly contributing to biodiversity loss, certain wildlife assemblages, sometimes including sensitive and threatened species, are paradoxically found to be more diverse and abundant in moderately developed areas than in wild areas (e.g., Ives et al., 2016; Parsons et al., 2018). Even some large carnivores, often thought to avoid urban areas, have been found to exploit resources associated with urbanization (Bateman and Fleming, 2012). One explanation for the abundance of urban wildlife is that moderate levels of disturbance may result in a heterogeneous landscape that can support both good competitors and good colonizers (i.e., the intermediate disturbance hypothesis; Grime, 1973; Connell, 1978). Another explanation suggests that altered interspecific interactions among synanthropic and urbanophobic species may allow more species to thrive in urban areas (El-Sabaawi, 2018). For example, the decline of some apex predators in urban areas (e.g., Ordeñana et al., 2010) could reduce the contribution of top-down control in structuring ecological communities, thereby “releasing” mesopredators (Crooks and Soulé, 1999) and subsequently depressing prey species (e.g., rodents and lagomorphs). However, prey species are also often abundant in urban areas, resulting in a “predation paradox” that could be explained by the “human shield” hypothesis (Berger, 2007), where prey species exploit areas dominated by humans to avoid predators, or by the abundance of anthropogenic resources in urban areas, which provide food and shelter to wildlife in multiple trophic levels (Faeth et al., 2005; Rodewald et al., 2011; Fischer et al., 2012).
Urban areas house a diversity of resources for wildlife, including intentional food sources (e.g., feeders), unintentional food sources (e.g., gardens, compost piles, chicken coops), water, and shelter (e.g., brushpiles). These resources are often located in residential yards, which form a mosaic of small, independently managed green spaces throughout urban landscapes (Gaston et al., 2013). For example, it was estimated that over 47 million people spent approximately $4.85 billion on birdseed and food for other wildlife in the United States in 2016 (U.S. Department of the Interior et al., 2018). Further, 35% of all households in the United States spent $3.5 billion on vegetable gardening in 2013, with the number of participants increasing annually (National Gardening Association, 2014).
Wildlife use of urban resources has been extensively studied in the avian community (e.g., Cannon et al., 2005; Daniels and Kirkpatrick, 2006; Fuller et al., 2007; Goddard et al., 2010), but relatively little is known about how urban resources affect mammal communities. Reed and Bonter (2018) found that birdfeeders attracted eastern gray squirrels (Sciurus carolinensis) and northern raccoons (Procyon lotor), but they did not evaluate other yard features. Kays and Parsons (2014) evaluated mammal use of residential yards, but primarily focused on the effects of chicken coops, fences, and domestic dogs (Canis familiaris). A more comprehensive understanding of how the most common urban food and shelter resources affect mammal abundance in residential yards could help explain the abundance of urban wildlife and provide insight into the implications of backyard management on mammals, which could inform urban planning (Lepczyk et al., 2017). Our objective was to test the hypothesis that food and shelter resources in yards are an important factor explaining why some mammals are abundant in urban landscapes, in comparison with predation risk and landscape-scale attributes that are typically used to model animal distribution. Further, given concerns of predators [e.g., coyotes (Canis latrans)] being attracted to anthropogenic resources (Murray and St. Clair, 2017) or increased prey abundance (Prevedello et al., 2013), resulting in human-wildlife conflict (Soulsbury and White, 2015), an additional objective was to identify whether increasing prey abundance was related to an increase of predators in yards.
We hypothesized that resources in yards would influence the activity, distribution, and community structure of mammals in urban areas and that supplemental feeding (intentional and unintentional) would have the largest effect on the relative abundance of mammals (e.g., Boutin, 1990; Reed and Bonter, 2018). We predicted that increasing natural vegetation in the yard and in the surrounding landscape would also be associated with higher mammal relative abundances (Daniels and Kirkpatrick, 2006; Magle et al., 2009), but mammal relative abundance would be reduced in yards with fences or outdoor pets (Kays and Parsons, 2014). Finally, we predicted supplemental feeding would result in higher mammal abundance both locally (at the food source) and throughout the yard.
Materials and Methods
Study Area
We conducted our study on residential yards and natural areas surrounding Raleigh and Durham, North Carolina (hereafter, Raleigh). The primary study area, including residential yards and suburban forests within ∼5 km radius of yards, was approximately 1,807 km2 with an estimated human population of 1.14 million and a mean housing density of ∼534 houses/km2. We also surveyed sites that occurred in forests with low housing density (<0.5 houses/km2) within ∼130 km of yard sites (“rural” sites; Figure 1). Most of the primary study area was developed (∼54%), with forests (∼34%) and agricultural lands (∼4%) interspersed throughout the region.
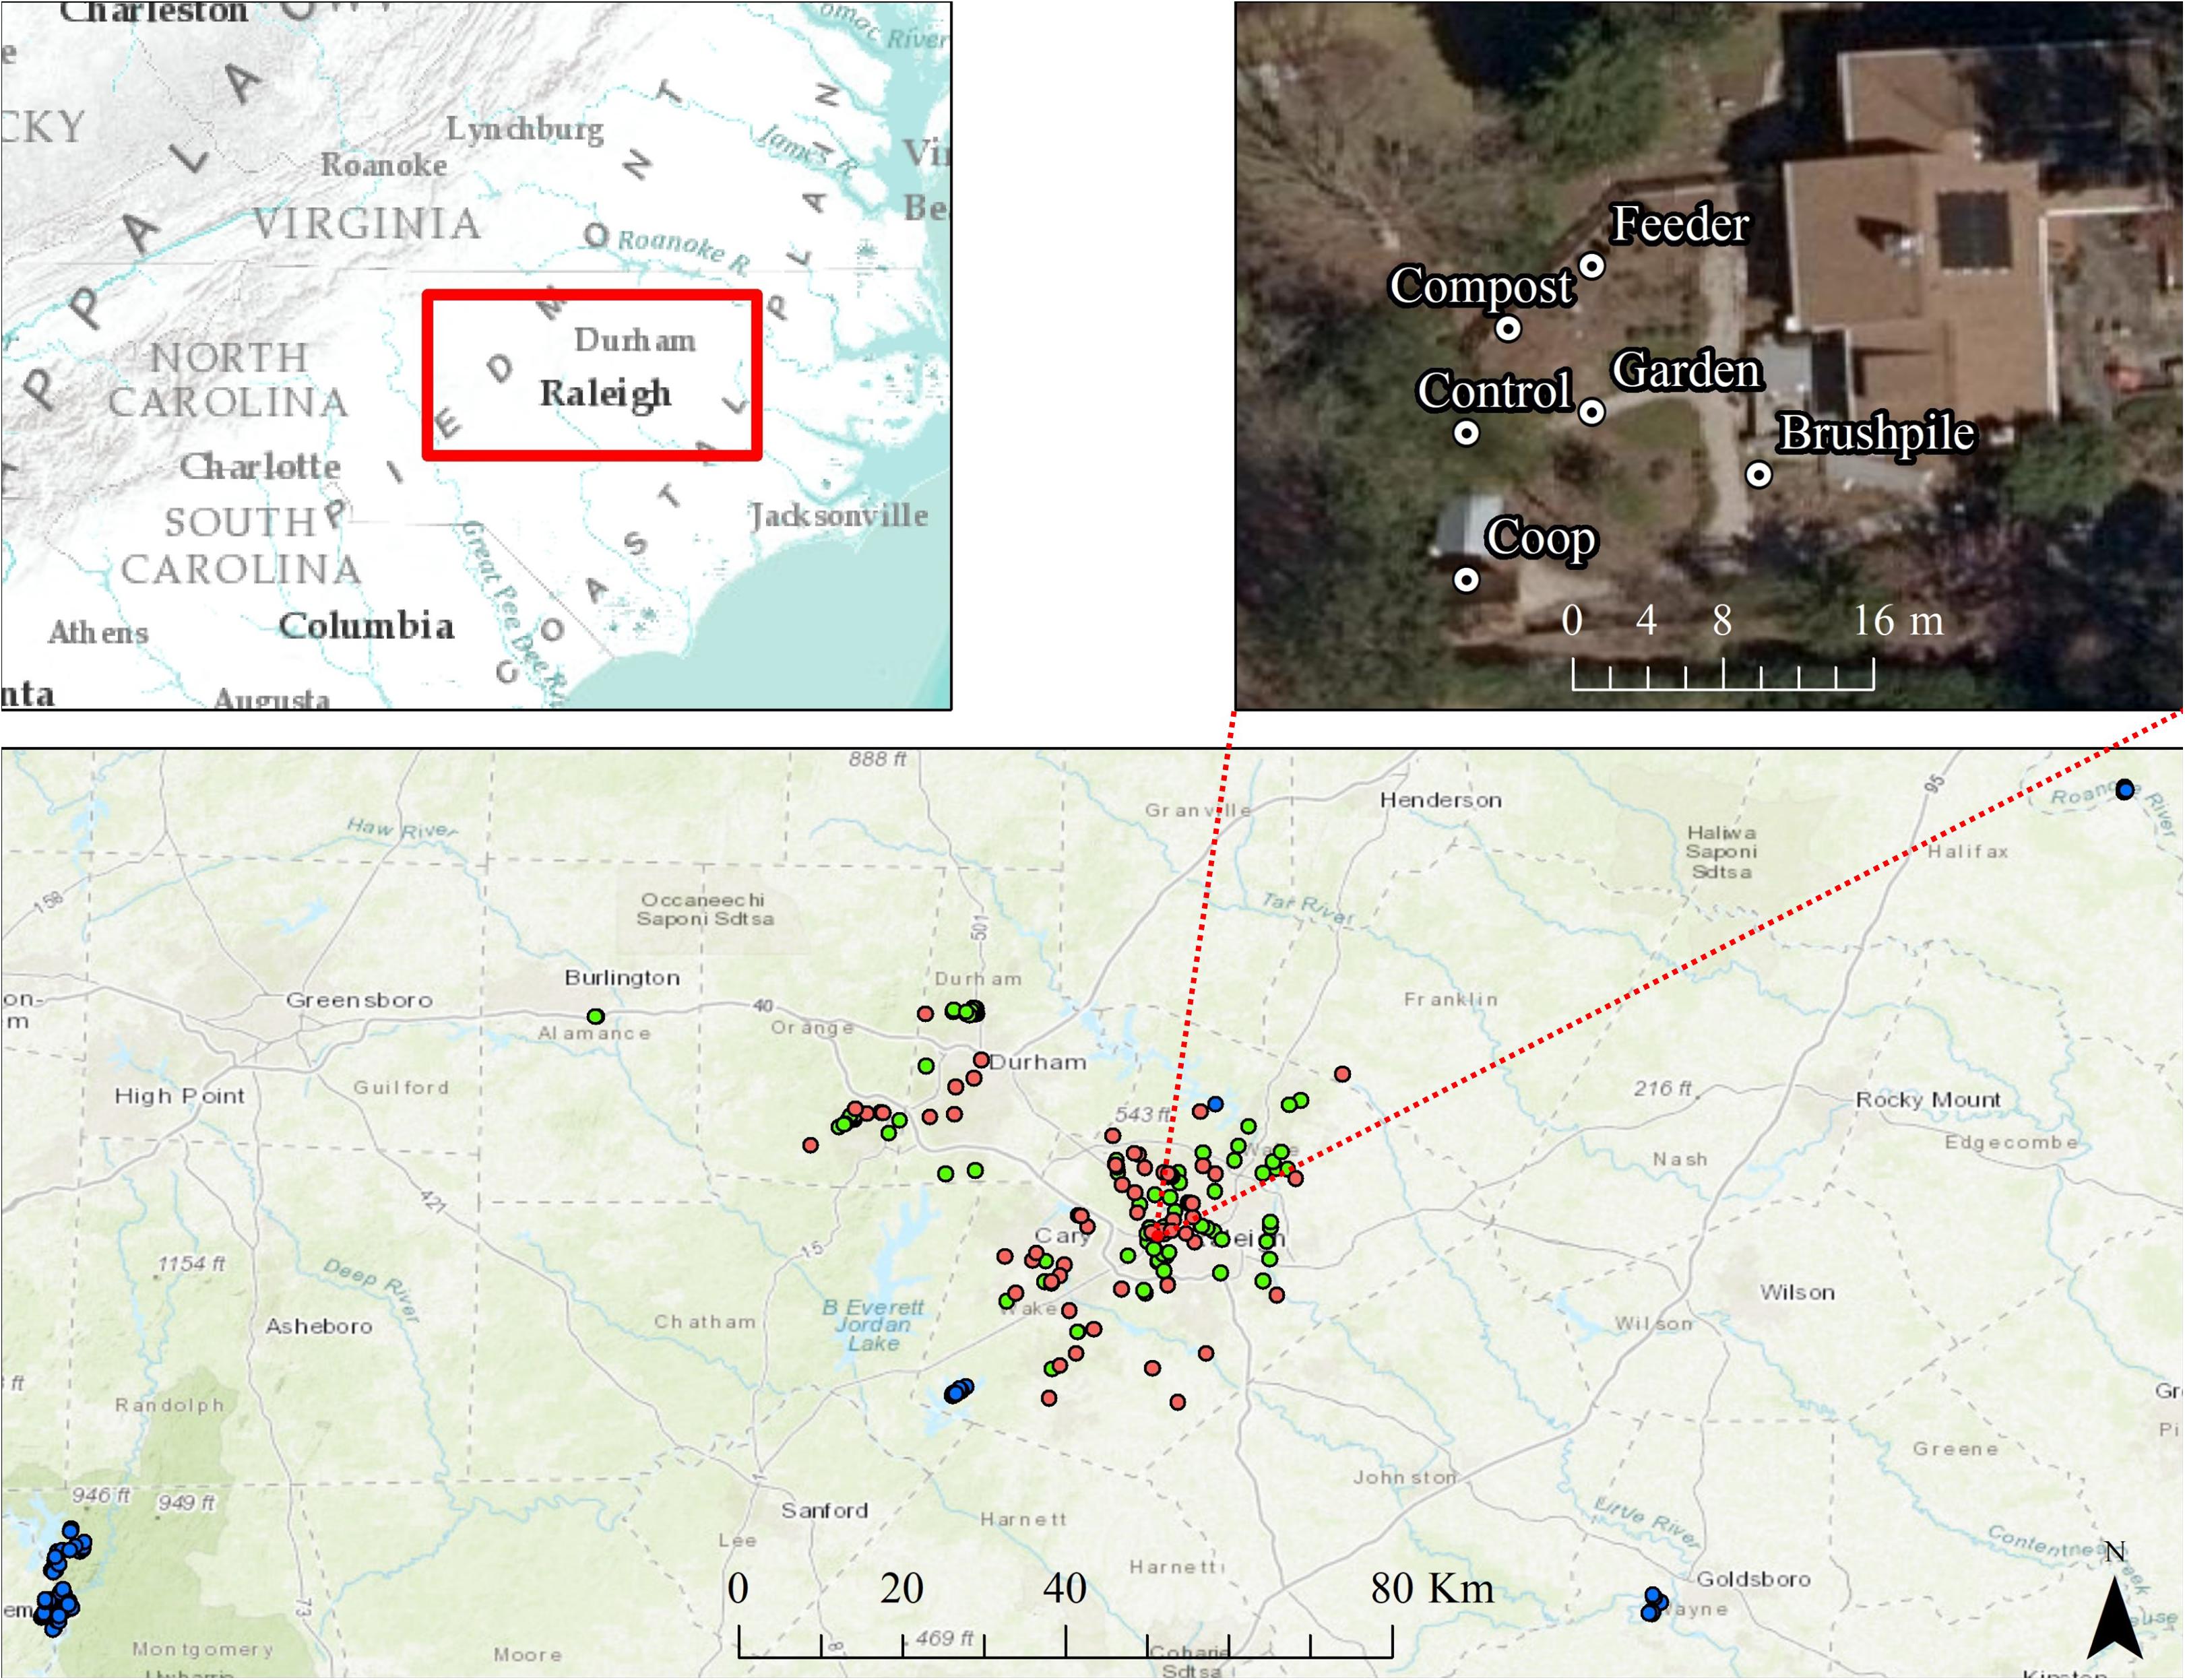
Figure 1. Locations of residential yard (pink dots), suburban forest (green dots), and rural forest (blue dots) trail cameras surrounding Raleigh, North Carolina from 2012 to 2016. One representative yard is shown, with a camera placed at each feature in the yard (feeder, compost, chicken coop, garden, brushpile, and control site). Basemaps are Esri World Topographic and World Imagery maps.
Mammal Surveys
From March through October 2016, we set motion-triggered, low-glow infrared trail cameras (Reconyx Hyperfire PC 900; hereafter, “cameras”) in 58 residential yards (hereafter, “yards”), spaced at least 100 m apart ( 2.87 km, range = 133 m–14.6 km), throughout the study area. We defined a yard as the portion of a residential parcel regularly maintained or managed (e.g., mowed, gardened, landscaped) by the homeowner, generally within approximately 100 m of the household. Approximately 88% of yards were spaced >500 m apart and 97% were spaced > 250 m apart. Given most species detected in our study have relatively small home ranges, particularly in urban environments, we were not concerned with spatial autocorrelation.
Housing density at yard sites averaged 378 houses/km2. Most yards had at least one of six common yard features that may attract mammals, including bird or mammal feeders (n = 30), gardens (n = 31), compost (n = 29), chicken coops (n = 9), brushpiles (n = 39), or water features (n = 29). Two yards had none of these features. We set cameras approximately 0.5 m high, facing one of each unique feature types in the yard. We also set a camera at a random control site at least 3 m ( 20 m, range = 3–119 m) from the nearest feature in the yard (Figure 1). We set cameras to take a burst of 5 pictures at approximately 1 photo/second each time triggered, with no lag time between triggers, and left cameras for approximately 3 weeks ( 21 days), resulting in a total of 4,608 trap nights. We recorded other yard characteristics, including presence of fence, percent cover of trees within 100 m, percent of yard with natural vegetation, presence of domestic animals, and yard size. We also estimated landscape-scale attributes, including percent forest and housing development within 1 km of the yard using the United States National Landcover Dataset (Fry et al., 2011) and the Silvis housing density dataset (Hammer et al., 2004) in ArcMap (Version 10.1, ESRI, Redlands, California, United States).
As a comparison to yard sites, we also acquired data from cameras set from February–October 2012–2016 at random sites in “suburban” (147–1,000 houses/km2; n = 105; trap nights = 2,277) and “rural” (<12.67 houses/km2; n = 72; trap nights = 1,522) forests near Raleigh, NC (see Parsons et al., 2018). Suburban and rural forest cameras were set using the same methodology as yard sites, except cameras did not have a paired control site. Suburban forest sites averaged ∼305 houses/km2 and rural forest sites averaged <1 house/km2.
We uploaded photos from cameras into software1 that groups photos taken <60 s apart into independent sequences. Using the software, we identified the number of unique individuals of each species in each sequence. We also identified whether a species was using the yard feature the camera was facing (e.g., eating the food source or climbing through the brushpile) or just passing by. Photo identifications were reviewed by an independent party to ensure accuracy in classification (McShea et al., 2016).
Analytical Methods
We used the iNEXT package (Hsieh et al., 2020) in R (R Core Development Team, 2019) to calculate species richness (effective number of species) and Shannon diversity (effective number of common species) of mammals, excluding mice and rats, at yard features and in suburban and rural forests. Specifically, we used incidence data from camera traps to calculate sample-size and coverage-based rarefaction/extrapolation curves and 95% confidence limits for Hill numbers (i.e., effective number of species) with diversity order q = 0 (species richness) and q = 1 (Shannon diversity; Chao et al., 2014; Hsieh et al., 2016).
We calculated mammal relative abundance (i.e., detection rate) by counting the number of each species detected on a camera in each sequence and dividing by the number of days the camera was active. Then, we calculated the mean and standard deviation of relative abundance, grouping by feature type and forest type (suburban or rural). We also calculated the proportion of sites in which the yard feature was used when a species was present.
We fit three sets of models to evaluate the influence of yard features on species-specific mammal relative abundance within yards. The first model evaluated how yard features influenced mammal relative abundance at the feature location, in relation to variables at larger scales. Using data from cameras next to yard features and control sites, we fit separate mixed-effects Poisson regression models for 8 of the most commonly detected species, including eastern gray squirrel, northern raccoon, Virginia opossum (Didelphis virginiana), white-tailed deer (Odocoileus virginianus), eastern cottontail (Sylvilagus floridanus), gray fox (Urocyon cinereoargenteus), red fox (Vulpes vulpes), and coyote. We included an extra error term in the model to account for overdispersion and included an “offset” term equivalent to the natural log of the number of days the camera was active. We included species-specific count as the response, and yard feature type, percent forest within 1 km, average housing density within 1 km, percent tree cover within 100 m, proportion of the yard with natural vegetation, presence of a fence surrounding the yard, presence of pets (domestic cats or dogs), and yard size as fixed effects in the model. We chose landscape variables (forest cover and housing density within 1 km) because previous studies in a similar region found these variables to be influential on mammal occupancy (Kays et al., 2017; Parsons et al., 2019). To account for unmodeled variation in mammal relative abundance among yards, we included yard identification as a random effect and estimated unique intercepts for each yard. We centered and scaled all continuous covariates. See Supplementary Table 1 for a description of all model covariates.
The second model evaluated how the presence of a feature in yard influenced mammal relative abundance throughout the yard, beyond the feature. This model was also a Poisson regression model, but only included data from control cameras in yards and did not include a random effect. This model used species-specific count as a response, and included categorical variables identifying whether each feature was present in the yard. We also included all other yard and landscape attribute covariates that we included in the first model.
The final model evaluated how predator relative abundance in yards was related to prey relative abundance. This model was similar to the first, but we grouped species into a “predator” cohort (coyote, red fox, gray fox) and a “prey” cohort (eastern gray squirrel, eastern chipmunk, eastern cottontail, and mouse/rat species). We included predator count as the response and prey count, yard characteristics, and landscape attributes as predictors in the model to evaluate the relative contribution of each factor in predicting predator abundance in yards. We did not include yard feature variables in the model because there was high correlation between these variables and prey abundance.
We fit global models for each species within a Bayesian framework using the R2jags package (Su and Yajima, 2015) in R (R Core Development Team, 2019). We estimated posterior distributions of predictors by running 3 Markov Chain Monte Carlo (MCMC) chains, each for 1,000,000 iterations, with a burn-in of 250,000, and thinning of 10. We determined that predictors influenced the response if 95% credible intervals (between 2.5 and 97.5% quantiles) of parameter estimates did not overlap zero. We identified whether models converged by ensuring values were <1.1 (Gelman and Rubin, 1992) and by examining posterior distributions and MCMC chains. We also used posterior predictive checks to calculate a Bayesian p-value (pB) to assess model fit, assuming 0.1 < pB < 0.9 represented adequate fit (Gelman et al., 2014).
Results
We detected 10, 13, and 9 wild mammal species on cameras in yards, suburban forests, and rural forests, respectively. Species richness and Shannon diversity did not vary considerably across yard features, but was generally lower in rural forests (Figure 2). Eleven wild species [white-tailed deer, eastern gray squirrel, northern raccoon, gray fox, eastern cottontail, red fox, coyote, woodchuck (Marmota monax), American beaver (Castor canadensis), eastern fox squirrel (Sciurus niger), and southern flying squirrel (Glaucomys Volans)] and mouse/rat species had higher relative abundances in suburban forests, compared to rural forests. Seven species [eastern gray squirrel, gray fox, Virginia opossum, eastern cottontail, red fox, woodchuck, and eastern chipmunk (Tamias striatus)] had higher relative abundances at control sites in yards, compared to suburban or rural forests. Bobcats (Lynx rufus) were detected most in rural forests and were never detected in yards (Supplementary Table 2).
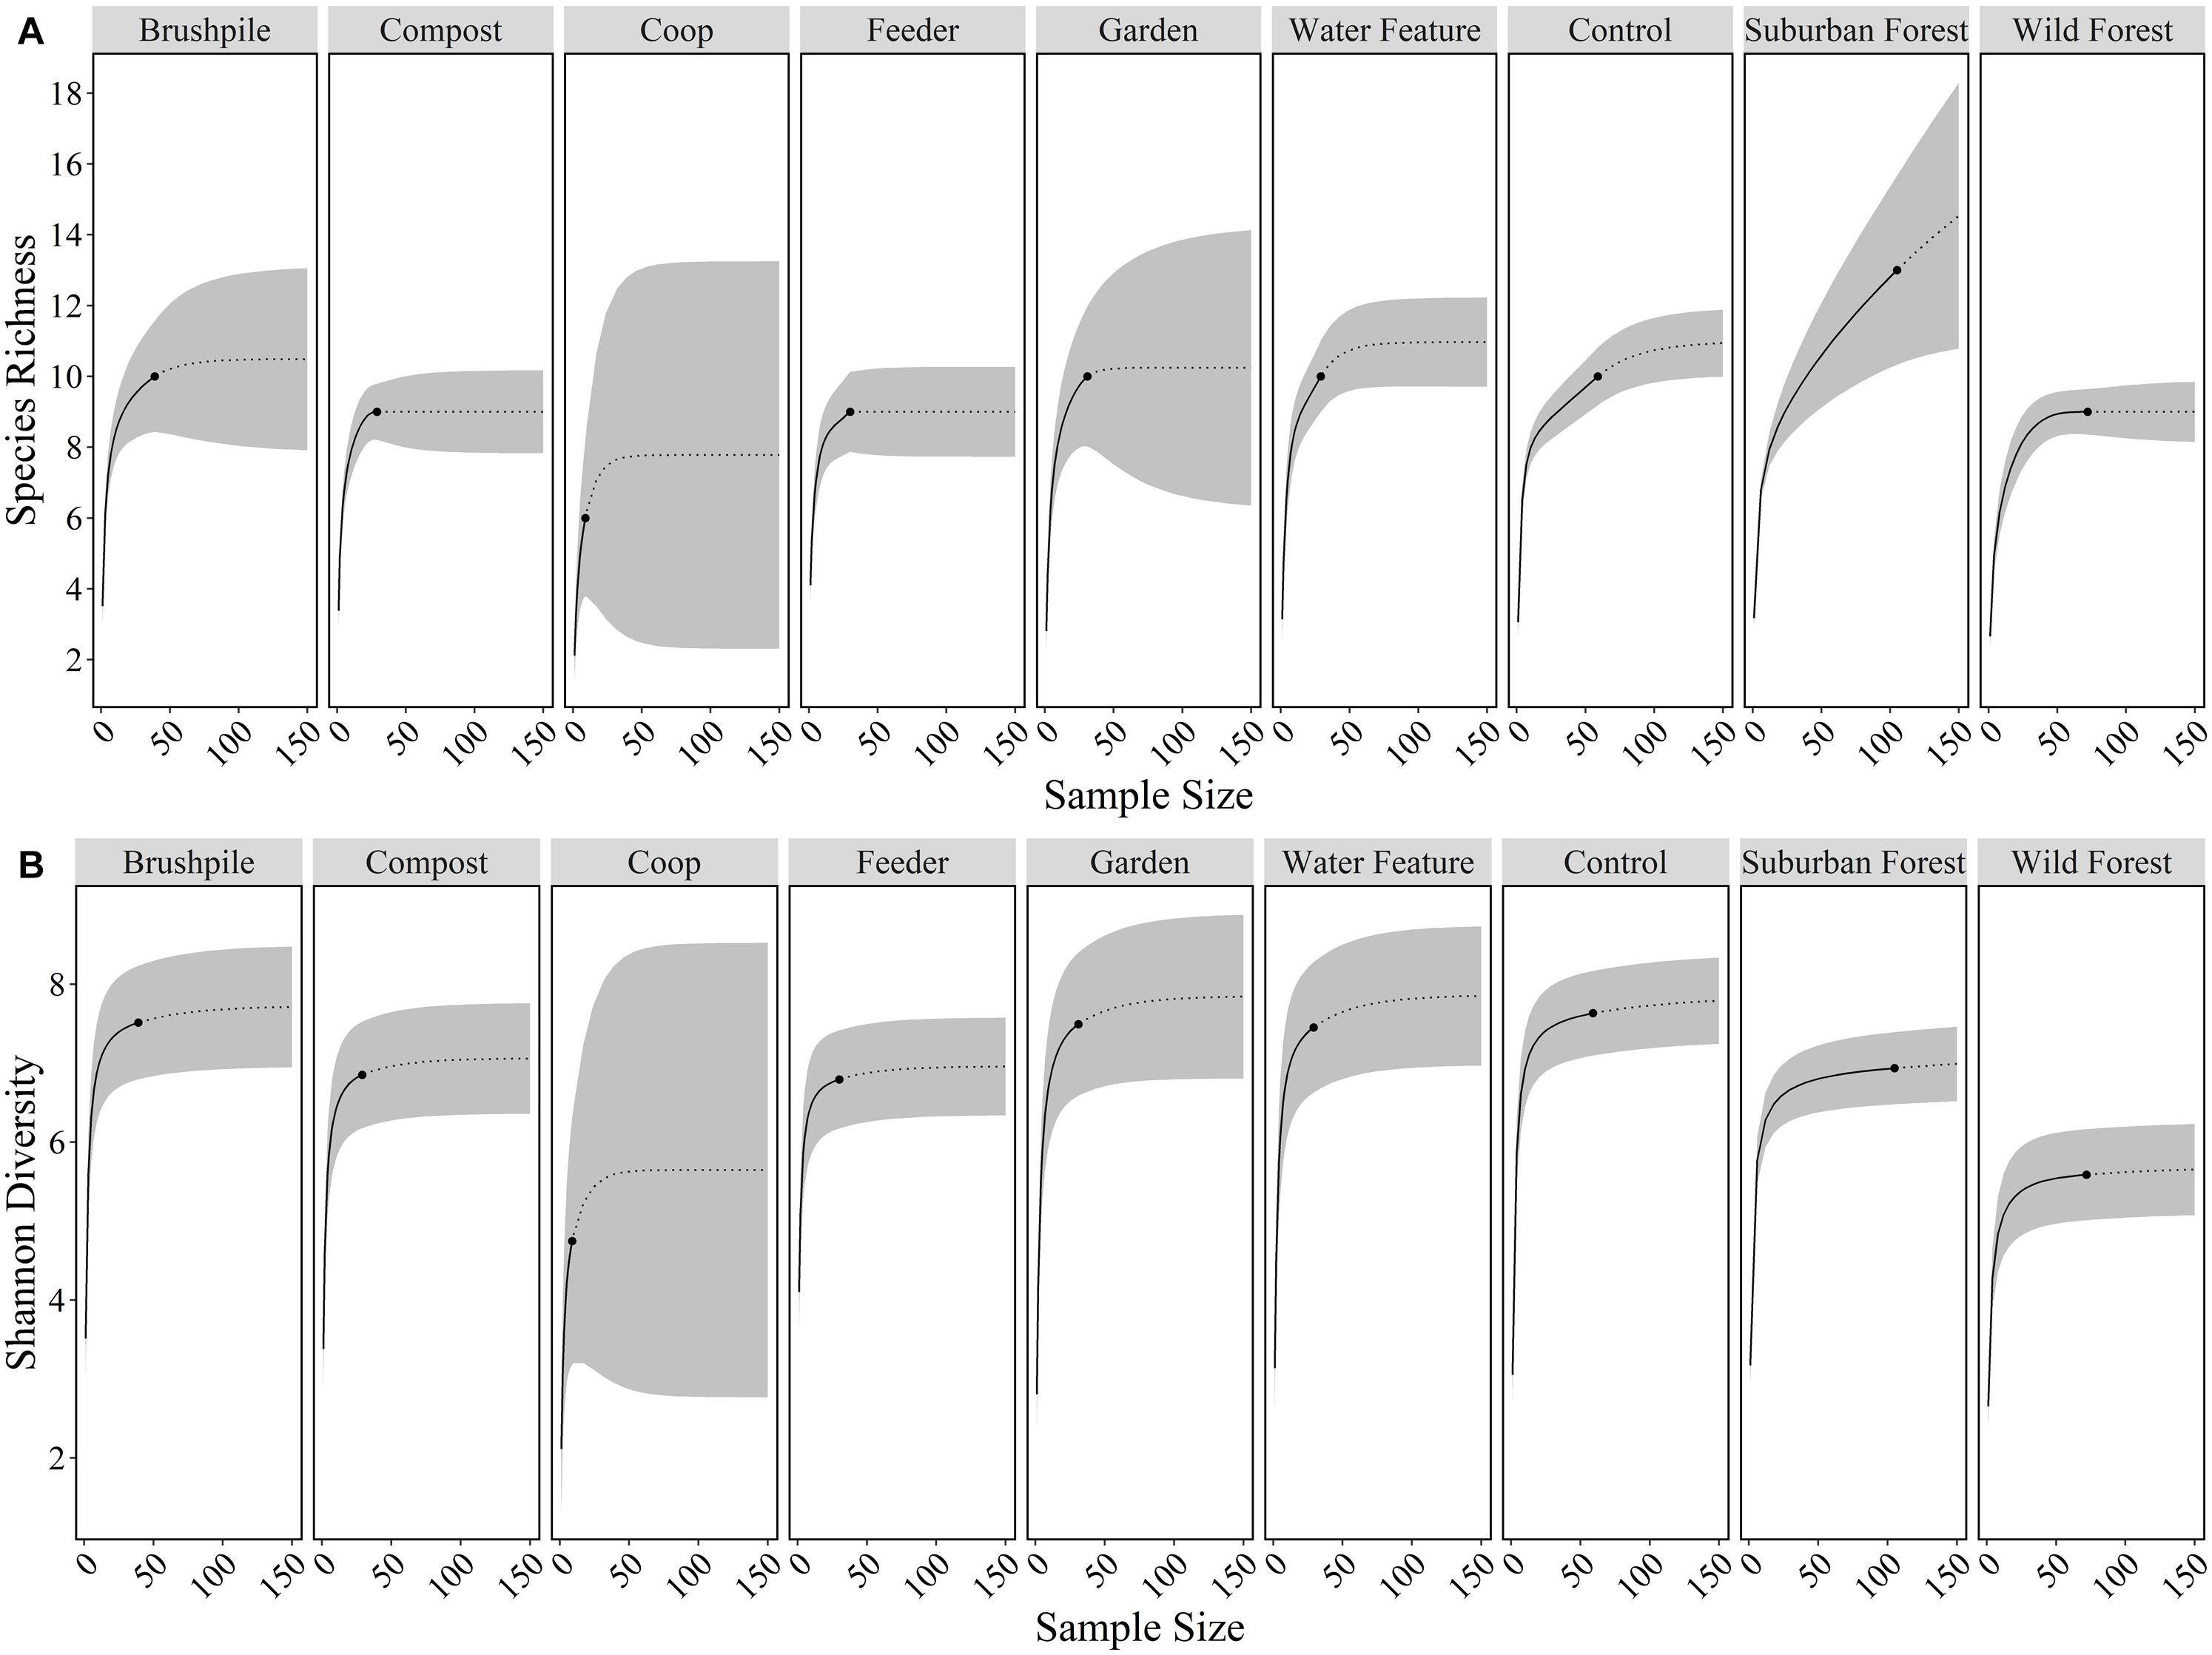
Figure 2. Species richness (A) and Shannon diversity (B) of mammals at features in residential yards (brushpiles, compost piles, chicken coops, bird and mammal feeders, gardens, water features, control sites), suburban forests, and rural forests surrounding Raleigh, North Carolina from 2012 to 2016. Black dots are the observed species richness or diversity at a feature, solid lines are the interpolated values, dotted lines are the extrapolated values, and gray ribbons are the 95% confidence intervals across sample sizes.
White-tailed deer had the highest relative abundance in suburban ( 1.27/day; SD = 2.19) and rural ( 1.03/day; SD = 1.37) forests, while eastern gray squirrels had the highest relative abundance in yards (control site 0.55/day; SD = 1.32). Feeders in yards attracted the most mammals, with eastern gray squirrels ( 32.33/day, SD = 40.92), northern raccoons ( 1.86/day, SD = 3.22), and eastern chipmunks ( 1.47/day, SD = 4.18) detected most frequently (Figure 3 and Supplementary Table 2).
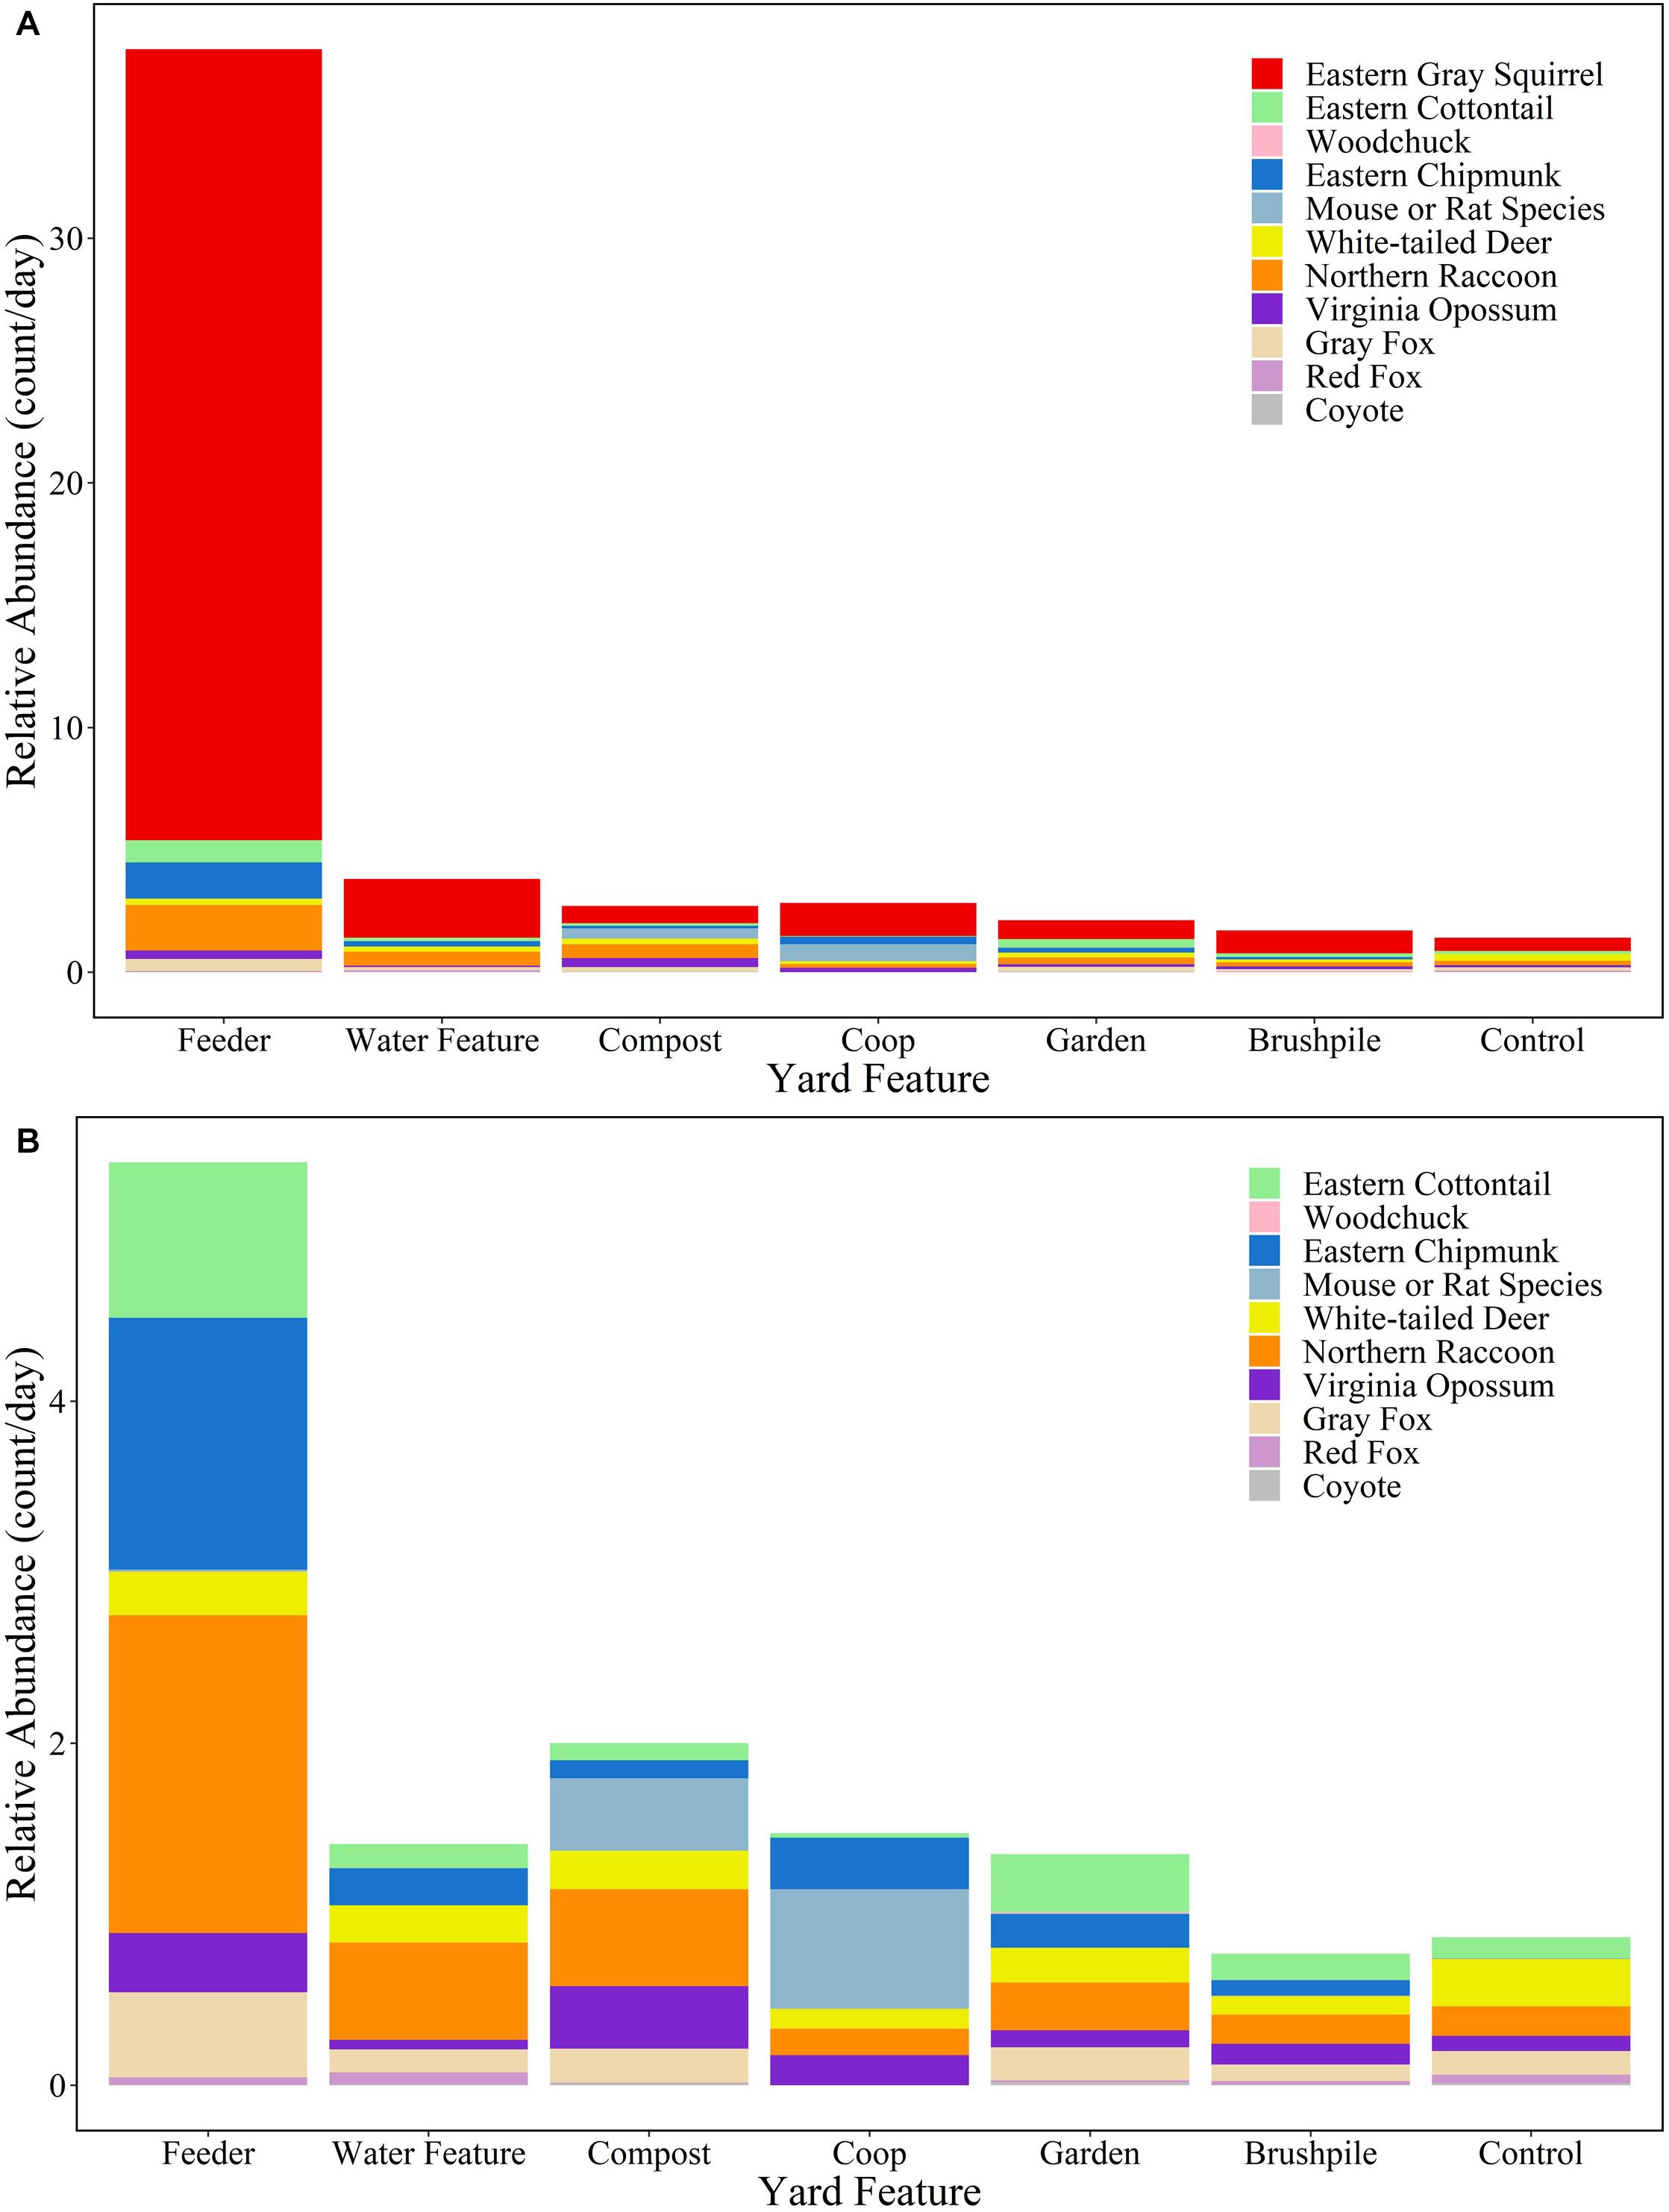
Figure 3. Relative abundance (count/day) of mammal species at yard features in Raleigh, North Carolina in 2016. Figure (A) includes all species, while Figure (B) excludes eastern gray squirrels to highlight relative abundances of other species.
Overall, mammals used (e.g., ate or drank from, paused to examine, or took shelter in) 69% of the features where they were detected. Canids only used features at 53% of sites, while all other species used 71% of features. Eastern chipmunks used 85% of features where they were detected, while coyotes only used 33% of features. Mammals were most likely to use feeders (82% of sites) and gardens (77% of sites), but only used brushpiles at 56% of sites (Supplementary Figure 1).
All models converged and passed posterior predictive checks. The effect of yard feature type, yard characteristics, and landscape attributes on mammal relative abundance varied by species. Feeders had strong positive associations with the relative abundances of four species: eastern gray squirrel [β = 4.41, 95% credible interval (CI) = 3.68–5.18], eastern cottontail (β = 1.41, 95% CI = 0.39–2.46), northern raccoon (β = 2.37, 95% CI = 1.65–3.12), and Virginia opossum (β = 1.48, 95% CI = 0.57–2.41; Figures 4, 5). Compost sites had positive associations with the relative abundances of northern raccoons (β = 1.70, 95% CI = 0.93–2.48) and Virginia opossums (β = 1.71, 95% CI = 0.82–2.63), but a negative association with the relative abundance of red foxes (β = −2.26, 95% CI = −4.83 to −0.10). Other yard characteristics and landscape features had less of an association with relative abundance of mammal species (Figure 4).
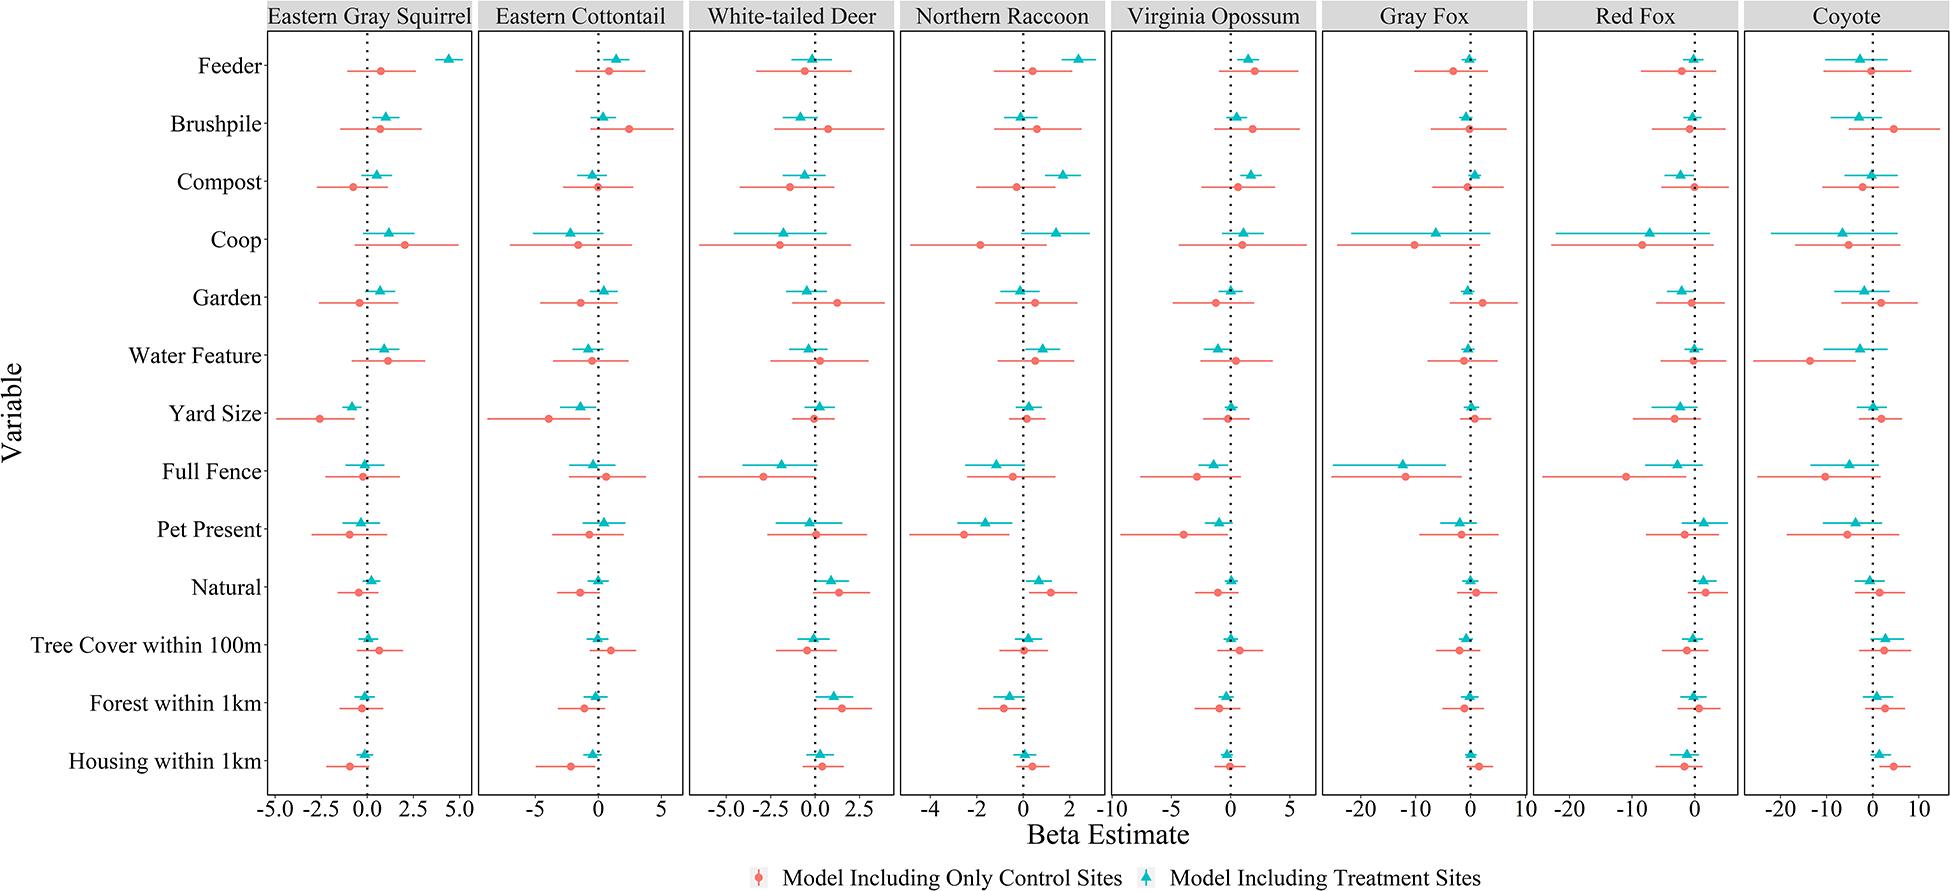
Figure 4. Mean beta estimates (points) and 95% credible intervals (horizontal error bars) for variables explaining mammal relative abundances in residential yards in Raleigh, North Carolina in 2016. Feeders, brushpiles, compost, chicken coops, gardens, and water features represent local-level variables; yard size, full fence, pet present, natural (proportion of yard with natural vegetation), and tree cover within 100 m represent yard-scale variables; and proportion forest within 1 km and housing density within 1 km represent landscape-scale (i.e., neighborhood) variables. Blue markers represent models including treatment sites (cameras facing features) in yards and red markers represent models only including control sites in yards. Thus, feature variables included in control-only models represent whether the feature was present somewhere in the yard, while feature variables for treatment models represent cameras that faced the feature. Credible intervals that overlap the vertical dotted line (Beta = 0) represent variables without a strong influence on species-specific relative abundance.
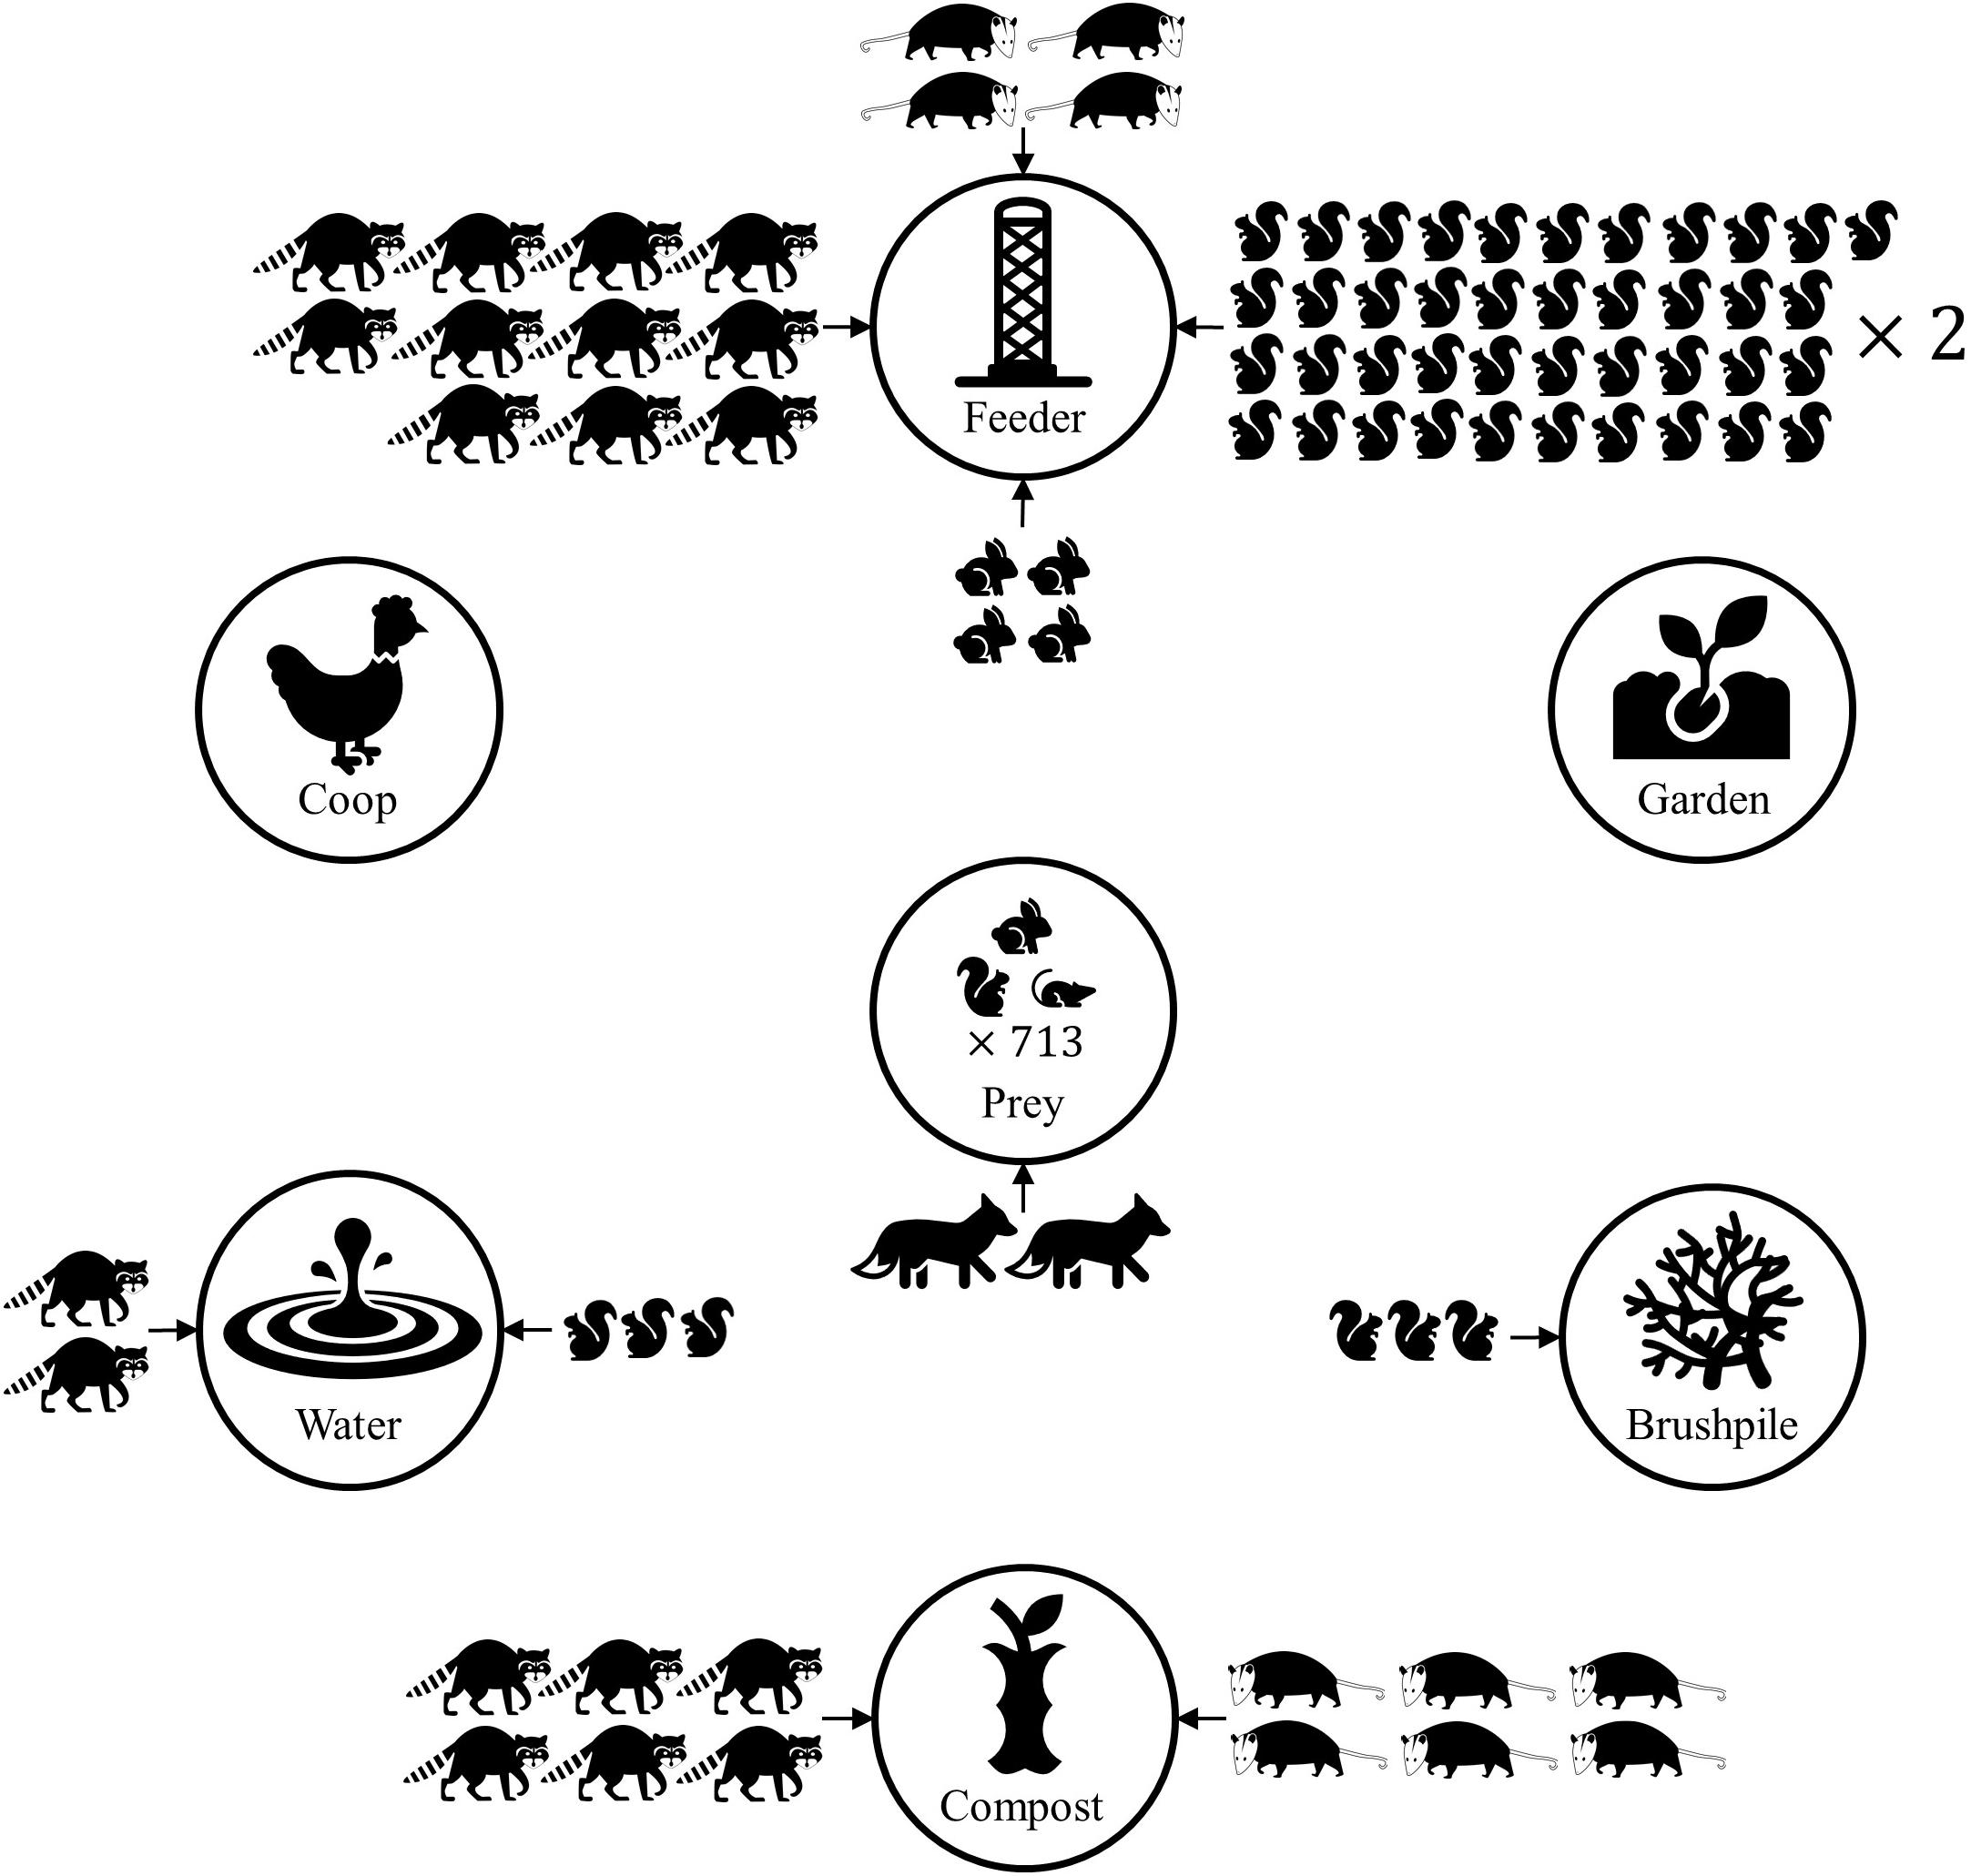
Figure 5. Conceptual diagram demonstrating predicted mammal count at yard features, based on Poisson regression models of mammal count data from residential yards in Raleigh, North Carolina in 2016. Only strong associations between features and mammal count are shown. Eastern gray squirrels, eastern cottontails, northern raccoons, and Virginia opossums had higher relative abundance at some yard features, compared to control sites within a yard. Yards with higher prey (rodents and lagomorphs) relative abundance were more likely to have higher predator (wild canid) relative abundance. The number of mammal icons represents the relative risk ratio, compared to a control site in the yard. Thus, a yard feature with two raccoons suggests there are predicted to be twice as many raccoons at the feature, relative to the control site. The predicted number of predator detections doubled when prey detections increased by 713.
There were almost no effects of the presence of features in the yard on mammal relative abundances at the control site (Figure 4); although, coyotes were detected less in yards with water features (β = −13.60, 95% CI = −25.90 to −3.66). Yard-scale characteristics had more of an influence on mammal relative abundances at control sites. For example, red fox (β = −10.95, 95% CI = −24.33 to −1.33) and gray fox (β = −11.84, 95% CI = −25.37 to −1.62) had lower relative abundances in yards with full fences; northern raccoons (β = −2.55, 95% CI = −4.90 to −0.60) and Virginia opossums (β = −3.96, 95% CI = −9.30 to −0.22) had lower relative abundances in yards with pets; and eastern gray squirrels (β = −2.58, 95% CI = −4.93 to −0.68) and eastern cottontails (β = −3.93, 95% CI = −8.81 to −0.63) had lower relative abundances in larger yards. Landscape-scale characteristics also influenced some mammal detection rates in yards. White-tailed deer had higher relative abundances in yards with more forest within 1 km (β = 1.51, 95% CI = 0.08–3.20) and coyotes had higher relative abundances in yards with more housing development within 1 km (β = 4.56, 95% CI = 1.45–8.28), while eastern cottontails had lower relative abundance with more housing development (β = −10.95, 95% CI = −24.33 to −1.33; Figure 4).
The number of predators using yards had a small, but positive association with prey relative abundance (β = 0.28, 95% CI = 0.036–0.52). It would take prey count to increase by approximately 713 to double the number of predators in a yard. Predator relative abundance was lower in yards with full fences (β = −3.46, 95% CI = −5.79 to −1.48), but no other yard or landscape characteristics influenced predator relative abundance in yards (Figure 5).
Discussion
A variety of mammals made use of either purposeful or incidental feeders (e.g., compost, gardens) in backyards, resulting in highly localized animal abundance, which we suggest helps explain the abundance of urban wildlife. Apart from a few exceptions, there was higher species richness/diversity and higher relative abundance of mammals in yards, compared to rural areas, and mammal detections increased substantially around supplemental feeders. Further, we frequently documented mammals eating anthropogenic food resources, demonstrating that mammal detections by feeders were related to feeding behavior and not coincidental. These results are consistent with other research related to supplemental feeding effects on mammal populations (e.g., Boutin, 1990; Sullivan, 1990; Bozek et al., 2007; Prevedello et al., 2013; Reed and Bonter, 2018), but are novel in that they also demonstrate the relative importance of supplemental feeding on urban mammal abundance, compared with factors such as other common yard features, landscape attributes, and predation risk.
Beyond supplemental food sources, other yard features were generally less associated with mammal relative abundance in our study. Most notably, there were few strong, positive associations between mammal detection rates and water sources, except for eastern gray squirrels and northern raccoons. Raleigh gets 7.6–11.4 cm precipitation per month on average (U.S. Climate Data, 2020), and there were many natural water sources in the surrounding area. Thus, mammals may not be water-limited in our study area and we expect there would be stronger associations between water sources and mammal abundance in more arid environments (e.g., McKee et al., 2015). Another notable observation was the low of use of brushpiles, except for eastern gray squirrels. Brushpiles are known to be important refugia for variety of taxa (e.g., Trent and Rongstad, 1974; Gorenzel et al., 1995; Bouget and Duelli, 2004; Sperry and Weatherhead, 2010), but the addition of brushpiles may not influence wildlife abundance or survival when they are not a limiting resource (e.g., Goguen et al., 2015). Further, urban wildlife will use anthropogenic structures for refugia (Lowry et al., 2013), so brushpiles or other natural refugia within yards may not be as important as they are in more natural areas. Finally, chicken coops were relatively unimportant drivers of mammal relative abundance in our study; although, there was a 95 and 97% probability that coops had a positive influence on eastern gray squirrel and northern raccoon relative abundance, respectively. Kays and Parsons (2014) reported similar results, finding raccoons were the only mesopredator positively associated with chicken coops.
While resources in yards attracted rodents, lagomorphs, and some mesopredators, the activity of other mammals was more related to yard characteristics and landscape attributes. Yards with full fences generally had lower mammal relative abundance, with the strongest effects on gray fox, red fox, and Virginia opossums. The presence of domestic cats and dogs in the yard also negatively influenced mammal abundance, but only strongly affected northern raccoons and Virginia opossums. Kays and Parsons (2014) had similar findings, generally observing less mammal activity in fenced-in yards with dogs. These results are not surprising, as full fences will deter some mammals from entering a yard, and domestic animals are known to disturb wildlife (Lenth et al., 2008; Hughes and Macdonald, 2013; Loss et al., 2013). However, yards with supplemental feeders and fences/pets still attracted more mammals than fenceless/pet-free yards without feeding, particularly for species that could climb over or under fences (e.g., eastern gray squirrels, northern raccoons, eastern chipmunks), further supporting our finding that supplementary feeding drives mammal abundance in yards.
Mammal relative abundance in yards was least related to landscape attributes in our study. White-tailed deer were more likely to be detected in yards with more forest within 1 km of the yard, which is consistent with other research in the study area (Kays and Parsons, 2014). Most interestingly, coyotes detected in yards had positive associations with housing development within 1 km. Coyotes are increasingly being found in urban landscapes (e.g., Gehrt, 2004; Gehrt et al., 2009), and other research in the Raleigh area found coyotes in all development levels around the city (Parsons et al., 2018). We are unsure of the explanation for this result, but speculate coyotes using residential yards were part of a cohort that has become more adapted to urban landscapes. Thus, these coyotes were more likely to be detected within areas of greater housing development.
Top-down forces (i.e., predation) can play a large role in population fluctuations of species at lower trophic levels (e.g., Hairston et al., 1960) through density- or trait-mediated processes (Abrams et al., 1996); however, we did not find direct support for this hypothesis in our study. We detected most predators (i.e., native canids) more frequently in yards, compared to nearby rural areas, so the high abundance of prey in yards was not likely related to a reduction in predation risk, as predicted by the “human shield” hypothesis (Berger, 2007). Instead, we suggest that bottom-up forces from supplemental feeding are driving increases in prey abundance, which may also have cascading effects through the mammal community, given the positive association between prey and predator relative abundance in yards. Prey abundance was the only factor with a positive association with predator abundance in yards; however, the effect was quite small, and predator abundance varied considerably, so we suspect predator abundance is being determined by additional, unmodeled factors.
Predator abundance in yards could also be related to direct consumption of supplemental food resources, although we did not find much support for this hypothesis in our study. Coyotes were found to select for yards with anthropogenic food, particularly compost, in Alberta (Murray and St. Clair, 2017) and coyotes may eat more anthropogenic resources when living in an urban-wild matrix (Newsome et al., 2015). Further, over half of the stomach contents of urban red foxes in Switzerland was anthropogenic (Contesse et al., 2004). We did not find strong positive associations between canid relative abundance and supplemental food features, but we did observe some of the species occasionally eating supplemental food. For example, we observed three coyotes and three red foxes by compost, but only one of each ate the compost. In contrast, we observed eight gray foxes by compost and each individual ate the compost. Individual differences in exploitation of anthropogenic food sources could be related to a variety of factors such as personality traits (i.e., boldness) or health status. For example, Murray and St. Clair (2017) found that coyotes with sarcoptic mange (Sarcoptes scabiei) were more likely to visit compost piles than healthy coyotes. A more focused study on interspecific interactions between predators and prey (e.g., Fischer et al., 2012), as well as predator demography, activity patterns, health, and diet selection in urban ecosystems would help elucidate the influence of anthropogenic resources on predator-prey relationships.
Past research suggests that the ecological implications of supplemental feeding are nuanced. There is evidence that supplemental feeding leads to reduced animal movements (Prange et al., 2003; Gehrt, 2004; Bozek et al., 2007; Gehrt et al., 2009) and may have positive effects on wildlife survival and reproductive rates (e.g., Adams et al., 2005; Bateman and Fleming, 2012). However, feeders could also act as an ecological trap for target species (e.g., birds) due to negative interspecific interactions with non-target species, such as squirrels (e.g., Reed and Bonter, 2018). For example, the hyperabundance of gray squirrels at supplemental feeding sites could interfere with avian use of feeders (Bonnington et al., 2014b) and result in reductions in avian species diversity and abundance for species that are susceptible to nest predation by squirrels (Bonnington et al., 2014a). Further, much of the positive demographic effects are realized in synanthropic species, which could outcompete non-synathropic species, thereby reducing community evenness and biodiversity in urban areas (Shochat et al., 2010). Mammal use of supplemental feeding sites could also have disease implications (Becker and Hall, 2014; Becker et al., 2015). We show that the presence of a feature in a yard generally did not affect mammal abundance at the control site, regardless of high mammal abundance near the feature, suggesting mammal use of features in yards was highly localized. This aggregation of mammals could increase the probability of disease transmission among wildlife and from wildlife to humans (e.g., Soulsbury and White, 2015).
Conclusion
Overall, our study provides more evidence that moderately developed landscapes can contain a high diversity and abundance of mammals, sometimes higher than wild sites, which lends support to the intermediate disturbance hypothesis as an explanation for the abundance of urban wildlife. In the context of urban landscapes, a variety of factors could be considered “disturbance,” including fragmentation of habitat, increased heterogeneity in habitat types, and introduction of supplemental food and structure resources. We found a large association between the relative abundance of some mammal species and supplemental food resources, which we posit is the primary explanation for the increase in species diversity and abundance in moderately developed areas. While predator-prey dynamics also likely influence urban mammal communities, we did not find strong support for this hypothesis in our study, other than a minor effect of prey species on predator relative abundance in residential yards. We also did not find strong support for an influence of landscape-scale factors on mammal relative abundance in yards; however, there are likely many other factors across spatial and temporal scales that we did not evaluate, such as landscape patchiness or connectivity, that could contribute to our findings.
Our findings only represent data surrounding one city in the United States. The effects of backyard resources on mammal relative abundance and community dynamics could vary across urban areas with different populations or urban structure. Thus, we caution extrapolation of our results and recommend further replication of our study across other urban sites. Further, we describe and discuss the ecological implications of abundant urban wildlife, but do not discuss the social implications, which are a crucial component of urban wildlife ecology, management, and conservation. For further information regarding the potential negative and positive implications of abundant urban wildlife and wildlife provisioning, we recommend reading reviews by Soulsbury and White (2015) and Cox and Gaston (2018).
Data Availability Statement
The raw data supporting the conclusions of this article will be made available by the authors, without undue reservation, to any qualified researcher.
Ethics Statement
Ethical review and approval was not required for the animal study because we used non-invasive techniques (trail cameras) to collect data related to mammal abundance.
Author Contributions
CH analyzed the data and wrote the majority of the manuscript. AP and RK collected the data and helped develop and revise the manuscript. JM helped develop and revise the manuscript. All authors contributed to the article and approved the submitted version.
Funding
This research was funded by the National Science Foundation (Grant # 1539622).
Conflict of Interest
The authors declare that the research was conducted in the absence of any commercial or financial relationships that could be construed as a potential conflict of interest.
Acknowledgments
We would like to thank the homeowners who allowed us to sample their properties for this study. Special thanks to A. Mash, L. Gatens, A. Ungemach, E. Tanhauser, and A. Dwornik for assistance with data collection and processing.
Supplementary Material
The Supplementary Material for this article can be found online at: https://www.frontiersin.org/articles/10.3389/fevo.2020.570771/full#supplementary-material
Footnotes
References
Abrams, P. A., Menge, B. A., Mittlebach, G. G., Spiller, D. A., and Yodzis, P. (1996). “The role of indirect effects in food webs,” in Food Webs: Integration of Patterns and Dynamics, eds G. A. Polis and K. O. Winemiller (Boston, MA: Springer), 371–393.
Adams, L. W., VanDruff, L. W., and Luniak, M. (2005). “Managing urban habitats and wildlife,” in Techniques for Wildlife Investigations and Management, ed. C. E. Braun (Lawrence, KS: Allen Press), 714–739.
Bateman, P. W., and Fleming, P. A. (2012). Big city life: carnivores in urban environments. J. Zool. 287, 1–23. doi: 10.1111/j.1469-7998.2011.00887.x
Becker, D. J., and Hall, R. J. (2014). Too much of a good thing: resource provisioning alters infectious disease dynamics in wildlife. Biol. Lett. 10:20140309. doi: 10.1098/rsbl.2014.0309
Becker, D. J., Streicker, D. G., Altizer, S., and Lafferty, K. (2015). Linking anthropogenic resources to wildlife–pathogen dynamics: a review and meta-analysis. Ecol. Lett. 18, 483–495. doi: 10.1111/ele.12428
Berger, J. (2007). Fear, human shields and the redistribution of prey and predators in protected areas. Biol. Lett. 3, 620–623. doi: 10.1098/rsbl.2007.0415
Bonnington, C., Gaston, K. J., and Evans, K. L. (2014a). Relative roles of grey squirrels, supplementary feeding, and habitat in shaping urban bird assemblages. PLoS One 9:e109397. doi: 10.1371/journal.pone.0109397
Bonnington, C., Gaston, K. J., Evans, K. L., and Downs, C. (2014b). Assessing the potential for Grey Squirrels Sciurus carolinensis to compete with birds at supplementary feeding stations. Ibis 156, 220–226. doi: 10.1111/ibi.12107
Bouget, C., and Duelli, P. (2004). The effects of windthrow on forest insect communities: a literature review. Biol. Conserv. 118, 281–299. doi: 10.1016/j.biocon.2003.09.009
Boutin, S. (1990). Food supplementation experiments with terrestrial vertebrates: patterns, problems, and the future. Can. J. Zool. 68, 203–220. doi: 10.1139/z90-031
Bozek, C., Prange, S., and Gehrt, S. (2007). The influence of anthropogenic resources on multi-scale habitat selection by raccoons. Urban Ecosyst. 10, 413–425. doi: 10.1007/s11252-007-0033-8
Cannon, A. R., Chamberlain, D. E., Toms, M. P., Hatchwell, B. J., and Gaston, K. J. (2005). Trends in the use of private gardens by wild birds in Great Britain 1995-2002. J. Appl. Ecol. 42, 659–671.
Chao, A., Gotelli, N. J., Hsieh, T. C., Sander, E. L., Ma, K. H., Colwell, R. K., et al. (2014). Rarefaction and extrapolation with Hill numbers: a framework for sampling and estimation in species diversity studies. Ecol. Monogr. 84, 45–67. doi: 10.1890/13-0133.1
Connell, J. H. (1978). Diversity in tropical rain forests and coral reefs. Science 199, 1302–1310. doi: 10.1126/science.199.4335.1302
Contesse, P., Hegglin, D., Gloor, S., Bontadina, F., and Deplazes, P. (2004). The diet of urban foxes (Vulpes vulpes) and the availability of anthropogenic food in the city of Zurich, Switzerland. Mamm. Biol. 69, 81–95.
Cox, D. T. C., and Gaston, K. J. (2018). Human–nature interactions and the consequences and drivers of provisioning wildlife. Philos. T. R. Soc. B. 373:20170092. doi: 10.1098/rstb.2017.0092
Crooks, K. R., and Soulé, M. E. (1999). Mesopredator release and avifaunal extinctions in a fragmented system. Nature 400, 563–566. doi: 10.1038/23028
Daniels, G. D., and Kirkpatrick, J. B. (2006). Does variation in garden characteristics influence the conservation of birds in suburbia? Biol. Conserv. 133, 326–335.
El-Sabaawi, R. (2018). Trophic structure in a rapidly urbanizing planet. Funct. Ecol. 32, 1718–1728. doi: 10.1111/1365-2435.13114
Faeth, S. H., Warren, P. S., Shochat, E., and Marussich, W. A. (2005). Trophic dynamics in urban communities. Bioscience 55, 399–407.
Fischer, J. D., Cleeton, S. H., Lyons, T. P., and Miller, J. R. (2012). Urbanization and the predation paradox: the role of trophic dynamics in structuring vertebrate communities. Bioscience 62, 809–818. doi: 10.1525/bio.2012.62.9.6
Foley, J. A., DeFries, R., Asner, G. P., Barford, C., Bonan, G., Carpenter, S. R., et al. (2005). Global consequences of land use. Science 309, 570–574. doi: 10.1126/science.1111772
Fry, J. A., Xian, G., Jin, S. M., Dewitz, J. A., Homer, C. G., Yang, L. M., et al. (2011). Completion of the 2006 National Land Cover Database for the conterminous United States. Photogramm. Eng. Rem. Sens. 77, 858–864.
Fuller, R. A., Irvine, K. N., Devine-Wright, P., Warren, P. H., and Gaston, K. J. (2007). Psychological benefits of greenspace increase with biodiversity. Biol. Lett. 3, 390–394.
Gaston, K. J., Ávila-Jiménez, M. L., Edmondson, J. L., and Jones, J. (2013). REVIEW: managing urban ecosystems for goods and services. J. Appl. Ecol. 50, 830–840. doi: 10.1111/1365-2664.12087
Gehrt, S. D. (2004). “Ecology and management of striped skunks, raccoons, and coyotes in urban landscapes,” in Predators and People: From Conflict to Conservation, eds N. Fascione, A. Delach, and M. Smith (Washington, DC: Island Press), 81–104.
Gehrt, S. D., Anchor, C., and White, L. A. (2009). Home range and landscape use of coyotes in a metropolitan landscape: conflict or coexistence? J. Mammal. 90, 1045–1057. doi: 10.1644/08-MAMM-A-277.1
Gelman, A., Carlin, J. B., Stern, H. S., Dunson, D. B., Vehtari, A., and Rubin, D. B. (2014). Bayesian Data Analysis, 3rd Edn. Boca Raton, FL: CRC Press.
Gelman, A., and Rubin, D. B. (1992). Inference from iterative simulation using multiple sequences. Stat. Sci. 7, 457–511.
Goddard, M. A., Dougill, A. J., and Benton, T. G. (2010). Scaling up from gardens: biodiversity conservation in urban environments. Trends Ecol. Evol. 25, 90–98. doi: 10.1016/j.tree.2009.07.016
Goguen, C. B., Fritsky, R. S., and Julian, G. J. S. (2015). Effects of brush piles on small mammal abundance and survival in Central Pennsylvania. J. Fish Wildl. Manag. 6, 392–404. doi: 10.3996/022015-JFWM-012
Gorenzel, P. W., Mastrup, S. A., and Fitzhugh, E. L. (1995). Characteristics of brushpiles used by birds in Northern California. Southwest. Nat. 40, 86–93.
Grimm, N. B., Faeth, S. H., Golubiewski, N. E., Redman, C. L., Wu, J., Bai, X., et al. (2008). Global change and the ecology of cities. Science 319, 756–760. doi: 10.1126/science.1150195
Hairston, N. G., Smith, F. E., and Slobodkin, L. B. (1960). Community structure, population control, and competition. Am. Nat. 94, 421–425.
Hammer, R. B., Stewart, S. I., Winkler, R. L., Radeloff, V. C., and Voss, P. R. (2004). Characterizing dynamic spatial and temporal residential density patterns from 1940–1990 across the North Central United States. Landsc. Urban Plan. 69, 183–199. doi: 10.1016/j.landurbplan.2003.08.011
Hsieh, T. C., Ma, K. H., and Chao, A. (2020). iNEXT: iNterpolation and EXTrapolation for Species Diversity. R Package Version 2.0.20. Available online at: http://chao.stat.nthu.edu.tw/wordpress/software-download/ (accessed May 1, 2020).
Hsieh, T. C., Ma, K. H., Chao, A., and McInerny, G. (2016). iNEXT: an R package for rarefaction and extrapolation of species diversity (Hill numbers). Methods Ecol. Evol. 7, 1451–1456. doi: 10.1111/2041-210X.12613
Hughes, J., and Macdonald, D. W. (2013). A review of the interactions between free-roaming domestic dogs and wildlife. Biol. Conserv. 157, 341–351. doi: 10.1016/j.biocon.2012.07.005
Ives, C. D., Lentini, P. E., Threlfall, C. G., Ikin, K., Shanahan, D. F., Garrard, G. E., et al. (2016). Cities are hotspots for threatened species. Glob. Ecol. Biogeogr. 25, 117–126. doi: 10.1111/geb.12404
Kays, R. W., and Parsons, A. (2014). Mammals in and around suburban yards, and the attraction of chicken coops. Urban Ecosyst. 17, 691–705. doi: 10.1007/s11252-014-0347-2
Kays, R. W., Parsons, A. W., Baker, M. C., Kalies, E. L., Forrester, T., Costello, R., et al. (2017). Does hunting or hiking affect wildlife communities in protected areas? J. Appl. Ecol. 54, 242–252. doi: 10.1111/1365-2664.12700
Lenth, B. E., Knight, R. L., and Brennan, M. E. (2008). The effects of dogs on wildlife communities. Nat. Area. J. 28, 218–227.
Lepczyk, C. A., Aronson, M. F. J., Evans, K. L., Goddard, M. A., Lerman, S. B., and MacIvor, J. S. (2017). Biodiversity in the city: fundamental questions for understanding the ecology of urban green spaces for biodiversity conservation. Bioscience 67, 799–807. doi: 10.1093/biosci/bix079
Liu, X., Huang, Y., Xu, X., Li, X., Li, X., Ciais, P., et al. (2020). High-spatiotemporal-resolution mapping of global urban change from 1985 to 2015. Nat. Sustain. 3, 564–570. doi: 10.1038/s41893-020-0521-x
Loss, S. R., Will, T., and Marra, P. P. (2013). The impact of free-ranging domestic cats on wildlife of the United States. Nat. Commun. 4:1396. doi: 10.1038/ncomms2380
Lowry, H., Lill, A., and Wong, B. B. M. (2013). Behavioural responses of wildlife to urban environments. Biol. Rev. 88, 537–549. doi: 10.1111/brv.12012
Magle, S., Theobald, D., and Crooks, K. (2009). A comparison of metrics predicting landscape connectivity for a highly interactive species along an urban gradient in Colorado, USA. Landsc. Ecol. 24, 267–280. doi: 10.1007/s10980-008-9304-x
Mcdonald, R. I., Kareiva, P., and Forman, R. T. T. (2008). The implications of current and future urbanization for global protected areas and biodiversity conservation. Biol. Conserv. 141, 1695–1703. doi: 10.1016/j.biocon.2008.04.025
McKee, C. J., Stewart, K. M., Sedinger, J. S., Bush, A. P., Darby, N. W., Hughson, D. L., et al. (2015). Spatial distributions and resource selection by mule deer in an arid environment: responses to provision of water. J. Arid Environ. 122, 76–84. doi: 10.1016/j.jaridenv.2015.06.008
McKinney, M. L. (2006). Urbanization as a major cause of biotic homogenization. Biol. Conserv. 127, 247–260. doi: 10.1016/j.biocon.2005.09.005
McShea, W., Forrester, T., Costello, R., He, Z., and Kays, R. (2016). Volunteer-run cameras as distributed sensors for macrosystem mammal research. Landsc. Ecol. 31, 55–66. doi: 10.1007/s10980-015-0262-9
Murray, M. H., and St. Clair, C. C. (2017). Predictable features attract urban coyotes to residential yards. J. Wildl. Manag. 81, 593–600. doi: 10.1002/jwmg.21223
National Gardening Association (2014). Garden to Table: A 5-Year Look at Food Gardening in America. Burlington, VT: National Gardening Association.
Newsome, S. D., Garbe, H. M., Wilson, E. C., and Gehrt, S. D. (2015). Individual variation in anthropogenic resource use in an urban carnivore. Oecologia 178, 115–128. doi: 10.1007/s00442-014-3205-2
Ordeñana, M. A., Crooks, K. R., Boydston, E. E., Fisher, R. N., Lyren, L. M., Siudyla, S., et al. (2010). Effects of urbanization on carnivore species distribution and richness. J. Mammal. 91, 1322–1331. doi: 10.1644/09-MAMM-A-312.1
Parsons, A. W., Forrester, T., Baker-Whatton, M. C., McShea, W. J., Rota, C. T., Schuttler, S. G., et al. (2018). Mammal communities are larger and more diverse in moderately developed areas. eLife 7:e38012. doi: 10.7554/eLife.38012
Parsons, A. W., Rota, C. T., Forrester, T., Baker-Whatton, M. C., McShea, W. J., Schuttler, S. G., et al. (2019). Urbanization focuses carnivore activity in remaining natural habitats, increasing species interactions. J. Appl. Ecol. 56, 1894–1904. doi: 10.1111/1365-2664.13385
Prange, S., Gehrt, S. D., and Wiggers, E. P. (2003). Demographic factors contributing to high raccoon densities in urban landscapes. J. Wildl. Manag. 67, 324–333.
Prevedello, J. A., Dickman, C. R., Vieira, M. V., and Vieira, E. M. (2013). Population responses of small mammals to food supply and predators: a global meta-analysis. J. Anim. Ecol. 82, 927–936. doi: 10.1111/1365-2656.12072
R Core Development Team (2019). R: A Language and Environment for Statistical Computing. Vienna: R Foundation for Statistical Computing.
Reed, J. H., and Bonter, D. N. (2018). Supplementing non-target taxa: bird feeding alters the local distribution of mammals. Ecol. Appl. 28, 761–770. doi: 10.1002/eap.1683
Rodewald, A. D., Kearns, L. J., and Shustack, D. P. (2011). Anthropogenic resource subsidies decouple predator-prey relationships. Ecol. Appl. 21, 936–943. doi: 10.1890/10-0863.1
Shochat, E., Lerman, S. B., Anderies, J. M., Warren, P. S., Faeth, S. H., and Nilon, C. H. (2010). Invasion, competition, and biodiversity loss in Urban ecosystems. Bioscience 60, 199–208. doi: 10.1525/bio.2010.60.3.6
Soulsbury, C. D., and White, P. C. L. (2015). Human–wildlife interactions in urban areas: a review of conflicts, benefits and opportunities. Wildl. Res. 42, 541–553. doi: 10.1071/WR14229
Sperry, J. H., and Weatherhead, P. J. (2010). Ratsnakes and brush piles: intended and unintended consequences of improving habitat for wildlife? Am. Midl. Nat. 163, 311–317. doi: 10.1674/0003-0031-163.2.311
Su, Y., and Yajima, M. (2015). R2jags: Using R to Run ‘JAGS’. R package version 0.5-7. Available online at: https://CRAN.R-project.org/package=R2jags (accessed February 1, 2020).
Sullivan, T. P. (1990). Responses of red squirrel (Tamiasciurus hudsonicus) populations to supplemental food. J. Mammal. 71, 579–590. doi: 10.2307/1381797
Trent, T. T., and Rongstad, O. J. (1974). Home range and survival of cottontail rabbits in Southwestern Wisconsin. J. Wildl. Manag. 38, 459–472. doi: 10.2307/3800877
U.S. Climate Data (2020). Climate Raleigh-North Carolina. Available online at: https://www.usclimatedata.com/climate/raleigh/north-carolina/united-states/usnc0558 (accessed March 24, 2020).
U.S. Department of the Interior, U.S. Fish and Wildlife Service, U.S. Department of Commerce and U. S. Census Bureau. (2018). 2016 National Survey of Fishing, Hunting, and Wildlife-Associated Recreation. Washington, DC: U.S. Department of the Interior.
Keywords: camera trap, mammal, relative abundance, species richness, supplemental feeding
Citation: Hansen CP, Parsons AW, Kays R and Millspaugh JJ (2020) Does Use of Backyard Resources Explain the Abundance of Urban Wildlife? Front. Ecol. Evol. 8:570771. doi: 10.3389/fevo.2020.570771
Received: 08 June 2020; Accepted: 02 October 2020;
Published: 26 October 2020.
Edited by:
David Andrew Luther, George Mason University, United StatesReviewed by:
Paige Warren, University of Massachusetts Amherst, United StatesMarco Moretti, Swiss Federal Institute for Forest, Snow and Landscape Research (WSL), Switzerland
Copyright © 2020 Hansen, Parsons, Kays and Millspaugh. This is an open-access article distributed under the terms of the Creative Commons Attribution License (CC BY). The use, distribution or reproduction in other forums is permitted, provided the original author(s) and the copyright owner(s) are credited and that the original publication in this journal is cited, in accordance with accepted academic practice. No use, distribution or reproduction is permitted which does not comply with these terms.
*Correspondence: Christopher P. Hansen, Y2hyaXN0b3BoZXIzLmhhbnNlbkB1bW9udGFuYS5lZHU=