 Alexander Mielke1,2*
 Anna Preis2,3Liran Samuni2,4
 Jan F. Gogarten2,5,6,7Jack D. Lester6
 Catherine Crockford2,7†
 Roman M. Wittig2,7*†
- 1Primate Models for Behavioral Evolution Lab, University of Oxford, Oxford, United Kingdom
- 2Taï Chimpanzee Project, Center Suisse de Recherches Scientifiques en Côte d'Ivoire, Abidjan, Côte d'Ivoire
- 3Wild Chimpanzee Foundation, Cologny, Switzerland
- 4Department of Human Evolutionary Biology, Harvard University, Cambridge, MA, United States
- 5Epidemiology of Highly Pathogenic Organisms, Robert Koch Institute, Berlin, Germany
- 6Viral Evolution, Robert Koch Institute Berlin, Berlin, Germany
- 7Max-Planck-Institute for Evolutionary Anthropology, Leipzig, Germany
Predictability of social interactions can be an important measure for the social complexity of an animal group. Predictability is partially dependent on how consistent interaction patterns are over time: does the behavior on 1 day explain the behavior on another? We developed a consistency measure that serves two functions: detecting which interaction types in a dataset are so inconsistent that including them in further analyses risks introducing unexplained error; and comparatively quantifying differences in consistency within and between animal groups. We applied the consistency measure to simulated data and field data for one group of sooty mangabeys (Cercocebus atys atys) and to groups of Western chimpanzees (Pan troglodytes verus) in the Taï National Park, Côte d'Ivoire, to test its properties and compare consistency across groups. The consistency measures successfully identified interaction types whose low internal consistency would likely create analytical problems. Species-level differences in consistency were less pronounced than differences within groups: in all groups, aggression and dominance interactions were the most consistent, followed by grooming; spatial proximity at different levels was much less consistent than directed interactions. Our consistency measure can facilitate decision making of researchers wondering whether to include interaction types in their analyses or social networks and allows us to compare interaction types within and between species regarding their predictability.
Introduction
Animals living in permanent social groups must decide when and how to interact with group members, and their ability to make appropriate choices has potential fitness implications (Shettleworth, 2009). The evolution of species' cognitive apparatus is a response to selection pressures imposed by the complexity of their environment, including the social system they live in (Jolly, 1966; Humphrey, 1976; Byrne and Whiten, 1989). This hypothesis assumes that animals in more “complex” social systems must integrate more social information to out-compete others (Byrne and Whiten, 1989). However, it is unclear how to quantify social information, even though various indices have been proposed (Bergman and Beehner, 2015; Fischer et al., 2017). One way to operationalize social complexity is as the amount of information necessary to successfully predict future states within a system (Sambrook and Whiten, 1997; Flack, 2012). Measures of interaction predictability on an individual level in group-living species would facilitate examinations of factors driving evolution of complex decision-making (Dunbar and Shultz, 2010; Aureli and Schino, 2019).
Consistency of partner choice across time, i.e., repeatedly choosing to interact with the same individual in the same way, enhances the predictability of future outcomes (Silk et al., 2006; Koski et al., 2012; Kalbitz et al., 2016; Moscovice et al., 2017). For example, in steep linear dominance hierarchies, a single interaction per dyad contains enough information to predict future dyadic contests (Oliveira et al., 1998; Guillermo Paz-Y-Miño et al., 2004; Sánchez-Tójar et al., 2018). Low consistency can be the result of an unpredictable distribution of social interactions, frequent changes in relationships over time, or the presence of various mediating factors, all challenges that might necessitate an increased need for cognitive flexibility (Barrett et al., 2002). From an individual's perspective, a system is complex if it is neither random nor perfectly explained by rules (Sambrook and Whiten, 1997): an interaction type that is near-randomly distributed in the group and highly inconsistent is not informative, as individuals cannot predict future interactions. Interaction types that are extremely consistent and explained by a small number of factors do not have to be observed. Thus, complexity in consistency is found between those extremes: when rules exist that allow improved predictions, but uncertainty remains if information is incomplete (Sambrook and Whiten, 1997).
Assessing predictability is complicated by the fact that we work with incomplete data, as recording every interaction taking place in an animal group is not practicable. Many studies depend on aggregated distributions of interactions over time: we take, for example, a 1-year period and calculate individual and dyadic interaction rates (Altmann and Altmann, 1977). These distributions are used either as dependent or independent variables, to create networks, or to create relationship indices. The fundamental assumption is that the data accurately reflect what individuals were doing during the study period and that patterns are consistent; the “real” distribution of interactions is unknown (Whitehead, 2008; Kasper and Voelkl, 2009; Farine and Strandburg-Peshkin, 2015). However, if data are sparse (which they usually are, given that we study individuals in large groups using few observers), estimate errors are increased and robustness of the resulting distribution reduced (Lusseau et al., 2008; Shizuka and Farine, 2016). Working with measures that are not accurate representations of the underlying distribution can create misleading results (Davis et al., 2018). This problem is exacerbated when already sparse datasets are cut into shorter time intervals (e.g., 6-month blocks). Measurement error also impedes the use of measures using temporal auto-correlation to establish changes over time. What constitutes “enough” data can vary depending on the consistency of partner choice (Whitehead, 2008; Sánchez-Tójar et al., 2018). For many researchers, it is difficult to assess whether they have collected enough data to include an interaction type into their analyses. One of the biggest challenges to replicability in primate sociality studies currently is our lack of understanding of how measurement error influences sociality measures and subsequent results – from which point are datasets so small that results are not credible anymore? Here, we propose a shorthand for quantifying this threshold.
In the present study, we develop a consistency measure that serves two functions: (1) allowing researchers to gauge whether they have collected enough data to warrant the inclusion of an interaction type in their analyses, in a social network, or when creating relationship indices. (2) Compare predictability of interaction types within, between, and among species. Consistency should be high if individuals choose the same partners for the same interaction type independent of when they are observed, and observing an individual at one point in time allows for accurate predictions of its future behavior. Low consistency can arise if individuals show weak partner preference or preference changes over time, or if insufficient data are available.
To explore how consistency can be used to compare social groups with different structure and organization, we first use simulations of datasets with different properties. We subsequently apply the consistency measure to data from two Western chimpanzee (Pan troglodytes verus) communities and one sooty mangabey (Cercocebus atys atys) community living sympatrically in the Taï National Park, Côte d'Ivoire (Mielke et al., 2017, 2018). These species represent two well-studied, quite different primate social systems. Sooty mangabeys have philopatric females who form linear, despotic, stable matrilineal hierarchies (Range and Noë, 2002; Range, 2006; Mielke et al., 2017, 2018). All mangabey directed social interactions are expected to show high consistency, as they should be strongly influenced by stable parameters, especially kinship, dominance rank, and sex (Range and Noë, 2002). Association patterns in this species are nearly random (Mielke et al., 2020a), so we predict low consistency for spatial interaction types. Chimpanzees at Taï are similar in that they have been shown to have stable grooming, aggression, and association patterns in both sexes. However, in contrast to the mangabeys, aggression is not exclusively determined by dominance hierarchy (Wittig and Boesch, 2003), and we have previously described rank changes in both sexes in the study period (Mielke et al., 2019; Preis et al., 2019). Rank uncertainty and the variation in partner availability due to fission fusion dynamics in chimpanzees lead us to predict that chimpanzee interactions are less consistent than mangabey interactions. We developed the consistency measure with two aims: (a) to identify interaction types where data distributions are likely unreliable due to insufficient data; and (b) to draw comparisons between chimpanzees and mangabeys, and identify different interaction types within species as it relates to their consistency.
Methods
Consistency Measure
Our consistency measure is a permuted test-retest procedure: To quantify consistency in an interaction type, we organized the data by collection days. Each observation day is randomly assigned to one of two datasets of equal size (Sánchez-Tójar et al., 2018). For each of the two resulting datasets, we calculated the dyadic interaction rates per observation hour in each of the halves and calculate the non-parametric Spearman correlation between the two distributions (see Figure 1 for procedure). This allowed us to estimate how well variation in one half of the dataset predicts variation in the other half. We performed 100 iterations, with the median correlation coefficient constituting our measure of consistency for the full dataset. We opted for random distribution of days across the study period rather than comparing different coherent segments of the study because our assumption is that all datasets will be incomplete representations of the period they cover. By comparing coherent blocks, we do not address the question whether each block is internally consistent.
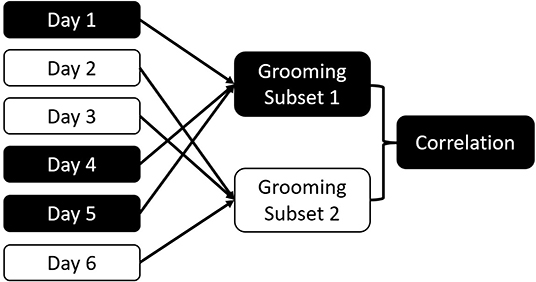
Figure 1. Schema of the consistency measure. Data are randomly divided into two subsets based on the collection day. Dyadic interactions for all dyads are aggregated for each subset. The two subsets are correlated. This process is repeated 100 times to calculate the consistency of the overall dataset for this interaction type.
The overall correlation between halves of the dataset is likely dependent on the data collection effort and community size, making it difficult to compare communities and interaction types. To mitigate this challenge, we developed a standardized version of the consistency measure (Figure 2) by repeatedly selecting subsets of the data that differ in length and the amount of data included, followed by randomly selecting a start date and duration for the period following that date. We tested the consistency for this period for each interaction type, marking how many interactions per dyad the subset contained. For example, 10 individuals form 45 dyads; if we collect 180 aggressive events, we have a mean of 4 interactions/dyad. We then collate the consistency of all datasets with the same number of interactions per dyad – e.g., we could have 100 consistency values based on datasets that contain 3 interactions per dyad, 120 based on 4 interactions per dyad, and so on. For each interaction per dyad value, we plot and report the median of the consistency values.
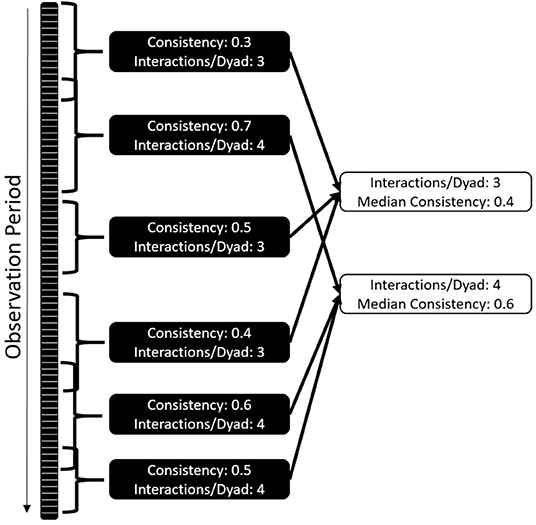
Figure 2. Standardization of consistency as a comparative measure: each dataset is randomly cut into shorter time windows of changing size and starting point. Consistency and amount of interactions per dyad are established. The median of consistencies across different interactions per dyad values are established. The comparative value is the number of interactions per dyad where the consistencies cross 0.5.
This approach allows a systematic comparison of both frequent and infrequent interaction types, i.e., datasets of different sizes. Analyses comprising differing group sizes are possible because we compare the behavior of datasets that contain the same number of interactions per dyad. As a standardized consistency measure, we report the number of interactions per dyad needed to get a median consistency value of 0.5; although this value has no strong biological justification, in simulations it was reliable in distinguishing interactions types that were consistent from those that had insufficient data or were inconsistent. This measure is largely independent of data density and community size, and produces an interpretable result: how many interactions between two group members does an individual need to observe to reliably predict future interactions? Fewer interactions per dyad and a smaller standard deviation of values indicate higher consistency in partner choice and thus higher predictability. Larger numbers of interactions per dyad and a large standard deviation indicate that interaction patterns are harder to predict. This can be the case if either the partner choice is less deterministic for the interaction type, or the choice patterns change throughout the study period.
Simulations
All described analyses were conducted in R 4.0.0 (R Development Core Team, 2020). Scripts can be found in the associated GitHub repository. We explored the impact of different group sizes, data densities, fidelity of partner choice, and changes in underlying relationships on our consistency measure using simulated datasets. We then explore whether it can be used to compare consistency across communities of different sizes. We tested whether our consistency metric is high when individuals regularly choose the same partners for the same interaction type. We also tested whether low consistency arises when individuals show weak partner preference or when preference changes over time. To test how our consistency measure performed under different conditions, and how to interpret different results, we simulated datasets with different group sizes; numbers of interactions per individual; data collection density; fidelity of partner choice; and consistency of partner choice over time, mirroring interaction data as it could be collected in different social animal species.
Specifically, we created datasets for 10, 15, and 20 individuals in a community, for one nonspecific interaction type over a simulated period of 1 year. We randomly assigned each individual between 1 and 10 interactions per day, and for each interaction the partner was chosen from a random chosen subset of group members (to simulate animal groups, in which not all group members are always physically available). To simulate different underlying probability distributions of who interacts with whom, each dyad was assigned a random likelihood to interact with each other, with three different fidelity levels: “high certainty” (each individual has strong preference for a few group members, always chosen those when they are available), “medium certainty” (each individual prefers several group members, but can also choose non-preferred partners), and “low certainty” (the likelihood of choosing any partner is relatively equal). Based on these dyadic values, one of the individuals in the “party” was selected as interaction partner. We explored three conditions concerning the consistency of individuals' choice: in the first condition, dyadic preferences remained the same throughout. In the second condition, to simulate changes in interaction patterns, all likelihoods of partner choice were reversed halfway through data collection, so dyads with a 0.95 likelihood of interacting in the first half had a 0.05 likelihood of interacting in the second half of data collection. In the third condition, partner choice was completely random, which should lead to an even distribution of interactions between all group members over the whole time.
Following this procedure, we created 108 simulated datasets (three each for every combination of number of individuals, level of fidelity, and consistency condition) that contained all interactions for all group members for each day of the data collection period. Subsequently, we simulated differences in data collection effort (Davis et al., 2018): for each day of the sampling period, one individual was chosen as the “focal” individual whose data were retained, as would be the case in most animal datasets. We assumed a 12-h observation period per focal day, to calculate interaction rates. Then we simulated that data collection took place every day, 66% of days, or every third day (33%), to test the impact of low data collection density on the consistency measure. We therefore retained 324 simulated datasets with different properties. For each of these, the proposed consistency measure—randomly selecting half of the dataset and correlating interaction rates of dyads with those of the other half, as well as repeating this procedure with subsets of the data—was carried out 100 times.
Data Collection
Behavioral data were collected in Taï National Park, Côte d'Ivoire (Wittig and Boesch, 2019) from October 2013 to July 2015 for the chimpanzees and January 2014 to September 2015 for the mangabeys, using half- and full-day continuous focal animal sampling (Altmann, 1974) for the chimpanzees, and half-day and 1-h focal animal sampling for the mangabeys. Scripts and data can be found in the associated GitHub repository. Trained observers and field assistants recorded all social interactions of adult male and female chimpanzees (above 12 years of age) in the “South” and “East” communities and adult (above 4.5 years) sooty mangabeys. This resulted in 6441h of focal observations in South community, 5668h for East community, and 2259h for the mangabey community. We included adult individuals of both sexes in all three communities for whom sufficient focal data (at least 50 social interactions observed as focal individual) were available and who were present for at least 80% of the study period (South: 5 males, 7 females; East: 5 males, 7 females; mangabeys: 6 males, 17 females).
From the behavioral data, for each dyad, we extracted the duration of grooming given, resting or foraging in <1 m distance from the partner (“body contact”: used as a continuous measure with duration in the chimpanzees and an event variable in the mangabeys), resting or foraging as nearest neighbor between 1 and 3 m distance (“proximity”), and both contact and noncontact aggressive interactions with one clear recipient (Preis et al., 2018). For the chimpanzee communities, we included food sharing (Samuni et al., 2018), which was not regularly observed in the mangabeys. We used pant grunt vocalizations in chimpanzees and feeding supplants (i.e., one individual non-aggressively replacing another at a food source) in mangabeys as additional interaction types. Mutual interactions were coded as interactions given in both directions. We treated body contact and proximity as “interaction types” with the assumption that both individuals have to show sufficient tolerance to allow the other one to remain close. Body contact and proximity were only counted if no other interaction took place within 5 min before or after to ensure independence of data points. We included grooming, contact aggression, noncontact aggression, pant grunts/supplants, and food sharing as directional variables, with the distribution of interactions given from each individual to every other. Interactions were included both when the focal was the sender and recipient. For the two spatial proximity measures, data were considered non-directional and symmetrical – dyads were therefore only represented by one row in the data table. Interaction distributions were standardized by focal observation time, with observation time calculated by adding the total observation times of A and B. Spatial proximity and food sharing in the chimpanzees were collected by a subset of observers and were standardized based on the focal observation time provided by those observers. Scripts to create the consistency measure and plots can be found in the associated repository.
Results
Simulations
We sought a consistency measure that can identify differences in fidelity of partner choice and changes in interaction preference, while being independent of group size and data collection effort. Community size did not affect the performance of the standardized consistency measure (Figure 3). Meanwhile, datasets of different data collection density followed the same trajectory, but lower data density was characterized by lower overall consistency (Figure 3). The overall consistency cannot be interpreted alone, as it is highly dependent on group size and data collection effort. This is consistent with simulations showing that social network data becomes unreliable if data density per dyad sinks below a certain level (Whitehead, 2008).
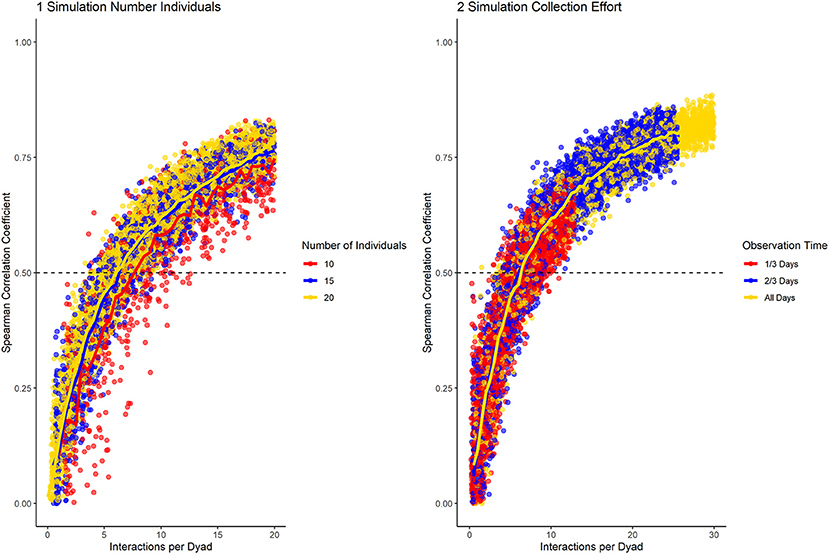
Figure 3. Results of the data simulation with varying group size (1) and data collection density (2), while having medium fidelity of partner preference and no preference changes throughout the dataset. Horizontal line marks a correlation of halves of 0.5. The number of interactions per dyad allows to compare datasets of different density and number of individuals.
To test how the fidelity of partner choice influenced the consistency measure, we present the results for the three different conditions (high, medium, low certainty) in datasets containing 20 group members, with 100% data density, and no changes in preference throughout the sampling period (Figure 4). Our results showed that the consistency measure differentiated between the conditions, using the slope at which the chosen cut-off value is reached. If partner choice shows high fidelity, a small number of interactions was sufficient to predict partner choice in half of the data with that of the other half; with increasing uncertainty, more interactions per dyad were necessary. For low certainty of partner choice, more than the number of simulated interactions would have been necessary to reach the cut-off of 0.5.
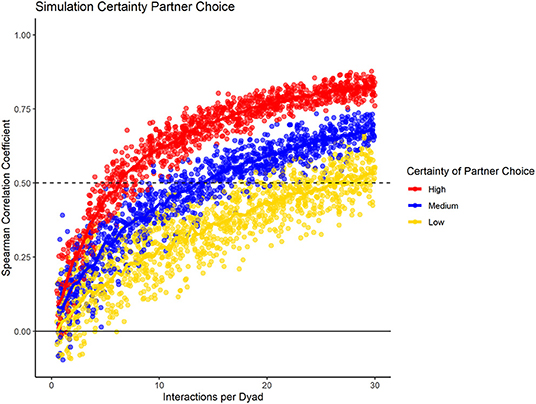
Figure 4. Data simulation of varying fidelity of partner choice, while having consistent group size, data density, and no preference changes throughout the dataset.
Last, we investigated how changes in partner preference over the study period would influence the consistency measure in a dataset with 20 individuals, with 100% data density, and high fidelity of partner choice. Here, we compare three conditions: one where no changes took place, one where the partner preference was reversed halfway through the study, and one where partner choice was randomized. Again, we found differences in the slope whereby the consistency increased with increasing data density (Figure 5). Additionally, the conditions could be differentiated by the spread of consistency values: when partner choice was consistent, selecting subsets of the same size at different points of the sampling period resulted in very similar consistency values. If partner choice changed throughout the sampling period, variation was much higher. Also, the consistency of the full dataset was smaller than that of some shorter subsets, with the highest levels for subsets that were roughly half the total size – mirroring our built-in change of interaction likelihood after half the “collection period.” As seen before, random partner choice could be identified because the consistency of the full dataset never increased above a certain threshold.
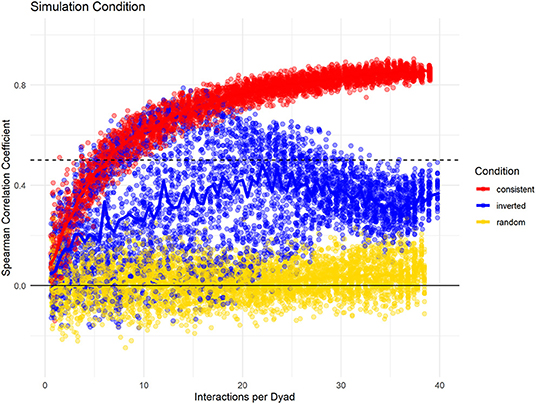
Figure 5. Data simulation changes potential changes of interaction distributions throughout the dataset while having consistent group size, data density, and fidelity of dyadic preference. “Consistent Choice” indicates no changes in preferences throughout, “Inverted Choice” indicates one reversal for all dyadic preferences, while random choice indicates that all partners were chosen with the same likelihood.
In sum, based on these simulations, the consistency measure can be used to compare the predictability of interactions. Using the entire dataset, the overall consistency was heavily influenced by the amount of interactions available per dyad, and thus does not make a good comparative measure. In our simulations, even if the underlying distribution of interactions was highly consistent, the consistency measure remained low if few data points were available per dyad, indicating that one half of the dataset was not a good predictor of the other half due to random sampling error. Thus, if the Spearman rank correlation between halves of the same dataset does not reach rs = 0.5, it is likely that not enough data have been collected to make statements about the underlying distribution of an interaction type in a population (unless that distribution is random). We therefore suggest using interaction types with an overall consistency below rs = 0.5 with care or remove them from analyses where possible, as their interpretation is unclear. For all other interactions, we propose the described standardized consistency measure, the average number of interactions per dyad necessary to reach a median consistency of rs = 0.5 as a good measure. Valuable information also arose from the spread of values of the repeated comparisons between halves of the dataset: if dyadic preference remained stable throughout, the consistency is relatively stable for subsets of the same size. However, if dyadic preference was not stable, the correlation between halves varies even for datasets of the same size.
Field Data
Mangabeys
For the mangabeys, noncontact aggression rates (3 interactions/dyad) and supplants (3 interactions/dyad) were highly consistent, as was grooming (4.5 interactions/dyad), indicating that individuals observing a subset of interactions in the community would be able to predict future interactions (Figures 6–8; Table 1). Body contact (17 interactions/dyad) was much less consistent, and proximity (being within 3 m of each other) did not reach the threshold of 0.5, despite having among the highest number of data points available for any interaction type in this study. Given the trend of the graph, proximity would probably have reached the threshold if more data had been available, but this still suggests a highly inconsistent distribution across the data collection period. For contact aggression, only a small number of cases were available, and the graph did not reach the consistency threshold. In our simulations, such low values occurred when insufficient data were available to successfully approximate the underlying distributions of interactions, even in cases where the underlying distribution was highly consistent; or when distribution of interaction was random or close to random.
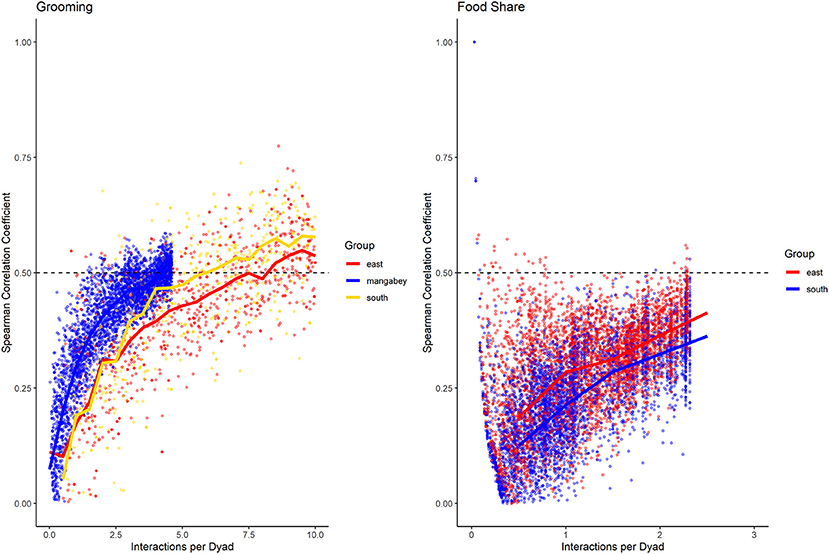
Figure 6. Spearman correlation between two halves of randomly selected subsets of the datasets for mangabeys (blue), East chimpanzee community (red) and South chimpanzee community (golden) for grooming and food sharing (chimpanzees only). The standardized consistency is marked by the number of interactions per dyad where the median of correlation coefficients exceeds r = 0.5. If that value is reached with fewer interactions per dyad, the distribution of interaction rates is more consistent. Distributions of correlation coefficients with a large spread indicate changes in interaction preference over time.
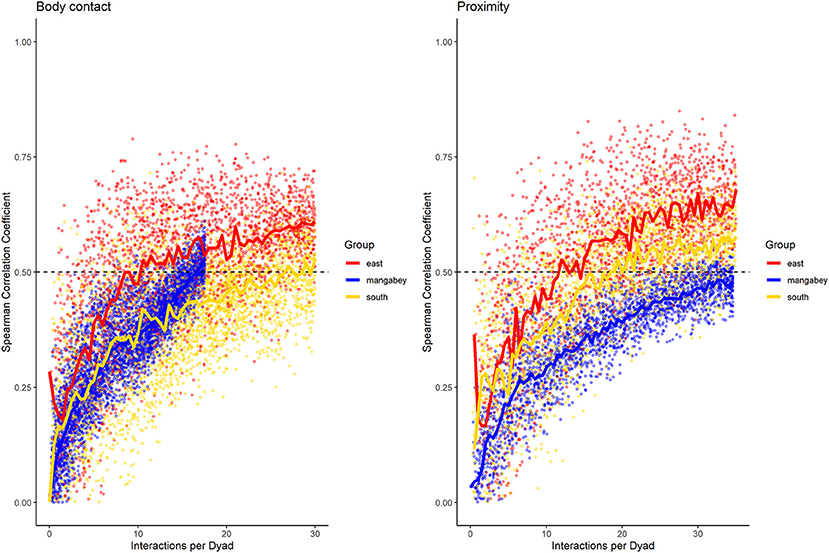
Figure 7. Spearman correlation between two halves of randomly selected subsets of the datasets for mangabeys (blue), East chimpanzee community (red) and South chimpanzee community (golden) for body contact and proximity. The standardized consistency is marked by the number of interactions per dyad where the median of correlation coefficients exceeds rs = 0.5. If that value is reached with fewer interactions per dyad, the distribution of interaction rates is more consistent. Distributions of correlation coefficients with a large spread indicate changes in interaction preference over time.
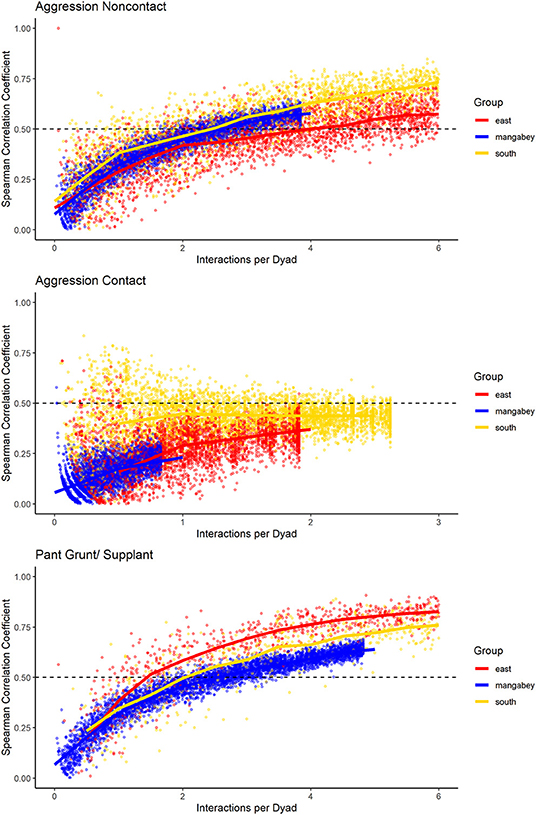
Figure 8. Spearman correlation between two halves of randomly selected subsets of the datasets for mangabeys (blue), East chimpanzee community (red) and South chimpanzee community (golden) for noncontact aggression, contact aggression, and pant grunts/supplants. The standardized consistency is marked by the number of interactions per dyad where the median of correlation coefficients exceeds rs = 0.5. If that value is reached with fewer interactions per dyad, the distribution of interaction rates is more consistent. Distributions of correlation coefficients with a large spread indicate changes in interaction preference over time.
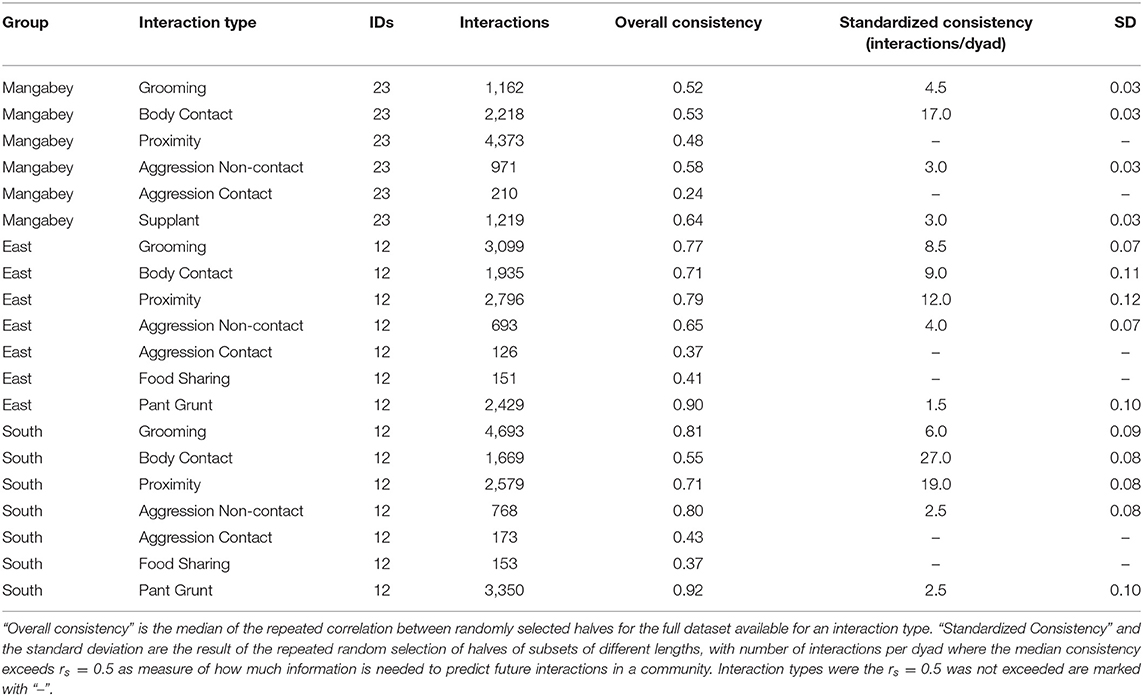
Table 1. Overview of consistency scores in chimpanzee and mangabey social interactions: datasets for each interaction type and group, and the results of the consistency measures.
Chimpanzees
As in the mangabeys, noncontact aggression rates were highly consistent in both chimpanzee communities (Table 1), more so in South (2.5 interactions/dyad) than in East (4.0 interactions/dyad). As in the mangabeys, contact aggression occurred so infrequently that no consistent representation of the distribution existed. The larger standard deviation in the chimpanzees and wider spread of the graph compared to the mangabeys might indicate changes of aggression patterns over time. Pant grunt interactions in both communities showed the most predictable patterns (East: 1.5 interactions/dyad; South: 2.5 interactions/dyad). Grooming was less consistent than in the mangabeys (East: 8.5 interactions/dyad; South: 6.0 interactions/dyad). Body contact showed considerable variation between groups, with East (9 interactions/dyad) being the most consistent, while South (27.0 interactions/dyad) being the least consistent of the three groups. Proximity (East: 12.0 interactions/dyad; South: 19.0 interactions/dyad) was more predictable than in the mangabeys. Body contact and proximity were considerably less predictable than the directed interaction types. This indicates that in all three communities, most dyads will feed and rest in proximity with a wide variety of partners, while they direct interactions at a smaller and more stable subset of group members (see Figure 9 for a summary of results).
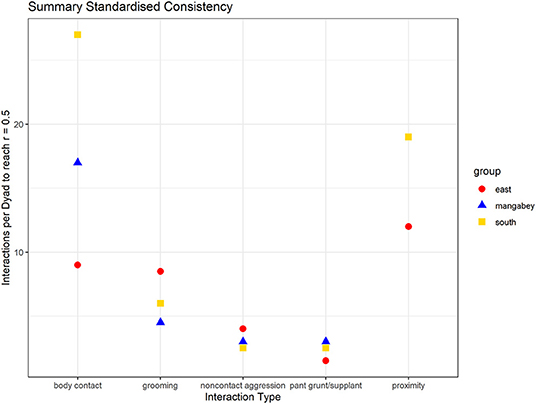
Figure 9. Summary of the mean number of interactions needed per dyad to reach correlations between halves of rs = 0.5 (mangabeys: blue triangles, East: red points, South: golden square).
Discussion
Establishing measures of predictability of social interactions between individuals is necessary to understand the complexity of a social group from the perspective of the individual (Dunbar and Shultz, 2010; Lukas and Clutton-Brock, 2018). Here, our premise was that interactions are more predictable for participants and bystanders if interaction distributions are consistent over time. Our results showed that across communities and species, interaction types vary in predictability, indicating yet again that animal lives cannot be captured using one simplistic measure of complexity: challenges differ within and between species, and we need multi-dimensional measures to quantify where “complexity” really arises.
This study introduces a consistency measure, repeatedly dividing the dataset into halves and comparing how well these predict each other, which serves two functions. Researchers can use it to find out whether they have collected sufficient data for their dataset to be internally consistent, given a community of a certain size and an interaction type with a specific diversity of partner choice (Sánchez-Tójar et al., 2018). In our sample, despite pooling 18 months of data, food sharing and contact aggression were observed at such low rates in all three communities that observing the group at a certain time point would make it impossible to predict their behavior at another time point. We do not know whether the error bars around the observed values are biological or statistical, but they can introduce unexplained uncertainty in our subsequent analyses. We generally assume that randomly selected focal follows allow us to also make statements about interaction rates on those days on which we do not observe an individual (Altmann, 1974), but this might not be the case for rare interaction types or for interaction types that are naturally almost randomly distributed (Davis et al., 2018). If the distribution of interactions in the group is not even consistent within an interaction type in a period, correlating it with other interaction types or across periods would probably produce spurious results (Whitehead, 2008).
The standardized consistency measure allowed us to identify interaction types that needed either large or small amounts of information to predict interactions on other collection days. We used the number of interactions per dyad at which the majority of subset correlations exceeds the value rs = 0.5; while the value rs = 0.5 itself is arbitrary, using it across species and interaction types allows researchers to make comparative statements, and it is high enough to not fall into random variation. We did not find generalizable species differences using our consistency measure: differences within species were much more pronounced and followed the same trends between species. Chimpanzee distributions had generally larger standard deviations, potentially indicating changes in partner choice over time. Feeding supplants and pant grunts, which are used to create hierarchies in the respective species, were highly consistent, indicating generally stable hierarchies (Sánchez-Tójar et al., 2018). Consistency of aggression distributions did not vary strongly between species. Despite being the larger community, mangabey grooming interactions were generally more predictable than chimpanzee interaction patterns. Directed interactions (grooming, noncontact aggression, pant grunts/supplants) were consistent despite the inclusion of 18 months of data per community, indicating that most dyads interacted at relatively constant rates throughout the study period. Body contact and proximity showed lower consistency than directed interactions, most likely because a certain level of tolerance in foraging and resting extends to most group members, adding random noise that is not present in directed interactions. For body contact, no clear species-specific pattern emerged, but proximity (3 m distance) was much less consistent in mangabeys than in chimpanzees, a result in line with recent findings regarding high levels of randomness in sooty mangabey spatial association patterns (Mielke et al., 2020a). Just like rare interaction types, common but highly inconsistent interaction types could add noise to social relationship indices or when comparing network overlap.
While many animal species are studied in great detail, and vast amounts of long-term data are available, it is surprisingly difficult to convey the structure of social interactions across sites and species. Our consistency measure may help by providing a standardized way to convey the flexibility in interaction patterns over time and identify interaction types that likely differ in complexity between species. Further, many researchers use multilevel social network analysis and create relationship indices including different interaction types, unsure whether all of them will be equally reliable. This consistency measure, like similar efforts for hierarchies (Sánchez-Tójar et al., 2018), can be a useful tool to make these decisions while conveying important information about the study species. Importantly, these results further cement that researchers need to report sample sizes not only of their outcome variable, but also for interaction types that might have gone into creating relationship indices or network measures, because this gives readers the ability to judge the error associated with this predictor variable or network. To assess changes in relationships over time, there has been a trend to cut datasets into smaller subsets and then compare network overlap between these, assuming that the data in each are sufficient to depict the underlying distribution in the community. With our consistency measure, seasonality and change could be established if smaller subsets would show higher consistency than larger subsets, as random subsets retained consistent time intervals. This was not the case for any interaction type, even though some interaction types showed large variation, an indication that consistency is high during some times but not others.
Predictability is an important aspect of social complexity: an individual living in a system where all future social interactions are largely pre-defined by a few re-occurring factors needs little information to make decisions about its own behavior (Sambrook and Whiten, 1997; Flack, 2012). Our consistency measure captures one aspect of predictability: if individuals distribute their social interactions the same across time, it is likely easy for group members to predict future social choices. This measure can easily be combined with other standardized approaches to social complexity and should mirror patterns (Thierry et al., 2008; Fischer et al., 2017). We did not find one consistent pattern of consistency difference between sooty mangabeys and chimpanzees; rather, variation within species was larger than between species, and each species showed higher consistency in some of the interaction types. One-dimensional measures of social complexity, such as group size, are thus probably insufficient to capture species differences in social complexity, as “complexity” probably does not affects all aspects of life in a species uniformly: different species face different challenges, creating uncertainty in different areas of their social lives. Our consistency measure can detect which areas these are. Dyadic distributions of aggression and dominance interactions were highly predictable across groups. Spatial proximity was the least predictable aspect for all three groups, but as we have reported before, mangabey association beyond body contact contains large uncertainty (Mielke et al., 2020a). Grooming interactions were less predictable in chimpanzees, indicating more varied grooming partner choice or changes over time. Many challenges are shared between primate species, especially regarding dyadic interaction patterns: It is therefore worth in a next step to consider the challenges arising from structuring interactions as sequences in time and the uncertainty arising when third parties influence decision making (Wittig et al., 2014). Our consistency measure offers a valuable piece in the puzzle of social complexity across animal species.
Permission to Carry Out Fieldwork
Permissions to conduct the research were granted by the Ministries of Research and Environment of Ivory Coast (379/MESRS/GGRSIT/tm) and Office Ivorien des Parcs et Reserves.
Data Availability Statement
The datasets presented in this study can be found in online repositories. The names of the repository/repositories and accession number(s) can be found below: https://github.com/AlexMielke1988/Mielke-et-al-Consistency.
Ethics Statement
The animal study was reviewed and approved by Ethikrat der Max-Planck-Gesellschaft (4.08.2014).
Author Contributions
AM, CC, and RW designed the study. AM, AP, LS, and JG provided data. JL provided genetic analyses. AM performed simulations and statistical analyses. AM, CC, and RW wrote the paper with input from all authors. All authors contributed to the article and approved the submitted version.
Funding
AM, AP, LS, CC, and RW were supported by the Max Planck Society; AM was supported by the Wenner Gren Foundation (Grant Number 9095) and the British Academy Newton International Fellowship; AP was supported by the Leakey Foundation; LS was supported by the Minerva Foundation; JG was supported by an NSF Graduate Research Fellowship (DGE-1142336), the Canadian Institutes of Health Research's Strategic Training Initiative in Health Research's Systems Biology Training Program, an NSERC Vanier Canada Graduate Scholarship (CGS), and a long-term Research Grant from the German Academic Exchange Service (DAAD-91525837-57048249). CC was supported by the European Research Council (ERC) under the European Union's Horizon 2020 research and innovation programme (grant agreement no. 679787). RW was supported by DFG Researcher Unit (FOR 2136) Sociality and Health in Primates (WI 2637/3-1). Research at the Taï Chimpanzee Project has been funded by the Max Planck Society since 1997.
Conflict of Interest
The authors declare that the research was conducted in the absence of any commercial or financial relationships that could be construed as a potential conflict of interest.
Acknowledgments
This work has been made available previously as a preprint: Mielke et al. (2020b). We thank the Ivorian Ministry of Environment and Forests and Ministry of Higher Education and Scientific Research and the Office Ivoirien des Parcs et Reserves of Côte d'Ivoire. We thank Simon Kannieu, Daniel Bouin, Gnimion Florent, Fabrice Blé, Florent Goulei, Apollinaire Gnahe Gjirian, Fredy Oulai Yehanon and the team of the TCP for field work support and data collection.
References
Altmann, J. (1974). Observational study of behavior: sampling methods. Behaviour 49, 227–266. doi: 10.1163/156853974X00534
Altmann, S. A., and Altmann, J. (1977). On the analysis of rates of behaviour. Anim. Behav. 25, 364–372. doi: 10.1016/0003-3472(77)90011-2
Aureli, F., and Schino, G. (2019). Social complexity from within: how individuals experience the structure and organization of their groups. Behav. Ecol. Sociobiol. 73, 1–13. doi: 10.1007/s00265-018-2604-5
Barrett, L., Gaynor, D., and Henzi, S. P. P. (2002). A dynamic interaction between aggression and grooming reciprocity among female chacma baboons. Anim. Behav. 63, 1047–1053. doi: 10.1006/anbe.2002.3008
Bergman, T. J., and Beehner, J. C. (2015). Measuring social complexity. Anim. Behav. 103, 203–209. doi: 10.1016/j.anbehav.2015.02.018
Byrne, R. W., and Whiten, A. (1989). Machiavellian Intelligence: Social Expertise and the Evolution of Intellect in Monkeys, Apes, and Humans. Oxford: Oxford University Press.
Davis, G. H., Crofoot, M. C., and Farine, D. R. (2018). Estimating the robustness and uncertainty of animal social networks using different observational methods. Anim. Behav. 141, 29–44. doi: 10.1016/j.anbehav.2018.04.012
Dunbar, R. I. M., and Shultz, S. (2010). Bondedness and sociality. Behaviour 147, 775–803. doi: 10.1163/000579510X501151
Farine, D. R., and Strandburg-Peshkin, A. (2015). Estimating uncertainty and reliability of social network data using Bayesian inference. R. Soc. Open Sci. 2:150367. doi: 10.1098/rsos.150367
Fischer, J., Farnworth, M. S., Sennhenn-Reulen, H., and Hammerschmidt, K. (2017). Quantifying social complexity. Anim. Behav. 130, 57–66. doi: 10.1016/j.anbehav.2017.06.003
Flack, J. C. (2012). Multiple time-scales and the developmental dynamics of social systems. Philos. Trans. R. Soc. B Biol. Sci. 367, 1802–1810. doi: 10.1098/rstb.2011.0214
Guillermo Paz-Y-Miño, C., Bond, A. B., Kamil, A. C., and Balda, R. P. (2004). Pinyon jays use transitive inference to predict social dominance. Nature 430, 778–781. doi: 10.1038/nature02723
Humphrey, N. K. (1976). “The social function of intellect,” in Growing Points in Ethology (Cambridge: Cambridge University Press), 303–317.
Jolly, A. (1966). Lemur social behavior and primate intelligence. Science 153, 501–506. doi: 10.1126/science.153.3735.501
Kalbitz, J., Ostner, J., and Schülke, O. (2016). Strong, equitable and long-term social bonds in the dispersing sex in Assamese macaques. Anim. Behav. 113, 13–22. doi: 10.1016/j.anbehav.2015.11.005
Kasper, C., and Voelkl, B. (2009). A social network analysis of primate groups. Primates 50, 343–356. doi: 10.1007/s10329-009-0153-2
Koski, S. E., de Vries, H., van de Kraats, A., and Sterck, E. H. M. (2012). Stability and change of social relationship quality in captive chimpanzees (Pan troglodytes). Int. J. Primatol. 33, 905–921. doi: 10.1007/s10764-012-9623-2
Lukas, D., and Clutton-Brock, T. (2018). Social complexity and kinship in animal societies. Ecol. Lett. 21, 1129–1134. doi: 10.1111/ele.13079
Lusseau, D., Whitehead, H., and Gero, S. (2008). Incorporating uncertainty into the study of animal social networks. Anim. Behav. 75, 1809–1815. doi: 10.1016/j.anbehav.2007.10.029
Mielke, A., Crockford, C., and Wittig, R. (2019). “Rank changes in female chimpanzees in Taï National Park,” in The Chimpanzees of the Taï Forest, eds C. Boesch and R. M. Wittig (Cambridge: Cambridge University Press), 290–300.
Mielke, A., Crockford, C., and Wittig, R. M. (2020a). Predictability and variability of association patterns in sooty mangabeys. Behav. Ecol. Sociobiol. 74, 1–13. doi: 10.1007/s00265-020-2829-y
Mielke, A., Preis, A., Samuni, L., Gogarten, J. F., Wittig, R. M., and Crockford, C. (2018). Flexible decision-making in grooming partner choice in sooty mangabeys and chimpanzees. R. Soc. Open Sci. 5:172143. doi: 10.1098/rsos.172143
Mielke, A., Preis, A., Samuni, L., Gogarten, J., Lester, J., Crockford, C., et al. (2020b). Consistency of social interactions in sooty mangabeys and chimpanzees. bioRxiv [Preprint]. doi: 10.1101/2020.07.10.196949
Mielke, A., Samuni, L., Preis, A., Gogarten, J. F., Crockford, C., and Wittig, R. M. (2017). Bystanders intervene to impede grooming in western chimpanzees and sooty mangabeys. R. Soc. Open Sci. 4:171296. doi: 10.1098/rsos.171296
Moscovice, L. R., Douglas, P. H., Martinez-Iñigo, L., Surbeck, M., Vigilant, L., and Hohmann, G. (2017). Stable and fluctuating social preferences and implications for cooperation among female bonobos at LuiKotale, Salonga National Park, DRC. Am. J. Phys. Anthropol. 163, 158–172. doi: 10.1002/ajpa.23197
Oliveira, R. F., McGregor, P. K., and Latruffe, C. (1998). Know thine enemy: fighting fish gather information from observing conspecific interactions. Proc. R. Soc. B Biol. Sci. 265, 1045–1049. doi: 10.1098/rspb.1998.0397
Preis, A., Samuni, L., Deschner, T., Crockford, C., and Wittig, R. M. (2019). Urinary cortisol, aggression, dominance and competition in wild, West African male chimpanzees. Front. Ecol. Evol. 7:107. doi: 10.3389/fevo.2019.00107
Preis, A., Samuni, L., Mielke, A., Deschner, T., Crockford, C., and Wittig, R. M. (2018). Urinary oxytocin levels in relation to post-conflict affiliations in wild male chimpanzees (Pan troglodytes verus). Horm. Behav. 105, 28–40. doi: 10.1016/j.yhbeh.2018.07.009
R Development Core Team, and R Core Team (2020). R: A Language and Environment for Statistical Computing. R Found. Stat. Comput. Vienna: R Development Core Team, and R Core Team.
Range, F. (2006). Social behavior of free-ranging juvenile sooty mangabeys (Cercocebus torquatus atys). Behav. Ecol. Sociobiol. 59, 511–520. doi: 10.1007/s00265-005-0076-x
Range, F., and Noë, R. (2002). Familiarity and dominance relations among female sooty mangabeys in the Taï National Park. Am. J. Primatol. 56, 137–153. doi: 10.1002/ajp.1070
Sambrook, T., and Whiten, A. (1997). On the nature of complexity in cognitive and behavioral science. Theory Psychol. 7, 191–213. doi: 10.1177/0959354397072004
Samuni, L., Preis, A., Mielke, A., Deschner, T., Wittig, R. M., and Crockford, C. (2018). Social bonds facilitate cooperative resource sharing in wild chimpanzees. Proc. R. Soc. B Biol. Sci. 285:20181643. doi: 10.1098/rspb.2018.1643
Sánchez-Tójar, A., Schroeder, J., and Farine, D. R. (2018). A practical guide for inferring reliable dominance hierarchies and estimating their uncertainty. J. Anim. Ecol. 87, 594–608. doi: 10.1111/1365-2656.12776
Shizuka, D., and Farine, D. R. (2016). Measuring the robustness of network community structure using assortativity. Anim. Behav. 112, 237–246. doi: 10.1016/j.anbehav.2015.12.007
Silk, J. B., Alberts, S. C., and Altmann, J. (2006). Social relationships among adult female baboons (Papio cynocephalus) II. Variation in the quality and stability of social bonds. Behav. Ecol. Sociobiol. 61, 197–204. doi: 10.1007/s00265-006-0250-9
Thierry, B., Aureli, F., Nunn, C. L., Petit, O., Abegg, C., and de Waal, F. B. M. (2008). A comparative study of conflict resolution in macaques: insights into the nature of trait covariation. Anim. Behav. 75, 847–860. doi: 10.1016/j.anbehav.2007.07.006
Whitehead, H. (2008). Precision and power in the analysis of social structure using associations. Anim. Behav. 75, 1093–1099. doi: 10.1016/j.anbehav.2007.08.022
Wittig, R. M., and Boesch, C. (2003). “Decision-making” in conflicts of wild chimpanzees (Pan troglodytes): an extension of the relational model. Behav. Ecol. Sociobiol. 54, 491–504. doi: 10.1007/s00265-003-0654-8
Wittig, R. M., and Boesch, C. (2019). “Observation protocol and long-term data collection in Taï,” in The Chimpanzees of the Taï Forest, eds C. Boesch and R. M. Wittig (Cambridge: Cambridge University Press), 44–57.
Keywords: chimpanzee, sooty mangabey, social complexity, sociality, consistency, replicability
Citation: Mielke A, Preis A, Samuni L, Gogarten JF, Lester JD, Crockford C and Wittig RM (2021) Consistency of Social Interactions in Sooty Mangabeys and Chimpanzees. Front. Ecol. Evol. 8:603677. doi: 10.3389/fevo.2020.603677
Received: 07 September 2020; Accepted: 28 December 2020;
Published: 22 January 2021.
Edited by:
Heikki Helanterä, University of Oulu, FinlandReviewed by:
Sonja Elena Koski, University of Helsinki, FinlandTom Langen, Clarkson University, United States
Copyright © 2021 Mielke, Preis, Samuni, Gogarten, Lester, Crockford and Wittig. This is an open-access article distributed under the terms of the Creative Commons Attribution License (CC BY). The use, distribution or reproduction in other forums is permitted, provided the original author(s) and the copyright owner(s) are credited and that the original publication in this journal is cited, in accordance with accepted academic practice. No use, distribution or reproduction is permitted which does not comply with these terms.
*Correspondence: Alexander Mielke, bWllbGtlLmFsZXhhbmRAZ21haWwuY29t; Roman M. Wittig, d2l0dGlnQGV2YS5tcGcuZGU=
†These authors have contributed equally to this work